Embed Size (px)
Citation preview

______________________________________________________________________________________
Meyers, Nick. 2010. Using GIS to Identify Suitable Areas for Smart Growth and Transit Oriented
Development (TOD) for Specific Areas within the City of Minneapolis, Minnesota. Volume 12, Papers in
Resource Analysis. 20 pp. Saint Mary‟s University of Minnesota Central Services Press. Winona, MN.
Retrieved (date) from http://www.gis.smumn.edu
Using GIS to Identify Suitable Areas for Smart Growth and Transit Oriented
Development (TOD) for Specific Areas within the City of Minneapolis, Minnesota.
Nick Meyers
Department of Resource Analysis, Saint Mary’s University of Minnesota, Winona MN
55987
Keywords: GIS, Transit Oriented Development (TOD), Smart Growth, Mass Transit,
Carsharing, Alternative Forms of Transportation, Land Use, Minneapolis, Model Builder,
New Urbanism.
Abstract
Renewed interest in America‟s cities and investment in transit has lead to the
development of new transit oriented developments (TODs) and Smart Growth
developments being built all across the country (Belzer and Gerald, 2002). Identifying
and assembling large tracts of land that satisfy all the conditions for successful transit
oriented development can be difficult (Boarnet and Compin, 1999). Advocates claim that
communities benefit from TODs that provide compact development, decrease automobile
dependency, add retail opportunities, and improve quality of life (Tumlin and Millard-
ball, 2003). It has also been shown that making the connection between land use and
transit choices such as building light rail transit (LRT) can be used as a tool to revitalize
neighborhoods, end cycles of poverty and lower crime rates (Havens, 2010). Geographic
Information Systems (GIS) are a powerful tool that can be used to organize, sort, and
analyze spatial data. GIS can be used to create models that reflect an area‟s propensity to
sustain TODs and other higher density Smart Growth developments. GIS and Model
Builder were used in this study to create models to identify areas within the City of
Minneapolis most suitable for development of Smart Growth and TODs, and establish a
set of criteria for ranking suitability: Land Use, Community Features, and Transit.
Introduction
Smart Growth is defined by the Smart
Growth Network as "anti-sprawl
development that is environmentally,
fiscally, and economically smart and
includes land-use planning, and mixed
use development" (Smart Growth
Network, 2009). A general consensus
for transit oriented development would
be mixed use developments that are
pedestrian friendly with convenient
transit service in a close proximity
(Boarnet and Compin, 1999). New
TODs and Smart Growth developments
are being built all across the country due
to a number of trends occurring in recent
years that have increased the popularity
of TODs and urban living: revival of
America‟s downtown areas, continued
growth and expanding maturity of
America‟s suburbs, and the renewed
interest and investment in transit (Belzer
and Gerald, 2002).
Multimodal transportation
choices are an important element of
2
TODs and Smart Growth development.
Light rail transit (LRT) can be one of
those options and is seen as more than a
way to just move people. According to
Robert Cervero, it has been used as a
tool to revitalize neighborhoods, end
cycles of poverty and lower crime rates
(Havens, 2010).
Cities and regions are developing
policies to help promote this renewed
interest in Smart Growth development
and TODs by understanding the
connection between land use and transit
options in order to alleviate problems
associated with rampant, unplanned
development (Renne, 2005). Advocates
claim that communities benefit from
TODs because they provide compact
development, decreasing auto
dependency, adding retail opportunities
and improving quality of life (Tumlin
and Millard-Ball, 2003). Policies and
restructured zoning ordinances can help
to steer development away from
dependency on automobiles and toward
Smart Growth (Handy, 2005).
Purpose of Study
In 2008, the Minnesota state legislature
authorized the seven core counties in the
Minneapolis-St. Paul Metropolitan Area
(Anoka, Carver, Dakota, Hennepin,
Ramsey, Scott, Washington) to levy an
additional ¼ cent sales tax to fund
improvements to the transit system,
including light rail, commuter rail and
bus rapid transit. Five of the core seven
counties authorized the new tax: Anoka,
Dakota, Hennepin, Ramsey, and
Washington. The additional tax in these
five counties brought in $87 million in
2009 (Olson, 2010).
The renewed interest in urban
living and a new funding stream for
transit make this an opportune time to
invest in Smart Growth and TODs. It
has been shown that a connection
between land use planning and transit
investment can be vital to the success of
a transit system (Handy, 2005).
Residents of transit-based housing are as
much as five times more likely to
commute to work using rail than their
counterparts (Boarnet and Compin,
1999). Investment in transit and TODs
will assist with attracting to cities the
young and educated people aged 25 to
34, who will be essential to the
wellbeing of metropolitan areas in the
future (Cortright and Coletta, n.d.).
It can be difficult to identify and
assemble large tracts of land that satisfy
all the conditions for successful transit
oriented development (Boarnet and
Compin, 1999). Geographic Information
Systems (GIS) are a powerful tool that
enables spatial data to be easily
organized and analyzed, creating models
that reflect an area‟s propensity to
sustain TODs and other higher density
Smart Growth developments. The study
utilized GIS and Model Builder models
to identify suitable locations for Smart
Growth and transit oriented
developments within the City of
Minneapolis.
History
Minneapolis is the largest city in
Minnesota and is part of the Twin Cities
(Minneapolis-St. Paul-Bloomington,
MN-WI Metropolitan statistical area),
the 16th
largest metropolitan area in the
country with a population of 3,175,041
(US Census Bureau, 2007). The
Metropolitan Council, Regional
Planning Organization for Minneapolis-
St. Paul, estimated the City‟s population
at 390,131 in 2009 (Metropolitan
Council, 2009).

3
Minneapolis is the primary
business center between Chicago and
Seattle and was once the flour milling
capital of the world and a major hub for
timber. Today, the city and surrounding
metropolitan area house corporate
headquarters for a wide variety of
companies, from banking and
investment firms to retailing giants to
global advertising agencies (Emporis,
2010). The largest private company in
the United States, Cargill, is
headquartered in the Twin Cities (Ray,
2009) as well as 18 Fortune 500
companies, five of which are located in
Minneapolis proper (Fortune Magazine,
2009). Minneapolis is also home to the
main campus of the University of
Minnesota, the fourth largest university
campus in the United States, with 51,140
students in 2008–2009 (National Center
for Education Statistics, U.S.
Department of Education, 2008-2009).
In 2000, Minneapolis had the
second highest population density for
any city over 100,000 in the Midwest,
below Chicago, at 6,970 people per
square mile (Demographia, 2005).
Participation in alternate modes of
transportation is prevalent in
Minneapolis where in 2007 almost 40
percent of residents traveled to work
without driving alone. During the same
year bicycle commuting in the City of
Minneapolis was second highest in the
United States with 3.8 percent of
commuters using cycling as their
primary mode of transportation; this was
just below top-ranked Portland, which
held a 3.9 percent share (Transit for
Livable Communities, 2010).
City of Minneapolis Objectives
The Minneapolis Plan for Sustainable
Growth (City of Minneapolis, 2009) is
the visioning document for the City that
guides how growth and development
should occur within the City. It is a tool
used to coordinate development in a
sustainable manner to improve the
quality of life for everyone. The plan
deals with the following areas: land use,
transportation, housing, economic
development, public services and
facilities, environmental, open space and
parks, heritage preservation, arts and
culture and urban design in the City. A
considerable amount of public
knowledge and work went into this plan
that provides great insight into the future
development for the City of
Minneapolis. This work and knowledge
about the City was valuable to the study,
especially the Land Use Chapter which
had significant importance in this study
by identifying five designated areas for
development: Commercial Corridors,
Commercial Nodes, Industrial Growth
Areas, Activity Centers, and Growth
Areas. This provided an understanding
from the City‟s perspective of areas most
likely to incur future development as
well as higher density mixed-use
development.
Methods
This study classified lands based on their
suitability to support TODs and medium
to high density Smart Growth
development within the City of
Minneapolis. The results of this analysis
will be useful for city planners, policy
makers, and real estate developers by
providing an understanding of locations
suitable for these styles of development.
Methodology
This study utilized 21 different feature
classes that were each assigned a
4
numeric value corresponding to their
level of influence on TOD and Smart
Growth development. For those feature
classes that were not polygons, but were
either point or polyline features, they
had to be buffered a distance that ranged
from one-eighth of a mile to one-half a
mile with respect to their influence on
surrounding land.
In ArcMap the feature classes
were organized and separated into three
unique submodels using Model Builder:
Land Use, Community Features, and
Transit. The models produced three
separate feature classes that identified
lands within the City of Minneapolis that
had the highest likelihood for success
with regard to their respective model. A
final model was built in Model Builder
to combine these three feature classes
into one final feature class that identified
lands most suitable for Smart Growth
and TODs.
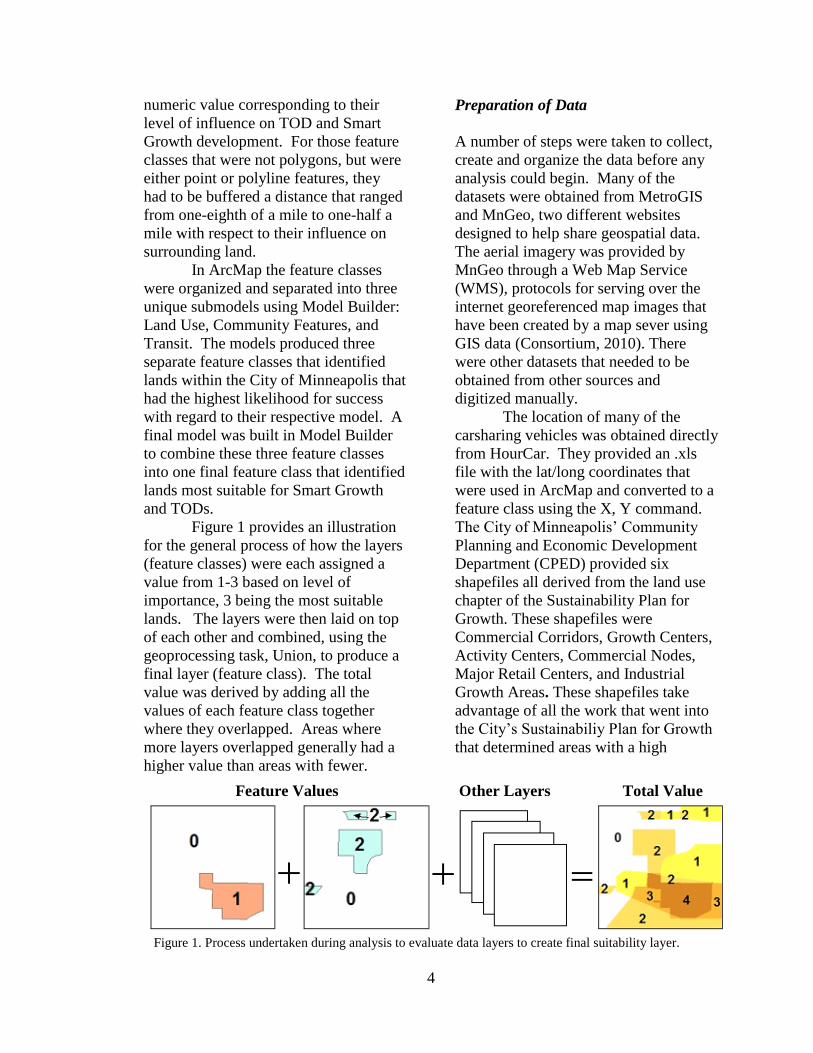
Figure 1 provides an illustration
for the general process of how the layers
(feature classes) were each assigned a
value from 1-3 based on level of
importance, 3 being the most suitable
lands. The layers were then laid on top
of each other and combined, using the
geoprocessing task, Union, to produce a
final layer (feature class). The total
value was derived by adding all the
values of each feature class together
where they overlapped. Areas where
more layers overlapped generally had a
higher value than areas with fewer.
Preparation of Data
A number of steps were taken to collect,
create and organize the data before any
analysis could begin. Many of the
datasets were obtained from MetroGIS
and MnGeo, two different websites
designed to help share geospatial data.
The aerial imagery was provided by
MnGeo through a Web Map Service
(WMS), protocols for serving over the
internet georeferenced map images that
have been created by a map sever using
GIS data (Consortium, 2010). There
were other datasets that needed to be
obtained from other sources and
digitized manually.
The location of many of the
carsharing vehicles was obtained directly
from HourCar. They provided an .xls
file with the lat/long coordinates that
were used in ArcMap and converted to a
feature class using the X, Y command.
The City of Minneapolis‟ Community
Planning and Economic Development
Department (CPED) provided six
shapefiles all derived from the land use
chapter of the Sustainability Plan for
Growth. These shapefiles were
Commercial Corridors, Growth Centers,
Activity Centers, Commercial Nodes,
Major Retail Centers, and Industrial
Growth Areas. These shapefiles take
advantage of all the work that went into
the City‟s Sustainabiliy Plan for Growth
that determined areas with a high
Feature Values Other Layers Total Value
Figure 1. Process undertaken during analysis to evaluate data layers to create final suitability layer.

5
likelihood of where future growth will
occur and where high intensity uses
should develop.
In order to effectively use all the
shapefiles provided by the City of
Minneapolis in this study, two out of the
six needed to be digitized. The
Commercial Corridors and Growth
Areas were polyline and point features,
respectively. These two shapefiles were
used in coordination with aerial imagery
obtained from the WMS Service
provided by MnGEO to manually
digitize the polygon boundaries. It was
decided that digitizing the polygon for
these two datasets would provide a
representation better suited for the study
rather than creating a generic buffer
around all the features. The advantage
of digitizing was that items such as
highways, rail yards, parks, rivers or
lakes could be excluded from the
polygon because these were areas that
should not be identified as suitable land
uses for development. The four
remaining shapefiles were already
polygon features and were just converted
to feature classes and ready to use.
The last step in preparation was
to clip any data that went beyond the
boundary of the City of Minneapolis.
Because the data came from numerous
sources there were different extents of
data: City, County, Region, and State. It
was found to be easier to sort the data
when it covered only the area within the
City of Minneapolis.
Organization of Data
All data in this study was stored and
managed in ESRI‟s File Geodatabase
format. ESRI states that this “offers
structural, performance, and data
management advantages over personal
geodatabases and shapefiles” (ESRI,
2009). The main advantages for use in
this study were ease of data migration
and storage and more optimal
performance with large files. Within the
File Geodatabase there were four feature
datasets, one for each submodel and one
for all the feature classes created during
the analysis of the final model.
Evaluation of Data for Model Builder
As mentioned previously, all data layers
were given a numeric value that
correlated with their influence on
making lands suitable for desired
development. Feature classes that were
either point or polyline also were
buffered a specific distance
corresponding to their influence on
surrounding land, values ranging from
one-eighth of a mile to one-half a mile.
A great deal of thought and research
went into devising the numeric values
assigned to feature classes and the
distance of buffers. Information from
numerous articles were identified in the
literature review (Metropolitan Council,
2006, Basile Baumann Prost and
Associates, 2007, Canepa, 2007, ) that
provided insight into what land uses,
transportation infrastructure, and
community related features were
catalysts for TODs and/or medium to
high density Smart Growth
development. HourCar, the nonprofit
carsharing company in Minneapolis and
St. Paul, said that most of its members
were located within one-half mile from
vehicles, so this buffer size was used for
their vehicles as well as ZipCar‟s
vehicles. The Minneapolis Plan for
Sustainable Growth (City of
Minneapolis, 2009) also provided insight
and knowledge about the community
and what areas would be ideal locations
within the city for development.
6
Radius distances varied between
researchers because some provided
numeric distances while others provided
walking distance in time. A simple
calculation was needed to compare these
two methods of measurement. The
average walking speed according to a
study by TransSafety, Inc. states that it
can vary between 2.80 miles per hour
and 3.0875 miles per hour depending on
age (TranSafety, Inc, 1997). The study
determined that 2 miles per hour would
be suitable for the formula and would
provide sufficient time for waiting for
traffic, signals or other obstacles.
(2mph * Walking Time (minutes) / 60
minutes = X Miles)
An example of determining the radius
distance in miles for a 10 minute walk
would be:
2 mph * 10 minutes / 60 minutes = 1/3
Mile
Model Builder
Model Builder is an application created
by ESRI that works with ArcMap and
allows a user to create, edit, and manage
models. It is scalable and easily
adjustable, which made it an ideal tool
during this study. It works by being able
to organize both feature classes and
geoprocessing tasks in a diagram that is
easy to follow and understand, and it
provides great reference for future
studies. There were a total of four
models built with Model Builder in this
study, one for each submodel and one
for the final model.
The models used numerous
geoprocessing tools from the suite of
tools in ArcGIS toolbox: merge, select,
intersect, buffer, delete field, add field,
calculate field, union, clip, and dissolve.
Most of the geoprocessing tasks
preceded use of the union tool, which
provided a way to sum all the values for
each of the feature classes together and
obtain the final suitability value for each
submodel. After the union was
performed in each submodel the new
feature classes were dissolved based on
the suitability value. This created a
feature class with the number of records
equal to the number of unique suitability
values for each particular feature class.
These new feature classes were then
clipped to the City of Minneapolis, so
that the extent of the feature classes
would be within the boundary of the
City. A similar process was performed
in the final Model Builder model to
combine all three submodels using the
union tool in ArcToolbox to obtain a
feature class that summed the suitability
values from the submodels into the final
feature class where a final suitability
value could be determined. This feature
class also went through a dissolve to
minimize the number of records. After
using Model Builder, the final four
feature classes, three from the submodels
and one from the final model, underwent
further analysis so comparisons could be
made between suitability values and the
total land acreage and percent of land
each contained within the City of
Minneapolis.
Land Use
The exact layers used within the Land
Use submodel as shown in Table 1. It
contains the names of the five feature
classes that were used in the study and
information about the feature polygon,
and the numeric value assigned to each
feature class. The higher the assigned
value the greater the level of influence

7
that layer had on suitability. The Land
Use submodel was the only model to
include a feature class, Industrial
Districts, which was not given a numeric
value. The „Erase‟ tool from
ArcToolbox was used to remove all
these lands from consideration in the
Land Use submodel, because this area
was identified by the City of
Minneapolis‟ Plan for Sustainable
Growth (City of Minneapolis, 2009) as
prime Industrial Land that should stay
Industrial for the foreseeable future.
This study believed this warranted a
hardship on that land that would be
difficult to overcome for development as
anything other than industrial use;
however, these areas were not removed
from consideration in the subsequent
submodels.
Table 1. Land Use submodel layers, origin of
the polygon, and suitability value of each layer.
Four of the five feature classes
used in the Land Use submodel were
derived from the City of Minneapolis‟
Plan for Sustainable Growth.
Commercial corridors were digitized
using aerial imagery based on the
selected roads that were identified in the
Plan for Sustainable Growth. These
areas were identified as meeting the
following criteria: high levels of traffic,
mix of intensive commercial uses, light
industrial and high density residential
uses. The study identified this as a
suitable land use with only the
suggestion of high traffic areas
eliminating this feature from receiving a
score higher than 2 (City of
Minneapolis, 2009).
The growth centers feature class
was also digitized manually using aerial
imagery based on what the City‟s Plan
identified for future growth areas within
the city. These areas were considered a
destination that have high levels of
transit service and attract highly skilled
workers and high paying jobs. They are
distinguished by a concentration of
business and employment activities with
land uses such as residential, office,
retail, entertainment and recreational
uses. The value for this layer was
selected as 2 because there were areas
within the feature class that had land
uses such as institutional and
commercial that were not considered
developable for residential development
at this given time (City of Minneapolis,
2009).
The City of Minneapolis
identifies the Industrial growth areas as
vital to the long-term economic
prosperity of the City by providing areas
where future employment growth can
occur. As mentioned previously, this
feature class was used to erase areas
from contention in the land use
submodel, but these areas were not
removed from consideration in the other
two submodels.
Commercial Nodes are identified
by the City of Minneapolis as areas with
a mix of uses that are oriented towards
pedestrians rather than automobile
traffic, but are limited in service to the
surrounding neighborhood. The extent
is along one intersection with usually
three of the corners operating retail or
service oriented business. This feature
was given a suitability value of 1
because of the limited influence they
have outside of the immediate
neighborhood. They do provide some
GIS Layer Buffer / Shape Value
Commercial Corridors Digitized Polygon 2
Growth Centers Digitized Polygon 2
Industrial Growth Areas Polygon City of Minneapolis Erase
Commercial Node Polygon City of Minneapolis 1
Comprehensive Plan Designation
Medium Density Land Type Polygon 2
High Density Land Type Polygon 3
8
services and generally more intense
development that may be able to
accommodate additional mixed use
development with higher densities.
The Comprehensive Plan (Land
Use) feature class was queried to form
two different feature classes, medium
density and high density and received
values of 2 and 3 respectively. The
medium densities were all areas from 10
to 30 units per acre and high density
were those areas above 30 units per acre.
The high suitability values were given
because the City of Minneapolis has
recognized these areas as appropriate for
densities that may provide the critical
mass to encourage transit usage and the
development of retail in close proximity.
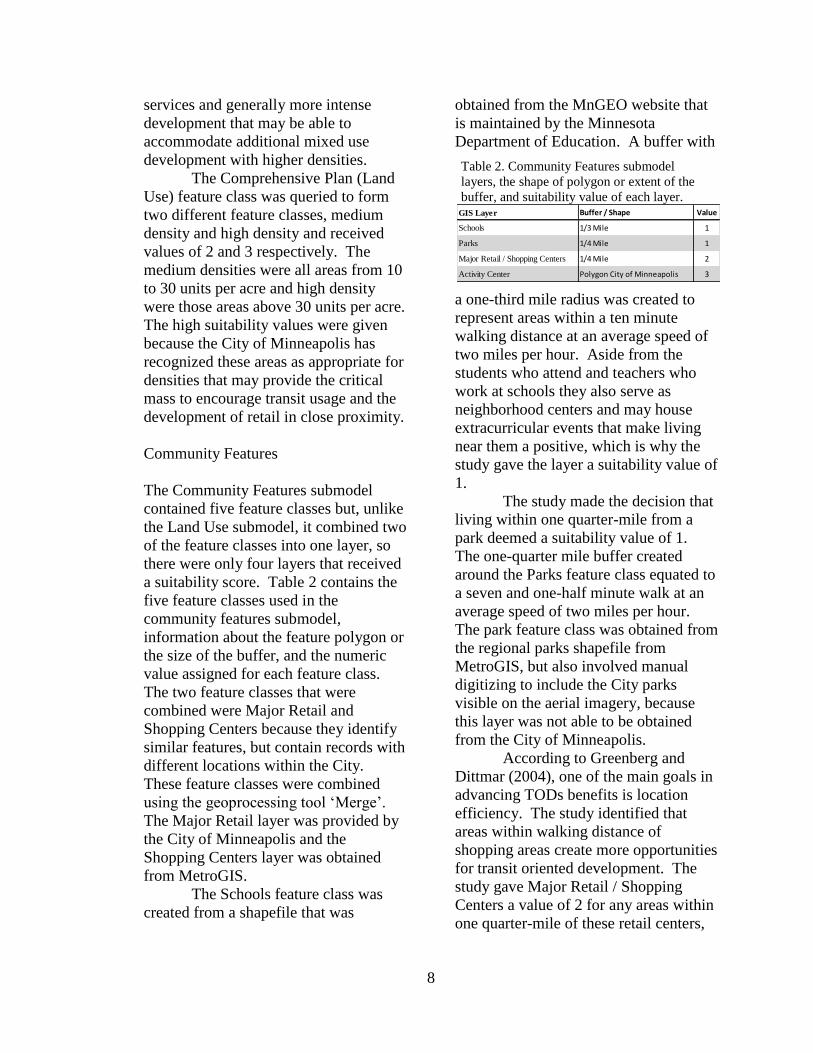
Community Features
The Community Features submodel
contained five feature classes but, unlike
the Land Use submodel, it combined two
of the feature classes into one layer, so
there were only four layers that received
a suitability score. Table 2 contains the
five feature classes used in the
community features submodel,
information about the feature polygon or
the size of the buffer, and the numeric
value assigned for each feature class.
The two feature classes that were
combined were Major Retail and
Shopping Centers because they identify
similar features, but contain records with
different locations within the City.
These feature classes were combined
using the geoprocessing tool „Merge‟.
The Major Retail layer was provided by
the City of Minneapolis and the
Shopping Centers layer was obtained
from MetroGIS.
The Schools feature class was
created from a shapefile that was
obtained from the MnGEO website that
is maintained by the Minnesota
Department of Education. A buffer with
Table 2. Community Features submodel
layers, the shape of polygon or extent of the
buffer, and suitability value of each layer.
a one-third mile radius was created to
represent areas within a ten minute
walking distance at an average speed of
two miles per hour. Aside from the
students who attend and teachers who
work at schools they also serve as
neighborhood centers and may house
extracurricular events that make living
near them a positive, which is why the
study gave the layer a suitability value of
1.
The study made the decision that
living within one quarter-mile from a
park deemed a suitability value of 1.
The one-quarter mile buffer created
around the Parks feature class equated to
a seven and one-half minute walk at an
average speed of two miles per hour.
The park feature class was obtained from
the regional parks shapefile from
MetroGIS, but also involved manual
digitizing to include the City parks
visible on the aerial imagery, because
this layer was not able to be obtained
from the City of Minneapolis.
According to Greenberg and
Dittmar (2004), one of the main goals in
advancing TODs benefits is location
efficiency. The study identified that
areas within walking distance of
shopping areas create more opportunities
for transit oriented development. The
study gave Major Retail / Shopping
Centers a value of 2 for any areas within
one quarter-mile of these retail centers,
GIS Layer Buffer / Shape Value
Schools 1/3 Mile 1
Parks 1/4 Mile 1
Major Retail / Shopping Centers 1/4 Mile 2
Activity Center Polygon City of Minneapolis 3
9
approximately a seven and one-half
minute walk.
Activity centers are areas within
the City that have functioned as a hub of
activity for decades. These are areas that
attract residents, workers, and visitors
throughout the city and region and
support a wide range of commercial,
office, and residential uses. Apart from
these positives they also have a busy
street life with a heavy pedestrian
orientation that is well-served by transit.
The study assigned a value of 3 for
activity centers because it was identified
as one of the key features to distinguish
areas suitable for dense Smart Growth
development and TODs.
Transit
The transit submodel contained the most
feature classes and the highest
possibility of total suitability points,
making it the most important factor in
determining suitable areas for TODs and
dense Smart Growth development. High
levels of transit service were considered
an important element in creating
successful opportunities for TODs and
Smart Growth development by being
able to use alternate modes of
transportation. The proposed central
light rail transit line was included in this
model. Table 3 contains the ten feature
classes used in the transit submodel,
information about the feature polygon or
the size of the buffer, and the numeric
value assigned for each feature class.
Bikeways were considered an
important recreational and
transportation option for residents in the
City of Minneapolis and were believed
to warrant a value of 1. The bikeways
layer was actually created from
merging the bikeways and regional
trails feature classes. These two feature
Table 3. Transit submodel layers, the extent of
the buffer, and suitability value of each layer.
classes had common values and if the
feature classes were not combined then
the areas with overlapping features
would have received a value of 2 rather
than the 1 the study assigned.
High frequency bus service
includes bus lines that provide service at
least every 15 minutes. Basile Baumann
Prost and Associates (2007) state that
regular bus service has minimal impact
on development, but this study believed
that high frequency bus service provides
opportunities over regular bus service to
influence the desirability of development
within a one-eighth mile radius of bus
lines and was classified with a value of 1
in the study.
Carsharing is a fleet of vehicles
that members share and pay for based on
usage and can provide an incentive to
drive less and save money (Rodier and
Shaheen, 2003). Carsharing vehicles are
generally found near high density
neighborhoods, job centers, or
universities. At the time of this study
the City of Minneapolis had 20 vehicles
within the city limits. This feature class
was given a value of 1 because the
location of vehicles had no bearing on
the physical form of the community or
the transportation infrastructure, but
does provide a service and incentive for
members to drive less making them
more apt to use alternate modes of
transportation.
There were three different
Transit Stations included in the transit
GIS Layer Buffer / Shape Value
Bikeways 1/8 Mile 1
High Frequency Bus Service 1/8 Mile 1
Carsharing vehicles 1/2 Mile 1
Station buffers
LRT Stations 1/2 Mile 3
BRT Stations 1/2 Mile 2
Commuter Rail Stations 1/2 Mile 2
Bus Stops 1/8 Mile 1
Downtown Fare Boundary Current Extend of Boundary 1
Park & Ride Station 1/8 Mile 1

10
submodel: Light Rail Transit (LRT), Bus
Rapid Transit (BRT), and Commuter
Rail. All three of these layers received a
buffer of one-half mile, but received
different suitability values. LRT had a
value of 3, with BRT and Commuter
Rail having a value of 2. This was based
on the Minneapolis Plan for Sustainable
Growth and the study done by Basile
Baumann Prost and Associates (2007)
that concluded that influence extends up
to one-half mile and LRT generally
attains higher levels of development
compared to commuter rail and regular
bus service.
The Downtown Fare Boundary
feature class received a value of 1 and
was a district within the downtown area
of Minneapolis that represents the
decreased ($0.50) fares on all transit
service. The study believed this may
influence development because of the
incentive to take transit within this
district.
Park and ride stations provide
access to multiple bus routes and access
to the other transit options in the City.
The study went with the understanding
that multimodal transit centers generally
see significant development (Basile
Baumann Prost and Associates, 2007).
The study determined the multiple bus
routes available at these nodes warranted
a value of 1 for lands within one-eighth
mile from park and ride stations.
Final Model Builder Model
The final model builder model combined
the three submodels, Land Use,
Community Features, and Transit into a
final model. The total points possible in
the final model were 30, of those points
10 were land use (33.33%), 7 were
community features (23.33%) and 13
were Transit (43.33%).
The intention of the study was to
create a model with transit as the key
feature for identifying the suitability of
TODs and Smart Growth. Land use was
determined to be the second highest
score because of the importance of land
types and densities in creating successful
TOD and Smart Growth development.
Community features model‟s objective
was to identify areas that had a special
appeal, a livability factor, which makes a
particular location more desirable than
others.
The final model builder model
was the easiest to understand and follow
since there were only four feature
classes, one from each submodel and
one for the City of Minneapolis. The
following geoprocessing tasks were
assigned: Union, Add Field, and
Calculate Field. A process similar to the
three submodels was used, but an
additional step was undertaken to add
the City of Minneapolis boundary
feature class using the union task so that
the final feature class would cover the
entire City of Minneapolis rather than
only those areas receiving a value. The
areas within the City that had a value of
zero were those areas that were not
identified as suitable with any of the
submodels.
Results
Further analysis was conducted on each
submodel to better understand the total
acreage for each scored value and the
proportion of the city each value
covered. The feature class for each
submodel only contained one record for
each value because of the „dissolve‟
geoprocessing task that was included
with each Model Builder model. To
determine the acreage for each value a
new field was added and then the

11
calculate geometry command was used
to find the total acreage for each value
and, consequently, the percentage of the
City of Minneapolis each value covered.
The submodel results provided
an understanding of areas the model
depicted as suitable for the three
different model types. The results were
depicted on a map with only those areas
receiving a value shaded. The results
table provided the number of points
(suitability value) recorded for each
model and a breakdown of acreage and
percentage of the City each value
covered. A bar graph provided a visual
understanding of the percentage of land
each value covers for the City of
Minneapolis.
Land Use Model
The land use model provided an
understanding of areas within the City
that have mixed use and higher density
land types conducive for TODs. Figure
2 contains a map that shows the
suitability values from the land use
model overlaid on aerial imagery for the
City of Minneapolis. All lands that
received a value other than zero are
shaded in a color; green indicates lower
suitability values while orange and red
represent areas with higher suitability
values. The high and low suitability
values are relative to each other because
all lands that received a value are
considered suitable for development
with respect to land use features. The
most suitable areas were those in the
central portion of the City from the
University of Minnesota through
downtown and towards Uptown. The
highest recorded values (HRV) in the
Land Use submodel were in downtown
and around the University of Minnesota
campus. Other significant areas were
the neighborhoods south of downtown
that are comprised of medium to high
density residential development and the
main commercial corridors such as in
South Minneapolis and Central Avenue
in Northeast Minneapolis.
Figure 2. Land Use Suitability values
calculated using models created from ESRI‟s
Model Builder.
Table 4 provides statistics for
each suitability value recorded in the
land use model. The ranges of possible
and actual values are indicated on the
table, both of which had values from 1 to
8. The „Total Acres‟ field and „City
Proportions‟ field provides information
for the total acres and percent of land
covered by each individual value. The
values with the highest frequency were 2
and 3 with 3,388 and 1,426 acres
respectively. The three highest recorded
suitability values were 6, 7, and 8
covering approximately 102 acres or
roughly 0.28 percent of the City of
Minneapolis. The land use model
included only18.04 percent of the City
or 6,625 acres between the eight

12
different suitability values, which is why
all lands that received a value were
considered suitable because over 80
percent of the City received no value.
Figure 3 provides a representation of the
data found in the „City Proportions‟ field
using a graph to better display the
differences between values.
Table 4. Results for Land Use Submodel with
possible and actual suitability point ranges and
statistics for total acres and percentage of city
coverage for each suitability value.
Figure 3. Land Use Suitability values and
percent of Minneapolis each value includes.
Community Features Model
The Community Features model
concluded that areas near an
agglomeration of retail and the activity
centers identified by the Minneapolis
Plan for Sustainable Growth had the
highest suitability. Lands with the HRV
of 7 were found in the St. Anthony Main
area of Northeast Minneapolis and in
Uptown. Areas in downtown‟s
warehouse district and along Hiawatha
transit way received values of 6.
Figure 4 illustrates the suitability
values from the community features
model over aerial imagery for the City of
Minneapolis. Similar to the Land Use
Model all lands that received a value
other than zero were considered
important and were shaded with green
colors for lower suitability values and
orange and red for higher suitability.
The orange and red areas indicated on
Figure 4 correspond to areas with higher
levels of shopping, services and business
activity.
Figure 4. Community Features Suitability
values calculated using models created from
ESRI‟s Model Builder.
Table 5 provides statistics for
each suitability value recorded in the
community feature model. The ranges of
possible and actual values are indicated
Land Use Submodel ResultsPossible Point Range: 1 - 8
Actual Range Results: 1 - 8
City of Minneapolis contains 36,726 acres
Land Use Points Total Acres City Proportions
1 252 0.68%
2 3,388 9.22%
3 1,426 3.88%
4 590 1.61%
5 868 2.36%
6 8 0.02%
7 90 0.24%
8 4 0.01%
Total 6,625 18.04%
13
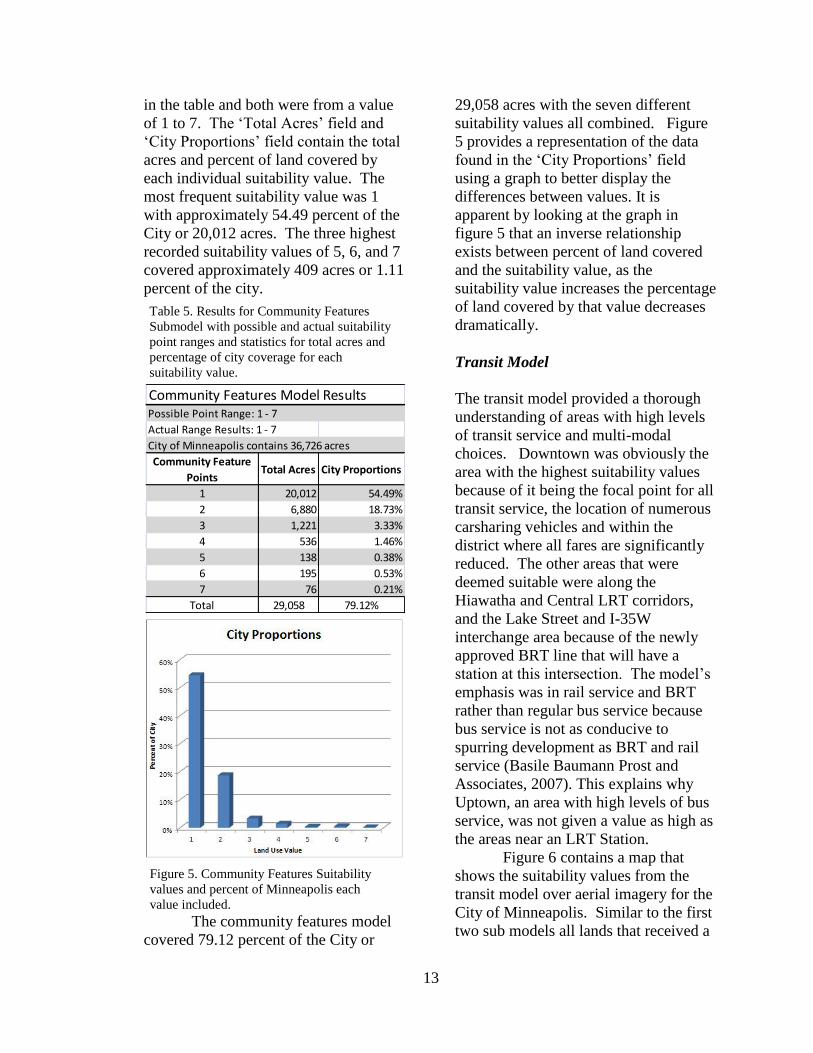
in the table and both were from a value
of 1 to 7. The „Total Acres‟ field and
„City Proportions‟ field contain the total
acres and percent of land covered by
each individual suitability value. The
most frequent suitability value was 1
with approximately 54.49 percent of the
City or 20,012 acres. The three highest
recorded suitability values of 5, 6, and 7
covered approximately 409 acres or 1.11
percent of the city.
Table 5. Results for Community Features
Submodel with possible and actual suitability
point ranges and statistics for total acres and
percentage of city coverage for each
suitability value.
Figure 5. Community Features Suitability
values and percent of Minneapolis each
value included.
The community features model
covered 79.12 percent of the City or
29,058 acres with the seven different
suitability values all combined. Figure
5 provides a representation of the data
found in the „City Proportions‟ field
using a graph to better display the
differences between values. It is
apparent by looking at the graph in
figure 5 that an inverse relationship
exists between percent of land covered
and the suitability value, as the
suitability value increases the percentage
of land covered by that value decreases
dramatically.
Transit Model
The transit model provided a thorough
understanding of areas with high levels
of transit service and multi-modal
choices. Downtown was obviously the
area with the highest suitability values
because of it being the focal point for all
transit service, the location of numerous
carsharing vehicles and within the
district where all fares are significantly
reduced. The other areas that were
deemed suitable were along the
Hiawatha and Central LRT corridors,
and the Lake Street and I-35W
interchange area because of the newly
approved BRT line that will have a
station at this intersection. The model‟s
emphasis was in rail service and BRT
rather than regular bus service because
bus service is not as conducive to
spurring development as BRT and rail
service (Basile Baumann Prost and
Associates, 2007). This explains why
Uptown, an area with high levels of bus
service, was not given a value as high as
the areas near an LRT Station.
Figure 6 contains a map that
shows the suitability values from the
transit model over aerial imagery for the
City of Minneapolis. Similar to the first
two sub models all lands that received a
Community Features Model ResultsPossible Point Range: 1 - 7
Actual Range Results: 1 - 7
City of Minneapolis contains 36,726 acres
Community Feature
PointsTotal Acres City Proportions
1 20,012 54.49%
2 6,880 18.73%
3 1,221 3.33%
4 536 1.46%
5 138 0.38%
6 195 0.53%
7 76 0.21%
Total 29,058 79.12%

14
value other than zero were considered
important with suitability values
increasing from shades of green to red.
The orange and red areas indicated on
Figure 6 correspond to areas with service
provided by LRT, BRT, and commuter
rail.
Table 6 provides the statistics for
each suitability value recorded in the
transit model. The ranges of possible and
actual values are indicated in the table
and were both from a value of 1 to 9.
The „Total Acres‟ field and „City
Proportions‟ field contain the total acres
and percent of land covered by each
individual suitability value. The values
with the highest frequency were 1 and 2
with 11,815 and 3,787 acres
respectively. The suitability value of 1
covered approximately 32.17 percent of
the City of Minneapolis. The three
highest recorded suitability values were
7, 8 and, 9 covering approximately 1,015
acres or roughly 2.76 percent of the City
of Minneapolis. The transit model
Figure 6. Transit Suitability values
determined using models created from ESRI‟s
Model Builder.
covered 60.31 percent of the City or
approximately 22,151 acres. Figure 7 is
a graph that represents the percentage of
land each suitability value covers The
suitability values for the transit model
generally decrease in acreage as the
values increase except for values 5 and 7
that increase slightly from the values
below.
Table 6. Results for Transit Submodel with
possible and actual suitability point ranges and
statistics for total acres and percentage of city
coverage for each suitability value.
Figure 7. Transit Suitability values and percent
of Minneapolis each value included.
Transit Submodel ResultsPossible Point Range: 1 - 13
Actual Range Results: 1 - 9
City of Minneapolis contains 36,726 acres
Transit Points Total Acres City Proportions
1 11,815 32.17%
2 3,787 10.31%
3 1,970 5.36%
4 1,312 3.57%
5 1,565 4.26%
6 686 1.87%
7 741 2.02%
8 122 0.33%
9 152 0.41%
Total 22,151 60.31%

15
Final Model
The suitability values from the three
submodels were combined into the final
model. Table 8 provides a list of all the
layers that went into each submodel and
ultimately the final model to create the
final suitability values as shown in
Figure 8. The total value possible for
the final model was 30, but the highest
recorded value (HRV) for any land was
19. The Land Use model‟s HRV of 8
could only make up 42.11% of the total
model points, the Community Features
HRV of 7 had the possibility of
comprising 36.83% of the final model‟s
points and Transit‟s HRV of 9 had the
possibility of being 47.37% of the final
model‟s total points.
The map in Figure 8 contains a
map similar to those of the submodel,
but contains suitability values for the
entire city. The colors are the same with
green shades indicating lower suitability
and red being the highest. The Final
Map included zero values in the shading
in order to create a layer that covered the
entire City. Values of 1 and 2 are
similar to zero in that they received a
value of zero in at least one of the sub
models and should not be considered
prime land for development.
The twelve highest recorded
values were from 8 to 19 and covered
approximately 8.9 percent of the City.
These areas are shaded in yellow to red
and warrant consideration for TODs and
Smart Growth development. The HRV
in the final model were observed near
LRT stations, Downtown, and the
activity centers that were identified in
the Minneapolis Plan for Sustainable
Growth (City of Minneapolis, 2009).
Table 7 contains the statistics for
each suitability value recorded in the
final model. The ranges of possible
values were from 0-30, but actual
recorded values were 0-19. The „Total
Acres‟ field and „City Proportions‟ field
contain the total acres and percent of
land covered by each individual
suitability value. The most frequent
suitability value was 2 with
approximately 26.11 percent of the City
or 9,590 acres. The five highest
recorded suitability values of 15 through
19 covered approximately 233 acres or
0.63 percent of the city.
The histogram in Figure 9
represents the percentage of land each
suitability value covers. The results are
similar to the submodels in that the
lower suitability values cover a larger
percent of land than the higher suitability
values. All suitability values greater
than thirteen have city proportions of
less than 2 percent of the City.
Table 7. Final Model results containing possible
and actual suitability point ranges and each
suitability point value with corresponding acreage
and percentage of coverage for Minneapolis.
Land Use Points Total Acres City Proportions
0 4,069 11.08%
1 8,581 23.36%
2 9,590 26.11%
3 4,579 12.47%
4 2,526 6.88%
5 1,598 4.35%
6 1,403 3.82%
7 1,016 2.77%
8 793 2.16%
9 632 1.72%
10 412 1.12%
11 427 1.16%
12 469 1.28%
13 226 0.62%
14 173 0.47%
15 101 0.27%
16 63 0.17%
17 34 0.09%
18 14 0.04%
19 21 0.06%
Total 36,726 100%
Possible Point Range: 0 - 30
Actual Range Results: 0 - 19
Final Model Results
City of Minneapolis contains 36,726 acres

16
Table 8. The layers of each submodel
included in the Final Model Builder Model. Land Use
Commercial Corridors
Growth Centers
Industrial Growth Areas
Commercial Node
Comprehensive Plan Designation
Medium Density
High Density
Transit
Bikeways
High Frequency Bus Service
Carsharing vehicles
LRT Stations
BRT Stations
Commuter Rail Stations
Bus Stops
Downtown Fare Boundary
Park and Ride Station
Community Features
Schools
Parks
Major Retail / Shopping Centers
Activity Center
Figure 8. Final Model Suitability values determined using models created from ESRI‟s Model Builder.

17
Figure 9. Final Model Suitability values and percentage of Minneapolis each value included.
Final Results
The purpose of this study was to create
models to identify areas in Minneapolis
suitable for TODs and Smart Growth
development. The final model was a
compilation of the three submodels that
each, on its own identified areas suitable
for their specific study area. Areas
determined to have higher suitability
values were found within the central part
of the City of Minneapolis in sort of a
triangle running from the Midtown LRT
Station north towards the University of
Minnesota Campus, west to Downtown
and St. Anthony Main, south to Uptown
and east along Lake Street back to the
Midtown LRT station. Other areas with
high values were around LRT stations
and along main arterial roads throughout
the City as observed in Figure 8.
Areas that did not measure as
well in this study were found in the
northern portion of the City in North and
Northeast Minneapolis. Some of the
main factors that contributed to the
lower values were the lack of major
retail and employment areas or activity
centers, the smaller concentrations of
higher density residential areas, and the
absence of a Light Rail or Bus Rapid
Transit. This does not mean this area is
not suitable for future development
especially with the proposed Bottineau
Transitway that would travel through
North Minneapolis into the northwest
suburbs.
An example of an area within the
City of Minneapolis suitable for TOD
that scored very well in this study would
be the K-Mart site in South Minneapolis
along Lake Street. This store prevents
Nicollet Avenue from reaching Lake
Street and is in an area where
redevelopment has been encroaching
from the Lyn-Lake area to the west and
the Chicago and Lake area to the East.
The BRT station under construction at
Lake Street and Interstate 35W is within
one-half mile of this location.
Some areas that scored less than
expected were Uptown and the Midtown
Exchange area near Lake Street and
Chicago Avenue. Uptown did have one
of the higher scores but scored lower
than expected because this study focused
on LRT, BRT, or Commuter Rail instead
of traditional bus service. It would be
interesting to see how the results might
change if the proposed Southwest Light
Rail Line ran through Uptown or if
streetcars were reintroduced to
18
Minneapolis and traveled through
Uptown. The Chicago and Lake area
also scored lower because of the absence
of a rail or BRT station, and the Major
Retail data obtained from the City of
Minneapolis and MetroGIS did not have
any values near this intersection.
Discussion
Sources of Error
A number of problems were encountered
during the course of this study. The
timeframe of this study made it difficult
to gather all the data desired from the
City of Minneapolis. It was also
difficult to identify what data to include
in the study aside from those that were
easy to differentiate. There were many
other factors that could have been
identified, such as socioeconomic
impacts, crime, perceptions of place,
price of real estate, future regional
transit investments and emphasis on
decreasing sprawl, all of which might
change the demand and suitability areas
for Smart Growth and TODs in the
region and in the City of Minneapolis.
Recommendations for Future Research
There were areas that were not included
in this study that would be interesting
areas for further research. The methods
and models created in Model Builder
could be easily adapted by researchers to
include additional layers or submodels to
predict factors such as, people‟s
perceptions, current population densities,
crime, or changes in regional policies.
The methods in the study could also be
used to analyze other cities in the Twin
Cities Metropolitan Area or the entire
Metropolitan Area. Additional research
could also be conducted to determine
why areas identified in this study as
suitable for TODs and Smart Growth
have not been developed. This type of
study may help predict needed changes
with current city or regional policies,
zoning requirements, criminal activity,
and/or market conditions.
Conclusion
Creating models and using a geographic
information system was useful in
determining areas suitable for TODs and
Smart Growth development. Areas of
land known to be candidates for
development from past studies were
shown to have high suitability values in
this study by using a nonscientific
approach of trial and error to review
these known areas. The Model Builder
models created in this study should have
value for the City of Minneapolis and
will be flexible so any changes in policy
or infrastructure can be easily adjusted in
the models.
Acknowledgments
The author would like to give thanks to
the City of Minneapolis, the people
responsible for maintaining MnGeo and
MetroGIS, and the many people who
helped during this process. The author
would especially like to thank Barb
Thoman from Transit for Livable
Communities for her advice and
suggestions for resources to contact at
the City of Minneapolis. I also thank
Paul Mogush, from the City of
Minneapolis, for providing the necessary
data to complete the study and Mark
Garner from the City for his insight and
understanding about the City of
Minneapolis Plan for Sustainable
Growth. Thanks to Ari Ofsevit for his
eagerness to provide HourCar‟s vehicles

19
locations and his eagerness to assist in
any way possible. Thanks to Mike
Klein, GIS Analyst from the City of San
Diego for his helpful article about
identifying Smart Growth in San Diego
(Klein and Greer, 2006) and his advice
years before this project was even started
that provided me a foundation for
beginning this study. A special thanks to
my family, most importantly my
grandmother, PhD Dolores Dege and my
mother, Joy Meyers, with their eagerness
and willingness to help me with my final
revisions.
References
Basile Baumann Prost and Associates,
Inc. 2007, July. Economic and
Development and TOD. Retrieved on
January 31, 2009 from Denver the
Mile High City: http://denvergov.org
/HomePage/EconomicDevelopmentan
dTOD/tabid/425422/Default.aspx
Belzer, D., and Gerald, A. 2002. Transit
Oriented Development: Moving from
Rhetoric to Reality. Washington, DC:
Brookings Institute, 3-27.
Boarnet, M., and Compin, N. 1999.
Transit-Oriented Development in San
Diego County. APA Journal, 80-94.
Canepa, B. 2007. Bursting the Bubble:
Determining the Transit-Oriented
Development's Walkable Limits.
Transportation Research Record , 28-
34.
City of Minneapolis. 2009, October 2.
Plan for Sustainable Growth.
Minneapolis, MN, United States: City
of Minneapolis. Retrieved December
14, 2009, from the City of
Minneapolis: http://www.ci.
minneapolis.mn.us/CPED/comp_plan_
2030.asp
Consortium, O. G. 2010, March 14. Web
Map Service. Retrieved on March 15,
2010 from Open Geospatial
Consortium, Inc.: http://www.open
geospatial.org/standards/wms
Cortright, J., and Coletta, C. n.d.. The
Young and The Restless: How
Portland Competes for Talent.
Retrieved on February 10, 2009, from
The Young and The Restless:http://
www.restlessyoung.com/public/pdf/Po
rtland.pdf
Demographia. 2005. 2000 Census: US
Municipalities Over 50,000. Retrieved
on March 5, 2010, from demographia:
http://www.demographia.com/db-
uscity98.htm
Emporis. 2010. Emporis: Minneapolis.
Retrieved on March 5, 2010, from
Emporis: http://www.emporis.com
/application/?nav=cityandlng=3andid=
101331
ESRI. 2009, Spring. The Top Nine
Reasons to Use a File Geodatabase.
Retrieved on March 5, 2010, from
ESRI: http://www.esri.com/news/
arcuser/0309/files/9reasons.pdf
Fortune Magazine. 2009, May 4.
Fortune. Retrieved on March 3, 2010,
from CNNMoney: http://money.cnn
.com/magazines/fortune/fortune500/20
09/states/MN.html
Greenberg, E., and Dittmar, H. 2004.
Practice Transit-Oriented
Development. ZoningPractice , 2-11.
Handy, S. 2005. Smart Growth and the
Transportation-Land Use Connection:
What does the Research Tell Us?
International Regional Science Review
, 146-167.
Havens, C. 2010, March 14. Central
Corridor isn't just about moving
people. Star Tribune , pp. B1, B6.
Klein, M., and Greer, K. 2006, Fall.
ArcNews Online: Smart Growth in
San Diego, California. Retrieved on
February 3, 2009 from ESRI:

20
http://www.esri.com/news/arcnews/fall
06articles/smart-growth.html
Metropolitan Council. 2006, August.
Guide for Transit Oriented
Development. Retrieved on November
13, 2009, from Metropolitan Council:
http://www.metrocouncil.org/planning/
tod/TOD_index_page.pdf
Metropolitan Council. 2009, July 21.
Metropolitan Council News. Retrieved
on March 3, 2010, from Metropolitan
Council: http://www.metrocouncil
.org/news/2009/news_646.htm
National Center for Education Statistics,
U.S. Department of Education. 2008-
2009. University of Minnesota - Twin
Cities. Retrieved on March 3, 2010,
from National Center for Education
Statistics: http://nces.ed.gov/globalloc
ator/col_info_popup.asp?ID=174066
Olson, D. 2010, January 6. MPR news
Q. Retrieved on March 3, 2010, from
Minnesota Public Radio: http://
minnesota.publicradio.org/display/web
/2010/01/06/transit-funding
Ray, A. D. 2009, December 28.
America's Largest Private Companies.
Retrieved on March 3, 2010, from
Forbes: http://www.forbes.com/
2009/10/28/largest-private-companies-
business-private-companies-
09_land.html
Renne, J. 2005. Transit-Oriented
Development: Measuring Benefits,
Analyzing Trends, and Evaluating
Policy. New Brunswick, New Jersey:
Rutgers, The State University of New
Jersey, 29-76.
Rodier, C., and Shaheen, S. 2003.
Carsharing and Carfree Housing:
Predicted Travel, Emission, and
Economic Benefits. Transportation
Research Board , 1-18.
Smart Growth Network. 2009. About
Smart Growth. Retrieved on
November 15, 2009, from Smart
Growth Online:http://www.
smartgrowth.org/
TranSafety, Inc. 1997, October 1. Road
Engineering Journal. Retrieved on
March 14, 2010, from US. Roads:
http://www.usroads.com/journals/p/rej/
9710/re971001.htm
Transit for Livable Communities. 2010.
Bike Walk Twin Cities. St. Paul:
Transit for Livable Communities.
Retrieved on March 3, 2010, from rails
to trails: http://www.railstotrails.org
/resources/documents/whatwedo/case_
statements/Minneapolis%20Case%20S
tatement.pdf
Tumlin, J., and Millard-Ball, A. 2003.
How to Make Transit-Oriented
Development Work. American
Planning Association , 14-19.
US Census Bureau. 2007, April 15.
Population Estimates for the 100 Most
Populous Metropolitan Statistical
Areas Based on July 1, 2006
Estimates. Retrieved on March 3, 2010
from U.S. Census Bureau: http://www.
census.gov/PressRelease/www/release
s/archives/cb07-51tbl2.pdf


![The Minneapolis journal (Minneapolis, Minn.) 1902-01-07 [p 6].chroniclingamerica.loc.gov/lccn/sn83045366/1902-01-07/ed... · 2010-10-27 · A. building at 6:45 o'clock next Friday](https://img.pdfslide.us/doc/110x75/5b2e2e3f7f8b9adc6e8c3573/the-minneapolis-journal-minneapolis-minn-1902-01-07-p-6-2010-10-27.jpg)
![The Minneapolis journal (Minneapolis, Minn.) 1902-04-19 [p 5].chroniclingamerica.loc.gov/lccn/sn83045366/1902-04-19/ed... · 2010-10-27 · during the session by Mrs. Cummins. Her](https://img.pdfslide.us/doc/110x75/5b25e6d67f8b9a46678b4779/the-minneapolis-journal-minneapolis-minn-1902-04-19-p-5-2010-10-27.jpg)