Embed Size (px)
Citation preview

Using GIS in RPW eradication
Scientific Consultation and High-Level Meeting on Red Palm Weevil Management
Rome, 29–31 March 2017
Moisés Fajardo
Project Manager RPW Eradication Programme
Canary Islands

RPW eradication program in Canary Islands
Plan coordination
Integrated Pest
Management
Legislation
Visibility & awareness
Risk evaluation & contingency
plan
Movement control of
plant material
Training
G.I.S.


Risk evaluation
& contingency
plan
Movement control
IPM
Geographic Information System (GIS)
1. Database
2. Mobile application
3. Web application
4. Web viewer

ELEMENTS Traps, palm lots, farmers, nurseries
ACTIVITIES Chemical treatments, inspections
RESULTS Catch, inspection results
RESOURCES Workers, chemical products, trap types
1. Database
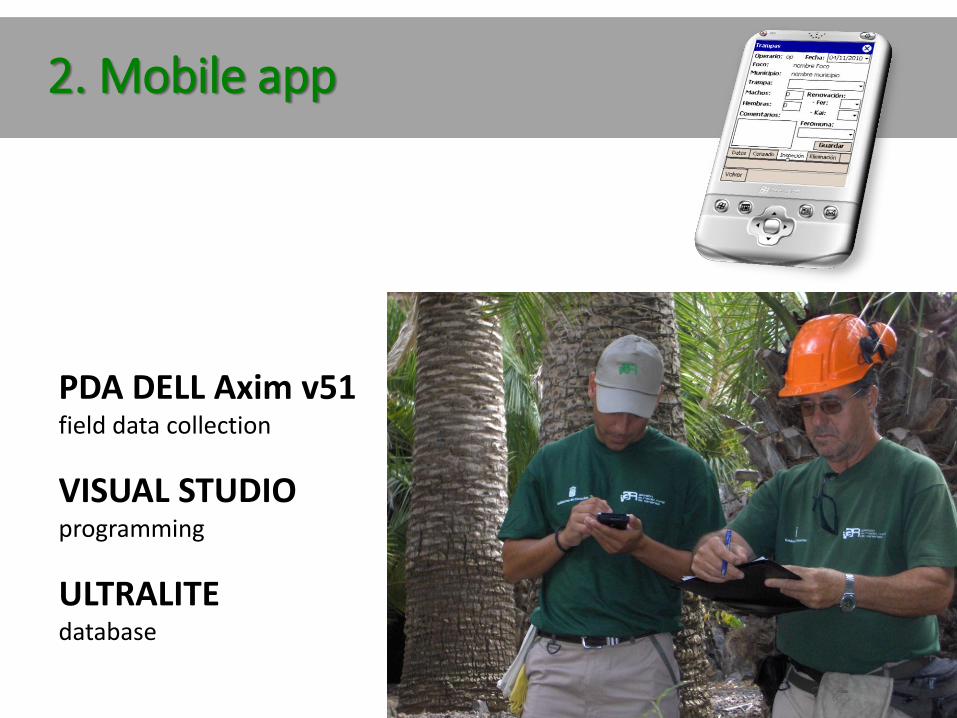
PDA DELL Axim v51 field data collection
VISUAL STUDIO programming
ULTRALITE database
2. Mobile app

2. Mobile app SCREENS

2. Mobile app DATA SUBMISSION VIA INTERNET
WEB SERVER
DATABASE SERVER
main database
upload PDA files
INTERNET export data
import data
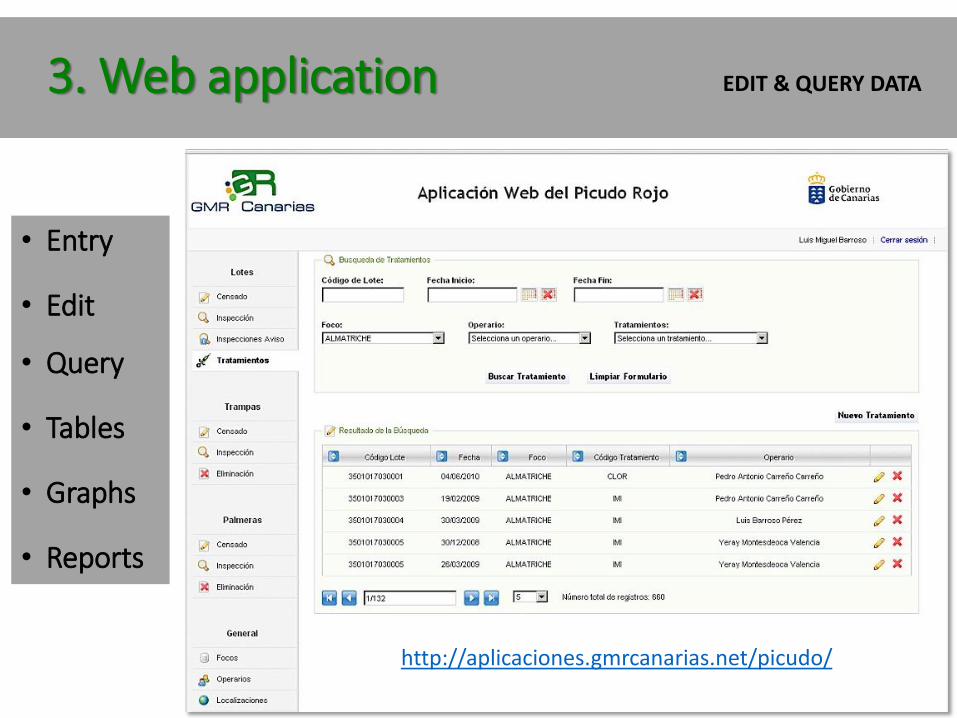
3. Web application EDIT & QUERY DATA
• Entry
• Edit
• Query
• Tables
• Graphs
• Reports
http://aplicaciones.gmrcanarias.net/picudo/

4. Web viewer VIEW & QUERY ONLY
DATA ARCHIVE • Lots, palm trees, traps
QUERIES • Palm trees removed (by date) • Traps (per catch number) • Traps with capture (by date) • Performed work (by lots)
NEW LAYERS • ArcGIS 9.2 • ArcSDE • SQL server • GIS server
http://visorpicudo.gmrcanarias.com/mapviewer.jsf

Lessons learned
• Open source software
• GSM mobile data service (GPRS)
• Viewer in mobile application
• Planning module
• Export to spreadsheet
• Technicians training

•Data and spatial analysis for optimal decision-making
•Efficient planning
•Efficient use of resources
•Assessment of results and goals
•Assessment of workers
•Better external and internal comunication
Conclusions
RPW eradication in the Canary Islands would have been impossible without GIS
Scientific Consultation and High-Level Meeting on Red Palm Weevil
Management
Innovative solutions using modern technologies (Remote Sensing, GIS) for RPW data management and analysis
• Keith Cressman / Kiran Viparthi (FAO)

1. collect 2. analyze 3. output
information flow
Training Training

do we really need to collect & analyze RPW data? assess current situation
identify hot spots
evaluate spread of infestations
plan field monitoring & control priorities
determine resource requirements
implement multiregional, multidisciplinary strategy
carry out early warning & preventive control

standardization = global success
DATA standard format
ANALYSIS uniform database
TRAINING harmonized material
SUPPORT more effective

learning lessons ... early warning & preventive control does work !
$570m Desert Locust control campaign 2003–2005 in 23 countries
170 years of preventive control in 10 countries

How can we achieve better management of RPW ?

Problem

Problem
It’s a global problem impacting various countries…
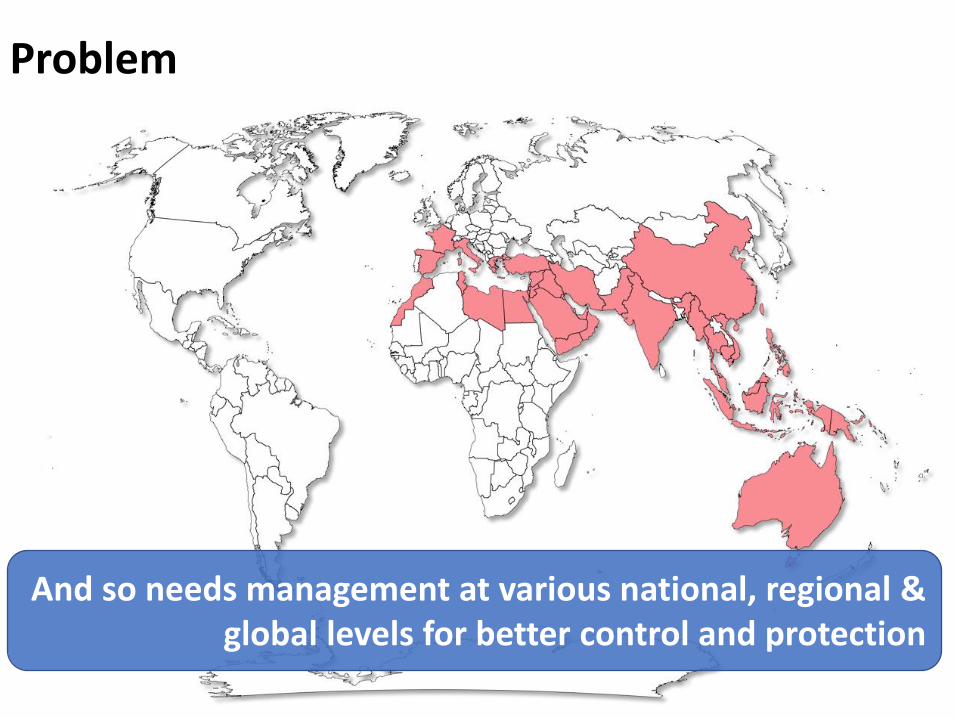
Problem
And so needs management at various national, regional &
global levels for better control and protection

Using modern tools & technologies in conjunction together with use of FAO RPW management system for day-to-day operations
Innovative solutions
Remote Sensing & GIS
Mobile Data Collection
UAVs / Drones & IOTs

Remote Sensing – Satellite imagery
Sentinel 2 Satellite images https://code.earthengine.google.com/24f282f82724f23b2e3ac58b7462b70b

Remote Sensing – Vegetation Identification
Using MIR and NIR infrared bands

Remote Sensing – NDVI / Classification models
Applying normalized difference vegetation index (NDVI) and random forest classification

Remote Sensing – Vegetation Masking
Reducing / Masking to select cropped zones

Remote Sensing – Area mapping
Applying Edge detection to map the areas

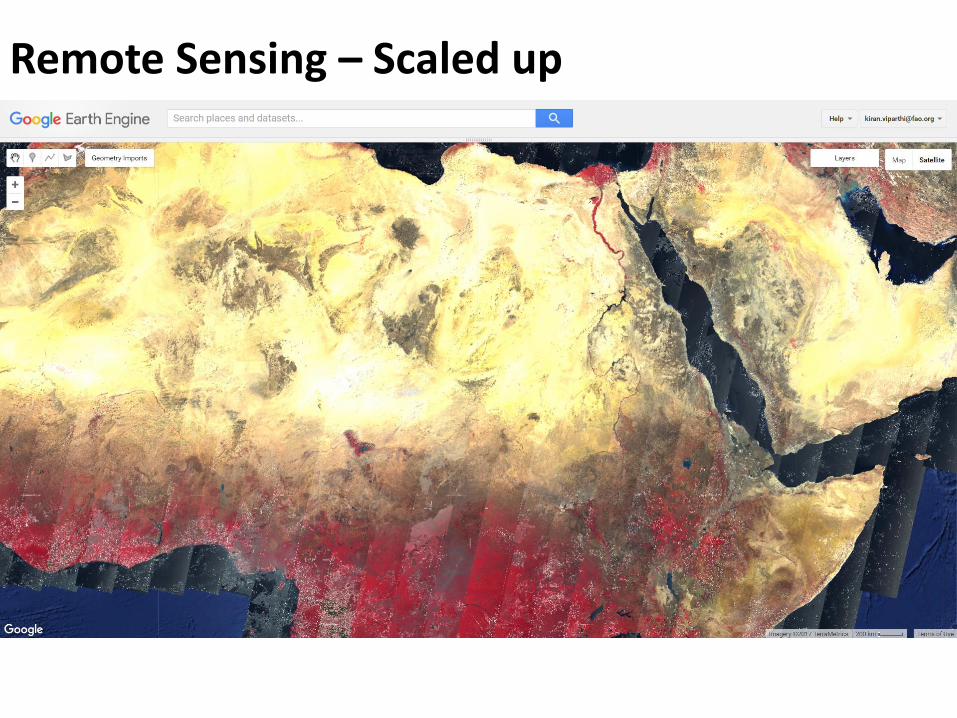
Remote Sensing – Scaled up
Remote Sensing – Scaled up

Remote Sensing – Scaled up

Remote Sensing – Focus Area
Sample area for demonstration purposes

GIS – Traps

GIS – Traps

GIS – Traps Mapping

GIS – Traps Coverage
Computation of statistics and quick overview

GIS – Traps Servicing Status Monitoring
Serviced
Expiring Soon
Expired

GIS – Traps Mapping for Weevils
Weevil found in
traps

GIS – Weevils Mapping vs Non serviced Traps
Expired traps close to trapped
weevils

GIS – Traps Optimized Positioning
Grid Based Random target Distance based
High Coverage External protection Easy accessible
Similar to approaches used in setting up optimized mobile network coverage in urban spaces

GIS – Traps Positioning Grid model

Mobile Data Collection
Paper Based + GPS
Tablet devices
Forms used for RPW data collection globally
Standardized forms globally

Mobile Data Collection - Workflow
Defining an area for data gathering and
monitoring Sample Area for Demo

Mobile Data Collection - Workflow
Geo reference and positioning of new or existing traps identified with Barcode / QR code system

Mobile Data Collection - Workflow
Using barcode / QR codes track bugs found in traps to quick mapping and identify inspection areas

Mobile Data Collection - Workflow
Track and geo-reference trees eliminated to assess the search models and identify patterns

Data gathered, analyzed for informed decision-making and actions performed by
the team
Mobile Data Collection - Workflow
RPW Unified Platform

UAVs / Drones / IOTs

Plan
Raster / Maps (TIFFs)
Google Earth Engine
(Image Analysis)
Images
Videos
3D Point Cloud
UAVs / Drones / IOTs - Workflow
Collect
Organize
Process
Publish

Infrared camera images for vegetation analysis,
contours and water stress detection.
Raster Maps for dissemination and additional
data processing
3D models, Point cloud Densification
and DSM Ortho mosaic Generation
UAVs / Drones / IOTs - Outputs

UAVs / Drones / IOTs – Data Collection
Drones mounted with Bluetooth 4 (1 km range) readers/devices with optimized flight routes help collect data for decision making and rapid interventions
Smart Electronic Traps (IOTs) • GSM • Mesh Technology • Bluetooth
1 week manual effort = 30 mins drone flight

UAVs / Drones / IOTs – Data Analysis
Drones mounted with infrared cameras help in identification of infested trees
RGB Image
False color NDVI

“Dumb” Trap “Smart” Trap
Hi-Res Satellite Images Optimal Trap Positioning
Automated identification of the palm crops Assessment of effectiveness
Drones
Observers
Summary
1
“Paper” Forms
“Smart” Forms
2
3 4

setup, deliver, manage & update unified
platforms at the national, regional & global levels
develop standardized and harmonized innovative data collection & analysis tools
provide national training, support & capacity building
if funding is available, FAO with its global reach can…