Embed Size (px)
Citation preview
Using Geant4 to create 3D maps of dosage received
within a MinPET diamond sorting facility
MNH Cook and SH Connell
University of Johannesburg, Johannesburg, South Africa
E-mail: [email protected]
Abstract. The MinPET project aims to locate diamonds within kimberlite by activatingcarbon within kimberlite, then using Positron Emission Tomorography (PET) to image carbondensity. Although calculations suggest that long-term activation is not significant, modelling isrequired to determine the dose received by workers operating close to recently activated materialat different positions within a hypothetical MinPET sorting unit. Two modelling techniques aredeployed to investigate received dose. The first is a full simulation of energy absorbed, using theCERN Geant4 particle tracking toolkit. The results for this are validated against a numericalcomputation of the attenuation of outgoing radiation. The result is a set of 3-dimensional dosagemaps. These can be used to set guidelines around where and for how long workers could operate,and to identify areas that need additional radiation shielding. The techniques developed are notlimited to MinPET, and could prove useful for any situation requiring the simulation of dosereceived by workers operating near radioactive material.
1. IntroductionThe MinPET project [1] images locked diamonds within coarsely crushed kimberlite (±10cmrocks), using Positron Emission Tomography (PET). The kimberlite is irradiated with highenergy gamma rays, producing the unstable 11C isotope via a photonuclear reaction. This betadecays, and the positron annihilation leads to back-to-back collinear 511 keV photons. Theseare detected in coincidence by two planes of position sensitive detectors above and below thekimberlite. A 3D carbon density image is created by back-projecting the lines of response.Because the signal from oxygen-15 (with a 2 minute half-life) dominates early on, irradiatedmaterial is held for 20-30 minutes before it goes to the detectors. At this point, the carbon-11starts to dominate, due to its longer 20 minute half-life.
One of the concerns for an industrial scale MinPET plant is the radiation exposure of workers.The shielding requirements for the irradiation system have already been investigated in [2].This included radiation shielding calculations, analysis, and optimisation with the aid of theMCNPX Monte Carlo code. The conclusion was that a 1.6 m thick shielding matrix of lead,iron, wax and boron carbide adequately shielded personnel from the irradiation system. If theaccelerator, irradiation system and hold hopper were buried underground away from personnel,these requirements would be less stringent. The hold hoppers where kimberlite is stored canalso be shielded.
It therefore remains to quantify the radiation hazard posed by activated material after the20-30 minute point. Two scenarios we are especially interested in understanding are the dosereceived by workers near the conveyor belt at time of detection, and near a discarded pile of mine
Proceedings of SAIP2016
SA Institute of Physics ISBN: 978-0-620-77094-1 392
tailings. Two numerical techniques have been developed to calculate the exposure given by aparticular geometry of radioactive material. The first uses an attenuation model to arrive at anintegral that can be solved numerically. This technique only applies to rectangular cuboid bodiesof material. The results of this are compared to a full Monte Carlo physics simulation that ismore accurate, but far more computationally intensive. The second technique can, however, beapplied to any geometry.
2. MinPET Activity LevelsA series of irradiations were performed at the 100 MeV electron accelerator at Aarhus University[3]. These identified two isotopes that are of concern over time scales greater than 20 minutes,namely carbon-11 and sodium-24.
Assuming a 0.2% CO2 concentration in kimberlite, at run-of-mine MinPET specifications(feed rate of 700 tons/hour and 1s irradiation with a 1m2 footprint photon beam from a 40 MeVoptimally converted electron bremsstrahlung beam [4]), the combined oxygen and carbon activityis 33.9 Bq/g at the 29 minute mark. Each beta decay leads to two positron annihilation photons,so this is equivalent to a photon rate of 67.8 Hz/g. The measured sodium-24 concentration inour Aarhus sample, extrapolated to MinPET conditions, was 1.01 Bq/g.
3. Attenuation Model3.1. General CaseThe intensity of a mono-energetic photon beam passing through a material can be describedusing a linear attenuation constant, µL, as follows:
I
I0= e−µLx (1)
This does not capture the full story however, as once a photon interacts with an atom, allof its energy does not always disappear into the medium. Photons interact with the mediumpredominantly via pair production, the photoelectric effect and Compton scattering [5]. Thesecan leave the primary photon with some energy, and can also release charged particles whichare then free to interact further. One way of quantifying this is with a mass energy-absorptioncoefficient µen (see, for example, [6]). This attempts to quantify the energy absorbed by amaterial through which photons are passing. If, at each step dx, the material absorbs an energydE given by dE = Eµendx, then the energy that is not yet absorbed follows an exponentialdecay of the form of equation (1). We shall refer to the attenuation constant simply as µ, whichis a function of both the photon energy and the material being traversed.
Given the specific activity SA (presumed measured in Bq.m−3) of a radioactive isotope, anda photon energy Eγ , our goal is to find the overall energy incident on an object near someradioactive material per unit time. This will allow a radiological assessment of risk, to a person,in the proximity of the source. Using equation (1), the energy incident per unit time (dP ) on asmall surface area centred at point Q due to a small volume element dV centred at point P is
dP =dΩ(P,Q)
4πdV SAEγ e
−µl(P,Q) (2)
where dΩ is the solid angle subtended by the small area and l is the path length travelled bythe radiation through the material. To find the total power incident on a target, we integrateover the volume of radioactive material, and over the solid angle subtended by the object. If thetarget is small or far away, then l does not change much for different points on the target, andl(P,Q) ≈ l(P ). The integral over dΩ collapses to the total solid angle subtended by the target,Ω. We further simplify by considering a spherical target of radius r. The solid angle subtended
Proceedings of SAIP2016
SA Institute of Physics ISBN: 978-0-620-77094-1 393

by a sphere is Ω = 2π(1 −√
1− r2/R2), where R is the distance to the sphere, and thus thetotal power incident on the target due to a volume V is
P =SAEγ
2
∫
VdV
(1−
√1− r2
R2
)e−µl (3)
3.2. Rectangular Cuboid Volume
Figure 1. Rectangular geometry in attenuation model
In the case of a cuboid volume, with coordinates as shown in figure 1, the path length l can
be expressed in terms of R: l = R(Lz−zw−z
). The power will now be given by
P =SAEγ
2
∫ Lx
−Lx
dx
∫ Ly
−Ly
dy
∫ Lz
−Lz
dz(1−
√1− r2/R2
)e−µ(Lz−z
w−z )R (4)
where R2 = (x−u)2+(y−v)2+(z−w)2. This integral does not have a readily available analyticsolution and is calculated numerically.
An additional complication arises because equation (4) assumes that the photons passesthrough the upper z face. In the general case, an extra step is required at each point of theintegral, that tests which face of the cuboid is intersected by the line joining P and Q. Thecoordinates of the term in the exponential can then be rotated appropriately.
4. Monte Carlo SimulationIn order to get results in more complex geometries, a full simulation is needed to individuallytrack particles from emission to target impact. The toolkit of choice is the Geant4 framework[7][8], created at CERN.
In order to compare results to the attenuation model, we first find the effective energyattenuation within kimberlite of Geant4 simulations. Photons are fired out from the centreof a large sphere, and the energy that makes it to a certain radius is graphed against the radius.This is fitted with an exponential decay in figure 2. 511 keV and 1369 keV are the energylevels from the PET isotopes and sodium respectively. 100 keV was included as a lower energycomparison. The fit is relatively good, with only small divergences at high and low energy. Thisvalidates the treatment of energy loss with a simple exponential attenuation. From the slope ofthe exponential fits in figure 2, the effective Geant4 energy attenuation constants are 9.352 ±0.002m−1 for 1369 keV, 12.804 ± 0.004m−1 for 511 keV and 26.37 ± 0.02m−1 for 100 keV.
The full Geant4 simulation consists of an activated kimberlite volume and a human phantom(sphere of water that makes up the target). We will use a water sphere of radius 0.5m. This hasthe same frontal surface area as a standing person, approximated as 1.7m tall and 50 cm wide.If more accuracy is desired, a more realistic shape can easily be created, but the advantage ofa sphere is that the results are directly comparable to those from the attenuation model, forcross-checking. The sphere is placed at a succession of positions on a three dimensional grid.
Proceedings of SAIP2016
SA Institute of Physics ISBN: 978-0-620-77094-1 394

Distance (m)0 0.1 0.2 0.3 0.4 0.5 0.6
Tota
l Ene
rgy
(keV
)
0
2
4
6
8
10
12
14
610×
1369 keV511 keV100 keVExp. fit
Distance (m)0 0.01 0.02 0.03 0.04 0.05 0.06 0.07
Tota
l Ene
rgy
(keV
)
8
9
10
11
12
13
14
610×
Figure 2. Difference between Geant4 simulation and simple attenuation model. Coloured linesshow simulated data from Geant4. Inset shows magnification of lower radius region for 1369 keV.
5. Results5.1. Comparison between Attenuation Model and Geant4 SimulationAn example geometry was created with a kimberlite cuboid 2 m high, 4 m wide and 6 m long.A 0.5 m radius spherical target was then moved along a horizontal plane at a height of 0.6 mabove the cuboid, and the energy deposited was calculated using both the attenuation modeland the Geant4 simulation. The attenuation model was integrated numerically using the Vegasalgorithm from ROOT [9]. The Geant4 simulation fired 1 000 000 particles for each data pointand recorded the energy that hit the target. The results are shown in figure 3. The agreementis quite good. The major qualitative difference is that the Geant4 simulation is not as smooth,as it is a stochastic Monte Carlo simulation.
x (m)-10 -5 0 5 10y (m)
-10-5
05
10
Fra
ctio
n of
Ene
rgy
0
0.1
0.20.3
0.40.5
-310×
Geant4 Simulation
x (m)-10 -5 0 5 10y (m)
-10-5
05
10
Fra
ctio
n of
Ene
rgy
00.10.20.30.40.5
-310×
Attenuation Model
Figure 3. Fraction of activity reaching target in Geant4 simulation and attenuation models.
Small non-statistical differences between the models are observed at small distances. This isto be expected, because the derivation of equation 3 relied on the assumption that the target issmall compared to the distance between the target and the source.
Proceedings of SAIP2016
SA Institute of Physics ISBN: 978-0-620-77094-1 395
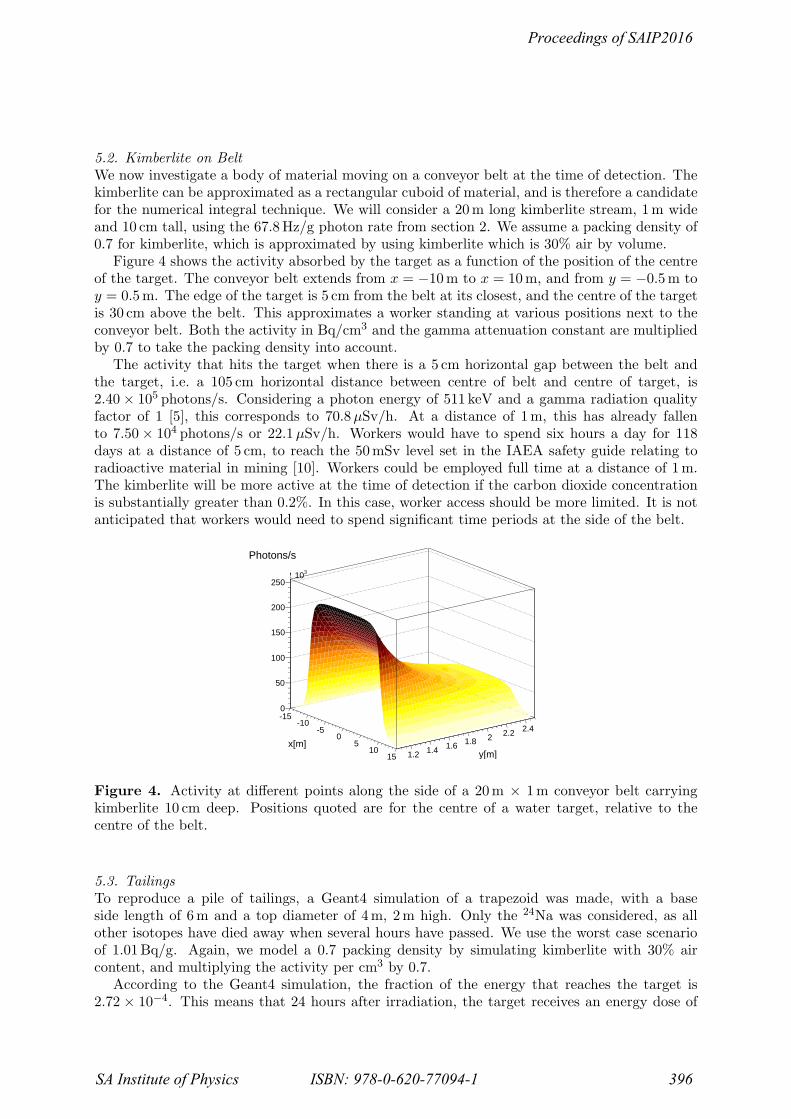
5.2. Kimberlite on BeltWe now investigate a body of material moving on a conveyor belt at the time of detection. Thekimberlite can be approximated as a rectangular cuboid of material, and is therefore a candidatefor the numerical integral technique. We will consider a 20m long kimberlite stream, 1m wideand 10 cm tall, using the 67.8Hz/g photon rate from section 2. We assume a packing density of0.7 for kimberlite, which is approximated by using kimberlite which is 30% air by volume.
Figure 4 shows the activity absorbed by the target as a function of the position of the centreof the target. The conveyor belt extends from x = −10m to x = 10m, and from y = −0.5m toy = 0.5m. The edge of the target is 5 cm from the belt at its closest, and the centre of the targetis 30 cm above the belt. This approximates a worker standing at various positions next to theconveyor belt. Both the activity in Bq/cm3 and the gamma attenuation constant are multipliedby 0.7 to take the packing density into account.
The activity that hits the target when there is a 5 cm horizontal gap between the belt andthe target, i.e. a 105 cm horizontal distance between centre of belt and centre of target, is2.40× 105 photons/s. Considering a photon energy of 511 keV and a gamma radiation qualityfactor of 1 [5], this corresponds to 70.8µSv/h. At a distance of 1m, this has already fallento 7.50× 10⁴ photons/s or 22.1µSv/h. Workers would have to spend six hours a day for 118days at a distance of 5 cm, to reach the 50mSv level set in the IAEA safety guide relating toradioactive material in mining [10]. Workers could be employed full time at a distance of 1m.The kimberlite will be more active at the time of detection if the carbon dioxide concentrationis substantially greater than 0.2%. In this case, worker access should be more limited. It is notanticipated that workers would need to spend significant time periods at the side of the belt.
-15-10
-50
510
15 1.2 1.4 1.6 1.8 2 2.2 2.4
0
50
100
150
200
250310!
x[cm]y[cm]
Photons/s
x[m]y[m]
Figure 4. Activity at different points along the side of a 20m × 1m conveyor belt carryingkimberlite 10 cm deep. Positions quoted are for the centre of a water target, relative to thecentre of the belt.
5.3. TailingsTo reproduce a pile of tailings, a Geant4 simulation of a trapezoid was made, with a baseside length of 6m and a top diameter of 4m, 2m high. Only the 24Na was considered, as allother isotopes have died away when several hours have passed. We use the worst case scenarioof 1.01Bq/g. Again, we model a 0.7 packing density by simulating kimberlite with 30% aircontent, and multiplying the activity per cm3 by 0.7.
According to the Geant4 simulation, the fraction of the energy that reaches the target is2.72 × 10−4. This means that 24 hours after irradiation, the target receives an energy dose of
Proceedings of SAIP2016
SA Institute of Physics ISBN: 978-0-620-77094-1 396
6.54 × 10⁻⁸ J/s, taking into account the fact that sodium decays are associated with the releaseof gamma rays at three different energies, 472 keV, 1369 keV and 2754 keV. This is equivalentto about 23.5µSv/h. After 72 hours, this has dropped to 2.55µSv/h. According to the ALARAprinciple of as little exposure as possible, preferably humans should not be too close to thetailings during the first day. A worker could, however, work full time near a one day old 6 mwide tailings pile and not exceed the IAEA guidelines for one year exposure.
6. ConclusionsWe have explored two techniques for finding position specific radiation exposures due to specificgeometries of radioactive material. The results for each are in close correspondence. Theattenuation model is quick to calculate, and is useful for simple geometries such as cuboids.Calculating the graph shown took seconds on a personal computer. The Geant4 simulation isfar more powerful, as it can simulate any geometry, and can easily be extended to include layersof shielding etc. The downside is that it is far more computationally intensive. A single (x, y)point from figure 3, with one million events, took 5 minutes to compute on a personal computer.The University of Johannesburg’s cluster computer [11] was therefore used to generate the graphof activity as a function of position.
In both scenarios considered, it is clear that the radiation dose levels to workers in a MinPETplant would be acceptable, in the context of a well-controlled radiation producing facility.
References[1] Ballestrero S, Bornman F, Cafferty L, Caveney R, Connell S, Cook M, Dalton M, Gopal H,
Ives N, Lee C A, Mampe W, Phoku M, Roodt A, Sibande W, Sellschop J P F, Topkin Jand Unwucholaa D A 2010 Mineral-PET: Kimberlite sorting by nuclear-medical technology12th International Conference on Nuclear Reaction Mechanisms ed Cerutti F and FerrariA (Varenna, Italy) pp 589–602
[2] Chinaka E M, Zibi Z, van Rooyen J, Connell S H and Cook M To appear in the theseconference proceedings of the 2016 South African Institute of Physics Conference
[3] Tchonang M, Cook M, Bornman F, Connell S and Ballestrero S 2013 Elemental Analysisof Kimberlite and Associated Country Rock Proceedings, 58th Annual Conference of theSouth African Institute of Physics (SAIP 2013) ed Botha R and Jili T pp 502–506ISBN 9780620628198 URL http://events.saip.org.za/getFile.py/access?resId=0&
materialId=9&confId=32
[4] Cook M 2014 Remote Detection of Light Elements Using Positron Emission Tomography(PhD Thesis : University of Johannesburg)
[5] Leo W 1994 Techniques for Nuclear and Particle Physics Experiments: A How-toApproach (Springer) ISBN 9783540572800 URL http://books.google.co.za/books?id=
hDEbAQAAIAAJ
[6] Seltzer S 1993 Rad. Res. 136 141–70
[7] Agostinelli S et al. 2003 Nuclear Instruments and Methods A 506 250–303
[8] Allison J, Amako K, Apostolakis J, Araujo H, Dubois P et al. 2006 IEEE Trans.Nucl.Sci.53 270–8
[9] Brun R and Rademakers F 1997 Proceedings AIHENP’96 Workshop, Lausanne, Sep. 1996,Nucl. Inst. & Meth. in Phys. Res. A 389 81–86 see also http://root.cern.ch/.
[10] International Atomic Energy Agency 2002 Management of radioactive waste from themining and milling of ores series No. WS-G-1.2
[11] University of Johannesburg cluster. URL http://physics.uj.ac.za/clusters
Proceedings of SAIP2016
SA Institute of Physics ISBN: 978-0-620-77094-1 397