Embed Size (px)
Citation preview

Using GC-MS analysis to study central metabolism – plant autophagy as a test
case Tamar Avin-Wittenberg
Department of Plant and Environmental Sciences
The Hebrew University of Jerusalem
12.7.2017

Energy supply and demand vary throughout plant life
Adapted from Graciet and Wellmer, 2010, Trends Plant Science.
Storage compounds Photosynthesis Degradation Supply
Demand Vegetative development & growth Flower development Seed production

Plants face many types of stresses which cause energy deprivation
Adapted from "Abiotic Stress in Plants - Mechanisms and Adaptations“ 2011


Autophagy as a model system for nutrient remobilization How to break down a big question to smaller, bite-size questions?

Autophagy Autophagy (‘self eating’) is a conserved eukaryotic mechanism for the intracellular degradation of cytoplasmic components in the lytic organelle.
Li and Vierstra, 2012, Trends Plant Sci.
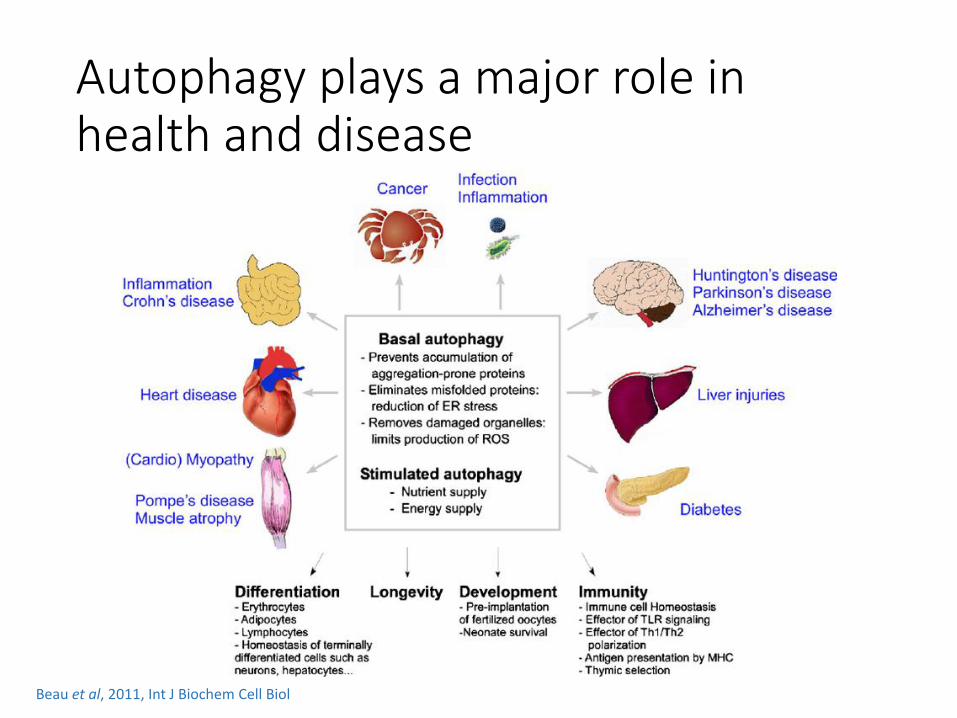
Autophagy plays a major role in health and disease
Beau et al, 2011, Int J Biochem Cell Biol

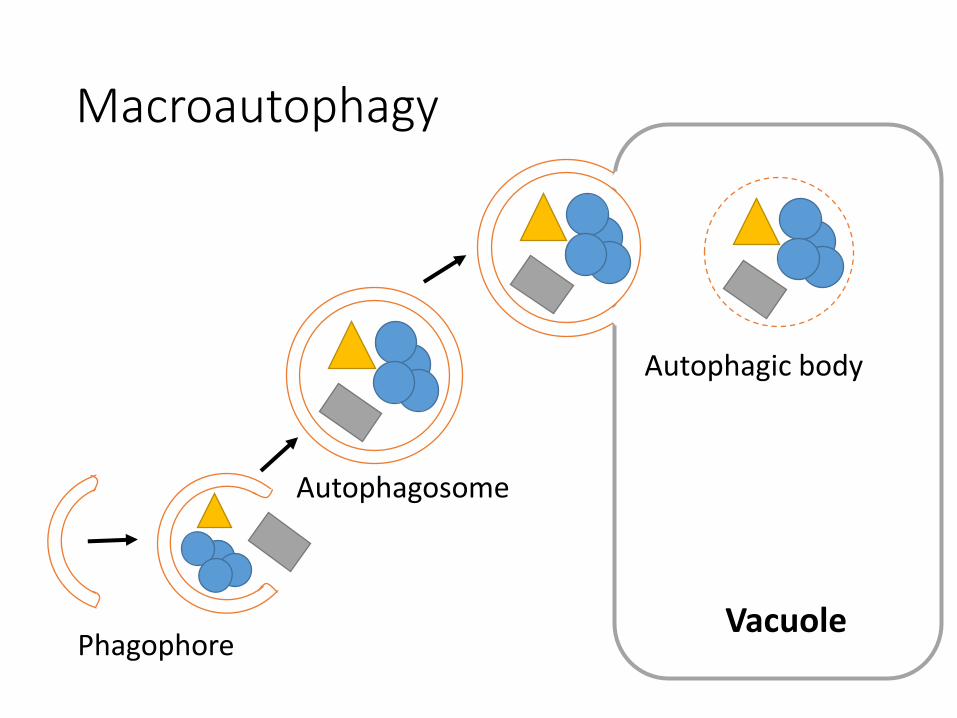
Vacuole Phagophore
Autophagosome
Autophagic body
Macroautophagy

AuTophaGy related (ATG) genes compose the autophagic machinery
Li and Vierstra, 2012, Trends Plant Sci.

The roles of autophagy in plants
Constitutively active in low levels
Induced by: Carbon and nitrogen starvation
Senescence
Abiotic stress
Biotic stress
Functions in selective degradation of proteins and organelles
Yoshimoto et al, 2004, Plant Cell
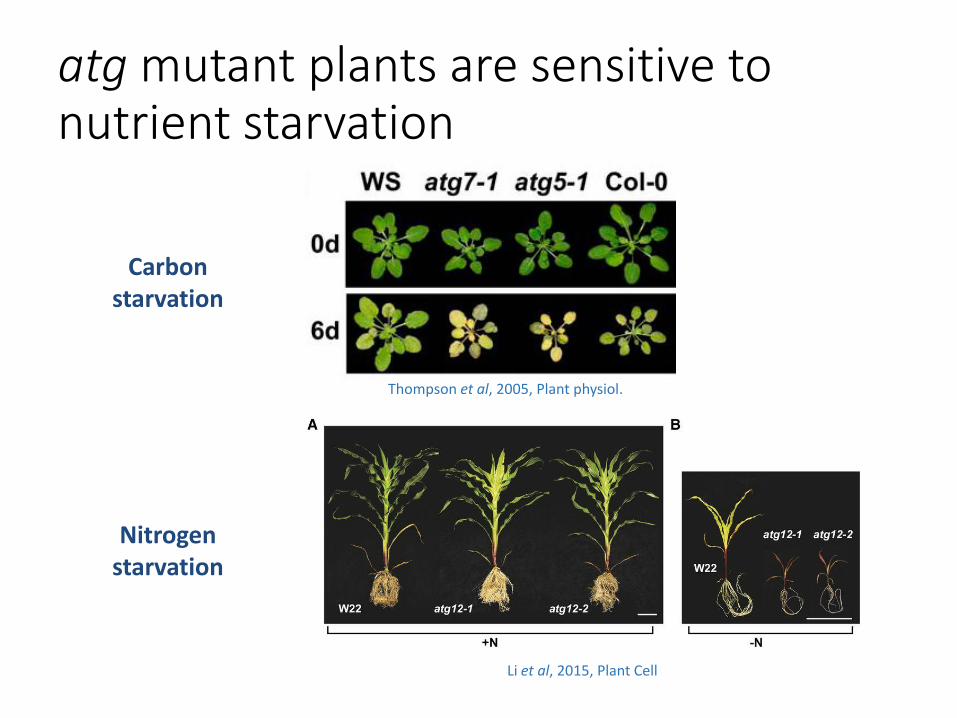
atg mutant plants are sensitive to nutrient starvation
Thompson et al, 2005, Plant physiol.
Li et al, 2015, Plant Cell
Carbon starvation
Nitrogen starvation

Li and Vierstra, 2012, Trends Plant Sci.
Aim of study: To elucidate the impact of autophagy on plant metabolism during developmental stages and stress conditions
Autophagy functions in nutrient recycling
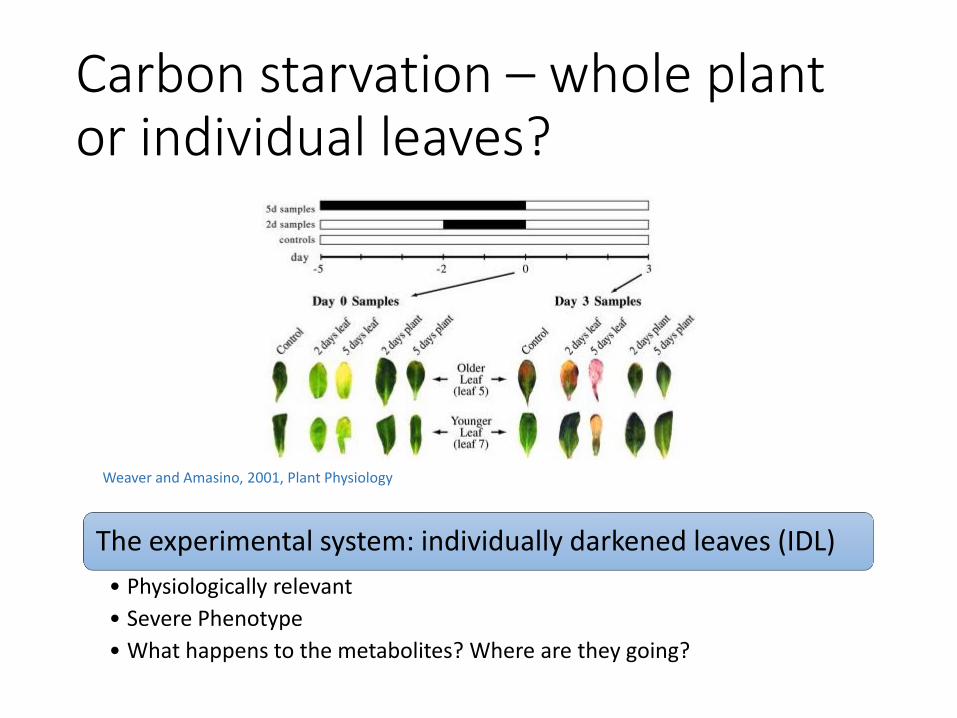
Carbon starvation – whole plant or individual leaves?
Weaver and Amasino, 2001, Plant Physiology
The experimental system: individually darkened leaves (IDL)
• Physiologically relevant
• Severe Phenotype
• What happens to the metabolites? Where are they going?

The experimental setup (IDL) -5 -3 -1 0
collection
• Lines used: wt col, atg5-1, atg5-3.
• 2 weeks in short day, 16 days in long day (starting to bolt).
• Leaves #5&6 were treated and young leaves were collected as systemic.
• 3 plants per sample, 6 biological replicates for GC-MS analysis.
Darkened
Systemic

Time for metabolomics… Is there a connection between the morphological phenotype and a metabolic phenotype?
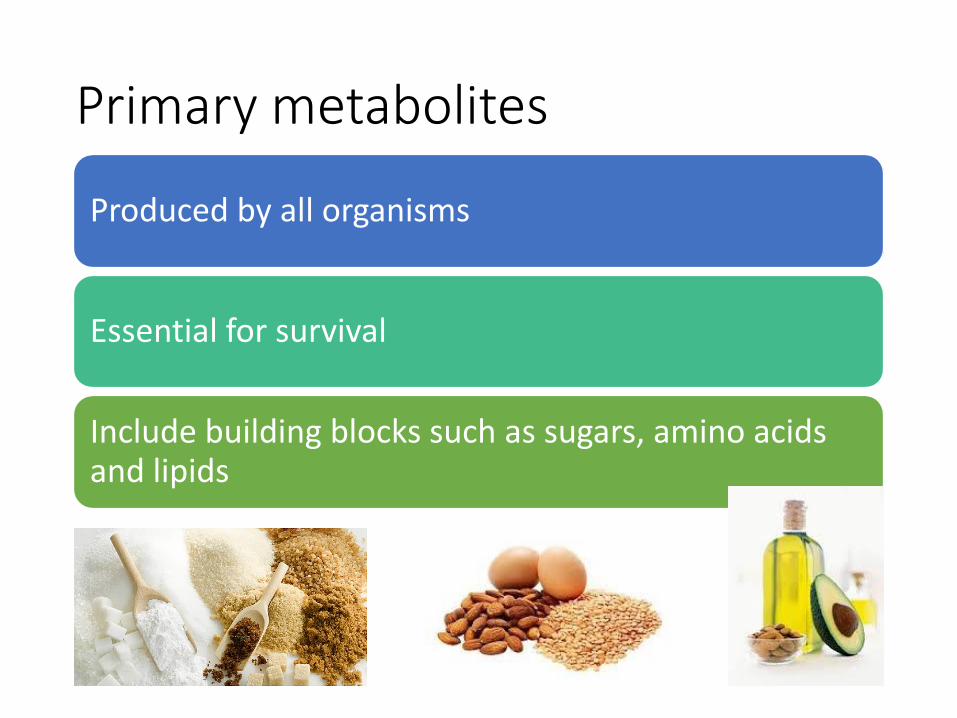
Primary metabolites
Produced by all organisms
Essential for survival
Include building blocks such as sugars, amino acids and lipids
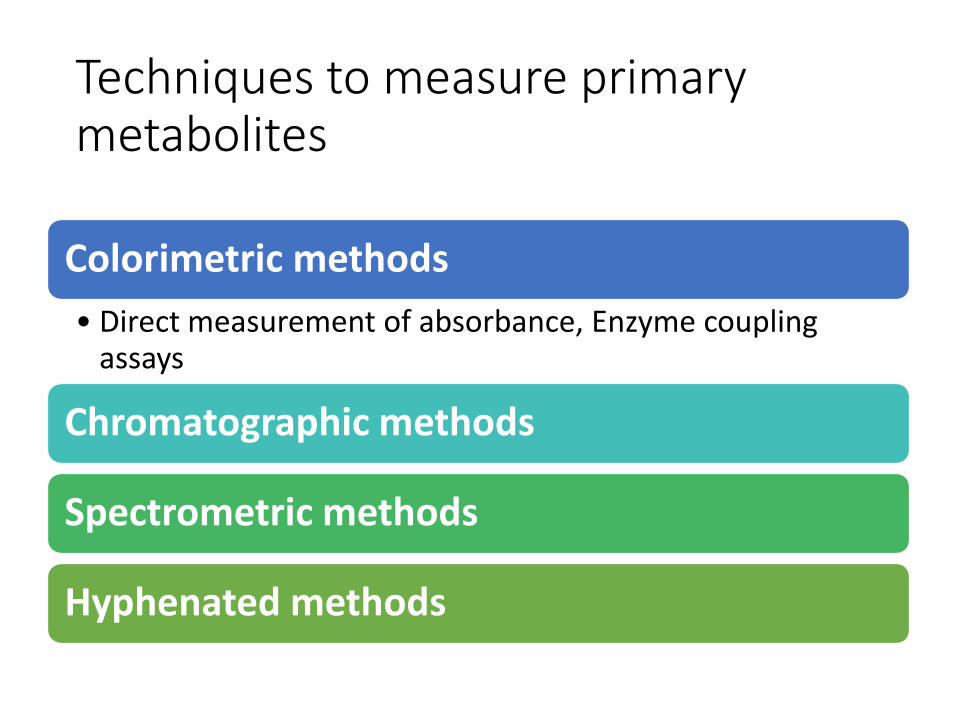
Techniques to measure primary metabolites
Colorimetric methods
• Direct measurement of absorbance, Enzyme coupling assays
Chromatographic methods
Spectrometric methods
Hyphenated methods

Gas Chromatography –Mass Spectrometry (GC-MS)

Why use the GC-MS?
Robust and high throughput analysis of 100-400 metabolites.
Suitable for low molecular weight metabolites (50-800 Da):
• Primary metabolites :sugars, sugar alcohols, organic acids, amino acids
• selected secondary metabolites
• vitamins
Largely independent of ion-suppression effects.

The steps of GC-MS analysis
Sample preparation
GC separation MS detection Evaluation &
quantification

A little bit about experimental design
Plants are sensitive to small environmental changes
• Randomize the pots/plates in the growth room
Use between 4-6 biological replicates
Plan the samples size according to the collection capacity
• Sample number doubles very easily

Sampling and Extraction
Requirements
• Fast quenching of in vivo metabolic reactions
• Fast inactivation of metabolic enzymes
• Complete extraction of metabolites
• Enrichment of target metabolites
Sample preparation
GC separation MS detection Evaluation &
quantification

Why is derivatization performed?
Halket et al, 2005, J Exp. Bot.
The problems:
In order to detect metabolites by GC-MS they need to be rendered volatile
Metabolites can come in several physical conformations, complicating the detection
The solution - two derivatization procedures:
Trimethylsilylation (TMS) – confers volatility
Methoximation – renders metabolites (derivatants) in a single conformational structure and simplifies chromatography
Sample preparation
GC separation MS detection Evaluation &
quantification

Separation by gas chromatography Two major forces:
• Volatility
• interaction with film inside the column
Sample preparation
GC separation MS detection Evaluation &
quantification

What is mass spectrometry?
The separation of ions on the basis of their mass/charge ratio
Sample preparation
GC separation MS detection Evaluation &
quantification

Metabolite identification
1000000
Retention tim
e index
Fragment (M
/Z)
Ion c
urr
ent
1320
1330
1340
1350100
200
300400
500
600
500000
AC
D
F
E
B
Every metabolite can be identified using two traits:
• Retention time index
• Mass spectra
Sample preparation
GC separation MS detection Evaluation &
quantification
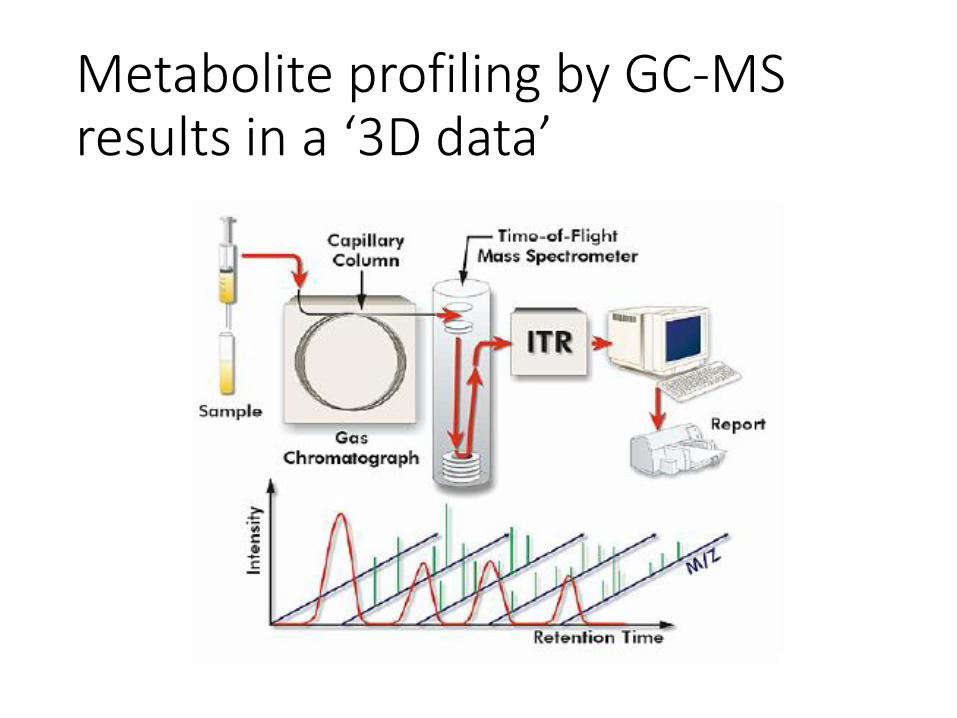
Metabolite profiling by GC-MS results in a ‘3D data’

Comparing with standard compound library data
Detected spectrum
Spectrum of standard compound
Similar RT
Sample preparation
GC separation MS detection Evaluation &
quantification
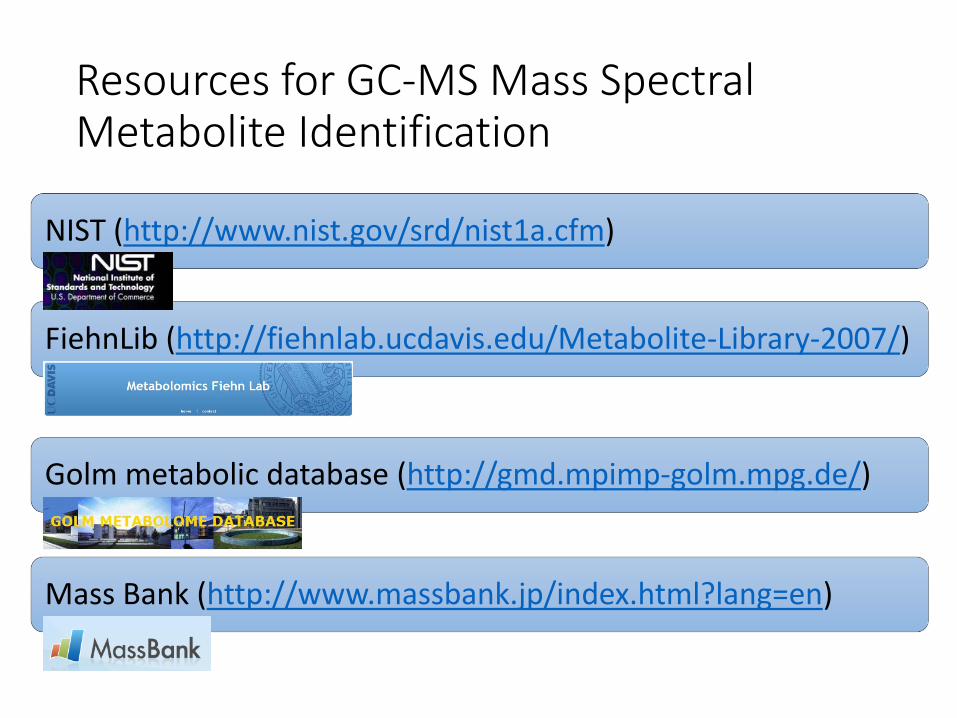
Resources for GC-MS Mass Spectral Metabolite Identification
NIST (http://www.nist.gov/srd/nist1a.cfm)
FiehnLib (http://fiehnlab.ucdavis.edu/Metabolite-Library-2007/)
Golm metabolic database (http://gmd.mpimp-golm.mpg.de/)
Mass Bank (http://www.massbank.jp/index.html?lang=en)

Chromatograms of WT and an autophagy mutant
WT atg5-1
WT
atg5-1
additional corrections:
• Normalization to internal standard
• Normalization to fresh/dry weight

Absolute quantification of metabolites
0
20000
40000
60000
80000
100000
120000
140000
160000
0 200 400 600 800 1000 1200
Fra
gm
ent count
Absolute amount (ng)
125 ng
250 ng
500 ng
1000 ng

Results of systemic leaves are not conclusive
0 1 3 5 0 1 3 5 0 1 3 5
WT atg5-1 atg5-3
0 1 3 5 0 1 3 5 0 1 3 5
WT atg5-1 atg5-3
0 1 3 5 0 1 3 5 0 1 3 5 WT atg5-1 atg5-3
Amino acids Organic acids
Sugars

The metabolic profile of dark treated leaves is affected by the treatment
4,682 -9,36
7,878
-5,42
PC1 (31,2%)
PC
2 (
19
,5%
)
atg5-3 0
atg5-1 5 atg5-1 0
WT 0
atg5-3 3
atg5-1 3
WT 5
atg5-3 1
atg5-3 5
WT 3
atg5-1 1
WT 1

The metabolic profile of dark treated leaves is affected by the treatment
0 1 3 5 0 1 3 5 0 1 3 5
WT atg5-1 atg5-3
Amino acids
0 1 3 5 0 1 3 5 0 1 3 5
WT atg5-1 atg5-3
Organic acids
0 1 3 5 0 1 3 5 0 1 3 5
WT atg5-1 atg5-3
Sugars

The metabolic profile of dark treated leaves is affected by the treatment
0 1 3 5 0 1 3 5
atg5-1 atg5-3
Amino acids
0 1 3 5 0 1 3 5
atg5-1 atg5-3
Organic acids
0 1 3 5 0 1 3 5
atg5-1 atg5-3
Sugars

The experimental system – etiolated Arabidopsis seedlings
Seeds are sown on plates with or without 1% sucrose.
The plants were germinated and grown in the dark for 5-7 days.
Why? A „closed system“
A model system for carbon starvation, a known inducer of autophagy
Physiologically relevant
Etiolation – growing a plant without light
Quail, 2002, Nat Rev Mol Cell Biol.

Autophagic flux is increased in etiolated seedlings under carbon starvation
Nakatogawa et al, 2009, Nat Rev Mol Cell Biol.
Incorporation into autophagosomes
Degradation in the vacuole
Atg8 HA GFP
Atg8 GFP
GFP
1% suc - +
Avin-Wittenberg et al, 2015, Plant Cell

autophagy mutant seedlings are shorter under carbon starvation
+1% sucrose No sucrose
* *
*
0
2
4
6
8
10
12
14
16
WT atg5-1 atg5-3 atg7-2
hyp
oco
tyl l
en
gth
(m
m)
0
2
4
6
8
10
12
14
16
WT atg5-1 atg5-3 atg7-2
hyp
oco
tyl l
en
gth
(m
m)
Avin-Wittenberg et al, 2015, Plant Cell

Some controls…
The problem:
autophagy mutants display an early senescence phenotype stemming from salicylic acid (SA) accumulation.
The solution:
crosses between autophagy mutants and SA deficient stay-green lines.
Yoshimoto et al, 2009, Plant Cell.

Preventing SA accumulation does not rescue the autophagy mutant phenotype
0
2
4
6
8
10
12
14
16
WT NahG atg5.NahG
hyp
oco
tyl l
en
gth
(m
m)
b
c
a
Avin-Wittenberg et al, 2015, Plant Cell
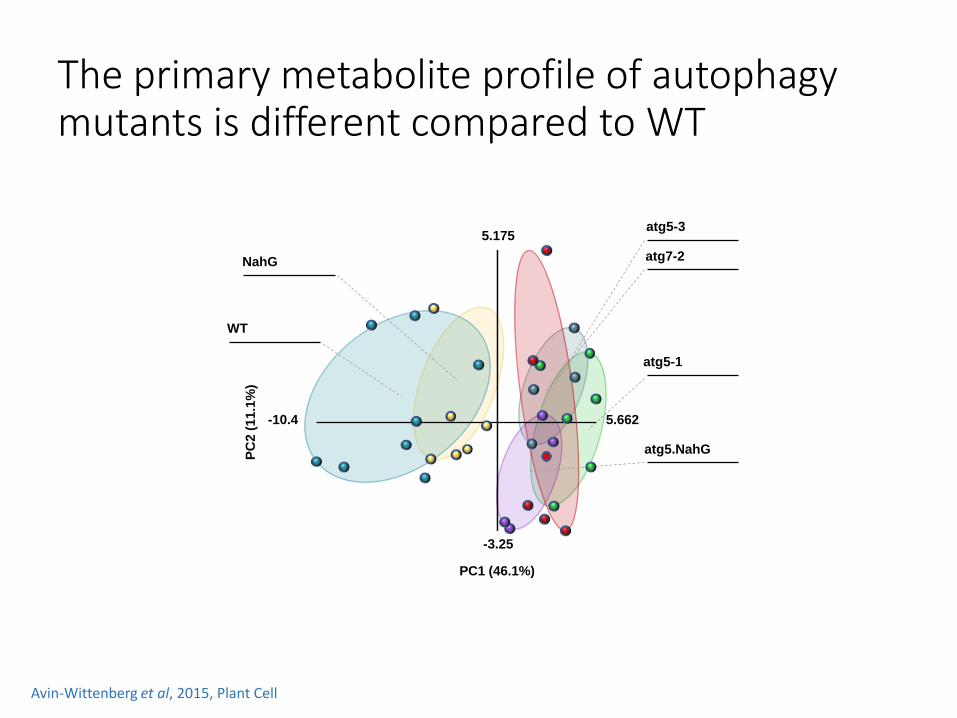
The primary metabolite profile of autophagy mutants is different compared to WT
5.662 -10.4
5.175
-3.25
PC1 (46.1%)
PC
2 (
11.1
%)
WT
atg5-1
atg5-3
atg7-2 NahG
atg5.NahG
Avin-Wittenberg et al, 2015, Plant Cell

Amino acids
Organic acids
Sugars
atg mutants have less free amino acids
Avin-Wittenberg et al, 2015, Plant Cell

Amino acids can be used as substrates for the Mitochondrial electron transport chain
Galili et al, 2014, Front Plant Sci.

atg mutants divert flux to the TCA cycle
Dark respiration
Days after transition to darkness
0 3 6 9
m
ol C
O2 m
-2 s
-1
0.0
0.2
0.4
0.6
0.8
1.0
WT
atg5-1
atg7-2
atg9-1
**
*
*
*
*
*
Barros et al, accepted for publication
WT
atg7-2
atg9-1
atg5-1
0 DAY
WT
atg7-2
atg9-1
atg5-1
9 DAY

Nutrient remobilization can be examined in several ways
Test the nutrient content under the experimental conditions – what compounds are there and how much of them?
Test nutrient flux – what is the rate in which nutrients are produced and used?

Metabolic flux analysis Metabolic flux analysis (MFA) determines in vivo rates of conversion (fluxes) through active pathways. The aim of MFA is the detailed quantification of (all) metabolic fluxes in central metabolism. Dieuaide-Noubhani Ana Alonso “Plant Metabolic Flux Analysis Methods and Protocols” 2014

Isotopic tracer labeling methods for MFA

14C feeding and fractionation
Adapted from Fernie et al, 2001, Planta
External Glucose
Internal Glucose
Hexose phosphates
Others CO2, solubles (amino acids, organic acids, other sugars) and insolubles
(proteins, starch, cell wall etc.)
14C labeled glucose
CO2
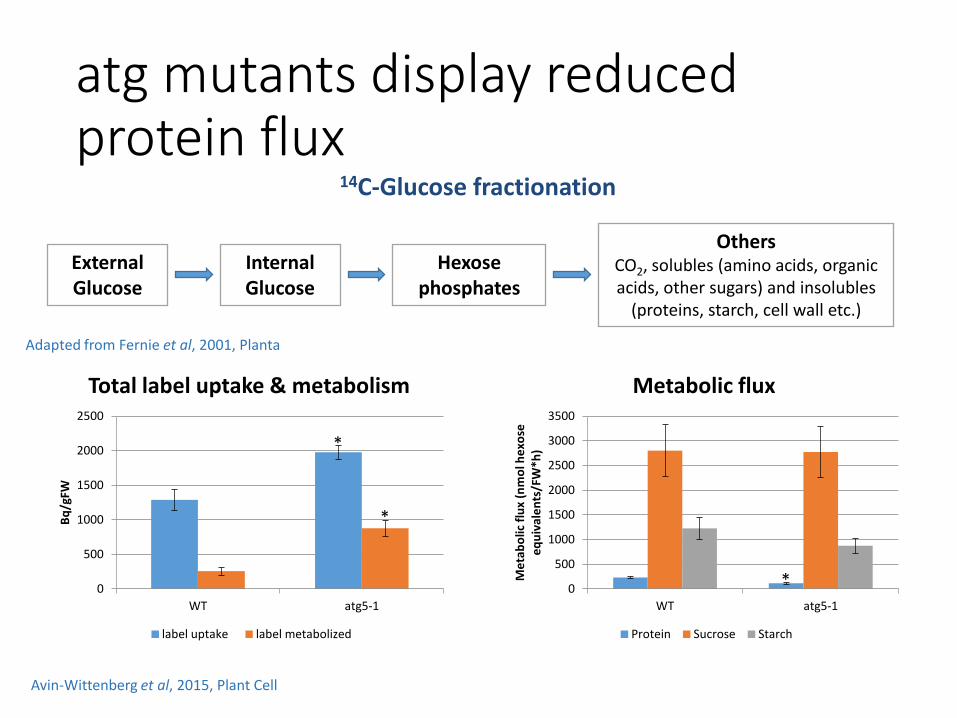
atg mutants display reduced protein flux
Adapted from Fernie et al, 2001, Planta
0
500
1000
1500
2000
2500
WT atg5-1
Bq
/gFW
Total label uptake & metabolism
label uptake label metabolized
0
500
1000
1500
2000
2500
3000
3500
WT atg5-1
Me
tab
olic
flu
x (n
mo
l he
xose
e
qu
ival
en
ts/F
W*h
)
Metabolic flux
Protein Sucrose Starch
Avin-Wittenberg et al, 2015, Plant Cell
*
*
*
External Glucose
Internal Glucose
Hexose phosphates
Others CO2, solubles (amino acids, organic acids, other sugars) and insolubles
(proteins, starch, cell wall etc.)
14C-Glucose fractionation
Detecting heavy isotopes by MS
m+0
m+1
m+2
m+3
Sign
al in
ten
sity
m/z
m+0
m+1
m+2
m+3
m/z

Types of MFA and required metabolic status
Dieuaide-Noubhani and Alonso, 2014, Method Mol Biol
Metabolic steady state
Isotopic steady state
Steady state MFA
Dynamic labelling MFA (Isotopic non-steady state MFA)
Applicable for estimation of fluxes at branch points
Isotopic steady state is required (limited application)
High resolution of fluxes
Kinetic experiment is required
Isotopic steady state is not a prerequisite
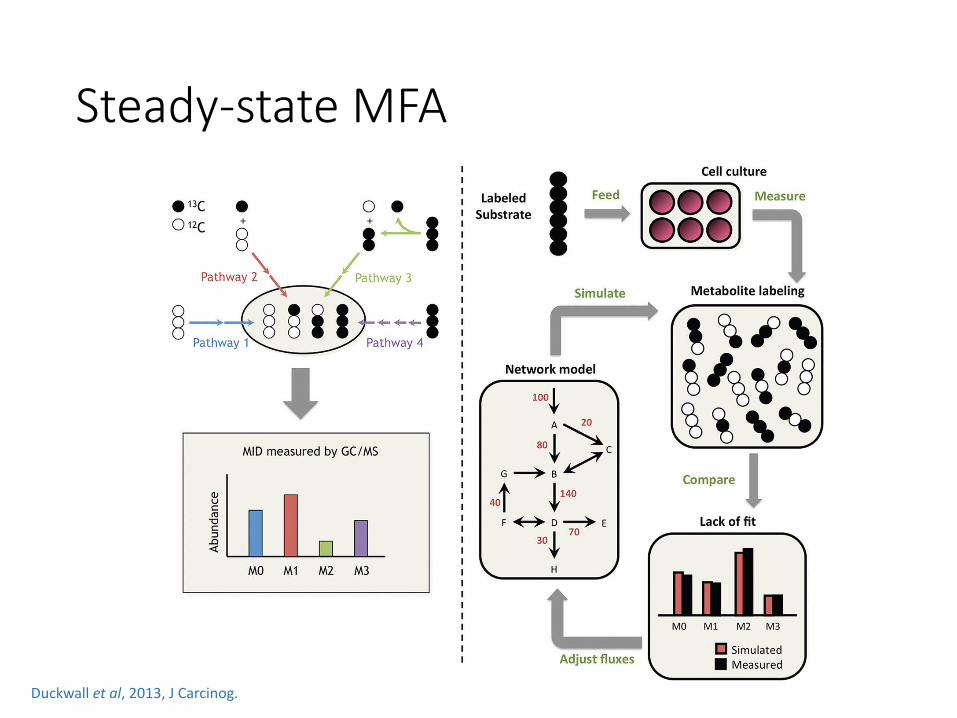
Steady-state MFA
Duckwall et al, 2013, J Carcinog.
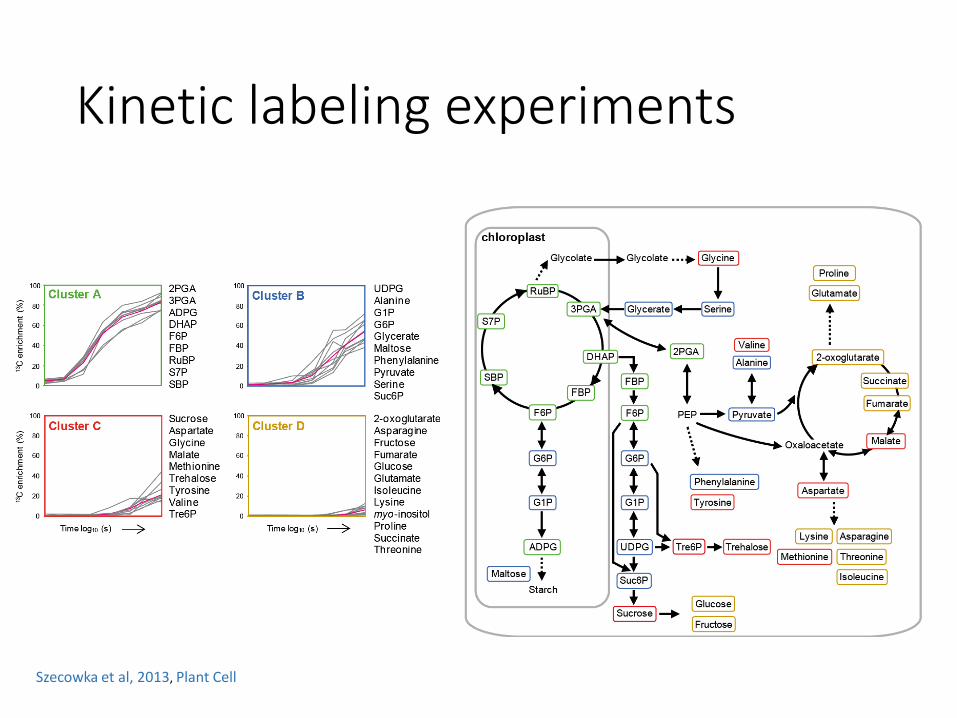
Kinetic labeling experiments
Szecowka et al, 2013, Plant Cell

Isotope labeling experiment
atg5-1 WT
13C-Lys feeding Metabolic analysis Label redistribution
- Incubation 40,80,120min - Non-treated control - 4 replicates
GC-TOF-MS
m+0
m
+1
m+2
m
+3
Sign
al in
ten
sity
m/z
m+0
m
+1
m+2
m
+3
m/z
Heavy isotope feeding

13C-Lysine feeding
Metabolic analysis Label redistribution
Autophagy mutants divert flux into the TCA cycle
13C-Lysine feeding
0
2
4
6
8
10
12
0 40 80 120 13C
su
m a
ccu
mu
lati
on
(n
mo
l/m
g)
FW)
Time (min)
Lysine
wt
atg5-1
0
0.002
0.004
0.006
0.008
0.01
0.012
0.014
0.016
0.018
0 40 80 120 13C
su
m a
ccu
mu
lati
on
(n
mo
l/m
g)
FW)
Time (min)
Glutamate
wt
atg5-1 *
*
L-lysine L-saccharopine (S)-2-amino-6-oxohexanoate L-2-aminoadipate 2-oxoadipate
glutaryl-CoA (E)-glutaryl-CoA crotonyl-glutaryl-CoA (R)-3-hydroxybutanoyl-CoA
acetoacetyl-CoA 2-acetyl-CoA
H+ NADPH
2-oxoglutarate
NADP+
H2O
NAD+
H2O H+
NADH L-glutamate
NAD+
H2O NADH
2H+
2-oxoglutarate L-glutamate
Coenzyme A NAD+
NADH
CO2
An oxidized electron-transfer flavoprotein
A reduced electron-transfer flavoprotein
H+ CO2 H2O NAD+
H+ NADH
Coenzyme A
Avin-Wittenberg et al, 2015, Plant Cell

Autophagy mutants divert flux into the TCA cycle
0
0.0002
0.0004
0.0006
0.0008
0.001
0.0012
0 40 80 120 13C
su
m a
ccu
mu
lati
on
(n
mo
l/m
g)
FW)
Time (min)
Malate
wt
atg5-1
0
0.001
0.002
0.003
0.004
0.005
0 40 80 120 13C
su
m a
ccu
mu
lati
on
(n
mo
l/m
g)
FW)
Time (min)
Aspartate
wt
atg5-1
13C-Lysine feeding
*
*
*
L-aspartate oxaloacetate (S)-malate
2-oxoglutarate L-glutamate NAD+ NADH H+
Avin-Wittenberg et al, 2015, Plant Cell

Summary
It is very important to find the right tool to answer your biological question
GC-MS analysis is a great tool to study central metabolism
A scientifically meaningful result depends on a well planned experiment
Using labeled isotopes can increase our knowledge of the metabolic flux in the system

Hila Mizrahi Noa Bibi
Nofar Pinker Kama Lee-Tal
Alisdair R. Fernie Fernie group Toshihiro Obata Takayuki Tohge Saleh Alseekh Aida Maric
Ralph Bock Gal Wittenberg
Patrick Giavalisco Krzysztof Bajdzienko
Wagner L. Araújo Jessica A. S. Barros