Embed Size (px)
Citation preview

Using Fault Trees to Analyze Safety-Instrumented Systems
Joseph R. Belland
Isograph, Inc., Irvine, USA
Abstract: Safety-instrumented systems are protection functions frequently seen in automotive,
chemical processing, and oil and gas refining systems. These functions are designed to engage in case
a hazardous condition arises and mitigate any potentially catastrophic consequences. Because of the
potential for loss of life or other safety-related risks related to these systems, safety-instrumented
systems usually have a very strict reliability requirement.
Fault Tree analysis is a method of analyzing a system to determine its reliability and identify weak
points. This method uses a qualitative and quantitative approach that graphically shows how
component failures logically combine to create system failures, and quantifies the system failure
probability using failure rate data from component failures.
Due to its powerful and flexible nature, Fault Tree analysis is an ideal method for analyzing safety-
instrumented systems to determine if they are meeting their reliability goals, to find weak points in the
design, or for focusing maintenance efforts. Fault Trees may also be used to determine the spurious
trip rate of the safety system, that is, how frequently the safety system will engage unnecessarily. This
paper will provide a guide to using Fault Tree analysis software for these purposes.
Keywords: Fault Tree Analysis, Safety-Instrumented Systems, Safety Integrity Level, Automotive
Safety Integrity Level
1. INTRODUCTION
1.1. Fault Tree Analysis
Fault Tree analysis was first developed in 1961 at Bell Laboratories to evaluate the launch control
systems of ICBMs [1]. Since then, it has become widely used in many different industries to
effectively model potential causes of system failures.
Fault Tree analysis is a deductive failure analysis which focuses on one particular undesired event and
provides a method for determining causes of this event. This undesired event, usually a hazard or
catastrophic failure, constitutes the top event in a fault tree diagram. This TOP event is connected to
basic events through intermediate logic gates. These logic gates indicate the combination of failures or
occurrences that will lead to the TOP event. In this way a fault tree is a qualitative analysis.
The basic events typically represent component failures or other hazards or events that can contribute
to the TOP event hazard. If probability values for the base events are known, Boolean algebra and
probability laws can be applied to calculate a probability value for the TOP event. In this way, Fault
Tree analysis is also quantitative.

Figure 1: An Example Fault Tree
1.2. Safety-Instrumented Systems
Critical processes or systems appear in many different industries. These processes or systems, if they
are not properly maintained or controlled, can malfunction is such a way as to cause significant risk to
safety, environmental impact, or financial loss. Examples of such critical systems may be found in the
process industry, nuclear, railway, automotive, and many others. Examples include a chemical reactor
in a refinery, a nuclear power generator, or an airbag on an automobile.
Safety-instrumented systems (SIS) are systems that are designed to lower the risk of critical processes
or systems. The SIS operates in such a way that, if the critical equipment malfunctions, the SIS will
restore the system to a safe state.
A typical SIS consists of three elements, inputs, a logic solver, and final elements [2]. The inputs
monitor the critical system, examining for unsafe or potentially unsafe conditions. The logic solver
interprets the inputs from the sensors. The final elements are typically actuators of some sort, such as
control valves, whose function is to either halt the system or process or bring it to a failsafe state.
Let us consider an example of a safety-instrumented system.
1.2.1. High-Integrity Pressure Protection System
A high-integrity pressure protection system (HIPPS) is a kind of SIS frequently seen in chemical
plants and oil refineries. It is designed to prevent an over-pressurization event of a fluid line or vessel
by shutting off the input of the fluid. Since the over-pressurization event may lead to a rupture or
explosion, this SIS is utilized in such a way to mitigate the risk of the potential hazardous
consequences.
OR
Top event(hazard)
AND
Logic gate
EV1
Basic event
EV2
Basic event
EV3
Dormantevent

The example HIPPS shown in Figure 2 consists of three pressure transmitters (PT) (the inputs), a
logic solver, and two block valves (the final elements). The PTs monitor the fluid flow, and send this
information to the logic solver. If two out of three PTs read an unsafe pressure, then the logic solver
will signal both block valves to close, shutting off the flow into the downstream equipment. The 2oo3
voting in this case is for two reasons: it provides redundancy, so a single PT dangerous failure will not
negate the entire SIS; and it prevents spurious trips or accidental engagements of the SIS when it is
not needed due to a single PT safe failure.
Figure 2: An Example HIPPS
2. EVALUATING THE PFD OF A SIS USING FAULT TREE ANALYSIS
Due to their usage in critical applications, safety-instrumented systems have a very stringent
probability of failure on demand (PFD) requirement. This requirement is usually determined by
industry standards, such as the safety integrity level (SIL) rankings defined in the IEC 61508 standard,
or the automotive safety integrity level (ASIL) rankings defined in ISO 26262 [3]. Fault Tree analysis
can calculate a PFD for a SIS, and therefore determine what SIL ranking applies to the function of the
SIS.
For the purposes of this paper, we will not explore Fault Tree calculations in mathematical rigor.
There are many useful resources—such as NUREG-0492, the U.S. Nuclear Regulatory Commission’s
Fault Tree Handbook, or IEC 61025—that describe the equations needed to solve a Fault Tree by
hand. There are also many Fault Tree analysis computer software tools that can be used to create and
evaluate a Fault Tree. For these reasons, we shall only focus on the general techniques of representing
a SIS with a Fault Tree, and leave the mathematical analysis to the computers.
2.1. Fault Tree Construction
To begin constructing the Fault Tree representation of our SIS, we must first understand the logic
symbols used in a Fault Tree diagram. Table 1 shows commonly-used Fault Tree logic symbols.

Table 1: Common Fault Tree Gate Symbols
Symbol Name Logic
OR TRUE if any input is TRUE
AND TRUE if all inputs are TRUE
VOTE TRUE if m inputs are TRUE
One primary consideration is that when a Fault Tree is used to evaluate the PFD of a SIS, it is
generally constructed using failure logic. That is, the basic events and gates represent dangerous
failures of the components and systems. This is the opposite of the logical expressions normally used
in SIS design. For instance, a 2oo4 vote arrangement in a SIS means that the system will trip if two of
the four elements meet the trip criteria. In PFD Fault Tree, a 2oo4 VOTE gate means the system will
fail to trip if two of the four elements fail to meet the trip criteria.
Once we understand the logic gates that appear in a Fault Tree, we can construct the representative
tree of our example SISs. We will start from a template. Since SISs consist of three basic
subsystems—inputs, logic solver, final elements—and the failure of any one of these three subsystems
will cause a failure of the SIS, the basic template will have an OR gate as the TOP gate, with each of
those three subsystems as inputs, as in Figure 3.
Figure 3: A Generic SIS Fault Tree
2.1.1. HIPPS PFD Fault Tree
In the HIPPS system from section 1.2.1, there are three pressure transmitters serving as the inputs to
the system. They have a 2 out of 3 vote configuration, meaning if two of the three PTs register a high
PFD
SIS faileddangerous
INPUTS LOGIC SOLVER FINAL ELEMENTS
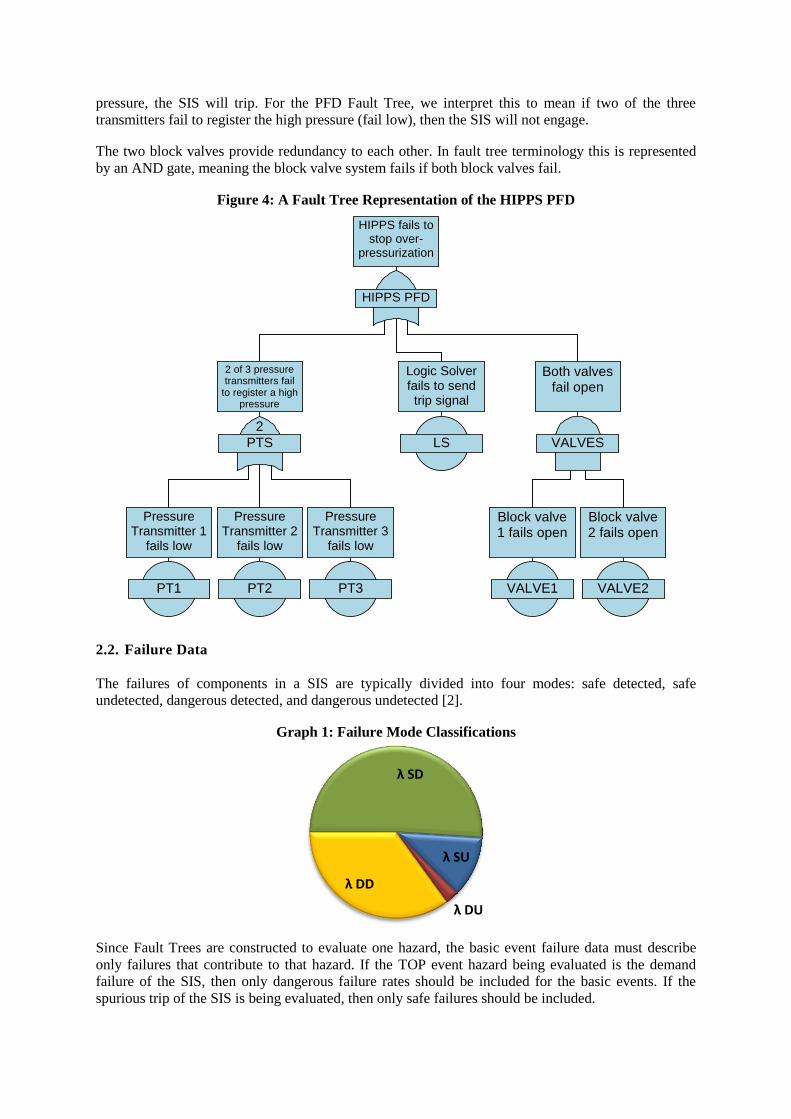
pressure, the SIS will trip. For the PFD Fault Tree, we interpret this to mean if two of the three
transmitters fail to register the high pressure (fail low), then the SIS will not engage.
The two block valves provide redundancy to each other. In fault tree terminology this is represented
by an AND gate, meaning the block valve system fails if both block valves fail.
Figure 4: A Fault Tree Representation of the HIPPS PFD
2.2. Failure Data
The failures of components in a SIS are typically divided into four modes: safe detected, safe
undetected, dangerous detected, and dangerous undetected [2].
Graph 1: Failure Mode Classifications
Since Fault Trees are constructed to evaluate one hazard, the basic event failure data must describe
only failures that contribute to that hazard. If the TOP event hazard being evaluated is the demand
failure of the SIS, then only dangerous failure rates should be included for the basic events. If the
spurious trip of the SIS is being evaluated, then only safe failures should be included.
HIPPS PFD
HIPPS fails tostop over-
pressurization
PTS
2
2 of 3 pressuretransmitters fail
to register a highpressure
VALVES
Both valvesfail open
LS
Logic Solverfails to sendtrip signal
PT1
PressureTransmitter 1
fails low
PT2
PressureTransmitter 2
fails low
PT3
PressureTransmitter 3
fails low
VALVE1
Block valve1 fails open
VALVE2
Block valve2 fails open
λ SD
λ SU
λ DU
λ DD

Some Fault Tree computer programs may require that the detected and undetected failure modes be
modeled with separate basic events. The inputs to each basic event would be the failure rate
appropriate to the failure mode it represents, e.g., λDD for the dangerous detected failure component
event and λDU for the dangerous undetected failure component event.
If imperfect proof testing is used, then it may be important to also account for the proof test coverage.
An imperfect proof test essentially splits the undetected failures into two categories: those that are
corrected after testing (λDUC) and those that remain uncorrected after testing (λDUU). Failures that are
uncorrected after proof tests will only be corrected by a replacement of the component.
Figure 5 provides an example of modeling each component failure mode with a separate basic event.
Figure 5: Failure Modes Modeled with Separate Basic Events
2.2.1. HIPPS Failure Data
For the HIPPS Fault Tree, we will use the data found in Table 2.
Table 2: HIPPS Failure Data
Component λ (per
hour)
λ Safe % DC %
(Safe)
DC %
(Dang.)
MTTR
(hours)
τ (months)
PTC% θ (years)
Pressure
Transmitter
1.1E-6 37.5 0 60 0.001 48 90 6
Logic Solver 6.1E-6 99.84 100 0 8 48 99 10
Block Valve 4.6E-6 0 0 0 0.001 24 99.5 20
Key: λ – failure rate
λ Safe % – Percent of failures that are safe detected or safe undetected
DC % (Safe) – Diagnostic Coverage percent for safe failures; the percent of safe failures that are
detected by diagnostics.
DC % (Dang.) – Diagnostic Coverage percent for dangerous failures; the percent of dangerous failures
detected by diagnostics.
MTTR – Mean Time to Repair
τ – Test interval
PTC% – Proof Test Coverage percent; the percentage of undetected failures that are uncovered and
corrected during proof testing.
θ – Replacement interval
This is characteristic of the type of data available for SIS components. However, some translation
may be needed to enter this into a Fault Tree computer program. We can use the following equations
to convert these values to data usable in a Fault Tree software tool.
COMPONENT PFD
Componentfails
dangerous
LAMBDA DD
Dangerousdetectedfailures
LAMBDA DUC
Dangerousundetected
failures, correctedby testing
LAMBDA DUU
Dangerousundetected failures,
uncorrected bytesting

(1)
(
)
(2)
(3)
(
) (
)
(4)
(
) (
)
(5)
Entering this information into a Fault Tree computer program gives us the following PFD values for
the individual components of the HIPPS system:
Table 3: HIPPS Component PFD Values
Component PFDavg
Pressure Transmitter 5.1E-3
Logic Solver 1.7E-4
Block Valve 4.2E-2
2.3. Common Cause Failures
One concern when modeling safety-instrumented systems is the occurrence of common cause failures
(CCF). A common cause failure is the failure of more than one component due to a single cause. This
single-point failure affecting multiple components can be due to a variety of issues, such as
environmental stresses (temperature, humidity), improper maintenance and testing, manufacturing
defects, incorrect installation or calibration, or other similar causes.
The effect of CCFs on a SIS is to negate some of the benefits of redundancy. Redundant components
are intended to provide extra protection against failures. However, if redundant components carry the
risk of simultaneous failure, this protection is reduced.
Generally, Fault Tree methodology assumes independence amongst the basic events. That is, the
assumption of a Fault Tree model is that the occurrence of one basic is independent of the occurrence
of any other. This is opposite to how CCFs affect the system.
For this reason, CCFs must be explicitly accounted for when constructing a Fault Tree model of a SIS.
The standard way to accomplish this is to add a new basic event representing the common cause
failure of the components to the Fault Tree. See Figure 6 for an example.
Some Fault Tree software tools may allow implicit inclusion of CCFs. In these programs, the user
would flag certain basic events as belonging to a common cause group. The Fault Tree program
would then automatically perform the correct calculations, accounting for the loss of redundancy due
to CCFs.
Figure 7 demonstrates how this might be accomplished in a Fault Tree tool. In this example, COMP1
and COMP2 are both flagged as sharing a CCF event.
Quantitatively, input failure data for the CCF basic event must also be accounted for. The most
common method of accomplishing this is the beta factor model. The beta factor essentially represents
the percentage of failures of the components that are due to common causes. So for example, a beta
factor of 0.05 would mean that 5% of the component failures are due to common causes.

We can calculate the independent and common cause failure rates using equations (6) and (7). These
values would then be used in equations (1) and (2) for calculating the failure mode rates.
(6)
(7)
Figure 6: A Fault Tree Model of a Common Cause Failure
Figure 7: Implicit Inclusion of Common Cause Failures
SYS
Systemfailure
IND
Bothcomponents failindependently
COMP CCF
Componentsfail due to
CCF
COMP1 IND
Component 1independent
failure
COMP2 IND
Component 2independent
failure
SYS2
Systemfailure
COMP1
Component1 failure
COMP CCF
COMP2
Component2 failure
COMP CCF

2.4. Logic before Average versus Average before Logic
One final consideration when using Fault Tree analysis methods to evaluate a SIS is the effect of
averaging component PFD values before applying system logic. Standard Fault Tree methodology
works by first calculating a PFDavg for each basic event, then combining those averages using the
multiplication and addition laws of probability. This can create a discrepancy with other SIS
evaluation methods, which first apply the system logic, then calculate a PFDavg.
For instance, the equation for calculating the PFDavg of a 1 out of 2 voted configuration is given in the
IEC 61508-6 standard as [4]:
[ ] [ ] (
) (8)
Where
(
)
(9)
(
)
(10)
Using the failure data for the block valve from Table 2, and applying β and βD values of 0.05, yields a
PFDavg of 3.969E-3. However, using standard Fault Tree methodology on the same data yields PFDavg
of 3.348E-3, which is only 84% of the IEC 61508-6 calculation. The reason for this discrepancy is
because for a function f(x),
(11)
If a computer program is being used to evaluate the Fault Tree, then this discrepancy can be accounted
for with sophisticated computer algorithms. For instance, that same Fault Tree, when evaluated in a
program with a compensating algorithm, yields a PFDavg of 3.913E-3, which differs from the IEC
61508-6 calculation by less than 1.5%.
2.5. HIPPS Final Analysis
Entering all this information into a Fault Tree computer program, using a beta factor of 5% for the
pressure transmitters and block valves yields the final results shown in Table 4.
Table 4: HIPPS Reliability Metrics
PFDavg λ (/hour) MTBF (hours) RRF
4.7E-3 6.193E-7 1,622,000 212.8
This qualifies the system as a SIL-2 ranking, pending review of the architectural constraints.
3. EVALUATING THE SPURIOUS TRIP RATE OF A SIS USING FAULT TREE
ANALYSIS
When evaluating a SIS, it is often important to also consider the safe failures of the system [2]. These
safe failures are sometimes referred to as spurious trips, and occur when the safety system engages
unnecessarily, when there was no hazardous condition for the safety system to mitigate. An
unnecessary trip of the safety system may also carry a hazard risk with it. For instance, if the airbag
on a vehicle deploys when no collision occurred, then it may cause the driver to lose control of the
vehicle.
Usually, the relevant reliability metric for spurious trips is mean time to failure, or MTTFspurious.

3.1. Construction
The logic used to construct a spurious trip evaluation Fault Tree is usually the reverse of that used in
the PFD evaluation tree. This is because, if a system is built with redundancy such that 2 out of 2
failures must occur to cause the PFD hazard, then usually 1 of the 2 elements tripping spuriously will
cause the system to engage. For this reason, all gates except the TOP gate are logic-swapped. AND
gates become OR gate and vice versa. Generally, the reverse of m out of n vote logic is out
of n.
Likewise, instead of using the dangerous failure rates, safe failure rates are used to calculate
component failures. This is accomplished by modifying equations (3),(4), and (5) with the safe failure
rates.
3.1.1. HIPPS Spurious Trip Fault Tree
Applying the rules above, we can construct a Fault Tree to model the spurious trips of the HIPPS and
obtain an MTTFspurious.
Figure 8: HIPPS Spurious Trip Fault Tree
Since the only failure mode of the block valves is the dangerous failure—they cannot fail safe
(closed)—the events could be removed from the tree.
Table 5: HIPPS Spurious Trip Calculations
Spurious trip rate (/hour) MTTFspurious (hours)
6.165E-6 162,200
HIPPS SPURIOUS
HIPPSengages
unnecessarily
PTS
2
2 of 3 pressuretransmitters
falsely registerhigh pressure
VALVES
Valve systemengages
unnecessarily
LS
Logic Solverfails to sendtrip signal
PT1
PressureTransmitter 1
fails high
PT2
PressureTransmitter 2
fails high
PT3
PressureTransmitter 3
fails high
VALVE1
Block valve 1fails closed
VALVE2
Block valve 2fails closed

4. OPTIMIZATION
There are many advantages to using a computerized Fault Tree to analyze SISs. For instance, the
computer can analyze the tree more quickly and the tree can easily be modified to consider alternative
designs or maintenance plans. This can be very useful when trying to optimize the SIS.
4.1. Importance Analysis
One place to begin any attempt at optimization would be with an importance analysis. Importance
analysis considers each basic event’s contribution to the TOP gate hazard, and ranks the events by the
percent of hazardous failures that are contributed to, at least in part, by each event. This is done quite
simply by analyzing the tree, assuming that the event never occurs, and then comparing this result
with the normal results. The importance results for the HIPPS PFD tree are given in Graph 2.
Graph 2: HIPPS Importance Rankings
The block valve system accounts for 89% of the HIPPS demand failures, indicating that any attempt
at improving the reliability should start there.
4.2. Sensitivity Analysis
Another method of optimizing a SIS that can easily be done by computer is sensitivity analysis. In this
analysis method, a basic event input parameter, such as failure rate or test interval, is modified and the
effects on the system reliability are recorded. This will show, for example, the impact of using a more
reliable component or the effects of different test intervals.
Table 6 shows the impact on the HIPPS PFD with respect to changes in the test interval of the block
valves. Using sensitivity analysis in this way, we could look for the test interval that would give us a
target reliability goal.
Table 6: HIPPS PFD Sensitivity Analysis
τ (months) 4 6 8 12 18 24
PFDavg 1.028E-3 1.274E-3 1.547E-3 2.174E-3 3.314E-3 4.700E-3
0
0.1
0.2
0.3
0.4
0.5
0.6
0.7
0.8
0.9
1
Block valves Pressuretransmitters
Logic solver

5. CONCLUSION
Fault Tree analysis is a useful tool in the reliability engineers tool belt to analyze safety-instrumented
systems. It can help calculate the probability that the SIS will not perform its required function on
demand, and thus determine the safety integrity level of the system. It can also be used to calculate
how frequently the safety system will engage unnecessarily (the spurious trip rate). Many Fault Tree
computer programs exist and using these can help the reliability engineer optimize the design or
maintenance planning of the SIS. Those interested in more information about the quantitative cut set
methodology used in Fault Tree analysis are encouraged to seek out additional resources or
investigate software packages to see how this technique can meet their needs.
References:
[1] C. Ericson, "Fault Tree Analysis - A History," Proceedings of the 17th International System Safety
Conference, 1999.
[2] International Society of Automation, ISA-TR84.02-2002: Safety Instrumented Functions — Safety
Integrity Level Evaluation Techniques, North Carolina: ISA, 2002.
[3] International Organization for Standardization, ISO 26262-5:2011: Road Vehicles — Functional
Safety — Part 5: Product Development at the Hardware Level, Geneva: ISO, 2011.
[4] International Electrotechnical Commission, IEC 61508-6: Functional Safety of
Electrical/Electronic/Programmable Electronic Safety-Related Systems, Geneva: IEC, 2000.