Embed Size (px)
Citation preview

ECONOMIC GROWTH CENTER
YALE UNIVERSITY
P.O. Box 208629New Haven, CT 06520-8269
http://www.econ.yale.edu/~egcenter/
CENTER DISCUSSION PAPER NO. 909
Using Experimental Economics to MeasureSocial Capital and Predict Financial Decisions
Dean S. KarlanYale University
andPrinceton University
April 2005
Notes: Center Discussion Papers are preliminary materials circulated to stimulate discussions and criticalcomments.
I thank anonymous referees, Abhijit Banerjee, Dora Costa, Angus Deaton, Esther Duflo, BenJones, Daniel Kahneman, David Laibson, Sendhil Mullainathan, Stephen Smith and seminarparticipants at the LSE/Cornell/MIT Development, Behavioral and Public Finance Conference,2003 AAEA Conference, Columbia University, Middlebury College Field ExperimentsConference, George Washington University, University of British Columbia, PrincetonUniversity Economics Department, Princeton University Psychology Department, DartmouthCollege, MIT, Grupo de Análisis para el Desa rrollo (GRADE), the LACEA 2002 Conference,and the NEUDC 2002 Conference. Thanks to the Lanaos from FINCA-Peru and to TomokoHarigaya, Alcides Medina, Fatima Oriundo, Jeny Yucra for research assistance and field work.The research reported herein was supported by the Social Science Research Council, the RussellSage Foundation, the MIT George Shultz Fund, and the Center for Retirement Research at BostonCollege pursuant to a grant from the Social Security Administration. All views and errors are myown. Karlan: Economic Growth Center, Yale University, PO Box 208269, New Haven, CT 06520(e-mail: [email protected]); Department of Economics and Woodrow Wilson School ofPublic and International Affairs, Princeton University, Princeton, NJ 08544 (e-mail:[email protected]).
This paper can be downloaded without charge from the Social Science Research Network electroniclibrary at: http://ssrn.com/abstract=706501
An index to papers in the Economic Growth Center Discussion Paper Series is located at: http://www.econ.yale.edu/~egcenter/research.htm
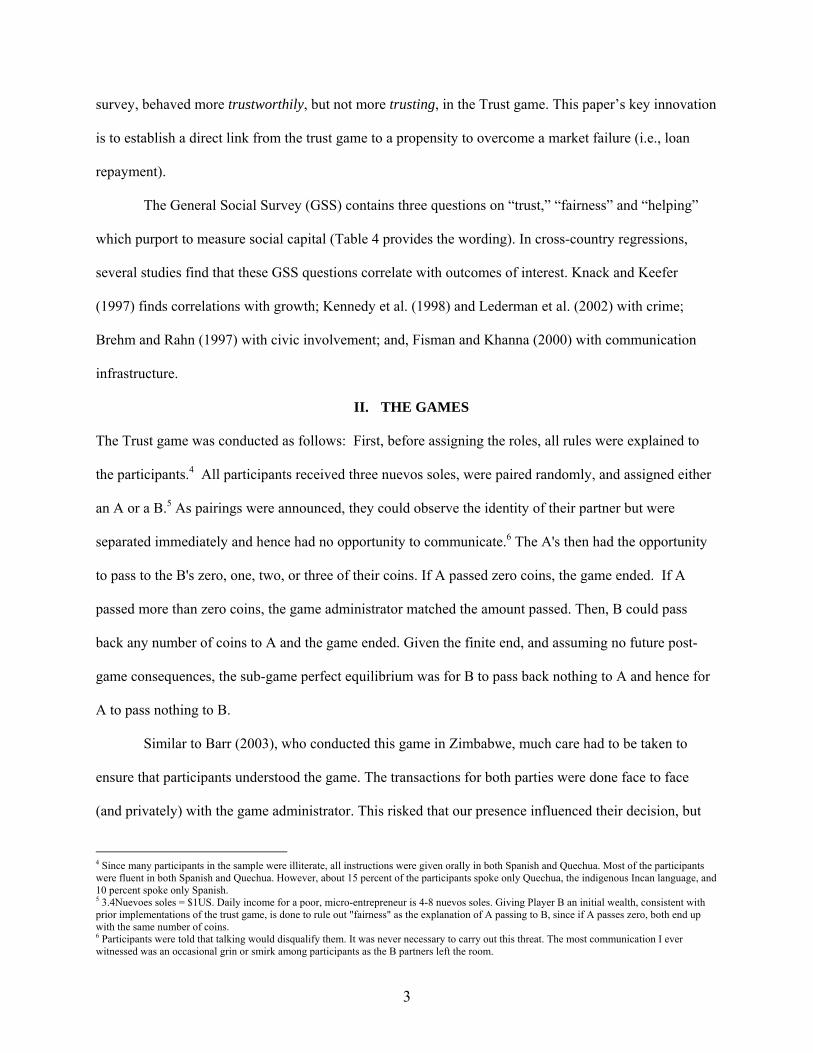
Using Experimental Economics to Measure Social Capitaland Predict Financial Decisions
Dean S. Karlan
Abstract
Questions remain as to whether results from experimental economics games are generalizable to
real decisions in non-laboratory settings. Furthermore, important questions persist about whether
social capital can help solve seemingly missing credit markets. I conduct two experiments, a
Trust game and a Public Goods game, and a survey to measure social capital. I then examine
whether behavior in the games predicts repayment of loans to a Peruvian group lending
microfinance program. Since the structure of these loans relies heavily on social capital to
enforce repayment, this is a relevant and important test of the games, as well as of other
measures of social capital. I find that individuals identified as "trustworthy" by the Trust game
are in fact less likely to default on their loans. I do not find similar support for the Trust game as
a measure of trust.
JEL Codes: B4, C9, D8, O1
Keywords: trust game, experimental economics, microfinance

1
Economic theory suggests that market failures arise when contracts are difficult to enforce or
observe. Social capital can help solve these failures. The more individuals trust each other, the more able
they are to contract with each other.1 Hence, many believe trust is a critical input for both macro- and
microeconomic outcomes. The Trust game has become a popular tool, with many researchers conducting
it in both university laboratories and field locations in developing countries (Abigail M. Barr, 2003, Joyce
E. Berg et al., 1995, Edward L. Glaeser et al., 2000). These studies have found that behaviors in the Trust
game correlate intuitively with individual attitudes and the relationships between players. However, these
are not the outcomes of real interest, but rather proxies (or correlates) for the ability to overcome market
failures and complete otherwise difficult to enforce contracts.
Historically, experimental economics has limited itself to testing theories in a controlled,
laboratory environment, where behavior in the game is the outcome of interest. Exceptions exist, but are
limited.2 The Trust game presents an excellent opportunity to examine whether experimental economic
games can predict non-laboratory decisions. The game is conducted between two players and an
administrator, and purports to measure how much one player (A) trusts another player (B) and how
trustworthy Player B is with respect to Player A.
This paper tests these characterizations: I conduct the game with borrowers in a Peruvian
microcredit program, Foundation for International Community Assistance (FINCA). I find that Player B’s
identified as trustworthier in the game are more likely to repay their loans one year later. However, I find
that Player A’s identified as more "trusting" save less and have higher repayment problems. I put the
term "trusting" in quotes specifically because this paper calls into question whether Player A's behavior in
the game is driven by trust or merely a propensity to gamble.
Many studies have found that answers to the General Social Survey (GSS) questions on trust,
fairness, and helping others correlate as predicted with real financial outcomes. I also examine whether
1 See Sobel (2002) for a review of the social capital literature. 2 Binswanger (1980) and Binswanger and Sillers (1983) used hypothetical risk questions and actual lotteries with significant payouts to predict agricultural decisions. More recently, Roth et al. (1991), Henrich et al. (2001), and Barr (2003) have conducted experiments in the field and mapped findings to predictions from anthropological research. Ashraf, Karlan and Yin (2004) uses time discounting questions to identify hyperbolic individuals, and finds them to exhibit a preference for a commitment savings product. [Fehr]

2
these GSS survey questions can predict real financial decisions on a micro-level, and they do. More
positive answers to the GSS questions predict higher repayment and higher savings. In a third test, I find
that individuals who contribute more in a Public Goods game are no more likely (or less likely) to repay
their loans. The current literature examines the link between the GSS questions and the Trust game, and
the GSS questions and real-life outcomes or decisions. This paper completes the circle by linking the
Trust game directly to real-life decisions.
This project also provides insight into the determinants of default and savings for participants in a
group banking project for the poor. Karlan (2004) finds that social connections, measured by geographic
proximity and cultural similarity, cause lower default and higher savings due to improved monitoring or
enforcement of group lending contracts. This paper finds support for an even simpler (albeit not
contradictory) explanation of default: some individuals are fundamentally not trustworthy.
This paper proceeds as follows: Section II discusses the literature on measuring trust and
trustworthiness. Section III presents the games. Section IV presents the institutional setting of the lending
and savings organization and the data. Section V presents the determinants of behavior in the games.
Section VI presents the predictions of future financial decisions. Section VII concludes.
I. MEASURING SOCIAL CAPITAL
Social capital can be construed on a group level (James S. Coleman, 1990, Robert D. Putnam, 2000) or on
an individual level (Edward L. Glaeser et al., 2002). This paper examines whether experimental
economics can be used to measure individual-level social capital. Individual-level social capital can be
defined as the social skills and networks that enable an individual to overcome imperfect information
problems and form contracts with others3. Trust and trustworthiness are two critical traits encompassed by
individual social capital. Glaeser et al. (2000) finds the Trust game to correlate with history of prior
interaction and cultural similarity, and also finds that more trusting individuals, as identified by the GSS
3 Also see Fukuyama (1995), and Ostrom (1990) for work on social capital frameworks. See Krishna and Shrader (2000), and Grootaert and van Bastelaer (2001) for discussions on measuring social capital.
3
survey, behaved more trustworthily, but not more trusting, in the Trust game. This paper’s key innovation
is to establish a direct link from the trust game to a propensity to overcome a market failure (i.e., loan
repayment).
The General Social Survey (GSS) contains three questions on “trust,” “fairness” and “helping”
which purport to measure social capital (Table 4 provides the wording). In cross-country regressions,
several studies find that these GSS questions correlate with outcomes of interest. Knack and Keefer
(1997) finds correlations with growth; Kennedy et al. (1998) and Lederman et al. (2002) with crime;
Brehm and Rahn (1997) with civic involvement; and, Fisman and Khanna (2000) with communication
infrastructure.
II. THE GAMES
The Trust game was conducted as follows: First, before assigning the roles, all rules were explained to
the participants.4 All participants received three nuevos soles, were paired randomly, and assigned either
an A or a B.5 As pairings were announced, they could observe the identity of their partner but were
separated immediately and hence had no opportunity to communicate.6 The A's then had the opportunity
to pass to the B's zero, one, two, or three of their coins. If A passed zero coins, the game ended. If A
passed more than zero coins, the game administrator matched the amount passed. Then, B could pass
back any number of coins to A and the game ended. Given the finite end, and assuming no future post-
game consequences, the sub-game perfect equilibrium was for B to pass back nothing to A and hence for
A to pass nothing to B.
Similar to Barr (2003), who conducted this game in Zimbabwe, much care had to be taken to
ensure that participants understood the game. The transactions for both parties were done face to face
(and privately) with the game administrator. This risked that our presence influenced their decision, but
4 Since many participants in the sample were illiterate, all instructions were given orally in both Spanish and Quechua. Most of the participants were fluent in both Spanish and Quechua. However, about 15 percent of the participants spoke only Quechua, the indigenous Incan language, and 10 percent spoke only Spanish. 5 3.4Nuevoes soles = $1US. Daily income for a poor, micro-entrepreneur is 4-8 nuevos soles. Giving Player B an initial wealth, consistent with prior implementations of the trust game, is done to rule out "fairness" as the explanation of A passing to B, since if A passes zero, both end up with the same number of coins. 6 Participants were told that talking would disqualify them. It was never necessary to carry out this threat. The most communication I ever witnessed was an occasional grin or smirk among participants as the B partners left the room.

4
provided us the opportunity to confirm that each individual understood the rules.
Table 1a and 1b show the basic actions chosen by Player A and Player B conditional on Player
A’s action. As an investment, passing is a bad idea on average: if Player A passes one coin, she can
expect 0.89 back; two coins yield 1.71 and three coins yield 2.53.7 The basic results of the game are
consistent with prior implementations of similar games in many respects. In all implementations, a
significant portion of players contributed more than zero, the subgame perfect equilibrium.
A Public Goods game also was conducted with the same participants, in 41 groups. Each group
contained individuals who participate in the group lending and savings program together. Group size
varied from 9 to 29 based on attendance to the microfinance meeting the day of the game. The Public
Goods game typically was played before the Trust game, but the results were not revealed until after the
participants had played the Trust game.8 All rules were explained publicly, but with no opportunity to
discuss the game. Each participant was given one coin. Privately, each individual then either gave the
administrator back the coin or did not. If the administrator received 80 percent or more of the coins back,
then everyone was given two coins. Group contribution rates ranged from 55.6 to 100 percent and
averaged 80.7%.
III. THE INSTITUTIONAL SETTING AND THE DATA
A. FINCA
The games were conducted with 864 members of FINCA, a non-profit “village banking” organization in
Ayacucho, Peru.9 FINCA provides four-month loans to groups of 30 poor women to help them expand
their individual small businesses. 10 FINCA also encourages them to save (although the savings serve as
collateral for the group loans). Although each individual has her own loan, each is also ultimately
responsible for the repayment of the others as well. Everyone borrows at the same time, and nobody can
get a new loan until all prior loans are paid in full. Women meet weekly at the FINCA office to make loan
7 Furthermore, the percentage returned by B does not predict how much A passes. Hence, A is not “savvy” in simply knowing which B’s will return and which will not. These results are not shown, but are available upon request. 8 This was done to mitigate interaction and learning effects between the two games. 9 See Karlan (2004) for more details on FINCA, how it creates groups and the lending and savings contracts. 10 Typical businesses are retail, such as selling clothing, food or other household goods from stalls in street markets.
5
payments and savings deposits. Each weekly payment includes interest, 1/16th of the original loan
principal, a mandatory savings deposit of 1/80th of the original loan principal, and lastly any additional
voluntary deposits (which also are held as collateral for their loan and the loans of others). The
accumulated savings are not held by FINCA; rather, the women lend the money back out to themselves.
In this sense, the savings component is similar to a rotating savings and credit association (ROSCA).11
FINCA encourages clients to save, and these savings are at risk with their peers. Hence, to save with
FINCA is to trust your peers to repay their loans. If a client defaults, the group takes the savings of that
client and also typically bars the client from further participation. Exceptions occur. In the weekly
meetings, FINCA employees explicitly encourage clients to develop solidarity, both to enhance their
social capital as well as to monitor and enforce the loans.
Many individual clients (14 percent of individuals in this sample) do not borrow the maximum
allowed, and in fact maintain larger savings than debt balances. The interest rate paid on the loans is
significantly higher than the interest earned on the savings (96 percent annually versus 9 percent annually,
on average). This behavior is difficult to explain. Qualitative data suggest three stories dominate: (1)
mental accounting: these savings are designated for a particular purpose or sense of security, (2) a
commitment: the required repayment effectively commits the individual to invest the cash rather than
consume it (Carol C. Bertaut and Michael Haliassos, 2002, David Laibson et al., 2002), and (3)
individuals value the option of future leverage. Regardless of the motivation, these individuals have not
maximized their debt, and for this reason I label them as financially “cautious.” I will examine whether
individuals who do not maximize their debt behave distinctly in the Trust game.
B. The Data
The data come from three sources: an individual survey conducted privately, an individual survey
conducted publicly, and financial savings and loan data. A private fifteen-minute survey was conducted
with each individual, typically before the game was played. The second survey was conducted publicly
11 See Besley, Coate and Loury (1993) for a description and analysis of ROSCAs.

6
with the whole group on questions about the existing and prior relationships between individuals in a
group. Since the answers to these questions were known to many, this process elicited more truthful
answers and ensured that questions were answered consistently. Third, one year after playing the game I
gathered the savings and loan outcome data. Table 2 presents summary statistics.
IV. DETERMINANTS OF BEHAVIOR IN THE GAMES
A. The Trust Game
The analysis consists of two parts. First, I test what predicts behavior in the Trust game both for Player A
and for Player B. For the Trust game, the dependent variable for Player A is the percentage of the three
coins that were passed by Player A to Player B. For Player B the dependent variable is the percentage of
the coins received that were passed back to Player A. The typical interpretation of the Trust game labels
Player A's behavior as "trust" and Player B's behavior as "trustworthy."
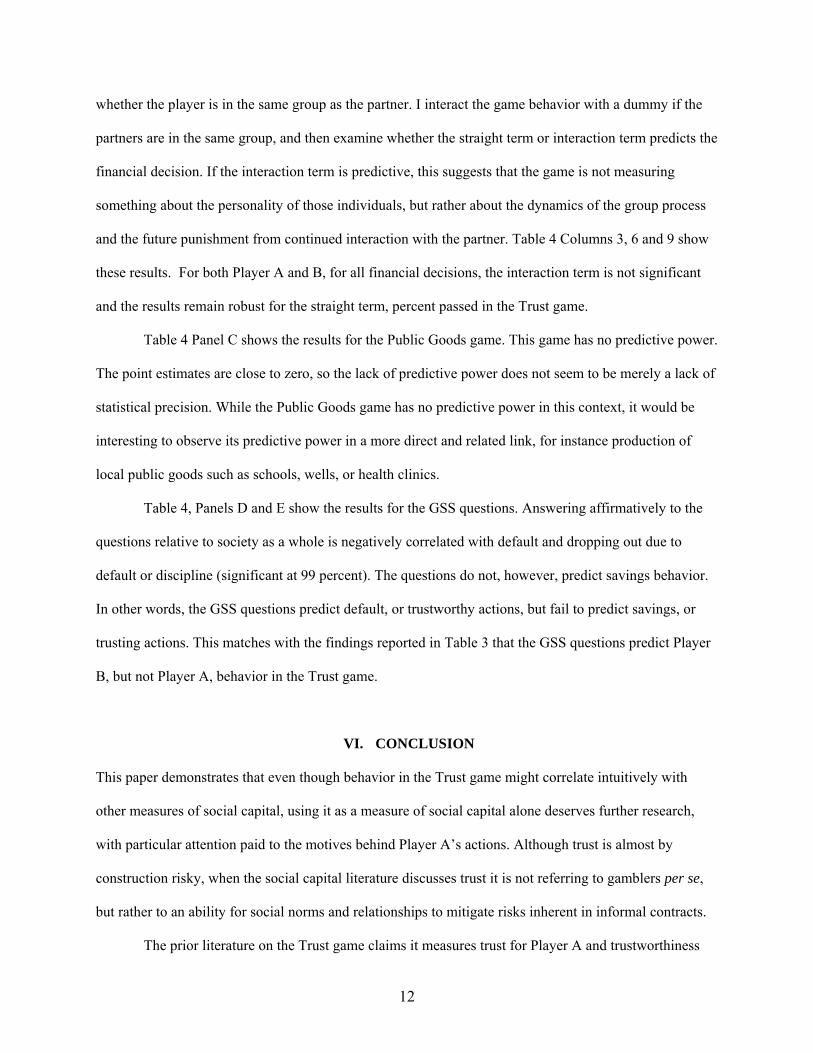
Table 3 shows the analysis of the determinants of behavior in the Trust game. The OLS
specification is as follows:12
(1) Yi=α+β1Xi+β2Pi+β3Gi+εi,
where Yi is the percentage passed to the other player of the amount possible to pass. The determinants are
categorized threefold: individual characteristics (Xi), pair characteristics (Pi), and group characteristics
(Gi). The individual characteristics encompass basic demographics. The pair characteristics encompass
the relationship between the individual and her partner (e.g., cultural similarity, geographic proximity,
and church attendance). Group characteristics encompass aggregated measures of the geographic and
cultural dispersion of the group. Table 3 Columns 1 and 2 show these results for Player A and Player B,
respectively. Columns 3, 4 and 5 show whether the partner characteristics predict the amount passed (i.e.,
do Player A’s characteristics affect how much Player B passes to Player A?).
When both individuals are indigenous, Player A passes 24 percentage points more whereas Player
B does not behave differently. On the other hand, when Player A is indigenous and Player B is Western, 12 Errors were corrected for clustering at the “village bank” level.
7
Player B returns 18 percentage points more to Player A. Prior studies have found inconsistent results on
cross-cultural and within-cultural trust, reciprocity and sharing (Chaim Fershtman and Uri Gneezy, 2001,
Francisco Gil-White, 2002, Edward L. Glaeser, et al., 2000). These conflicting results, from the United
States, Mongolia, Israel, and Peru, support the view that trust and fairness norms are culture-specific
constructs.
Geographic proximity to each other predicts trusting and trustworthy behavior. If Player B lives
within a 10-minute walk of Player A, then Player A passes 9 percentage points more to Player B
(significant at 95 percent). The analog for Player B is 6 percentage points, but is not significant
statistically. For Player B, however, the further she lives from all other members of the group (not just the
partner), the less she returns to Player A (significant at 95 percent). This could be construed as
trustworthiness or fear of reprisal. In this sense, trustworthiness is driven by fear of reprisal rather than
innate personal characteristics.
Attending the same church also predicts trusting, but not trustworthy behavior. All participants
were asked which church they attend "most frequently." In both Ayacucho and Huanta, there is one
church that is the largest and most frequently attended. A dummy was set equal to one if two people
reported attending the same church, but not the largest church.13 Player A passes 20 percentage points
more to Player B if both attend the same church (but not the largest one). Other results for religious
activities, such as number of days since last attendance, no attendance, or evangelical affiliation (not
shown) are insignificant statistically.
Of the 397 pairings, 98 were in separate lending and savings groups. Being in the same group as
your partner should suggest that the clients expect to interact with each other in the future and also
suggests they know each other beforehand. The coefficient on a dummy variable for being in the same
group is positive for Player B and negative for Player A, but in neither case statistically significant.
Interacting this dummy with other variables of interest, such as cultural similarity and distance to each
13 The largest church was removed for two reasons; first, individuals were less likely to interact with each other at the large church (or expect much future interaction), and second, if the respondent did not attend church but felt compelled to name a church in this survey, she most likely named the largest, most well-known one.

8
other's homes, does not change the results (results not shown).
Instances of borrowing cash directly from other members (i.e., as a side contract to the group
lending and savings contract) also predict trustworthy behavior.14 This is intuitive: individuals who are
trustworthy are more able to secure loans from their peers. On the other hand, individuals who pass more
as Player A have fewer such side contracts. I suggest that individuals who pass more as Player A are risk-
takers, and others in the group know this and hence do not loan to them one to one. The negative and
strongly significant coefficient (99 percent) on simultaneously saving more than borrowing suggests that
risk-takers (specifically, individuals who borrow more than they save) pass more as Player A. This
explanation is supported by anecdotal observations that when Player A handed the administrator the coins
to pass to Player B, Player A often said "Voy a jugar," or "I am going to play." Hence, many Player A's
viewed this as a gamble, to "play" or not, and not merely as an act of trust (see Schechter (2004) for
similar findings in Paraguay).
The GSS questions discussed earlier predict trustworthy (significant at 90 percent), but not
trusting, behavior (contrary to the way the questions are worded). This particular finding is consistent
with Glaeser et al. (2000) and particularly important since the questions are a leading alternative for
measuring social capital. Other measures of social interaction, such as attending each other’s celebrations
and recalling group members' names, predict neither trusting nor trustworthy behavior.
Table 3 Columns 3, 4 and 5 analyze the action of each player as a function of the characteristics
of the partner. Columns 3 and 4 report OLS results regressing Player A’s actions on B’s characteristics,
and Column 5 reports OLS results regressing Player B’s actions on Player A’s characteristics.
Player A passes more to Player B when Player B is more similar culturally and lives closer to the
others in the lending group. This suggests that Player A passed more when Player B was more connected
to others in the group, hence perhaps indicating that Player A recognized that any sanction by Player B
would be more effective. Player B also passed more back to Player A when Player was similar culturally
14 Specifically, each member was asked, "How many times over the past twelve months have you borrowed cash directly from another member of your group?" Note that since this is technically frowned upon by FINCA, answers to this question are biased downward, and the bias is perhaps correlated with characteristics of interest in this paper.

9
to others in the group; geographic proximity does not have this effect. Furthermore, indigenous players
get more passed to them and western players get less passed to them, whether Player A or B. This could
be identifying charitable motives, with culture a proxy for wealth or socioeconomic status. Those who
attended church more recently are passed less, and those who do not attend church at all are passed more.
Table 3 Column 4 shows an analysis of the Player B’s who do not get passed anything by Player
A. If Player B’s are not passed anything specifically because they are not trustworthy, then any analysis
on Player B’s behavior would suffer from a selection bias wherein the most untrustworthy were removed
from the sample. I analyze the characteristics of the Player B’s that were not passed anything in order to
ascertain the relevance of this potential bias15. Only three variables are statistically significant (at 90%):
cultural similarity to the group (the more similar to the group, the more likely to have received a pass),
being Western (less likely to have received a pass), and having borrowed from others in the group outside
of the official lending program (more likely to have received a pass). This last finding suggests that the
most untrusted individuals might in fact be omitted from the analysis on Player B.
B. The Public Goods Game
Table 3 Columns 6 and 7 report the determinants of behavior in the Public Goods game. Column 6 reports
the OLS linear probability results. The basic specification is as follows:
(2) Yi=α+β1Xi+β2Gi+εi,
where Yi is equal to 1 if the player contributed to the public good and 0 otherwise. The determinants can
be divided twofold: the individual characteristics (Xi) and the connectedness to the group variables (Gi).
For the group-level analysis (Column 7), the dependent variable is the percentage of the group that
contributed to the public good. Due to degrees of freedom, only a few independent variables are used.
Those who pass more in the Trust game are more likely to contribute to the public good16.
Individuals who have more instances borrowing directly from their peers are more likely to contribute to
15 A strategy method would have avoided this problem, but the education and literacy level of the participants did not permit such an approach. 16 This is true for both Players A and B, although the specification reported in Table 5 does not show this breakdown.
10
the public good (significant at 90%). Individuals who live farther from the others in the group, individuals
who have not attended church recently, and Western individuals are all less likely to contribute. For the
group-level analysis (Column 7), groups with individuals who answer the GSS questions affirmatively are
contribute more on average.17
V. PREDICTING FINANCIAL DECISIONS
If the Trust game can be taken seriously, then it should be able to predict future behavior. The heart of
this paper links the borrowing and saving data to the Trust game data, and then tests whether behavior in
the games predicts real financial decisions up to one year later. I test several hypotheses: (1) individuals
who return more as Player B are trustworthy and hence should be more likely to repay their loans, (2)
individuals who pass more as Player A are more trusting (gambling) and hence should save more (less),
(3) individuals who contribute more to public goods should be better participants of their group, and
hence default less and save more, and (4) those who answer the GSS questions affirmatively are more
likely to repay their loans and save more.18
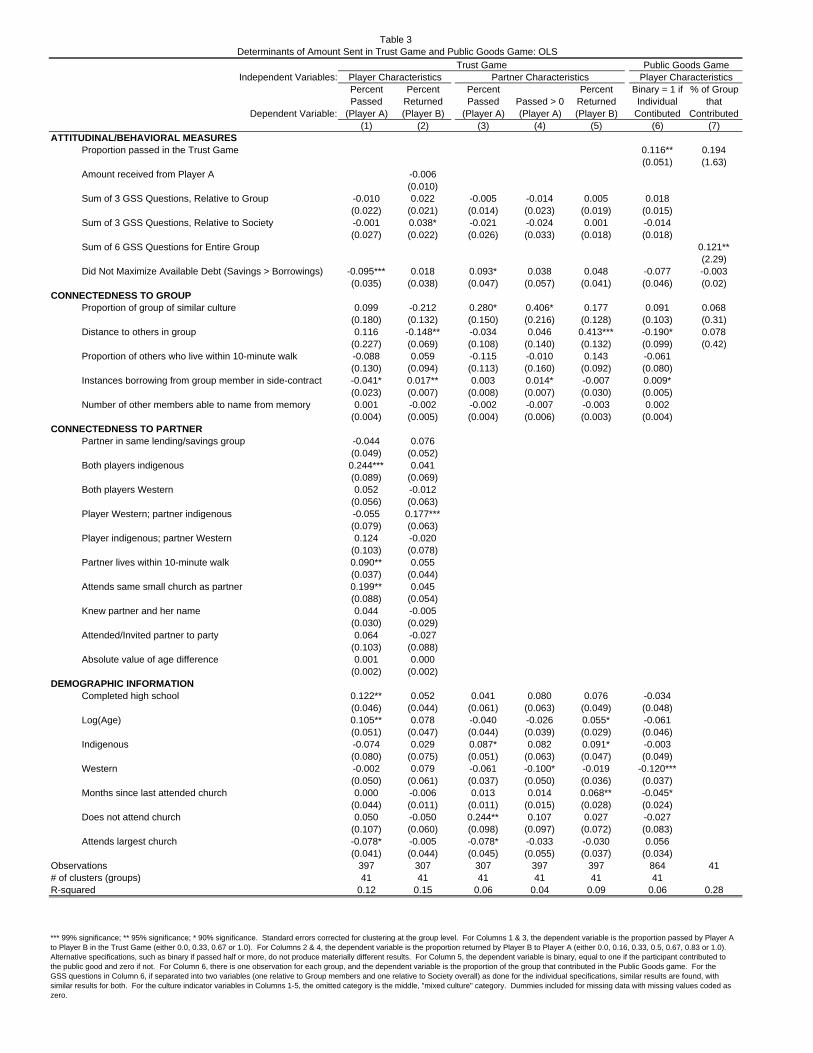
I use three outcomes: default on the loan, dropped out due to default or discipline (self-reported
by the group), and total voluntary savings. Table 4 reports the results with each cell representing a
separate specification. For each outcome, the analysis is conducted first as a simple OLS in Columns 1, 4
and 7 (or probit in the case of dropout), then in Columns 2, 5 and 8 I include controls for many of the
known predictors of financial outcomes (Dean S. Karlan, 2004). By adding the covariates, I am able to
examine whether the Trust game predicts financial decisions after controlling for the observable, more
traditional, predictors of trust and trustworthiness. Indeed, the results remain when adding the covariates.
In particular, the tests of the Trust game include controls for the responses to the GSS questions. Results
are robust to including these controls; hence, the Trust game predictions are not a result merely of their
17 This effect is statistically significant when the 6 GSS questions are aggregated. When separated into “relative to group” and “relative to society” as done in other specifications, the point estimates for both variables are not materially different than the point estimate on the aggregate of the 6 questions, but this results is marginally insignificant statistically. 18 I also examined whether Player B's who received more from Player A (hence were trusted more) were more likely to repay their loans. The results were insignificant, both economically and statistically.
11
correlation with the GSS questions.
Panels A and B show the results for the Trust game for Players A and B, respectively. The
predictions for trustworthiness, for Player B, support the hypothesis: the more trustworthy the individual,
the lower the default, the less likely to drop-out, and the higher the voluntary savings (significant at 95
percent). The magnitudes of these results are significant as well: a shift from 25 to 50 percent for percent
returned by Player B (trustworthiness) predicts a 6.1 percent point drop in the probability of dropout due
to default or discipline (Panel B, Column 5) and a 7.419 percent point drop in the probability of default.
However, the results for trusting behavior, Player A, are exactly opposite. The more "trusting" the
player, the lower the total voluntary savings and the more likely she is to drop out for default or discipline
(but not significantly more likely to have higher default). The result suggests that individuals who pass
more as Player A are gamblers, more willing to take on risks, or alternatively phrased, poor investors,
unable to recognize a bad proposition. Individuals who take on bad risks, or make bad investments,
should default more and be less likely to save voluntarily. Player A, on average, receives 85 cents for
each dollar passed20. This conjecture explains why individuals who pass more as Player A are more likely
to default one year after playing the game. If the "trust" label were appropriate, one would expect the
exact opposite, particularly with respect to savings. Savings are at risk to the default of others in the
group; hence, each savings deposit is an act of trust.
These results on Player A also affect the interpretation of the Player B results. If in fact Player A
is not only about trust but also propensity to take on risks, then can Player B behavior be labeled strictly
about trustworthiness? If Player B correctly assesses that her pass represents part expectation of future
interaction, part gamble, and part trust, then what should determine her behavior? The fact that Player
B’s behavior predicts repayment of loans suggests that despite the murkiness of Player A’s motivation,
Player B’s behavior is indeed about trustworthiness.
Next I examine whether Player A and B action predicts the financial decisions irrespective of
19 This calculation comes from a probit specification on default, not shown in the tables. 20 Although this negative return was not known beforehand, a Player A with a keen sense of business perhaps could have determined that one is unlikely to make profits by passing money.
12
whether the player is in the same group as the partner. I interact the game behavior with a dummy if the
partners are in the same group, and then examine whether the straight term or interaction term predicts the
financial decision. If the interaction term is predictive, this suggests that the game is not measuring
something about the personality of those individuals, but rather about the dynamics of the group process
and the future punishment from continued interaction with the partner. Table 4 Columns 3, 6 and 9 show
these results. For both Player A and B, for all financial decisions, the interaction term is not significant
and the results remain robust for the straight term, percent passed in the Trust game.
Table 4 Panel C shows the results for the Public Goods game. This game has no predictive power.
The point estimates are close to zero, so the lack of predictive power does not seem to be merely a lack of
statistical precision. While the Public Goods game has no predictive power in this context, it would be
interesting to observe its predictive power in a more direct and related link, for instance production of
local public goods such as schools, wells, or health clinics.
Table 4, Panels D and E show the results for the GSS questions. Answering affirmatively to the
questions relative to society as a whole is negatively correlated with default and dropping out due to
default or discipline (significant at 99 percent). The questions do not, however, predict savings behavior.
In other words, the GSS questions predict default, or trustworthy actions, but fail to predict savings, or
trusting actions. This matches with the findings reported in Table 3 that the GSS questions predict Player
B, but not Player A, behavior in the Trust game.
VI. CONCLUSION
This paper demonstrates that even though behavior in the Trust game might correlate intuitively with
other measures of social capital, using it as a measure of social capital alone deserves further research,
with particular attention paid to the motives behind Player A’s actions. Although trust is almost by
construction risky, when the social capital literature discusses trust it is not referring to gamblers per se,
but rather to an ability for social norms and relationships to mitigate risks inherent in informal contracts.
The prior literature on the Trust game claims it measures trust for Player A and trustworthiness

13
for Player B. I find evidence that Player A measures propensity to take risks. I also find evidence to
support the social capital or "trust" hypothesis (e.g., both players being indigenous, living near their
partner, and attending the same church lead to higher passes by Player A). Hence, behavior is determined
by both types of traits. This murkiness raises doubts about the ability to use the game as a measure purely
of trust.
Trustworthiness, on the other hand, does not suffer from this murkiness, as I find strong support
for using Player B's behavior as a measure of trustworthiness. It is useful to distinguish innate
trustworthiness versus trustworthiness driven by a fear of reprisal. Specifically I find evidence supporting
the game as a measure of innate individual-specific trustworthiness, not just a method of identifying
individuals more sensitive to social sanctions (since Player B’s action predicts financial decisions
irrespective of whether the individual played against someone in their own group or against someone
from another group). The positive correlation between trustworthiness in the game and answers to GSS
questions relative to society (but not relative to others in their group) further suggests that the link is
driven by underlying personal characteristics. However, living closer to one’s partner was correlated with
returning more in the game, hence there is some evidence that the fear of reprisal did partly determine
Player B behavior. Naturally, the correct answer is probably a combination of the two.
By testing experimental economics in a real setting where social capital is purported to matter,
two important points are made. First, a simple Trust game can indeed predict repayment of a loan
enforced almost entirely through social pressure. This endorses experimental economics as a valid
measurement tool for field research, and the Trust game as a valid method to measure trustworthiness, but
not as a method to measure trust. Second, it demonstrates that trustworthiness is an important component
in determining the success of group lending programs. Although these data do not show whether
trustworthiness can be created, they do suggest that if harnessed and/or identified, lenders can help solve
failures observed in the financial markets for the poor.

14
REFERENCES
Ashraf, Nava; Karlan, Dean and Yin, Wesley. "Tying Odysseus to the Mast: Evidence from a Commitment Savings Product in the Philippines." Princeton University working paper, 2004. Barr, Abigail. "Trust and Expected Trustworthiness: Experimental Evidence from Zimbabwean Villages." Economic Journal, 2003, 113(489), pp. 614-30. Barr, Abigail M. "Trust and Expected Trustworthiness: Experimental Evidence from Zimbabwean Villages." Economic Journal, 2003, 113(489), pp. 614-30. Berg, Joyce E.; Dickhaut, John W. and McCabe, Kevin F. "Trust, Reciprocity, and Social History." Games and Economic Behavior, 1995, 10, pp. 122-42. Bertaut, Carol C. and Haliassos, Michael. "Debt Revolvers for Self Control." Board of Governors of the Federal Reserve System working paper, 2002. Besley, Timothy B.; Coate, Stephen and Loury, Glenn C. "The Economics of Rotating Savings and Credit Associations." American Economic Review, 1993, 83, pp. 782-810. Binswanger, Hans. "Risk Attitudes of Rural Households in Semi-Arid Tropical India." American Journal of Agricultural Economics, 1980, 62, pp. 395-407. Binswanger, Hans and Sillers, Donald. "Risk Aversion and Credit Constraints in Farmers' Decision-Making: A Reinterpretation." Journal of Development Studies, 1983, 20, pp. 5-21. Brehm, John and Rahn, Wendy M. "Individual-Level Evidence for the Causes and Consequences of Social Capital." American Journal of Political Science, 1997, 41(3), pp. 999-1024. Coleman, James S. Foundations of Social Theory. Cambridge, MA.: Harvard University Press., 1990. Fershtman, Chaim and Gneezy, Uri. "Discrimination in a Segmented Society: An Experimental Approach." Quartery Journal of Economics, 2001, 116(1), pp. 351-77. Fisman, Raymond and Khanna, Tarun. "Is Trust a Historical Residue? Information Flows and Trust Levels." Columbia University Working paper, 2000. Fukuyama, Francis. Trust. New York: Free Press, 1995. Gil-White, Francisco. Ultimatum Game with an Ethnicity Manipulation: Results from Bulgan Cum, Mongolia. Philadelphia, PA: University of Pennsylvania, 2002. Glaeser, Edward L.; Laibson, David I. and Sacerdote, Bruce I. "The Economic Approach to Social Capital." Economic Journal, 2002, 112, pp. 437-58. Glaeser, Edward L.; Laibson, David I.; Scheinkman, Jose A. and Soutter, Christine L. "Measuring Trust." Quartery Journal of Economics, 2000, 115, pp. 811-46. Grootaert, Christiaan and van Bastelaer, Thierry. "Understanding and Measuring Social Capital." World Bank Social Capital Initiative Working Paper No. 24, 2001.

15
Henrich, Joseph; Boyd, Robert; Bowles, Samuel; Camerer, Colin; Fehr, Ernest; Gintis, Herbert and McElreath, Richard. "Cooperation, Reciprocity and Punishment in Fifteen Small-Scale Societies." American Economic Review, 2001, 91(2), pp. 73-78. Karlan, Dean S. "Social Connections and Group Banking." Princeton University working paper, 2004. Kennedy, B.P.; Kawachi, I.; Prothrow-Stith, D.; Lochner, K. and Gibbs, B. "Social Capital, Income Inequality, and Firearm Violent Crime." Social Science and Medicine, 1998, 47(1), pp. 7-17. Knack, Stephen F. and Keefer, Philip. "Does Social Capital Have an Economic Payoff? A Cross-Country Investigation." Quarterly Journal of Economics, 1997, November 1997, pp. 1251-88. Krishna, Anirudh and Shrader, Elizabeth. "Measuring Social Capital." World Bank Social Capital Initiative Working Paper Series, 2000. Laibson, David; Repetto, Andrea and Tobacman, Jeremy. "A Debt Puzzle." National Bureau of Economic Research, 2002, Working Paper No. 7879. Lederman, Daniel; Loayza, Norman V. and Menendez, Ana M. "Crime: Does Social Capital Matter?" Economic Development and Cultural Change, 2002, 50(3), pp. 509-39. Ostrom, Elinor. Governing the Commons: The Evolution of Institutions for Collective Action. Cambridge, MA: Cambridge University Press., 1990. Putnam, Robert D. Bowling Alone: The Collapse and Revival of American Community. New York: Simon and Schuster, 2000. Roth, Alvin E.; Prasnikar, Vesna; Okuno-Fujiwara, Masahiro and Zamir, Shmuel. "Bargaining and Market Behavior in Jerusalem, Ljubljana, Pittsburgh, and Tokyo: An Experimental Study." American Economic Review, 1991, 81(4), pp. 1068-95. Schechter, Laura. "Traditional Trust Measurement and the Risk Confound: An Experiment in Rural Paraguay." UC-Berkeley working paper, 2004. Sobel, Joel. "Can We Trust Social Capital?" Journal of Economic Literature, 2002, 40(1), pp. 139-54.

CoinsPassed Frequency Percent Frequency Percent
0 90 23 55 181 153 39 107 352 66 17 93 303 88 22 36 124 10 35 5 26 1 0
Total 397 100 307 100
CoinsPassed byPlayer A 0 1 2 3 4 5 6 Total
1 43 (28) 84 (55) 26 (17) 153 (100)2 7 (11) 15 (23) 35 (53) 8 (12) 1 (2) 66 (100)3 5 (6) 8 (9) 32 (36) 28 (32) 9 (10) 5 (6) 1 (1) 88 (100)
Procedures for Trust Game
Typical Interpretation of Trust Game Results
Table 1aTrust Game
Basic Results
Table 1b
tab Player B
Both players given 3 coins. Each coin is worth 1 Peruvian Nuevo Sol, which is worth US$0.29. Player A allowed to pass 0, 1, 2, or 3 coins to Player B. Game administrator doubles Player A's pass to Player B. Player B can pass back to Player A 0-100 percent of the coins received. Ruexplained to both players publicly, in the same room, before assignment of individuals to Player A and B. Rules explained in both Spanish and Quechua. Players cannot communicate, but players are informed of the identity of their partner.
Player A's actions typically interpreted as a measure of trust. Player B's actions typically interpreted as a measure of either trustworthiness or reciprocity. See Glaeser et. al. {2000}, Barr {2003}, and Berg et. al. {1995} for further analysis and results from trust game.
Coins Returned by Player B, Frequency (Percent reported in parenthesis)
Trust GamePlayer B's Reciprocity

FINANCIAL DATA Mean ObsProportion of dropout in one year following games due to default or discipline 0.251 913
(0.143)Total voluntary savings deposits in one year following games 66.190 913
(4.437)Highest level of default in one year following games 51.190 913
(4.115)Did Not Maximize Available Debt (Savings > Borrowings), Binary Variable 0.145 913
(0.117)CONNECTEDNESS TO GROUPProportion of group of similar culture 0.201 781
(0.005)Distance to others in group (in minutes) 13.300 882
(0.285)Proportion of others who live within 10-minute walk 0.211 882
(0.007)Instances borrowing from group member in side-contract 0.322 913
(0.045)Number of other members able to name from memory 5.630 913
(0.155)CONNECTEDNESS TO PARTNER (Trust Game)Partner in same lending/savings group 0.753 794
(0.015)Both players indigenous 0.066 781
(0.009)Both players Western 0.150 781
(0.128)Player Western; partner indigenous 0.576 781
(0.008)Player indigenous; partner Western 0.061 781
(0.009)Partner lives within 10-minute walk 0.176 882
(0.013)Attends same small church as partner 0.036 730
(0.007)Knew partner and her name (Score of 0-2, 2 indicates knew partner and her name) 1.236 794
(0.265)Attended/Invited partner to party 0.024 730
(0.006)Absolute value of age difference 12.720 794
(0.376)DEMOGRAPHIC INFORMATIONCompleted high school 0.192 913
(0.013)Age 35.610 794
(0.439)Indigenous 0.198 781
(0.014)Western 0.375 781
(0.173)Months since last attended church 0.211 730
(0.027)Does not attend church 0.042 730
(0.007)Attends largest church 0.331 730
(0.017)
language and headwear. Individuals then categorized threefold, indigenous, mixed, and western.
Means
Table 2Summary Statistics
Standard errors reported in parentheses. Sample sizes differ because data come from different sources and surveys. Financial data are from the FINCA-Peru management information system. All surveys conducted between January 2000 and April 2000. Demographic data come from individual surveys conducted with each member (except for education, which comes from the FINCA-Peru management information system). Social Interaction Data collected in survey conducted with each group as a whole (i.e., not privately, but with each person answering each question publicly). General Social Survey Questions answered privately in individual survey with field research team. Religious Data collected also collected privately in individual surveys with field research team. Group and Individual Interviews (except religion survey) conducted before the Trust Game and Public Goods Game were played with each group. The Religion Survey was conducted six months after the games were played. Distance measured as simple linear distance between two points on a two-dimensional map. Cultural binary variables ("indigenous" and "western") were determined by observing four characteristics of each individual, hair style, clothes,
Independent Variables:
Dependent Variable:
Percent Passed
(Player A)
Percent Returned (Player B)
Percent Passed
(Player A)Passed > 0 (Player A)
Percent Returned (Player B)
Binary = 1 if Individual
Contibuted
% of Group that
Contributed(1) (2) (3) (4) (5) (6) (7)
ATTITUDINAL/BEHAVIORAL MEASURESProportion passed in the Trust Game 0.116** 0.194
(0.051) (1.63)Amount received from Player A -0.006
(0.010)Sum of 3 GSS Questions, Relative to Group -0.010 0.022 -0.005 -0.014 0.005 0.018
(0.022) (0.021) (0.014) (0.023) (0.019) (0.015)Sum of 3 GSS Questions, Relative to Society -0.001 0.038* -0.021 -0.024 0.001 -0.014
(0.027) (0.022) (0.026) (0.033) (0.018) (0.018)Sum of 6 GSS Questions for Entire Group 0.121**
(2.29)Did Not Maximize Available Debt (Savings > Borrowings) -0.095*** 0.018 0.093* 0.038 0.048 -0.077 -0.003
(0.035) (0.038) (0.047) (0.057) (0.041) (0.046) (0.02)CONNECTEDNESS TO GROUP
Proportion of group of similar culture 0.099 -0.212 0.280* 0.406* 0.177 0.091 0.068(0.180) (0.132) (0.150) (0.216) (0.128) (0.103) (0.31)
Distance to others in group 0.116 -0.148** -0.034 0.046 0.413*** -0.190* 0.078(0.227) (0.069) (0.108) (0.140) (0.132) (0.099) (0.42)
Proportion of others who live within 10-minute walk -0.088 0.059 -0.115 -0.010 0.143 -0.061(0.130) (0.094) (0.113) (0.160) (0.092) (0.080)
Instances borrowing from group member in side-contract -0.041* 0.017** 0.003 0.014* -0.007 0.009*(0.023) (0.007) (0.008) (0.007) (0.030) (0.005)
Number of other members able to name from memory 0.001 -0.002 -0.002 -0.007 -0.003 0.002(0.004) (0.005) (0.004) (0.006) (0.003) (0.004)
CONNECTEDNESS TO PARTNERPartner in same lending/savings group -0.044 0.076
(0.049) (0.052)Both players indigenous 0.244*** 0.041
(0.089) (0.069)Both players Western 0.052 -0.012
(0.056) (0.063)Player Western; partner indigenous -0.055 0.177***
(0.079) (0.063)Player indigenous; partner Western 0.124 -0.020
(0.103) (0.078)Partner lives within 10-minute walk 0.090** 0.055
(0.037) (0.044)Attends same small church as partner 0.199** 0.045
(0.088) (0.054)Knew partner and her name 0.044 -0.005
(0.030) (0.029)Attended/Invited partner to party 0.064 -0.027
(0.103) (0.088)Absolute value of age difference 0.001 0.000
(0.002) (0.002)DEMOGRAPHIC INFORMATION
Completed high school 0.122** 0.052 0.041 0.080 0.076 -0.034(0.046) (0.044) (0.061) (0.063) (0.049) (0.048)
Log(Age) 0.105** 0.078 -0.040 -0.026 0.055* -0.061(0.051) (0.047) (0.044) (0.039) (0.029) (0.046)
Indigenous -0.074 0.029 0.087* 0.082 0.091* -0.003(0.080) (0.075) (0.051) (0.063) (0.047) (0.049)
Western -0.002 0.079 -0.061 -0.100* -0.019 -0.120***(0.050) (0.061) (0.037) (0.050) (0.036) (0.037)
Months since last attended church 0.000 -0.006 0.013 0.014 0.068** -0.045*(0.044) (0.011) (0.011) (0.015) (0.028) (0.024)
Does not attend church 0.050 -0.050 0.244** 0.107 0.027 -0.027(0.107) (0.060) (0.098) (0.097) (0.072) (0.083)
Attends largest church -0.078* -0.005 -0.078* -0.033 -0.030 0.056(0.041) (0.044) (0.045) (0.055) (0.037) (0.034)
Observations 397 307 307 397 397 864 41# of clusters (groups) 41 41 41 41 41 41R-squared 0.12 0.15 0.06 0.04 0.09 0.06 0.28
*** 99% significance; ** 95% significance; * 90% significance. Standard errors corrected for clustering at the group level. For Columns 1 & 3, the dependent variable is the proportion passed by Player A to Player B in the Trust Game (either 0.0, 0.33, 0.67 or 1.0). For Columns 2 & 4, the dependent variable is the proportion returned by Player B to Player A (either 0.0, 0.16, 0.33, 0.5, 0.67, 0.83 or 1.0). Alternative specifications, such as binary if passed half or more, do not produce materially different results. For Column 5, the dependent variable is binary, equal to one if the participant contributed to the public good and zero if not. For Column 6, there is one observation for each group, and the dependent variable is the proportion of the group that contributed in the Public Goods game. For the GSS questions in Column 6, if separated into two variables (one relative to Group members and one relative to Society overall) as done for the individual specifications, similar results are found, with similar results for both. For the culture indicator variables in Columns 1-5, the omitted category is the middle, "mixed culture" category. Dummies included for missing data with missing values coded as zero.
Determinants of Amount Sent in Trust Game and Public Goods Game: OLS
Player CharacteristicsPartner Characteristics
Table 3
Trust Game Public Goods GamePlayer Characteristics

No Yes Yes No Yes Yes No Yes YesOLS OLS OLS Probit Probit Probit OLS OLS OLS(1) (2) (3) (4) (5) (6) (7) (8) (9)
Panel APlayer A: Proportion passed in trust game 4.253 -4.640 -35.873 0.117* 0.145** 0.166* -39.630*** -46.625*** -93.969**
(16.451) (16.645) (23.759) (0.064) (0.067) (0.096) (12.402) (15.736) (40.161)Proportion passed in trust game X Partner in Same Group 41.030 -0.015 63.425
(33.360) (0.111) (42.102)Observations 397 397 397 397 397 397 397 397 397
Panel BPlayer B: Proportion returned in trust game -61.985** -69.081** -70.481* -0.253** -0.246** -0.241 57.781** 55.680** 91.451
(27.264) (33.484) (38.643) (0.104) (0.102) (0.199) (25.347) (24.107) (72.149)Proportion passed in trust game X Partner in Same Group 1.314 0.006 -48.852
(53.025) (0.216) (79.901)Observations 307 307 307 307 307 307 307 307 307
Panel CPublic goods game behavior, individual -7.898 -7.820 -0.014 -0.023 -3.180 3.154
(16.274) (14.849) (0.034) (0.040) (8.768) (10.111)Observations 864 864 864 864 864 864
Panel DGSS survey questions, relative to society -16.431*** -16.881*** -0.051** -0.055*** 5.345 6.388
(5.702) (4.790) (0.021) (0.018) (6.401) (7.068)Observations 794 794 794 794 794 794
Panel EGSS survey questions, relative to group -3.366 -3.567 -0.011 -0.010 5.508 4.482 n=794 (5.220) (5.672) (0.019) (0.020) (7.721) (7.642)Observations 794 794 794 794 794 794
values reported for probit coefficients in columns 4, 5 & 6. Standard errors corrected for clustering at the group level (41 groups).
*** 99% significance; ** 95% significance; * 90% significance. Columns 1, 2 & 3 examine whether behavior in the Trust game (Panel A & B), the Public Goods game (Panel C) and the GSS questions (Panel D & E) predict default one year later. The GSS questions are as follows: the trust question, "Generally speaking, would you say that most people can be trusted or that you can't be too careful in dealing with people?", the fairness question, "Do you think most people would try to take advantage of you if they got a chance, or would they try to be fair?", and the helpful question, "Would you say that most of the time people try to be helpful, or that they are mostly just looking out for themselves?" Default is defined as the amount unpaid by the borrower on her loan to FINCA one year after playing the game. Columns 4, 5 & 6 predict being dropped from the program due to default or discipline. This is considered a perhaps less noisy measure of "bad" default, since some default can be observed by group members as acceptable and hence forgiven. Columns 7, 8 & 9 examine predictors of voluntary savings. Columns 3, 6, & 9 examine whether behavior in the trust game predicts the bank outcome differently for individuals who are in the same lending group as their partner in the Trust game. Specifications with control variables include all variables included in Table 3. Marginal
Table 4Predicting Individual Financial Outcomes
Control Variables Included:Dependent Variable: Default
Dropped Out Due to Default or Discipline
Total Voluntary Savings Contributions
OLS, Probit