Embed Size (px)
Citation preview
Using environmental niche models to identify Malagasy bat
biodiversity hotpots and conservation priorities in the face of
climate and human land use changes
by
RYAN BRADLEY KOK
Submitted in partial fulfilment of the academic requirements of
Master of Science in Biological and Life science
(Biological science)
School of Life Sciences
College of Agriculture, Engineering and Science
University of KwaZulu-Natal
Durban
South Africa
Supervisor: Prof M. Corrie Schoeman
Co-Supervisor: Dr Steven M. Goodman
December 2016

ii
PREFACE
The research contained in this thesis was completed by the candidate while based in the
Discipline of Biological Science, School of Life Sciences of the College of Agriculture,
Engineering and Science, University of KwaZulu-Natal, Westville Campus, South Africa. The
research was financially supported by University of KwaZulu-Natal.
The contents of this work have not been submitted in any form to another university and, except
where the work of others is acknowledged in the text, the results reported are due to
investigations by the candidate.
_________________________
Signed: Prof M. Corrie Schoeman
_________________________
Date
_________________________
Signed: Dr Steven M. Goodman
_________________________
Date

iii
DECLARATION: PLAGIARISM
I, Ryan Bradley Kok, declare that:
(i) the research reported in this dissertation, except where otherwise indicated or
acknowledged, is my original work;
(ii) this dissertation has not been submitted in full or in part for any degree or
examination to any other university;
(iii) this dissertation does not contain other persons’ data, pictures, graphs or other
information, unless specifically acknowledged as being sourced from other persons;
(iv) this dissertation does not contain other persons’ writing, unless specifically
acknowledged as being sourced from other researchers. Where other written sources have been
quoted, then:
a) their words have been re-written but the general information attributed
to them has been referenced;
b) where their exact words have been used, their writing has been placed
inside quotation marks, and referenced;
(v) where I have used material for which publications followed, I have indicated in
detail my role in the work;
(vi) this dissertation is primarily a collection of material, prepared by myself,
published as journal articles or presented as a poster and oral presentations at conferences. In
some cases, additional material has been included;
(vii) this dissertation does not contain text, graphics or tables copied and pasted from
the Internet, unless specifically acknowledged, and the source being detailed in the dissertation
and in the References sections.
_______________________
Signed: R.B. Kok
_______________________
Date:

iv
ABSTRACT
Madagascar represents a global hotspot of endemism, but it faces numerous threats to its
biodiversity, including impacts of climate and human land use changes. In this study, suitable
habitat space of 25 Malagasy bat species was modelled under past, current and future climate
projections, asking three questions: (i) Do Malagasy bat richness hotspots change over different
climatic projections and human land use in the past to present to future?; (ii) Do current and
future hotspots fall within Madagascar’s current protected areas (PAs)?; and (iii) Can areas be
included in the current protected areas to better protect the Malagasy bat hotspots? A decline
in suitable habitat space for bat species was anticipated, and, hence, decreased hotspots under
warmer (Last Inter-glacial (LIG) and future) climate scenarios, particularly in combination
with human land use. It was also expected that changes in climate would influence bats
similarly within functional groups (FGs) and differently across functional groups. Specifically,
it was predicted that bats adapted to forage in vegetation (clutter FG) should be more affected
than bats adapted to hunt insects near vegetation (clutter-edge FG) and high above vegetation
(open-air FG). It was further predicted bat richness hotspots would have poor coverage by
Madagascar’s PA network for current and future scenarios, due to broad distribution ranges of
bats and limited area coverage of PAs across the island. Suitable habitat space was modelled
for bat species using environmental niche models (ENMs), taking an ensemble modelling
approach to identify the most suitable ENM for each species. Species richness was quantified
by stacking suitable habitat maps of individual bat species. The results showed that richness
hotspots shifted in size and geographic position under different climate change scenarios.
Generally, changes from warm to cold climates decreased the potential suitable habitat space
of clutter bats yet increased those of clutter-edge and open-air bat species. In contrast, changes
from cold to warmer climates decreased the suitable habitats of clutter bats more than those of
clutter-edge and open-air bats. Null model analyses showed that under both cold and warm
climatic conditions, the observed overlap in suitable habitat between clutter and clutter-edge
functional groups was lower than expected, whereas overlap in suitable habitat between clutter-
edge and open-air functional groups was higher than expected by chance. Further, suitable
habitat space of bat species was only partially covered by the PA system for climate change
and human land use scenarios (range 2 – 20%). Although most of the bat richness hotspots are
in PAs, this coverage will decrease with predicted future climate change. It is suggested that
an additional 58,077 km2 should be added to the current protected areas to ensure adequate
protection under future climate and land use.

v
ACKNOWLEDGMENTS
The completion of this degree has not come easy by any standards without the help, love and
support from many people. I would like to acknowledge and sincerely thank the following:
Prof. M. Corrie Schoeman and Dr. Steven M. Goodman, for their supervision, guidance and
belief in me. Allowing me to have this opportunity to work with an unbelievable
database. Extensive opportunities to travel, test my fieldwork and go to conferences;
My parents for their constant support thought out my university career and love that never
falters. The sacrifices they made to make this all possible, something that cannot be
over looked;
The best brother you could ask for, always being there, his guidance, support and knowledge
has always been very helpful. Setting a prime example through all his achievement;
My grandparents for their unfaltering encouragement, love and support;
My best friends Stanley Pretorius and Rene Gouws. For always being by my side when needed
the most, encouragement and pushing me to do my best;
My colleagues and family for their support, friendship, and help (Melissa Pollard, Michael
Staegemann and Priyanka Pachuwah);
The University of KwaZulu-Natal for financial support throughout my postgraduate studies.

vi
TABLE OF CONTENTS
PREFACE .................................................................................................................................. ii
DECLARATION: PLAGIARISM............................................................................................. ii
ABSTRACT .............................................................................................................................. iv
ACKNOWLEDGMENTS ......................................................................................................... v
TABLE OF CONTENTS .......................................................................................................... vi
LIST OF TABLES ................................................................................................................. viii
LIST OF FIGURES .................................................................................................................. ix
CHAPTER 1: INTRODUCTION ............................................................................................ 12
1.1 Climate change ............................................................................................................... 12
1.2 Human land use .............................................................................................................. 14
1.3 Estimating the impact of climate change and human land use on species’ ranges ........ 14
1.4 Madagascar and aspects of its biodiversity .................................................................... 15
1.4.1 Climate change effects on biodiversity .................................................................... 16
1.4.2 Human land use effects on biodiversity ................................................................... 17
1.4.3 Bats .......................................................................................................................... 18
1.5 Research questions, objectives and predictions ............................................................. 20
CHAPTER 2: MATERIALS AND METHODS ..................................................................... 21
2.1 Study area ....................................................................................................................... 21
2.2 Occurrence data .............................................................................................................. 22
2.3 Climatic data .................................................................................................................. 23
2.4 Land use data .................................................................................................................. 25
2.5 Environmental niche models .......................................................................................... 25
2.5.1 Ensemble modelling approach ................................................................................ 25
2.5.2 Model evaluation ..................................................................................................... 27
2.6 Species richness.............................................................................................................. 29
2.7 Coverage of species hotspots by Madagascar protected areas ....................................... 29
vii
2.8 Niche overlap ................................................................................................................. 29
2.9 Gap analysis ................................................................................................................... 30
CHAPTER 3: RESULTS ......................................................................................................... 31
3.1 ENMs of species............................................................................................................. 31
3.2 Species richness.............................................................................................................. 40
3.2.1 Climate only ............................................................................................................. 40
3.2.2 Climate/land use ...................................................................................................... 40
3.3 Maximum and upper quartiles hotspots ......................................................................... 45
3.3.1 Climate only ............................................................................................................. 45
3.3.2 Climate/land use ...................................................................................................... 45
3.4 Overlap in ENMs ........................................................................................................... 48
3.4.1 Climate only ............................................................................................................. 48
3.4.2 Climate/land use ...................................................................................................... 48
3.5 Gap analysis and additional targeted areas to conserve Malagasy bats ......................... 50
3.5.1 Climate only ............................................................................................................. 50
3.5.2 Climate/land use ...................................................................................................... 54
CHAPTER 4: DISCUSSION ................................................................................................... 59
4.1 Bat hotspots under different climate change and human land use scenarios ................. 59
4.2 Niche overlap of functional groups ................................................................................ 61
4.3 Coverage of bats in Madagascar’s protected areas ........................................................ 62
4.4 Model limitations and future work ................................................................................. 64
4.5 Conclusions .................................................................................................................... 65
REFERENCES ........................................................................................................................ 67
APPENDIX 1: Supplementary materials for Chapter 2 .......................................................... 82
APPENDIX 2: Supplementary materials for Chapter 3 .......................................................... 83
viii
LIST OF TABLES
Table 2.1. 25 Malagasy bat species with greater than 10 occurrence points used in ENM
analyses .................................................................................................................................... 23
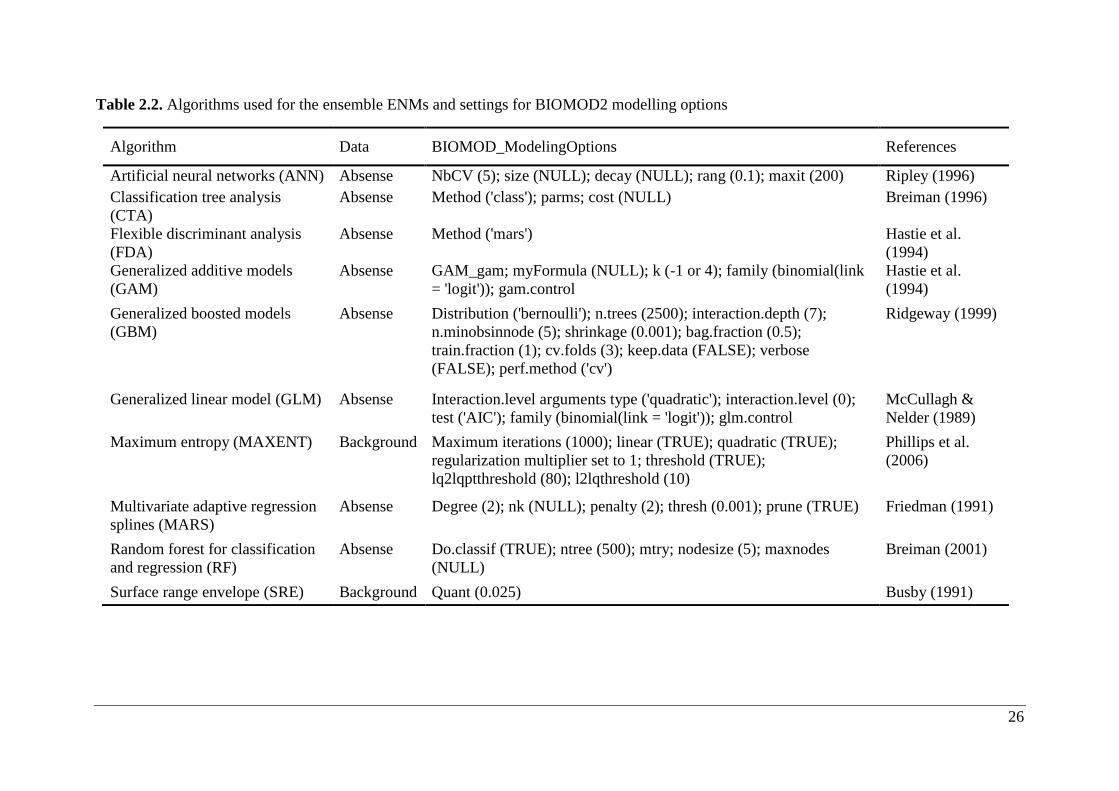
Table 2.2. Algorithms used for the ensemble ENMs and settings for BIOMOD2 modelling
options ...................................................................................................................................... 26
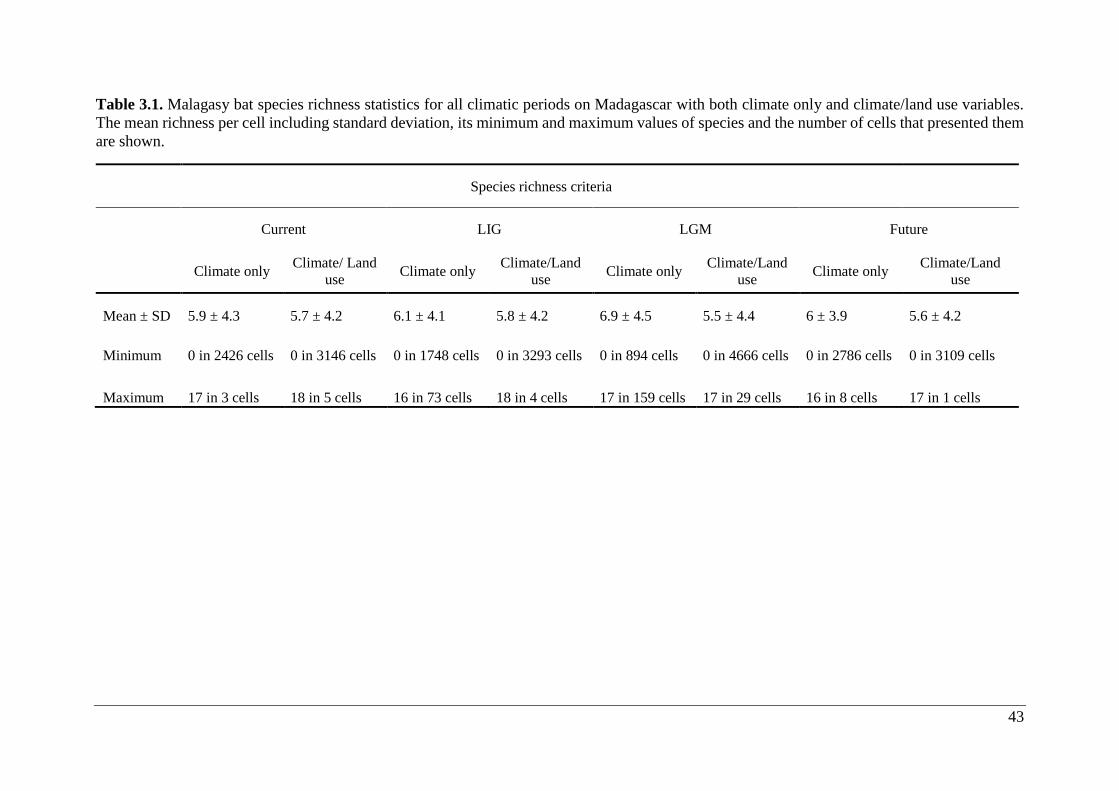
Table 3.1. Malagasy bat species richness statistics for all climatic periods on Madagascar with
both climate only and climate/land use variables. The mean richness per cell including standard
deviation, its minimum and maximum values of species and the number of cells that presented
them are shown. ....................................................................................................................... 43
Table 3.2. Statistics for the hotspots selected for last inter-glacial, last glacial maximum,
current, and future species richness on Madagascar for both climate only and climate/land use
variables. Two selected hotspots defined as Maximum richness and upper quartile richness,
followed by the percentage they signify in the study area, in parentheses. The %
Included/Excluded - refers to all species distribution hotspots that are included within PAs (left
number) and the percentage of the hotspots excluded from the PAs (right number), calculated
for each climatic time period and for both variable types. Percentage within PAs – refers to the
hotspots area in relation to the total islands area. .................................................................... 44
Table 3.3. Results of identity test and background similarity test of the predicted ecological
niches of three functional groups (FG). Hellinger’s I and Schoener’s D overlap indices,
comparing the FG occurrences to the background of another ................................................. 49
Table A1.1. Malagasy bat species with less than 10 occurrence points after applying spatial
filtering of 10 km2 .................................................................................................................... 82
Table A2.1. Ensemble modelling performance measures resulting from fitting environmental
niche models (ENM; 10 models used) of 25 Malagasy bat species under current climatic and
climate/land use variables. The models evaluate the most effective ENM based on all three
measure [area under the receiver operating characteristic curve (AUC), true skill statistic
(TSS), and kappa]. Models were ranked with high classification rates (AUC, TSS, and kappa).
.................................................................................................................................................. 83

ix
LIST OF FIGURES
Figure 1.1. Protected area network of Madagascar in 2008.................................................... 19
Figure 2.1. Map of Madagascar showing distribution of the Malagasy bat records used in this
analysis. .................................................................................................................................... 21
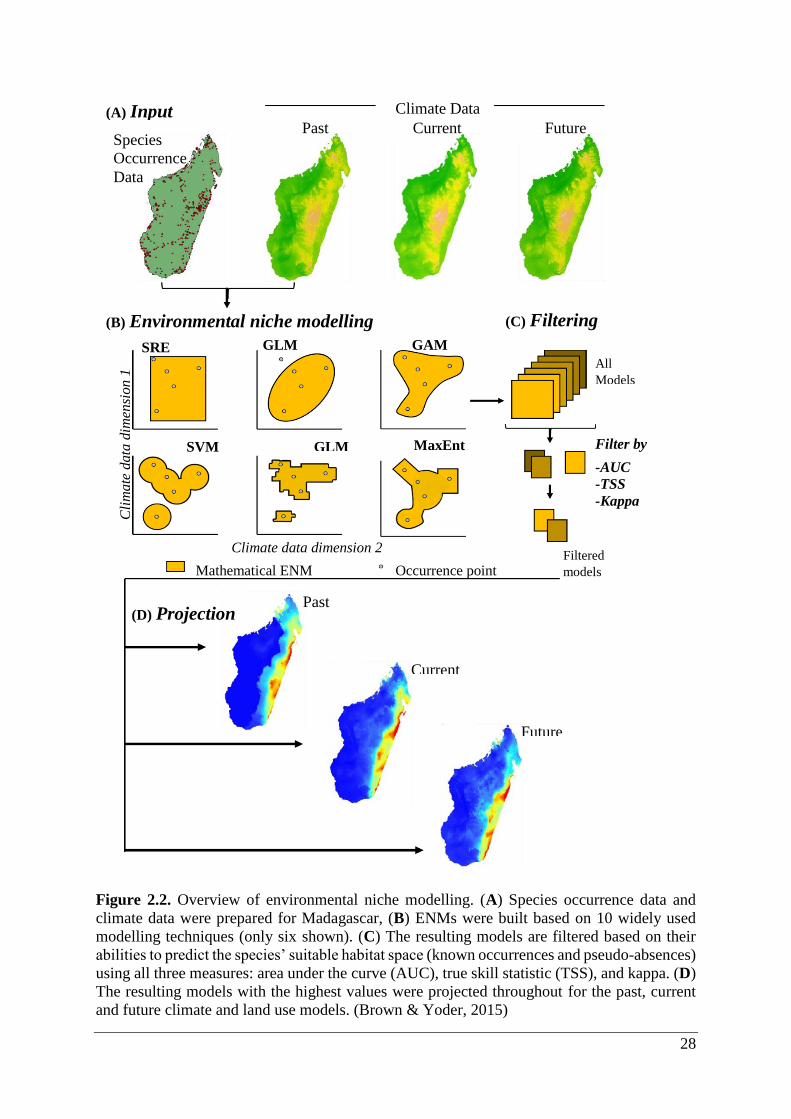
Figure 2.2. Overview of environmental niche modelling. (A) Species occurrence data and
climate data were prepared for Madagascar, (B) ENMs were built based on 10 widely used
modelling techniques (only six shown). (C) The resulting models are filtered based on their
abilities to predict the species’ suitable habitat space (known occurrences and pseudo-absences)
using all three measures: area under the curve (AUC), true skill statistic (TSS), and kappa. (D)
The resulting models with the highest values were projected throughout for the past, current
and future climate and land use models. (Brown & Yoder, 2015) .......................................... 28
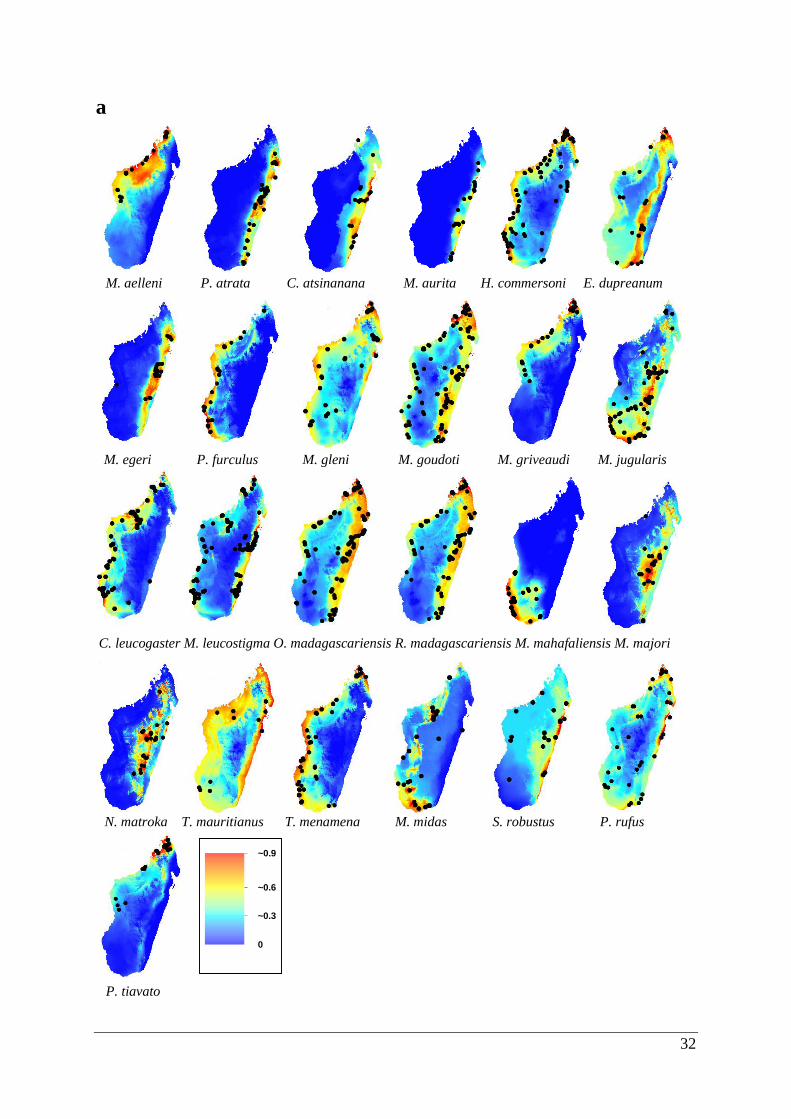
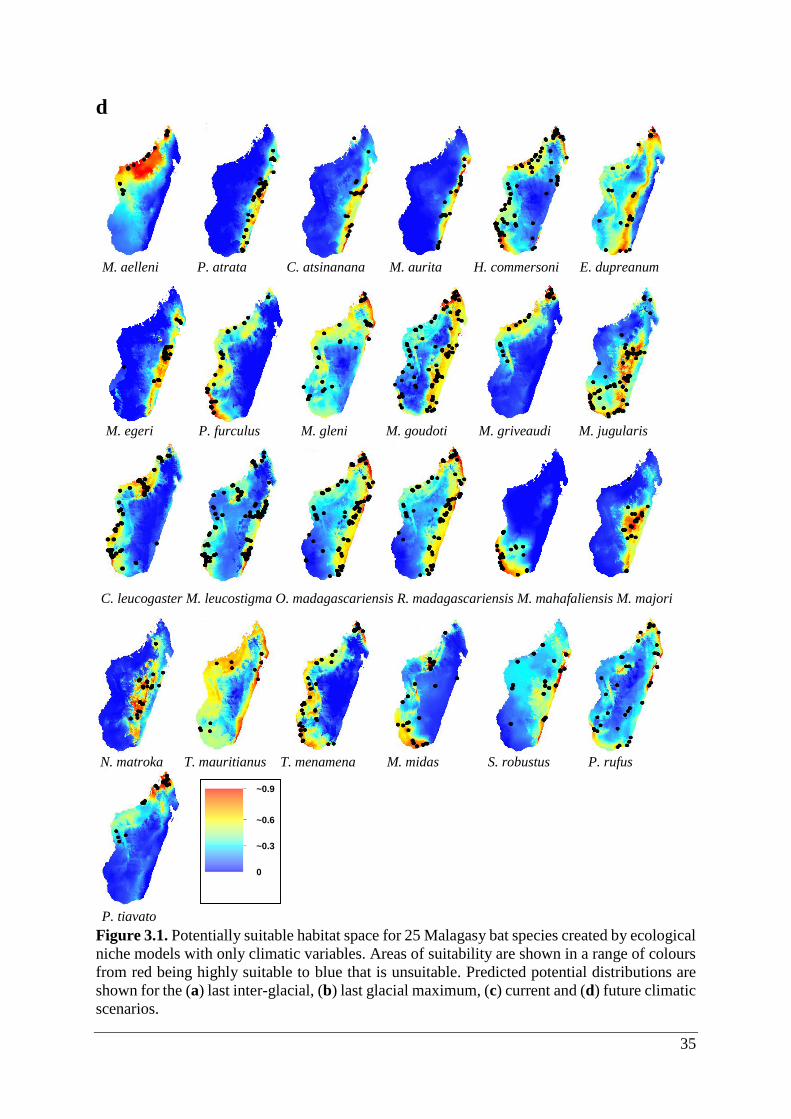
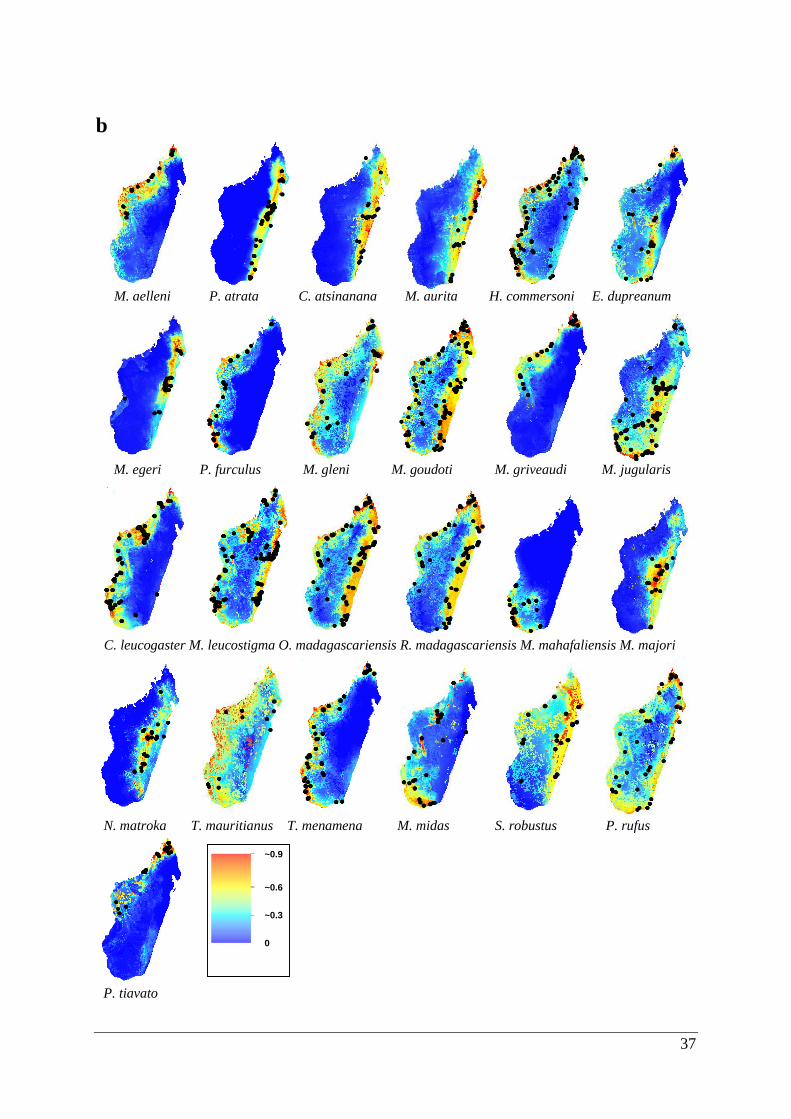
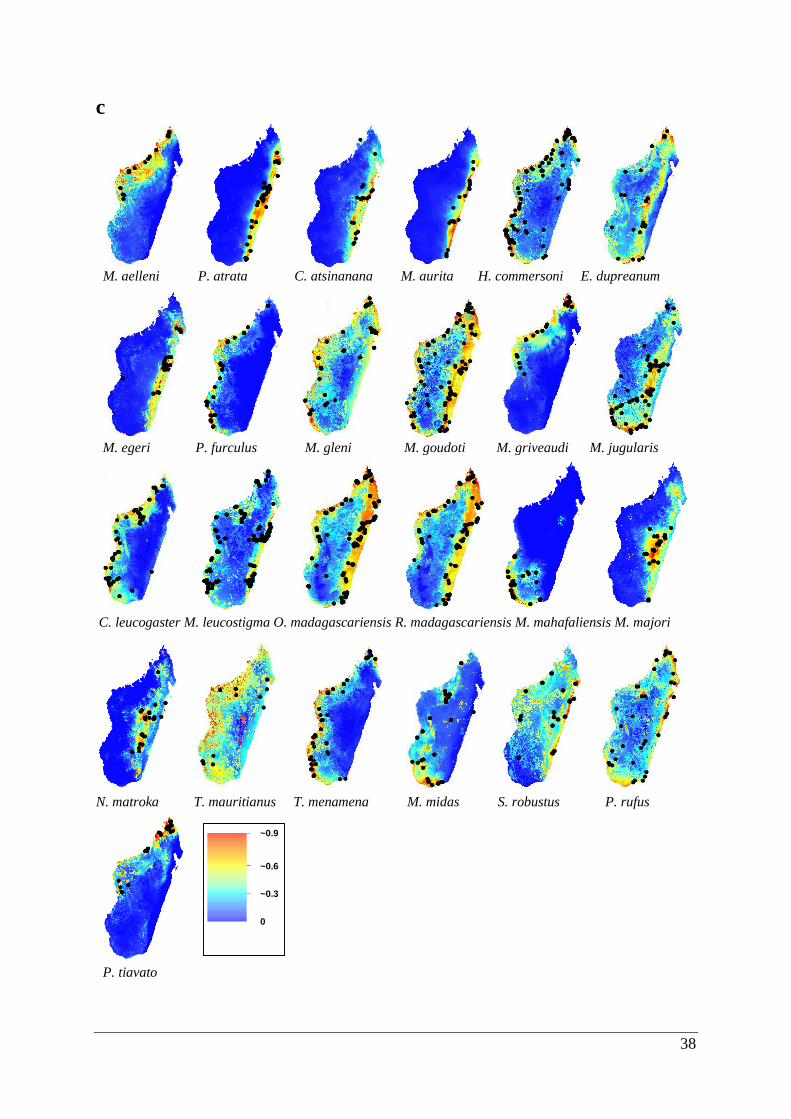
Figure 3.1. Potentially suitable habitat space for 25 Malagasy bat species created by ecological
niche models with only climatic variables. Areas of suitability are shown in a range of colours
from red being highly suitable to blue that is unsuitable. Predicted potential distributions are
shown for the (a) last inter-glacial, (b) last glacial maximum, (c) current and (d) future climatic
scenarios. .................................................................................................................................. 35
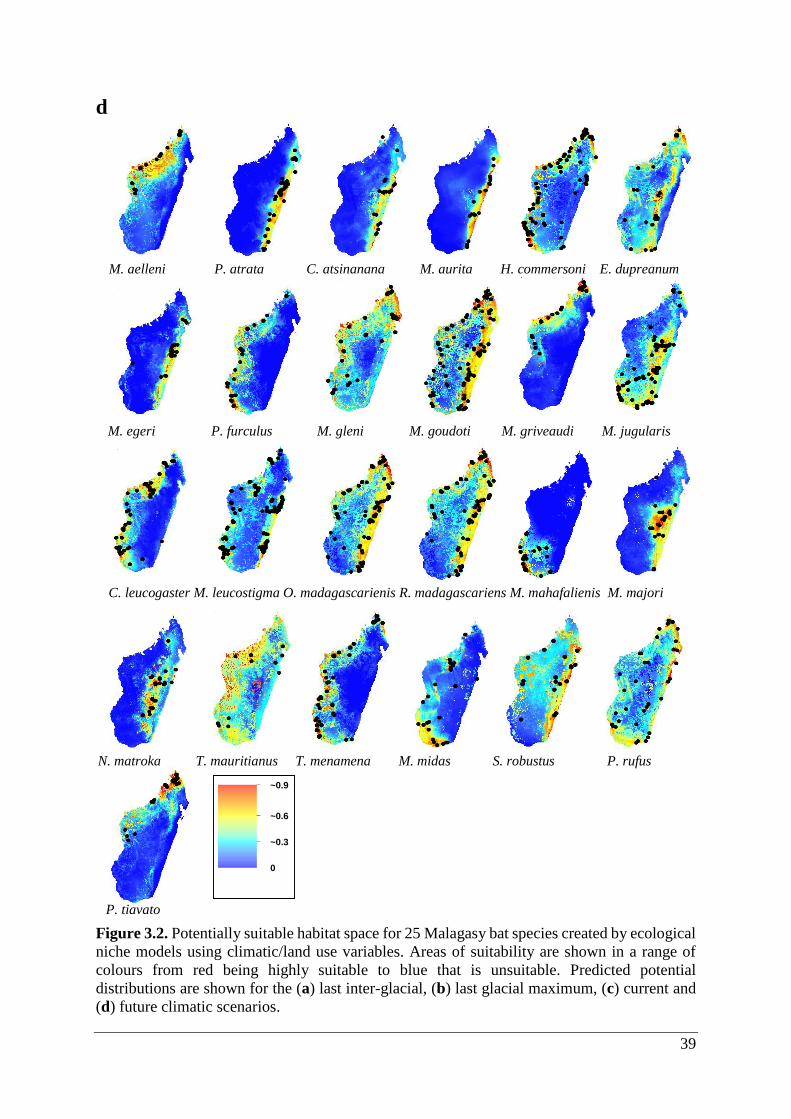
Figure 3.2. Potentially suitable habitat space for 25 Malagasy bat species created by ecological
niche models using climatic/land use variables. Areas of suitability are shown in a range of
colours from red being highly suitable to blue that is unsuitable. Predicted potential
distributions are shown for the (a) last inter-glacial, (b) last glacial maximum, (c) current and
(d) future climatic scenarios. ................................................................................................... 39
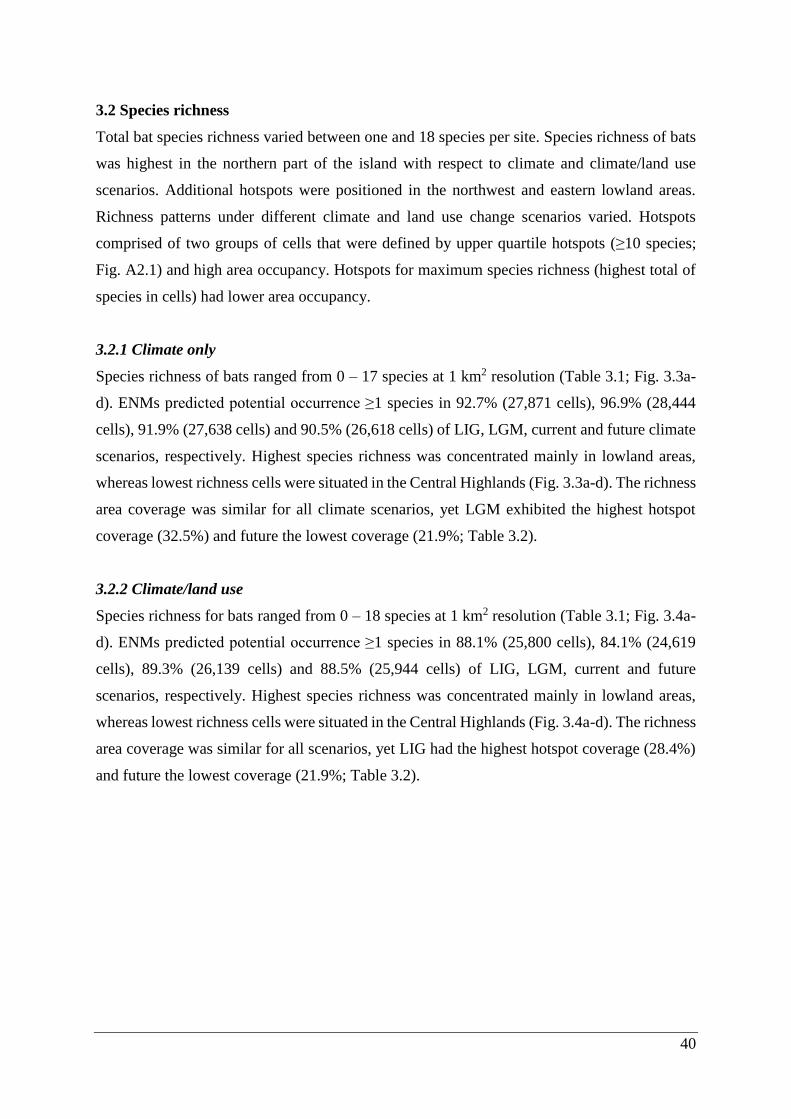
Figure 3.3. Map of Madagascar illustrating spatial prediction of total Malagasy bat richness
built on the synopsis of each ENMs for climatic variables across various climatic scenarios (a)
last inter-glacial, (b) last glacial maximum, (c) current and (d) future. The colours signify the
number of species per cell, darker colours containing higher number of species as indicated on
the key. ..................................................................................................................................... 41
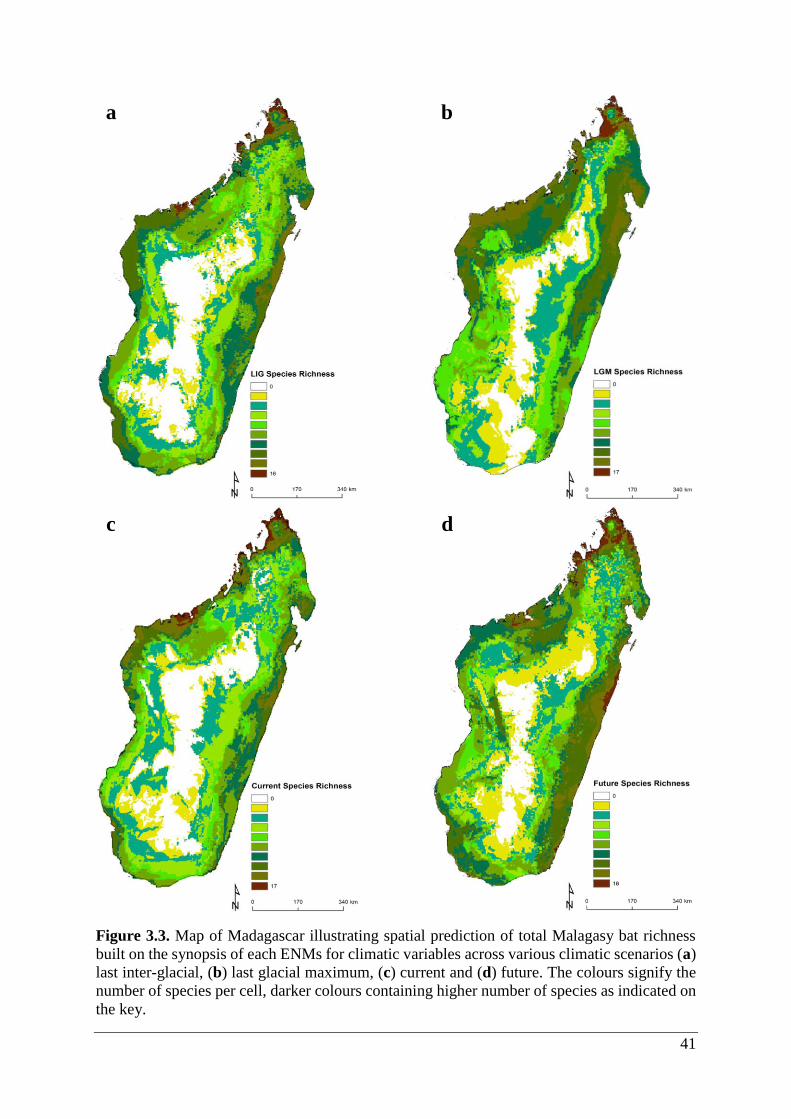
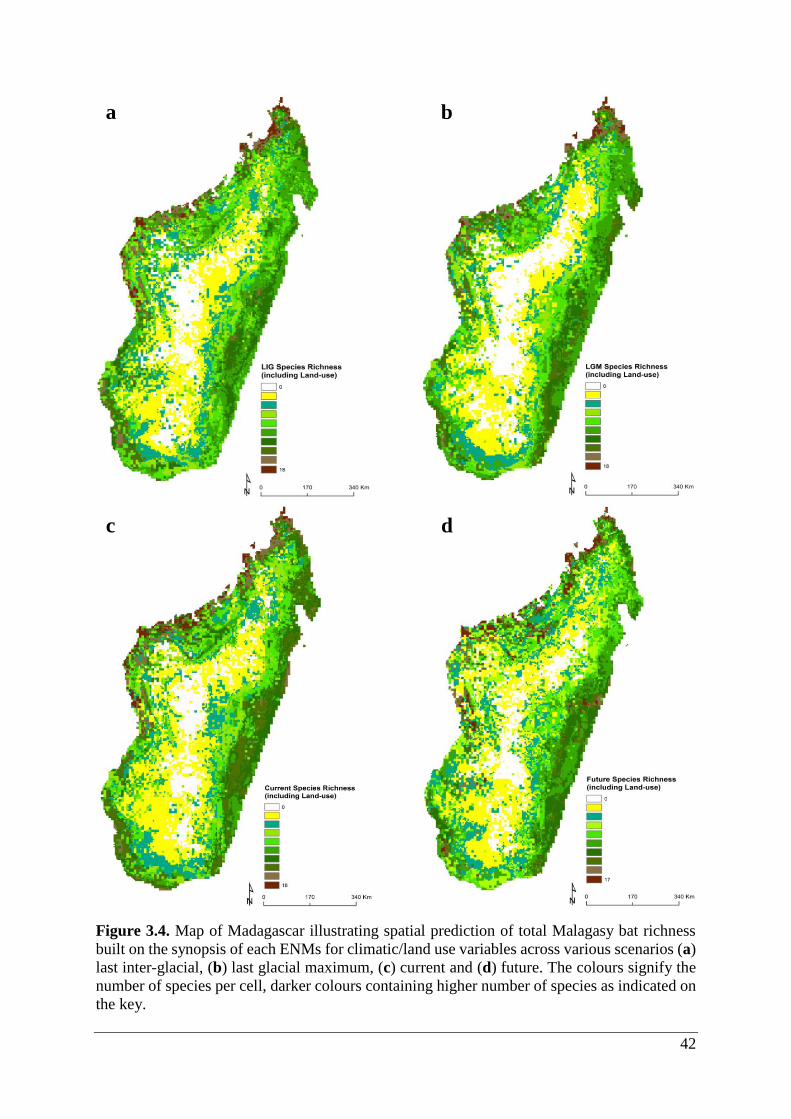
Figure 3.4. Map of Madagascar illustrating spatial prediction of total Malagasy bat richness
built on the synopsis of each ENMs for climatic/land use variables across various scenarios (a)
last inter-glacial, (b) last glacial maximum, (c) current and (d) future. The colours signify the
number of species per cell, darker colours containing higher number of species as indicated on
the key. ..................................................................................................................................... 42

x
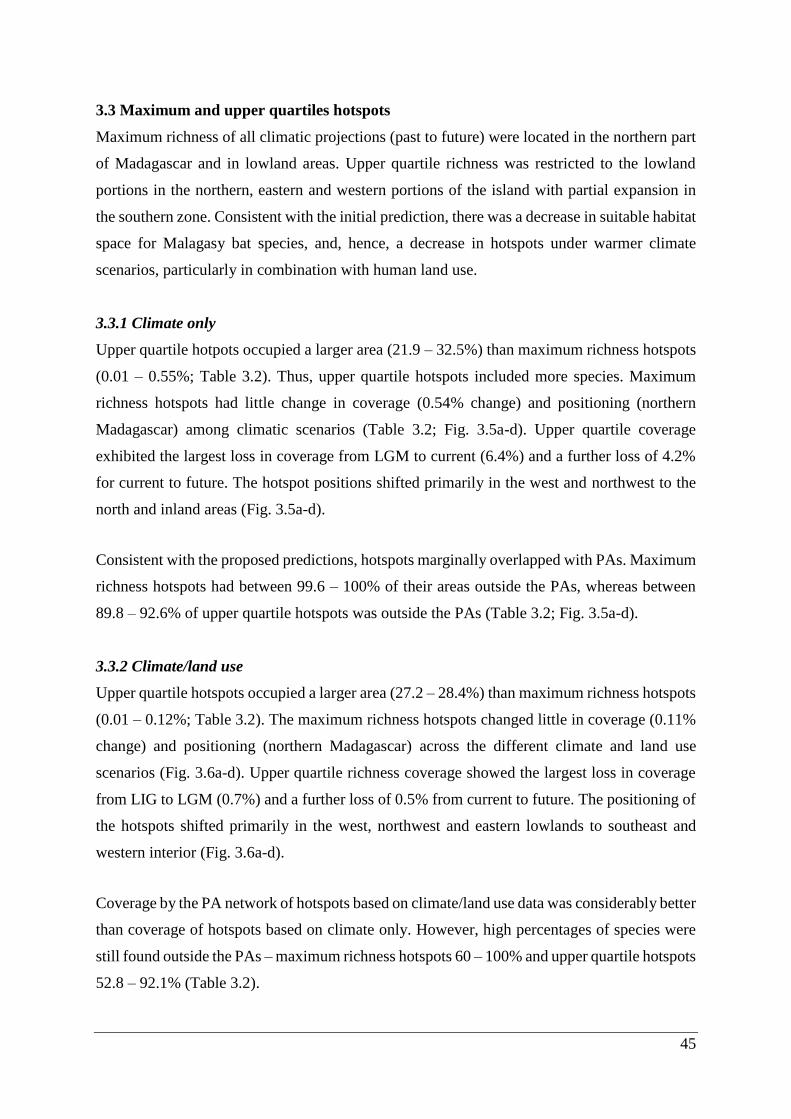
Figure 3.5. Hotspots identified for the four climatic periods using climatic variables (coloured
areas): (a) last inter-glacial, (b) last glacial maximum, (c) current and (d) future. The current
protected areas are indicated by black lines (the black boxed areas are confined areas to show
where the hotspots are) and columns indicate the two cell categories selected. Under each map,
indicates the percentage of the hotspots that fall within the protected areas. .......................... 46
Figure 3.6. Hotspots identified for the four climatic periods using climatic/land use variables
(coloured areas): (a) last inter-glacial, (b) last glacial maximum, (c) current, and (d) future.
The current protected areas are indicated by black lines (the black boxed areas are confined
areas to show where the hotspots are) and columns indicate the two cell categories selected.
Under each map, indicates the percentage of the hotspots that fall within the protected areas.
.................................................................................................................................................. 47
Figure 3.7. Relationship between the area of occupation for each Malagasy bat species and the
percentage of this area that is within protected areas (PA) for climate only variables. The
symbols indicate the different functional groups for the current climatic scenario: all species
fall below 20 are percent in PAs and have an occupancy from roughly 50,000 km2 – 300,000
km2. See Table 2.1 for the Malagasy species abbreviations used for genera and species
indicated on the figure. ............................................................................................................ 50
Figure 3.8. Relationship between the area of occupation for each Malagasy bat species and the
percentage of this area that is within protected areas (PA) for climate only variables. The
symbols indicate the different functional groups for the future climatic scenario: all species are
below 25 percent coverage by PAs and have occupancy from roughly 50,000 km2 – 350,000
km2. See Table 2.1 for the Malagasy species abbreviations used for genera and species
indicated on the figure. ............................................................................................................ 51
Figure 3.9. Proposed additional areas using climate only variables containing species of ≥14
as seen in red. Additional area required to start filling the gap of highly diverse areas of
Malagasy bats in protected areas. Areas selected cover an area of 9,598 km2. ....................... 52
Figure 3.10. Proposed additional areas from Kremen et al. (2008) for future protection as seen
in green. These areas target high species value in terms of conservational efforts. The proposed
areas will add an additional 15,862 km2. ................................................................................. 53

xi
Figure 3.11. Additional areas proposed for future protection to include gap species and targeted
hotspots outside protected areas with the use of climatic variables. Darker cells (red) indicated
conservational targets previously proposed and additional areas of high relevance. (a) The
current climatic time scenario indicating and the conservation targets (red) and hotspots (cells
with 10 species or greater, in yellow). (b) The future climatic scenario with the same
conservational targets and illustrating the reduction in hotspot cells (in yellow).................... 54
Figure 3.12. Relationship between the area of occupation for each Malagasy bat species and
the percentage of this area that is within protected areas (PA) for climate/land use variables.
The symbols indicating the different functional groups for current climatic and land use
scenario: the coverage of all species is less than 17% within PAs and have an occupancy from
roughly 44,000 km2 – 285,000 km2. See Table 2.1 for the abbreviations used for genera and
species indicated on the figure. ................................................................................................ 55
Figure 3.13. Relationship between the area of occupation for each Malagasy bat species and
the percentage of this area that is within protected areas for climate/land use variables. The
symbols indicating the different functional groups for future climatic and land use scenario:
the coverage of all species is less than 17% within PAs and have an occupancy from roughly 5
km2 – 300,000 km2. See Table 2.1 for the Malagasy species abbreviations used for genera and
species indicated on the figure. ................................................................................................ 56
Figure 3.14. Proposed additional areas using climate/land use variables containing ≥14 bat
species are shown in red. Additional areas, covering 42,215 km2, are required to ensure
protection and to fill in considerable gaps of highly diverse zones. ........................................ 57
Figure 3.15. Additional areas proposed for future protection to include gap species and targeted
hotspots outside protected areas with the use of climate/land use variables. Darker cells (red)
indicated conservational targets previously proposed and additional areas of high relevance.
(a) The current climatic and land use scenario indicating and the conservation targets (red) and
hotspots (cells with 10 species or greater, in yellow). (b) The future climatic and land use
scenario with the same conservational targets and illustrating the reduction in hotspot cells (in
yellow). .................................................................................................................................... 58
Figure A2.1. The number of species found per cell and cell count. The black box is the area of
cells focused for the upper quartile hotspots as the data become skewed below this point (10 to
18 species). Climatic and land use scenarios are indicated and represented by various colours.
.................................................................................................................................................. 94
12
CHAPTER 1: INTRODUCTION
1.1 Climate change
The impacts of climate change has been named the greatest threat to global biodiversity
(Thomas et al., 2004). Climate change refers to the global rise in average surface temperatures
(Razgour et al., 2013; Brown & Yoder, 2015). Global climate models estimate that the mean
surface temperature of the Earth has increased by 0.74°C during the past century (1906–2005),
and will increase another 1.4–5.8°C by the end of the 21st century (IPCC, 2007). This rise in
temperature is caused by changes in the global atmospheric composition resulting from the
anthropogenic emissions of greenhouse gasses. Human activities have increased carbon
dioxide in the atmosphere largely by the burning of fossil fuels such as coal and oil (Andreae
& Merlet, 2001). Additional major drivers of climate change include human-induced land use
changes, deforestation; shifts in ocean currents, surface warming, increased amounts of
methane from cattle and rice paddies; and nitrous oxide from agriculture (Brook et al., 2003;
Rasolofoson et al., 2015).
These gases have extended life spans in the atmosphere, with resultant accumulation and
increased concentrations. Composition of air samples in air bubbles trapped in ice cores has
shown a 31% increase in carbon dioxide since the beginning of the modern industrial period
(the mid-nineteenth century) from 280 parts per million by volume (ppmv) to roughly 370
ppmv today (IPCC, 2007). This build-up of gases reflects solar radiation, and indirectly
changes the reflective properties and life spans of clouds (IPCC, 2007). Trapped carbon
pollution heats up and alters the Earth's climatic patterns. It is the subject of intense scientific
enquiry (IPCC, 2007) and many warnings have been given about the impact of these changes
on the biodiversity of the planet.
Increased global temperatures because of climate change melt polar ice caps and cause sea
levels to rise (Lenton et al., 2008). Consequently, low lying regions such as coastal areas,
wetlands and deltas are under great risk of coastal erosion, coastal plain flooding, salinization
of aquifers and soil, and loss of habitat for fish, birds, and other wildlife, as well as plants
(Ellison, 1993). Additionally, precipitation patterns, including the amount, intensity, and
frequency should shift with changing climate (Trenberth, 2011). Climate change can also
influence climatic events such as the cyclical El Niño Southern Oscillation (ENSO) that is
related to the warm band of water in the Pacific Ocean (McCarty, 2001). This can lead to
changes at all levels of ecological organization, such as population changes, shifts in
13
geographic range, changes in composition of communities, as well as structural and functional
changes of ecosystems (McCarty, 2001).
Changes in natural systems due to climate change have been widely documented. These
changes include phenological patterns of plants and animals, such as seasonally earlier
breeding of certain bird species, arrival of migratory birds, emergence of butterflies, spawning
of amphibians, and flowering plants sending up new shoots (Walther et al., 2002). Further,
species ranges are impacted by climate change, such as the ranges of certain butterflies shifting
northward in North America and Europe (Hughes, 2000; Acevedo et al., 2012) and tropical
birds moving their ranges upslope (Freeman & Freeman, 2014). Additionally, Brown & Yoder
(2015) found on Madagascar a decrease in suitable niche space of lemurs in face of climate
change.
The effects of future climate change has been the focus of considerable research (Bellard et al.,
2012) including the degree of global species loss (Thomas et al., 2004) and changes to species
suitable habitat space (Jansson, 2003; Elith & Leathwick, 2009; Ellis et al., 2010; Chejanovski
& Wiens, 2014; Garcia et al., 2014; Latinne et al., 2015; Gama et al., 2016). Recent estimates
of global climate change suggests that species responses may not be fast enough to track
suitable habitats (Loarie et al., 2009; Moo-Llanes et al., 2013; Ordonez & Williams, 2013;
Razgour et al., 2013), and therefore species survival will be dependent on their adaptive
capability (Razgour et al., 2013).
Climate change poses an elevated threat to biodiversity due to reduced resilience of natural
habitats (Garcia et al., 2014). The current loss of biodiversity is higher than the natural rate of
extinction (Malcolm et al., 2006). Global studies estimated that by 2050, 15 – 37% of species
are expected to be extinct as a result of climate change (Bellard et al., 2012). Species that are
particularly susceptible to extinction risk from climate change include endemic species with
small ranges, and species that are already under significant strain due to habitat loss (Kuiper,
2014). Malcolm et al. (2006) suggested that the extinction of endemic species under the worst
scenarios could reach 39 – 43%. Risk of extinction may vary between areas of the globe and
taxonomic groups, at least in part based on different natural history traits and the manner
analyses are conducted. For example, Jetz et al. (2007) estimated that less than 0.3% of the
world’s 8,750 land bird species would go extinct by 2100 due to climate change, whereas the
estimate by Sekercioglu et al. (2008) for land bird species in the Western Hemisphere was
something approaching 30%.
14
The process of climate change has been further exacerbated by human land use changes.
Urbanisation and commercial agricultural practices in areas of increased population density
and activity contribute to the proliferation of greenhouse gases that impact climatic conditions
(Bellard et al., 2012). Climates within cities are hotter and more polluted than green rural areas
owing to their lack of vegetative cover that absorb heat and pollution (IPCC, 2007).
1.2 Human land use
Human land use may be the main cause of biodiversity loss and changes in species ranges in
the next century, because humans are altering the land faster than climate change (Mooney et
al., 2009). Increasing human population augments patterns of human land use. In the majority
of cases, biodiversity is negatively affected by human land use at local and regional spatial
scales (Agarwal et al., 2002; Lepers, 2003; Haines-Young, 2009) and associated loss of species
can be attributed to different drivers (Thomas et al., 2008). These drivers include over-
exploitation of species and resources through deforestation, agriculture, mining, hunting and
depletion of fish stocks in the oceans; habitat fragmentation; and introduction of exotic species
of plants and animals (Allnutt et al., 2008, 2013; Hannah et al., 2008; Blaustein et al., 2010;
Allnutt et al., 2013).
Areas that are particularly sensitive to the impact of land use are those that have high species
diversity and high human populations, and are usually situated in tropical biomes (Cincotta et
al., 2000). Nonetheless, areas with low species diversity and small human populations (e.g.
Arctic and Polar zones) are also impacted by human land use pressures such as mining
(Cincotta et al., 2000). The interaction between increasing temperatures and land use practices
may lead to significant changes in species distributions and priority areas for conservation
(Smith et al., 2016).
Climate change and human land use operate over large spatial scales across extensive periods;
therefore, suitable analytical tools are needed to model how they impact species diversity.
1.3 Estimating the impact of climate change and human land use on species’ ranges
Species ranges are often demarcated with polygons drawn around known occurrence points to
generate maps of their known distribution (Skinner & Chimimba, 2005). However, occurrence
data for species should ideally be attained through systematic surveys of a given area with
constant sampling at study sites. This process requires a large workforce and can take a number
of years to complete, especially for species with large home ranges (Elith et al., 2006).
15
Environmental niche models (ENMs), also known as species distribution models, climate
envelopes, and ecological niche models (Elith et al., 2006; Elith & Leathwick, 2009; Warren,
2012), are correlative spatial models that combine species occurrence and environmental data
to predict potential suitable habitat space of species in geographic space (Elith & Leathwick,
2009; Anderson, 2013). To combine occurrence and environmental data, many ENM
algorithms have been developed including: artificial neural networks (Ripley, 1996),
generalized boosted models (also known as boosted regression trees; Ridgeway, 1999), and
MaxEnt (Phillips et al., 2006). The resultant maps indicate areas of habitat suitability (Elith et
al., 2011) that may or may not delimit the broad-scale distributional ranges of species (Colwell
& Rangel, 2009; Devictor et al., 2010; Anderson, 2013). Generally, ENMs estimate the
Grinnellian niche (sensu Soberón, 2007), which is defined by non-interactive (scenopeotic)
variables such as climatic and topographic variables, that are measured at large geographical
scales. Conversely, bionomic variables mediated by dispersal, competition and predation have
more profound influence on the Eltonian niche (Soberón, 2007), and are measured at fine
spatial scales (Colwell & Rangel, 2009; Devictor et al., 2010; Anderson, 2013). Scenopeotic
variables are increasingly available, whereas Eltonian niche data requires detailed data
collected from species in the field (Araújo & Guisan, 2006; Anderson, 2013). Ultimately,
species distributions are determined by both the Grinnelian and Eltonian niches, as well as by
the dispersal abilities of the species, whether by movements of their own or by external agents
(Soberón, 2007).
ENMs have been used to predict species’ potential distribution (Brown & Yoder, 2015),
suitable habitat space (Latinne et al., 2015), and species richness hotspots (Fong et al., 2015),
as well as model the responses of species towards climate and land use changes. Indeed, ENMs
may provide vital information for identifying the most important areas for conservation and
restoration (Guisan & Thuiller, 2005; Jetz et al., 2007; Dauber & Settele, 2012; Brown &
Yoder, 2015; Dávila & López-Iborra, 2015).
1.4 Madagascar and aspects of its biodiversity
Madagascar is the fourth largest island on Earth. The island has been isolated from the African
mainland since the late Cretaceous, ca. 130 – 160 MYA (Yoder & Nowak, 2006). During this
long period of isolation, there has been widespread radiation in the biota with high rates of
endemism at the species, generic and higher taxonomic levels. The island’s biodiversity is
ranked among the most extraordinary on the planet, and has been called “the naturalists
16
promised land” due to its large amount of endemic species (Goodman & Patterson, 1997). Its
evolutionary uniqueness is unmatched by any other land mass similar in size: 60% of birds,
84% of plants, 86% of invertebrates, 92% of reptiles, 93% of freshwater fishes, 99% of
amphibians, and 100% of land mammals occur nowhere else in the world (Goodman &
Raherilalao, 2013). Consequently, Madagascar is regarded as one of the top global
conservation priorities.
Madagascar’s biodiversity has been threatened by intense anthropogenic pressure from
expanding populations, shifting land use patterns and a changing climate (Goodman &
Raherilalao, 2013). In addition, deforestation has claimed approximately 90% of the island's
natural forest habitats, with most of the remaining forests being highly fragmented (Brook et
al., 2006; Boria et al., 2014). The impacts of current and future climate change on biodiversity
may therefore be different than past climate change impacts (Brook et al., 2006).
1.4.1 Climate change effects on biodiversity
Previous studies have demonstrated impacts of past and future projected climate change on
ranges of various Malagasy taxa, including plants (Brown et al., 2015), frogs (Vallan et al.,
2004), reptiles (Pearson et al., 2006), and lemurs (Schwitzer et al., 2013; Brown & Yoder,
2015). For example, primates are vulnerable to climate change because of limited suitable
habitat, dispersal and reproduction rates, as well as isolated populations (Goodman &
Patterson, 1997). Changes in fruiting phenology and weather patterns may put stress on lemur
populations, e.g. Prolemur spp., Varecia spp., Hapalemur aureus, and H. alaotrensis (Gould
et al., 1999; Lahann, 2007; Gabriel et al., 2014). In response to increasing temperatures, certain
Malagasy species’ ranges have already shifted to higher latitudes where temperatures are more
favourable to survival (Brown et al., 2016). Nonetheless, entire assemblages may perish
(Bellard et al., 2012, 2013; Fordham et al., 2012; Stanton et al., 2014). For example, numerous
species of amphibians and reptiles occurring in montane forest habitats on Madagascar (e.g.
Andringitra and Tsaratanana) have restricted ranges and therefore may be especially vulnerable
to rising temperatures (Ingram & Dawson, 2005).
Decreasing precipitation levels and increasing temperatures may negatively impact tropical
forests of Madagascar (Kitula et al., 2015). For example, littoral forests in eastern lowland
areas of Madagascar are vulnerable from potential rising sea levels (Hannah et al., 2008).
Further, Malagasy plants often have close evolutionary relationships with pollinators and
dispersers that may be affected by rising temperatures. For instance, climate change may affect
17
long tongued Sphingidae moths (Lepidoptera) that pollinate ca. 400 plant species on
Madagascar, which may in turn affect the plants and vice versa (Lees et al., 1999). Similarly,
climate change effects on fruit-bearing plant species may negatively affect lemur populations
that are reliant on specific food sources, which, in turn, will impact seed dispersal of such plant
species (Lahann, 2007).
Climate change may push species to the edge of their environmental tolerances (Rodríguez-
Castañeda, 2012) where survival is governed by their ability to access suitable habitat space
(Brown et al., 2015). Whilst many species may adapt to climate change, species that have long
generation times may not have the time (Davis et al., 2005). In summary, climate change is a
key driver in species’ geographic distributions (Brown et al., 2015).
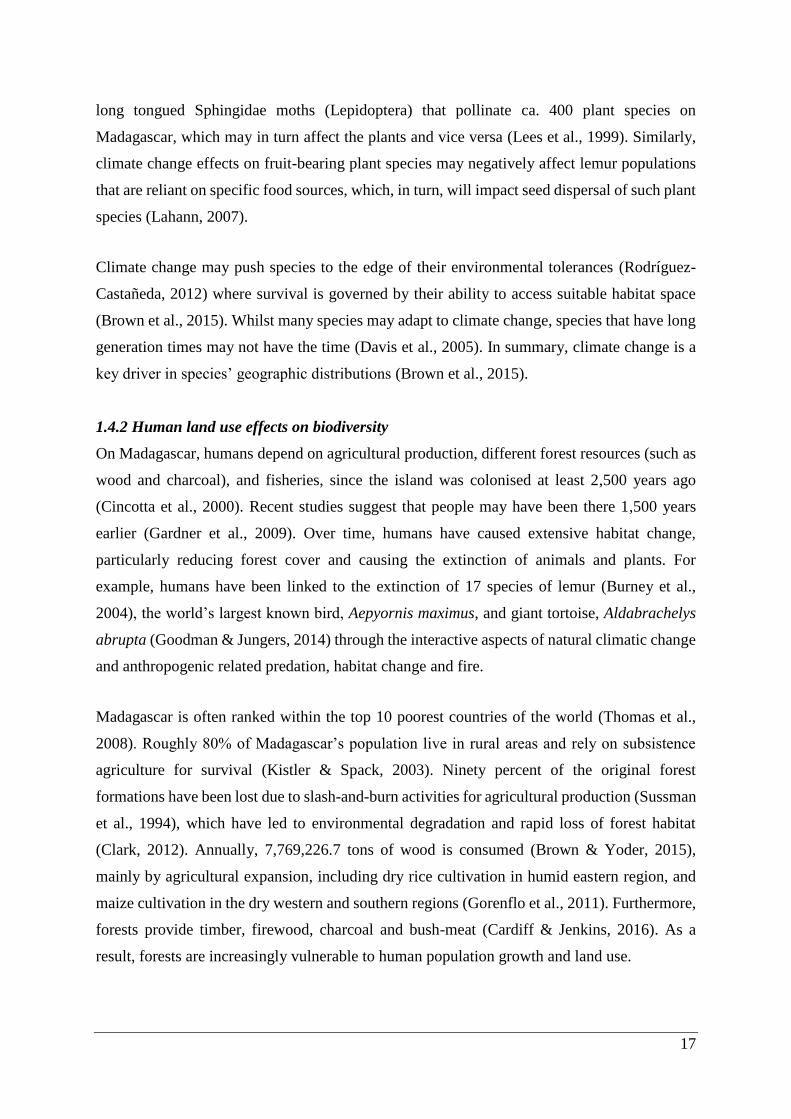
1.4.2 Human land use effects on biodiversity
On Madagascar, humans depend on agricultural production, different forest resources (such as
wood and charcoal), and fisheries, since the island was colonised at least 2,500 years ago
(Cincotta et al., 2000). Recent studies suggest that people may have been there 1,500 years
earlier (Gardner et al., 2009). Over time, humans have caused extensive habitat change,
particularly reducing forest cover and causing the extinction of animals and plants. For
example, humans have been linked to the extinction of 17 species of lemur (Burney et al.,
2004), the world’s largest known bird, Aepyornis maximus, and giant tortoise, Aldabrachelys
abrupta (Goodman & Jungers, 2014) through the interactive aspects of natural climatic change
and anthropogenic related predation, habitat change and fire.
Madagascar is often ranked within the top 10 poorest countries of the world (Thomas et al.,
2008). Roughly 80% of Madagascar’s population live in rural areas and rely on subsistence
agriculture for survival (Kistler & Spack, 2003). Ninety percent of the original forest
formations have been lost due to slash-and-burn activities for agricultural production (Sussman
et al., 1994), which have led to environmental degradation and rapid loss of forest habitat
(Clark, 2012). Annually, 7,769,226.7 tons of wood is consumed (Brown & Yoder, 2015),
mainly by agricultural expansion, including dry rice cultivation in humid eastern region, and
maize cultivation in the dry western and southern regions (Gorenflo et al., 2011). Furthermore,
forests provide timber, firewood, charcoal and bush-meat (Cardiff & Jenkins, 2016). As a
result, forests are increasingly vulnerable to human population growth and land use.
18
Due to increased human land use changes, many Malagasy organisms have gone extinct, or are
close to extinction. Clark (2012) estimated that 8,000 species are at risk because of the loss of
Madagascar’s forests. Brown et al. (2015) found evidence that land use change impact plant
biodiversity across Madagascar with the largest decline in the eastern escarpment and high
elevation ecosystems (Brown et al., 2015). Although, there is strong evidence that climate
change and land use changes negatively affect different plant and animal species on
Madagascar, their effects on Malagasy bats is currently not known.
1.4.3 Bats
Bats (order Chiroptera) are the second richest order of mammals after Rodentia, with
approximately 1,300 species found throughout the world, with several new taxa being
described each year since the tabulation of Simmons (2005). Bats play important roles in
ecosystems, including pollination, seed dispersal, insect control and nutrient distribution, and
they are often keystone species (Myers, 1987; Hodgkison et al., 2004; Kalka et al., 2008;
Williams-Guillén et al., 2008). Bats in general exhibit relatively long life spans, low
reproductive rates and long periods of infant dependency (Kasso & Balakrishnan, 2013). These
bats life history traits suggest that they perceive their environment as relatively stable (Findley,
1993). Therefore, it can be inferred that bats are important bio-indicators of climate and land
use changes (Kasso & Balakrishnan, 2013). Globally, anthropogenic human stresses are
diminishing bat populations through habitat destruction and fragmentation, disturbance to
roosts, overhunting, increased pesticides usage, water pollution and wind turbines (Kasso &
Balakrishnan, 2013).
Peterson et al. (1995) estimated the bat fauna of Madagascar at 27 species, with 56% endemism.
As of 2015, 44 bat species (41 insectivorous and 3 frugivorous) have been documented on
Madagascar, with 32 (73%) being endemic to the island and a further five species (a total of
89%) on Madagascar and neighbouring western Indian Ocean islands (Cardiff & Jenkins,
2016). One family, Myzopodidae, is endemic to Madagascar. Most of the bats species have
their origins from the nearby mainland of Africa yet some (e.g. Pipistrellus raceyi, Pteropus
rufus, Paremballonura atrata and P. tiavato) may have colonized Madagascar from Asia
(Fleming & Racey, 2010).
There has been a considerable increase in data for a wide array of Malagasy land mammals
(Goodman et al., 2005). With regard to bats, there has been increased taxonomic studies
(Goodman et al., 2006, 2007, 2008, 2012, 2015) and estimates of suitable habitat using ENMs
19
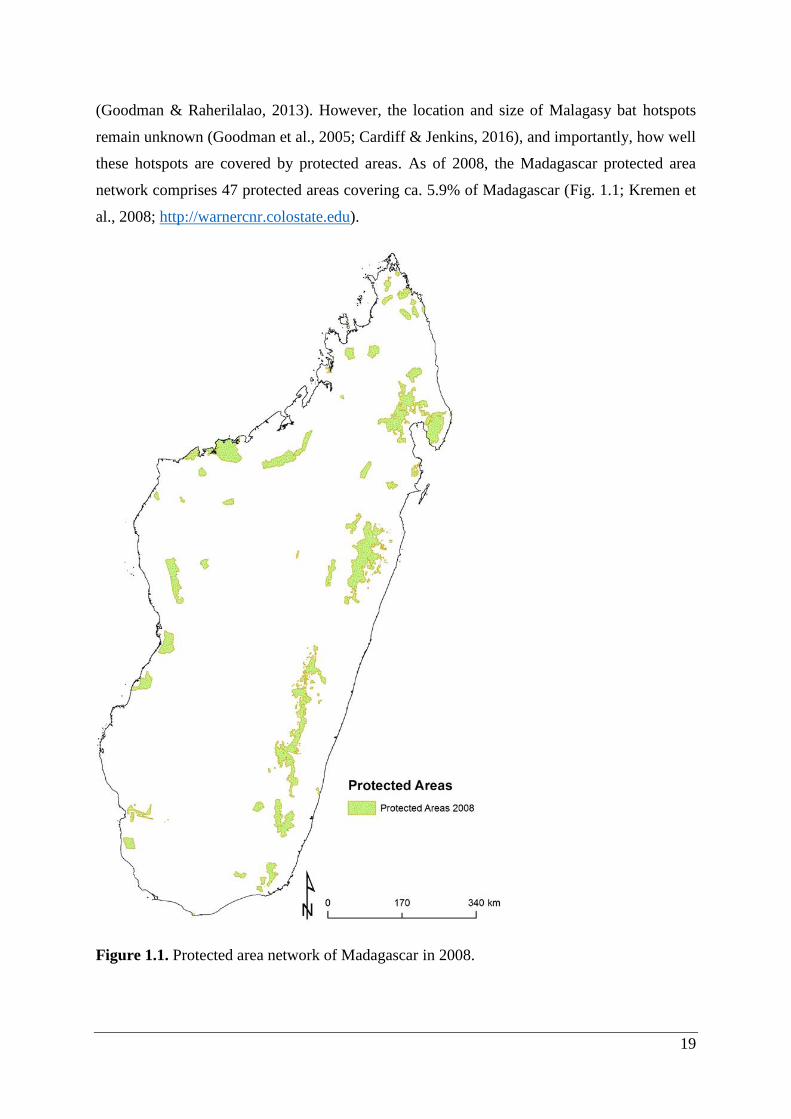
(Goodman & Raherilalao, 2013). However, the location and size of Malagasy bat hotspots
remain unknown (Goodman et al., 2005; Cardiff & Jenkins, 2016), and importantly, how well
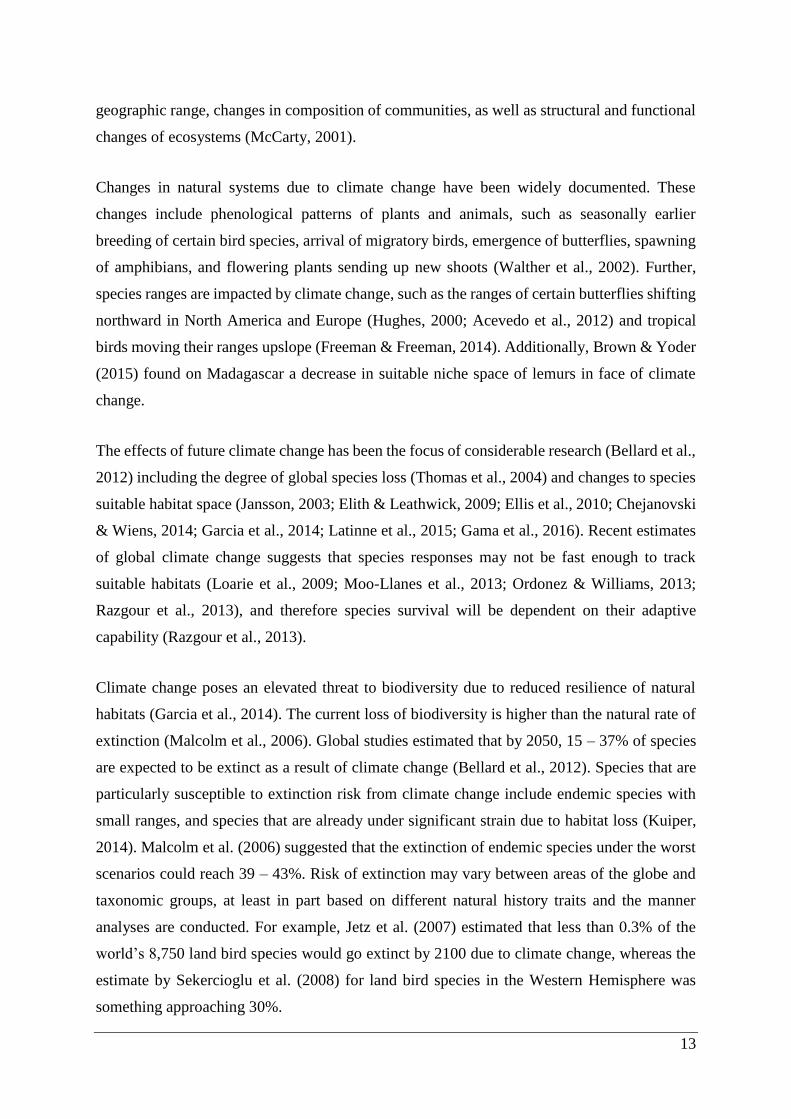
these hotspots are covered by protected areas. As of 2008, the Madagascar protected area
network comprises 47 protected areas covering ca. 5.9% of Madagascar (Fig. 1.1; Kremen et
al., 2008; http://warnercnr.colostate.edu).
Figure 1.1. Protected area network of Madagascar in 2008.
20
1.5 Research questions, objectives and predictions
In this study, three research questions are addressed:
1. Do areas of Malagasy bat richness hotspots change over different climatic projections
and human land use in the past, present and future?
2. Do current and future hotspots fall within Madagascar’s protected areas?
3. Can areas be included in the protected area network to better protect the Malagasy bat
hotspots?
The objectives of this study were to:
1. Quantify suitable habitat space of Malagasy bat species with environmental niche
models (ENMs) under past – current – future climate projections, as well as human land
use scenarios taking different modelling approaches (Brown & Yoder, 2015). Estimate
the extent and location of species richness hotspots under climate and human land use
scenarios by stacked ENMs of species (Mateo et al., 2012; Pottier et al., 2012; Gastón
& García-Viñas, 2013; Distler et al., 2015).
2. Calculate Grinnellian niche overlap for animalivorous bats placed in three functional
group (FG) pairs (open-air, clutter-edge and clutter; sensu Schoeman & Jacobs, 2008)
under different climate and human land use scenarios.
3. Assess how protected areas (PAs) cover individual bat species and richness hotspots.
4. Identify key areas outside PAs for protection of bat diversity using a gap analysis.
In turn, it is predicted that:
1. Decreased suitable habitat space for species and hence decreased hotspots under
warmer (i.e. Last Inter-glacial (LIG) and future) climate scenarios, particularly in
combination with human land use.
2. Changes in climate would influence bats similarly within functional groups (FGs) and
differently across FGs. Specifically, ENMs of bats adapted to forage in vegetation
(clutter FG) would be more affected by changes in climate and land use than bats
adapted to hunt insects near vegetation (clutter-edge FG) and high above vegetation
(open-air FG).
3. Bat richness hotspots will have poor coverage by Madagascar’s PA networks for
current and future scenarios, due to broad distribution ranges of bats and limited area
covered by PAs across Madagascar.
21
CHAPTER 2: MATERIALS AND METHODS
2.1 Study area
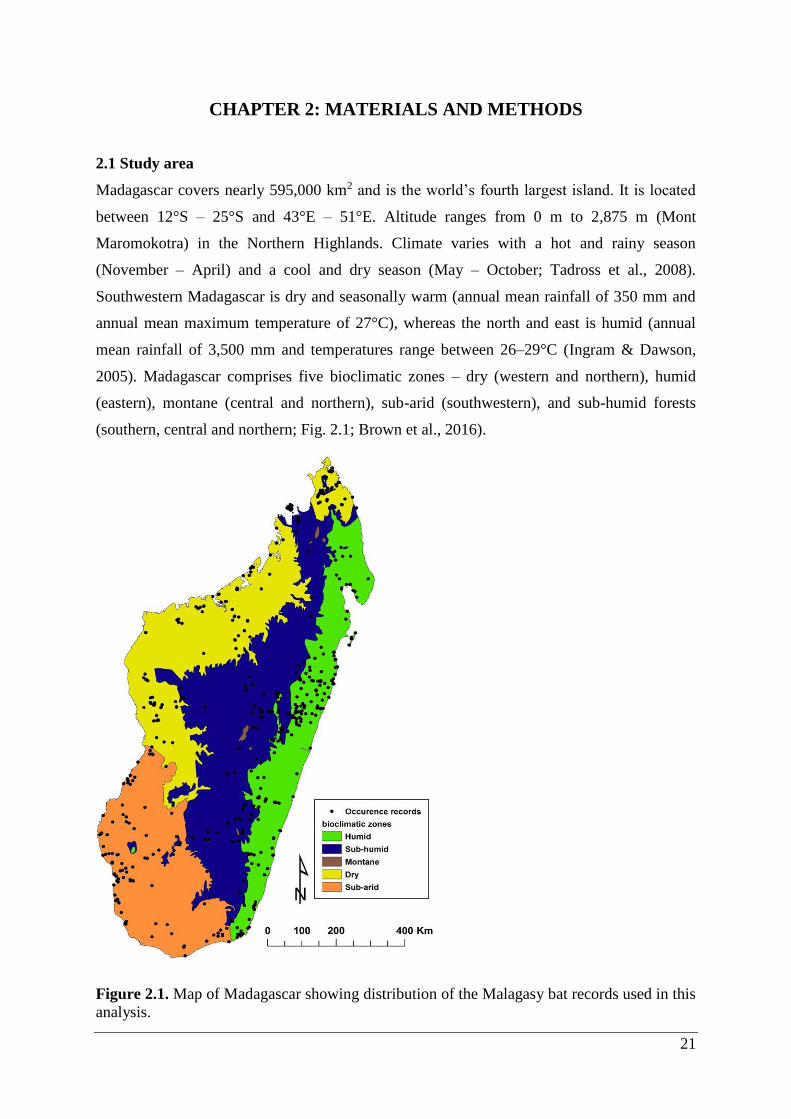
Madagascar covers nearly 595,000 km2 and is the world’s fourth largest island. It is located
between 12°S – 25°S and 43°E – 51°E. Altitude ranges from 0 m to 2,875 m (Mont
Maromokotra) in the Northern Highlands. Climate varies with a hot and rainy season
(November – April) and a cool and dry season (May – October; Tadross et al., 2008).
Southwestern Madagascar is dry and seasonally warm (annual mean rainfall of 350 mm and
annual mean maximum temperature of 27°C), whereas the north and east is humid (annual
mean rainfall of 3,500 mm and temperatures range between 26–29°C (Ingram & Dawson,
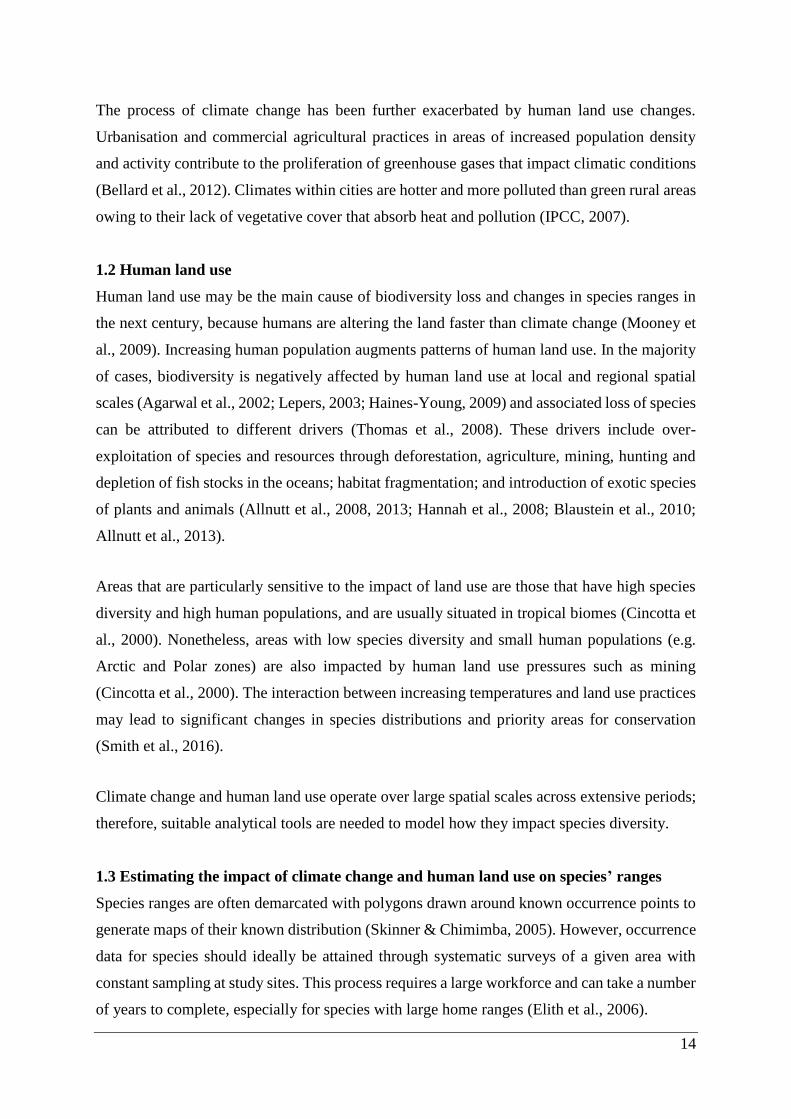
2005). Madagascar comprises five bioclimatic zones – dry (western and northern), humid
(eastern), montane (central and northern), sub-arid (southwestern), and sub-humid forests
(southern, central and northern; Fig. 2.1; Brown et al., 2016).
Figure 2.1. Map of Madagascar showing distribution of the Malagasy bat records used in this
analysis.

22
2.2 Occurrence data
The bat occurrence database that formed the foundation of this study comprised 7,454
individual records for 37 species, and seven families (Goodman & Ramasindrazana, 2013; Fig.
2.1). These data were collected over three decades at 226 sites. Bats were captured with mist
nets, harp traps and hand nets inside and outside day roosts including caves, mines and roofs
of houses, as well as across forest flyways, along forest edges, and across and along rivers and
streams. Specimens associated with the individual records are deposited at 12 different natural
history museums in eight countries, and species identification of most were verified by Dr
Steven M. Goodman.
To reduce potential uneven sampling effort and ensure that the data are spatially independent
from each other (Schoeman et al., 2013), a spatial filter was applied to occurrence records by
selecting one record within a radius of 10 km (Kramer-Schadt et al., 2013; Boria et al., 2014).
This radius was chosen because previous studies have shown that bats tend to forage in and
around a radius of 10 km (e.g. Ralisata et al., 2010; Bambini et al., 2011). Given that niche
models perform better with increasing occurrence records (Peterson, 2002; Schoeman et al.,
2013), species with ≤10 occurrence points were excluded (Table A1.1). The remaining 25
species were used in ENMs (Table 2.1).

23
Table 2.1. 25 Malagasy bat species with greater than 10 occurrence points used in ENM
analyses
Species Abbreviations Occurrence points Functional group
Chaerephon atsinanana Cat 41 open-air
Chaerephon leucogaster Cle 41 open-air
Eidolon dupreanum Edu 22 fruit bats
Hipposideros commersoni Hco 68 clutter
Miniopterus aelleni Mae 12 clutter-edge
Miniopterus egeri Meg 20 clutter-edge
Miniopterus gleni Mgl 26 clutter-edge
Miniopterus griveaudi Mgr 19 clutter-edge
Miniopterus mahafaliensis Mmah 17 clutter-edge
Miniopterus majori Mmaj 20 clutter-edge
Mops leucostigma Mle 76 open-air
Mops midas Mmi 24 open-air
Mormopterus jugularis Mju 64 open-air
Myotis goudoti Mgo 78 clutter-edge
Myzopoda aurita Mau 17 clutter-edge
Neoromicia matroka Nma 20 clutter-edge
Otomops madagascariensis Oma 67 open-air
Paratriaenops furculus Pfu 20 clutter
Paremballonura atrata Pat 36 open-air
Paremballonura tiavato Pti 18 open-air
Pteropus rufus Pru 36 fruit bats
Rousettus madagascariensis Rma 65 fruit bats
Scotophilus robustus Sro 18 clutter-edge
Taphozous mauritianus Tma 11 open-air
Triaenops menamena Tme 33 clutter
2.3 Climatic data
In this study, the potential suitable habitat for Malagasy bats was modelled under current
(1950–2000), past (Last Glacial Maximum (LGM) ~22,000 years ago and Last Inter-glacial
(LIG) ~120,000 – 140,000 years ago) and future (2080) climatic scenarios. Past, current and
future climate change projections were obtained from the Intergovernmental Panel on Climate
Change (IPCC; IPCC, 2007), http://www.worldclim.org and http://www.ccafs-climate.org,
respectively. The global circulation model (GCM) used for the LGM data was CCSM4
24
(Community Climate System Model), a combined climate model for simulating the Earth's
climate system (Zhao et al., 2010). CCSM4 comprises of four distinct models simultaneously
simulating the Earth's atmosphere, ocean, land surface and sea-ice, during past (LGM) climate
states (Zhao et al., 2010). The GCM for the future climate data was IPSL-CM4 (Institut Pierre
Simon Laplace – Climatic Model); IPSL-CM4 is a coupled climate model comprising four
separate models – atmospheric, ocean, sea-ice and land surface. These two models cover the
high and low climatic sensitivity effects, greenhouse gas emissions and anthropogenic
pressures, as well as reflect the amount of global warming as CO2 doubles – CCSM4: 2.4°C
and IPSL-CM4: 3.5°C. The A2 emissions scenario was used as it represents a moderate to
aggressive climate change scenario (Moo-Llanes et al., 2013; Razgour et al., 2013; Brown &
Yoder, 2015). In brief, this model assumes rapid increases in the population, technology,
economic growth, land use, energy consumption and agriculture, with an average increase in
temperature of 3.4°C by the year 2099 (Conde et al., 2011; Moo-Llanes et al., 2013). These
GCMs and emission scenarios represent an average (low to high) emissions trajectory and
estimate of global changes (IPCC, 2007), and have been used in previous studies on bats
(Hughes et al., 2012; Razgour et al., 2013).
Climatic variables are significantly correlated to the physiological and ecological tolerances of
organisms (Soberón, 2007). Furthermore, bioclimatic variables are effective at predicting the
suitable habitat of species using an ENM approach (Hijmans & Graham, 2006; Dixon, 2011;
Hughes et al., 2012; Moo-Llanes et al., 2013; Razgour et al., 2013; Boria et al., 2014).
However, they are often geographically structured such that regions that are closer to one
another have more similar climates than those at further distance (Legendre, 1993). This spatial
auto-correlation is a common cause of bias in spatial modelling techniques (Legendre, 1993;
Diniz-Filho et al., 2003) including ENMs (Segurado et al., 2006; Dormann, 2007). Thus,
autocorrelation was tested between current BIOCLIM variables (Hijmans et al., 2005;
http://www.worldclim.org) at 2.5 arc min (~5 km) resolution using the ade4 package in R
version 3.1.2 (R Development Core Team, 2014). Variables with r ≥0.7 were remove from the
dataset. The following six variables were used in ENMs for all climatic scenarios: mean annual
temperature (BIO 1), maximum temperature of hottest month (BIO 5), minimum temperature
of the coldest month (BIO 6), mean annual rainfall (BIO 12), maximum precipitation of the
wettest month (BIO 13), and minimum precipitation of the driest month (BIO 14).
25
2.4 Land use data
The land use layer was obtained from Anthropogenic Biomes of the World, Version 1 (2001–
2006; https://earthdata.nasa.gov). The data set describes globally significant human interaction
with ecosystems with 16 land use types including agriculture, urbanization and forestry. The
spatial resolution of the data was 5 arc-minutes (~10 km), which was changed to a higher
resolution of 2.5 arc-minutes (~5 km) using dismo package (v.1.0-5) in R version 3.1.2 (R
Development Core Team, 2014).
2.5 Environmental niche models
The aim of environmental niche models (ENMs) is to extrapolate species potential suitable
habitat based on occurrence records and environmental conditions across the landscape (Brown
& Yoder, 2015).
2.5.1 Ensemble modelling approach
Ensemble models are better than a single model, as they exhibit lower mean error and reduce
uncertainty (Araújo & New, 2007). The package BIOMOD2 (v.3.1-64) in R version 3.1.2 (R
Development Core Team, 2014) was used to model the potential suitable habitat space of bat
species using 10 widely used ENM techniques: artificial neural networks (ANN; Ripley, 1996),
surface range envelope (SRE, also known as BIOCLIM; Busby, 1991), generalized additive
models (GAM; Hastie et al., 1994), generalized linear model (GLM; McCullagh & Nelder,
1989), generalized boosted models (GBM; Ridgeway, 1999), classification tree analysis (CTA;
Breiman, 1996), flexible discriminant analysis (FDA; Hastie et al., 1994), multivariate adaptive
regression splines (MARS; Friedman, 1991), random forest for classification and regression
(RF; Breiman, 2001), and maximum entropy (MAXENT; Phillips et al., 2006).
Pseudo-absence data was generated for species using the Biomod_Formating Data function in
the BIOMOD2. Default settings were selected and used to build ENMs (Table 2.2). Binary
maps (suitable = 1, unsuitable areas = 0) were created from the potential suitable habitat maps,
using the threshold selection based on maximizing the sum of sensitivity and specificity (max
SSS; Liu et al., 2013). This threshold performs better (i.e. higher sensitivity, true skill statistic
and kappa) than 10 threshold selections tested by Liu et al. (2013). The ENMs for all species
were modelled with climatic variables, as well as climatic and land use variables.
26
Table 2.2. Algorithms used for the ensemble ENMs and settings for BIOMOD2 modelling options
Algorithm Data BIOMOD_ModelingOptions References
Artificial neural networks (ANN) Absense NbCV (5); size (NULL); decay (NULL); rang (0.1); maxit (200) Ripley (1996)
Classification tree analysis
(CTA)
Absense Method ('class'); parms; cost (NULL) Breiman (1996)
Flexible discriminant analysis
(FDA)
Absense Method ('mars') Hastie et al.
(1994)
Generalized additive models
(GAM)
Absense GAM_gam; myFormula (NULL); k (-1 or 4); family (binomial(link
= 'logit')); gam.control
Hastie et al.
(1994)
Generalized boosted models
(GBM)
Absense Distribution ('bernoulli'); n.trees (2500); interaction.depth (7);
n.minobsinnode (5); shrinkage (0.001); bag.fraction (0.5);
train.fraction (1); cv.folds (3); keep.data (FALSE); verbose
(FALSE); perf.method ('cv')
Ridgeway (1999)
Generalized linear model (GLM) Absense Interaction.level arguments type ('quadratic'); interaction.level (0);
test ('AIC'); family (binomial(link = 'logit')); glm.control
McCullagh &
Nelder (1989)
Maximum entropy (MAXENT) Background Maximum iterations (1000); linear (TRUE); quadratic (TRUE);
regularization multiplier set to 1; threshold (TRUE);
lq2lqptthreshold (80); l2lqthreshold (10)
Phillips et al.
(2006)
Multivariate adaptive regression
splines (MARS)
Absense Degree (2); nk (NULL); penalty (2); thresh (0.001); prune (TRUE) Friedman (1991)
Random forest for classification
and regression (RF)
Absense Do.classif (TRUE); ntree (500); mtry; nodesize (5); maxnodes
(NULL)
Breiman (2001)
Surface range envelope (SRE) Background Quant (0.025) Busby (1991)
27
2.5.2 Model evaluation
To determine which ENM best represented the species potential suitable habitat space, the
ENMs were selected with three methods. First, the area under the curve (AUC) of the receiver
operating characteristic curve (ROC) – AUC is a measure between 0 and 1 that indicates the
accuracy of the model (Manel et al., 2001) – values of 0.5 indicates that the occurrence data
fits no better than the random predictions, whereas AUC values over 0.75 indicates that the
data is a good fit with the predictions (Phillips et al., 2006). Second, the true skill statistic (TSS)
was calculated:
TSS = sensitivity + specificity – 1,
where sensitivity measures the percentage of presences that can be correctly identified or
predicted (i.e. omission errors – positive rates) and specificity measures the percentage of
presences that can be correctly identified or predicted (i.e. commission errors – negative rates),
but is also not affected by prevalence (Allouche et al., 2006). Third, Cohen’s kappa was used
(Pearson et al., 2004; Segurado & Araújo, 2004), which corrects for over accuracy by allowing
chance (Allouche et al., 2006), and is a popular measure of accuracy for presence-absence data.
The statistical values of kappa range from −1 to +1, where values near or close to +1 indicate
perfect arrangement and values of zero or less indicate that predictions are no better than
random (Cohen, 1960; Viera & Garrett, 2005).
ENM models were evaluated and ranked based on AUC, TSS and kappa values, and the ENM
with the highest three criterion was selected (Brown & Yoder, 2015; Fig. 2.2).
28
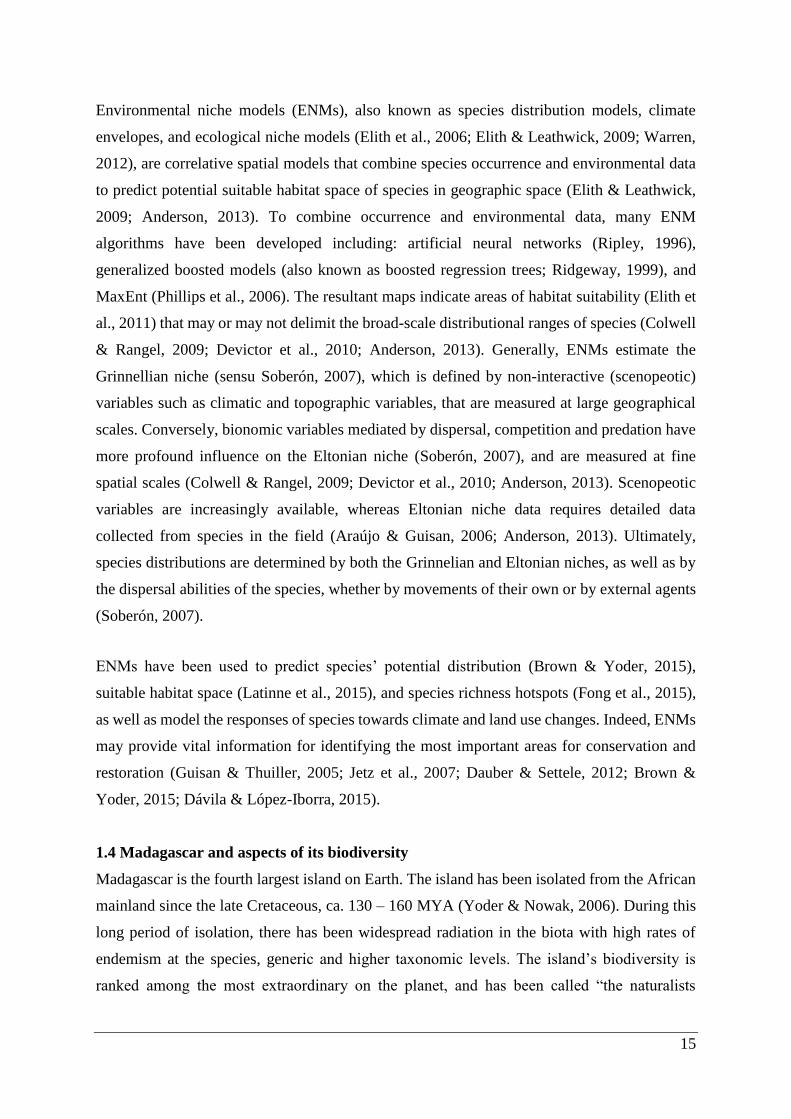
Figure 2.2. Overview of environmental niche modelling. (A) Species occurrence data and
climate data were prepared for Madagascar, (B) ENMs were built based on 10 widely used
modelling techniques (only six shown). (C) The resulting models are filtered based on their
abilities to predict the species’ suitable habitat space (known occurrences and pseudo-absences)
using all three measures: area under the curve (AUC), true skill statistic (TSS), and kappa. (D)
The resulting models with the highest values were projected throughout for the past, current
and future climate and land use models. (Brown & Yoder, 2015)
Climate Data
Species
Occurrence
Data
Past Current Future (A) Input
data
(B) Environmental niche modelling
SRE GLM GAM
SVM GLM MaxEnt
(C) Filtering
Climate data dimension 2
Cli
mate
data
dim
ensi
on
1
Mathematical ENM Occurrence point
All
Models
Filtered
models
Filter by
-AUC
-TSS
-Kappa
(D) Projection Past
Current
Future
29
2.6 Species richness
To produce maps of estimated bat species richness for the past, current and future climate
projections, the binary maps of species were stacked (Distler et al., 2015; D'Amen et al., 2015)
for each climatic scenario using SDMToolbox v.1.1 (http://sdmtoolbox.org/) in ArcGIS
v.10.2.1.
2.7 Coverage of species hotspots by Madagascar protected areas
To evaluate how effective the national PA network covers Malagasy bat hotspots, the PA
network map from 2008 was overlaid with the hotspot map using ArcGIS v.10.2.1
SDMToolbox v.1.1 (http://sdmtoolbox.org/) and the percentage located in protected cells was
calculated by dividing the species area in the protected cells by the total area of the species
hotspot. For the analysis of species that may be broadly distributed or narrowly distributed, the
total area covered (i.e. potential suitable habitat) was taken into account and the percentage in
protected cells was calculated. Broadly distributed species will have a lower percent coverage
in protected areas (compared to narrowly distributed species) – yet these species are probably
less at risk from extinction due to habitat loss because they are widely distributed.
2.8 Niche overlap
Bat species were classed to functional foraging groups (FGs) based on wing morphology and
echolocation (Denzinger & Schnitzler, 2013): (i) open-air bats with long and narrow wings and
low echolocation frequencies of long duration that enable them to fly fast, and that forage and
exploit prey resources in open spaces; (ii) clutter-edge bats with wings of medium length and
width, and echolocation calls of medium frequencies and duration that hunt prey near the edges
of buildings and vegetation or in gaps; and (iii) clutter bats with short and broad wings, and
either low duty cycle echolocation calls with high frequencies and long duration or low duty
cycle echolocation calls of high frequencies and short duration that enable them to forage in
and amongst vegetation for prey (Schnitzler & Kalko, 2001; Monadjem et al., 2010).
Two niche overlap null models were used: the niche identity test and background similarity
test (Warren et al., 2008). For both tests, the potential niche overlap between FG pairs for past,
current and future climate scenarios was calculated with two indices – Hellinger’s based I and
Schoener’s D (Warren et al., 2008). Values ranged from 0 (species have completely discordant
ENMs) to 1 (species have identical ENMs). Values for D are generally lower than those for I.
Null models to test statistical significance of overlap were run using the package phyloclim
30
(v.0.9-4) in R version 3.1.2 (R Development Core Team, 2014). Observed niche identity and
similarity overlap values were compared to 1,000 expected I and D overlap values. If observed
overlap values were larger than 95% of expected values, this was interpreted as the overlap in
ENMs of the two species were significantly less different than expected by chance; if observed
values were smaller than 95% of expected values, this was interpreted as the overlap in ENMs
of the two species were significantly more different than expected by chance (Warren et al.,
2008, 2010).
2.9 Gap analysis
Species were considered as total gap species if their suitable habitat space fell 100% outside
PAs, whereas species with <60% of its distribution were classified as partial gap species (Fong
et al., 2015). Species with coverage of 61 – 99% were considered to have adequate protection
and coverage from the PA networks (Fong et al., 2015).

31
CHAPTER 3: RESULTS
3.1 ENMs of species
In total, 848 occurrence records were modelled for 25 Malagasy bat species (Fig. 3.1a-d &
3.2a-d), ranging from 11 (Taphozous mauritianus) to 78 (Myotis goudoti) with mean number
of records per species = 34.0. ENMs for 12 species that had fewer than 10 occurrences were
not modelled (Table A1.1).
Average AUC values of ENMs with climate variables was 0.973 and for climate/land use was
0.975, indicating good model fits (Elith et al., 2006). TSS values were positive for climate only
(0.98) and climate/land use (0.99) ENMs, suggesting that ENMs effectively fitted the input
data. Similarly, high kappa values indicated effective fitting and accuracy of the input data for
climate (0.98) and climate/land use (0.98) ENMs. Overall, climate/land use ENMs were more
accurate than climate ENMs (Table A2.1).
32
a
~0.9
~0.6
~0.3
0
M. aelleni P. atrata C. atsinanana M. aurita H. commersoni E. dupreanum
M. egeri P. furculus M. gleni M. goudoti M. griveaudi M. jugularis
C. leucogaster M. leucostigma O. madagascariensis R. madagascariensis M. mahafaliensis M. majori
N. matroka T. mauritianus T. menamena M. midas S. robustus P. rufus
P. tiavato

33
b
~0.9
~0.6
~0.3
0
M. aelleni P. atrata C. atsinanana M. aurita H. commersoni E. dupreanum
M. egeri P. furculus M. gleni M. goudoti M. griveaudi M. jugularis
C. leucogaster M. leucostigma O. madagascariensis R. madagascariensis M. mahafaliensis M. majori
N. matroka T. mauritianus T. menamena M. midas S. robustus P. rufus
P. tiavato

34
c
~0.9
~0.6
~0.3
0
M. aelleni P. atrata C. atsinanana M. aurita H. commersoni E. dupreanum
M. egeri P. furculus M. gleni M. goudoti M. griveaudi M. jugularis
C. leucogaster M. leucostigma O. madagascariensis R. madagascariensis M. mahafaliensis M. majori
N. matroka T. mauritianus T. menamena M. midas S. robustus P. rufus
P. tiavato
35
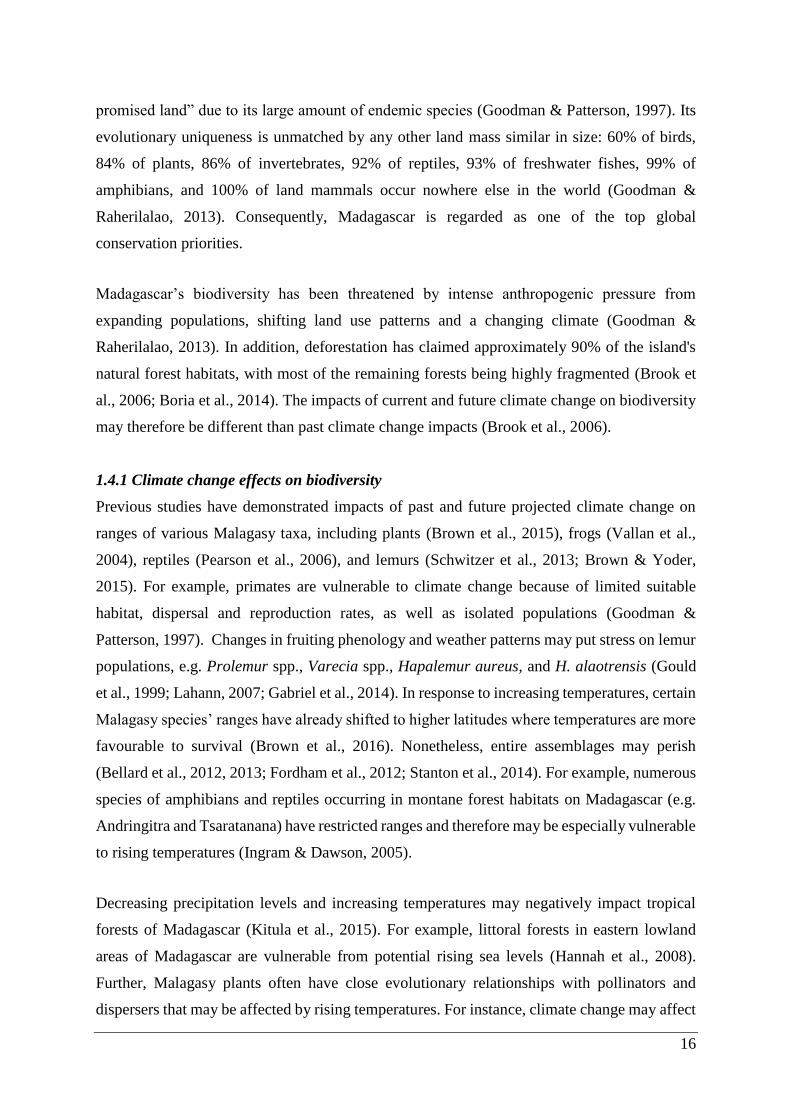
d
Figure 3.1. Potentially suitable habitat space for 25 Malagasy bat species created by ecological
niche models with only climatic variables. Areas of suitability are shown in a range of colours
from red being highly suitable to blue that is unsuitable. Predicted potential distributions are
shown for the (a) last inter-glacial, (b) last glacial maximum, (c) current and (d) future climatic
scenarios.
~0.9
~0.6
~0.3
0
M. aelleni P. atrata C. atsinanana M. aurita H. commersoni E. dupreanum
M. egeri P. furculus M. gleni M. goudoti M. griveaudi M. jugularis
C. leucogaster M. leucostigma O. madagascariensis R. madagascariensis M. mahafaliensis M. majori
N. matroka T. mauritianus T. menamena M. midas S. robustus P. rufus
P. tiavato

36
a
~0.9
~0.6
~0.3
0
M. aelleni P. atrata C. atsinanana M. aurita H. commersoni E. dupreanum
M. egeri P. furculus M. gleni M. goudoti M. griveaudi M. jugularis
C. leucogaster M. leucostigma O. madagascariensis R. madagascariensis M. mahafaliensis M. majori
N. matroka T. mauritianus T. menamena M. midas S. robustus P. rufus
P. tiavato
37
b
~0.9
~0.6
~0.3
0
M. aelleni P. atrata C. atsinanana M. aurita H. commersoni E. dupreanum
M. egeri P. furculus M. gleni M. goudoti M. griveaudi M. jugularis
C. leucogaster M. leucostigma O. madagascariensis R. madagascariensis M. mahafaliensis M. majori
N. matroka T. mauritianus T. menamena M. midas S. robustus P. rufus
P. tiavato
38
c
~0.9
~0.6
~0.3
0
M. aelleni P. atrata C. atsinanana M. aurita H. commersoni E. dupreanum
M. egeri P. furculus M. gleni M. goudoti M. griveaudi M. jugularis
C. leucogaster M. leucostigma O. madagascariensis R. madagascariensis M. mahafaliensis M. majori
N. matroka T. mauritianus T. menamena M. midas S. robustus P. rufus
P. tiavato
39
d
Figure 3.2. Potentially suitable habitat space for 25 Malagasy bat species created by ecological
niche models using climatic/land use variables. Areas of suitability are shown in a range of
colours from red being highly suitable to blue that is unsuitable. Predicted potential
distributions are shown for the (a) last inter-glacial, (b) last glacial maximum, (c) current and
(d) future climatic scenarios.
~0.9
~0.6
~0.3
0
M. aelleni P. atrata C. atsinanana M. aurita H. commersoni E. dupreanum
M. egeri P. furculus M. gleni M. goudoti M. griveaudi M. jugularis
C. leucogaster M. leucostigma O. madagascarienis R. madagascariens M. mahafalienis M. majori
N. matroka T. mauritianus T. menamena M. midas S. robustus P. rufus
P. tiavato
40
3.2 Species richness
Total bat species richness varied between one and 18 species per site. Species richness of bats
was highest in the northern part of the island with respect to climate and climate/land use
scenarios. Additional hotspots were positioned in the northwest and eastern lowland areas.
Richness patterns under different climate and land use change scenarios varied. Hotspots
comprised of two groups of cells that were defined by upper quartile hotspots (≥10 species;
Fig. A2.1) and high area occupancy. Hotspots for maximum species richness (highest total of
species in cells) had lower area occupancy.
3.2.1 Climate only
Species richness of bats ranged from 0 – 17 species at 1 km2 resolution (Table 3.1; Fig. 3.3a-
d). ENMs predicted potential occurrence ≥1 species in 92.7% (27,871 cells), 96.9% (28,444
cells), 91.9% (27,638 cells) and 90.5% (26,618 cells) of LIG, LGM, current and future climate
scenarios, respectively. Highest species richness was concentrated mainly in lowland areas,
whereas lowest richness cells were situated in the Central Highlands (Fig. 3.3a-d). The richness
area coverage was similar for all climate scenarios, yet LGM exhibited the highest hotspot
coverage (32.5%) and future the lowest coverage (21.9%; Table 3.2).
3.2.2 Climate/land use
Species richness for bats ranged from 0 – 18 species at 1 km2 resolution (Table 3.1; Fig. 3.4a-
d). ENMs predicted potential occurrence ≥1 species in 88.1% (25,800 cells), 84.1% (24,619
cells), 89.3% (26,139 cells) and 88.5% (25,944 cells) of LIG, LGM, current and future
scenarios, respectively. Highest species richness was concentrated mainly in lowland areas,
whereas lowest richness cells were situated in the Central Highlands (Fig. 3.4a-d). The richness
area coverage was similar for all scenarios, yet LIG had the highest hotspot coverage (28.4%)
and future the lowest coverage (21.9%; Table 3.2).
41
Figure 3.3. Map of Madagascar illustrating spatial prediction of total Malagasy bat richness
built on the synopsis of each ENMs for climatic variables across various climatic scenarios (a)
last inter-glacial, (b) last glacial maximum, (c) current and (d) future. The colours signify the
number of species per cell, darker colours containing higher number of species as indicated on
the key.
a b
c d
42
Figure 3.4. Map of Madagascar illustrating spatial prediction of total Malagasy bat richness
built on the synopsis of each ENMs for climatic/land use variables across various scenarios (a)
last inter-glacial, (b) last glacial maximum, (c) current and (d) future. The colours signify the
number of species per cell, darker colours containing higher number of species as indicated on
the key.
a b
c d
43
Table 3.1. Malagasy bat species richness statistics for all climatic periods on Madagascar with both climate only and climate/land use variables.
The mean richness per cell including standard deviation, its minimum and maximum values of species and the number of cells that presented them
are shown.
Species richness criteria
Current LIG LGM Future
Climate only
Climate/ Land
use Climate only
Climate/Land
use Climate only
Climate/Land
use Climate only
Climate/Land
use
Mean ± SD 5.9 ± 4.3 5.7 ± 4.2 6.1 ± 4.1 5.8 ± 4.2 6.9 ± 4.5 5.5 ± 4.4 6 ± 3.9 5.6 ± 4.2
Minimum 0 in 2426 cells 0 in 3146 cells 0 in 1748 cells 0 in 3293 cells 0 in 894 cells 0 in 4666 cells 0 in 2786 cells 0 in 3109 cells
Maximum 17 in 3 cells 18 in 5 cells 16 in 73 cells 18 in 4 cells 17 in 159 cells 17 in 29 cells 16 in 8 cells 17 in 1 cells

44
Table 3.2. Statistics for the hotspots selected for last inter-glacial, last glacial maximum, current, and future species richness on Madagascar for
both climate only and climate/land use variables. Two selected hotspots defined as Maximum richness and upper quartile richness, followed by
the percentage they signify in the study area, in parentheses. The % Included/Excluded - refers to all species distribution hotspots that are included
within PAs (left number) and the percentage of the hotspots excluded from the PAs (right number), calculated for each climatic time period and
for both variable types. Percentage within PAs – refers to the hotspots area in relation to the total islands area.
Species richness criteria
Current LIG LGM Future
Climate only
Climate/Land
use Climate only
Climate/Land
use Climate only
Climate/Land
use Climate only
Climate/Land
use
Maximum richness
Hotspot area (km2) 44 (0.01%) 105 (0.02%) 1461 (0.24%) 84 (0.02%) 3290 (0.55%) 606 (0.12%) 206 (0.04%) 21 (0.01%)
% Included/Excluded 0/100 40/60 0.1/99.9 0/100 0.4/99.6 0/100 0.1/99.9 0/100
Percentage within PAs 0% 0.01% 0% 0% 0% 0% 0% 0%
Upper quartile richness
Hotspot area (km2)
157654
(26.1%)
145636
(27.7%)
145257
(24.5%)
147667
(28.4%)
193640
(32.5%)
144505
(27.7%)
128910
(21.9%)
142138
(27.2%)
% Included/Excluded 8.5/91.5 47.2/52.8 7.9/92.1 40.8/59.2 10.2/89.8 44.4/55.6 7.4/92.6 42.8/57.2
Percentage within PAs 2.2% 13.1% 7.9% 11.6% 3.3% 12.9% 1.6% 11.6%
45
3.3 Maximum and upper quartiles hotspots
Maximum richness of all climatic projections (past to future) were located in the northern part
of Madagascar and in lowland areas. Upper quartile richness was restricted to the lowland
portions in the northern, eastern and western portions of the island with partial expansion in
the southern zone. Consistent with the initial prediction, there was a decrease in suitable habitat
space for Malagasy bat species, and, hence, a decrease in hotspots under warmer climate
scenarios, particularly in combination with human land use.
3.3.1 Climate only
Upper quartile hotpots occupied a larger area (21.9 – 32.5%) than maximum richness hotspots
(0.01 – 0.55%; Table 3.2). Thus, upper quartile hotspots included more species. Maximum
richness hotspots had little change in coverage (0.54% change) and positioning (northern
Madagascar) among climatic scenarios (Table 3.2; Fig. 3.5a-d). Upper quartile coverage
exhibited the largest loss in coverage from LGM to current (6.4%) and a further loss of 4.2%
for current to future. The hotspot positions shifted primarily in the west and northwest to the
north and inland areas (Fig. 3.5a-d).
Consistent with the proposed predictions, hotspots marginally overlapped with PAs. Maximum
richness hotspots had between 99.6 – 100% of their areas outside the PAs, whereas between
89.8 – 92.6% of upper quartile hotspots was outside the PAs (Table 3.2; Fig. 3.5a-d).
3.3.2 Climate/land use
Upper quartile hotspots occupied a larger area (27.2 – 28.4%) than maximum richness hotspots
(0.01 – 0.12%; Table 3.2). The maximum richness hotspots changed little in coverage (0.11%
change) and positioning (northern Madagascar) across the different climate and land use
scenarios (Fig. 3.6a-d). Upper quartile richness coverage showed the largest loss in coverage
from LIG to LGM (0.7%) and a further loss of 0.5% from current to future. The positioning of
the hotspots shifted primarily in the west, northwest and eastern lowlands to southeast and
western interior (Fig. 3.6a-d).
Coverage by the PA network of hotspots based on climate/land use data was considerably better
than coverage of hotspots based on climate only. However, high percentages of species were
still found outside the PAs – maximum richness hotspots 60 – 100% and upper quartile hotspots
52.8 – 92.1% (Table 3.2).
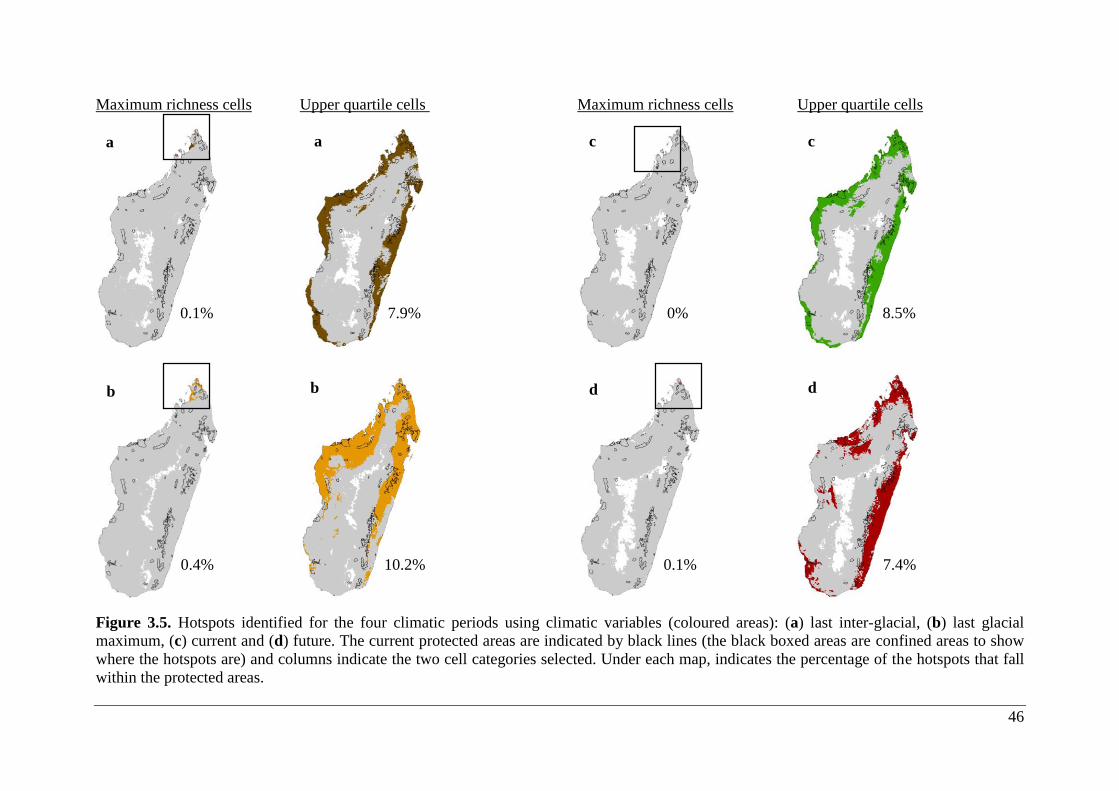
46
Maximum richness cells Upper quartile cells Maximum richness cells Upper quartile cells
Figure 3.5. Hotspots identified for the four climatic periods using climatic variables (coloured areas): (a) last inter-glacial, (b) last glacial
maximum, (c) current and (d) future. The current protected areas are indicated by black lines (the black boxed areas are confined areas to show
where the hotspots are) and columns indicate the two cell categories selected. Under each map, indicates the percentage of the hotspots that fall
within the protected areas.
a a
b b d d
c c
0.1% 7.9% 0% 8.5%
0.4% 10.2% 0.1% 7.4%
47
Maximum richness cells Upper quartile cells Maximum richness cells Upper quartile cells
Figure 3.6. Hotspots identified for the four climatic periods using climatic/land use variables (coloured areas): (a) last inter-glacial, (b) last glacial
maximum, (c) current, and (d) future. The current protected areas are indicated by black lines (the black boxed areas are confined areas to show
where the hotspots are) and columns indicate the two cell categories selected. Under each map, indicates the percentage of the hotspots that fall
within the protected areas.
a a
b b d d
c c
0% 40.8% 40% 47.2%
0% 44.4% 0% 42.8%
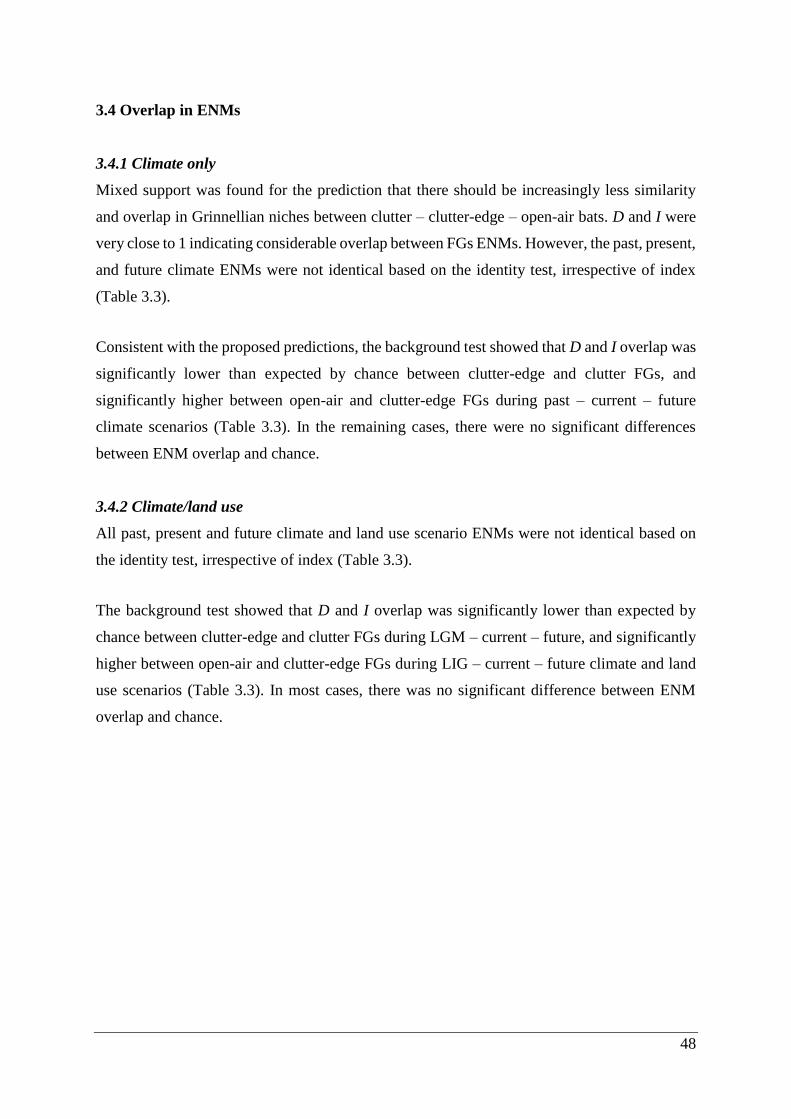
48
3.4 Overlap in ENMs
3.4.1 Climate only
Mixed support was found for the prediction that there should be increasingly less similarity
and overlap in Grinnellian niches between clutter – clutter-edge – open-air bats. D and I were
very close to 1 indicating considerable overlap between FGs ENMs. However, the past, present,
and future climate ENMs were not identical based on the identity test, irrespective of index
(Table 3.3).
Consistent with the proposed predictions, the background test showed that D and I overlap was
significantly lower than expected by chance between clutter-edge and clutter FGs, and
significantly higher between open-air and clutter-edge FGs during past – current – future
climate scenarios (Table 3.3). In the remaining cases, there were no significant differences
between ENM overlap and chance.
3.4.2 Climate/land use
All past, present and future climate and land use scenario ENMs were not identical based on
the identity test, irrespective of index (Table 3.3).
The background test showed that D and I overlap was significantly lower than expected by
chance between clutter-edge and clutter FGs during LGM – current – future, and significantly
higher between open-air and clutter-edge FGs during LIG – current – future climate and land
use scenarios (Table 3.3). In most cases, there was no significant difference between ENM
overlap and chance.
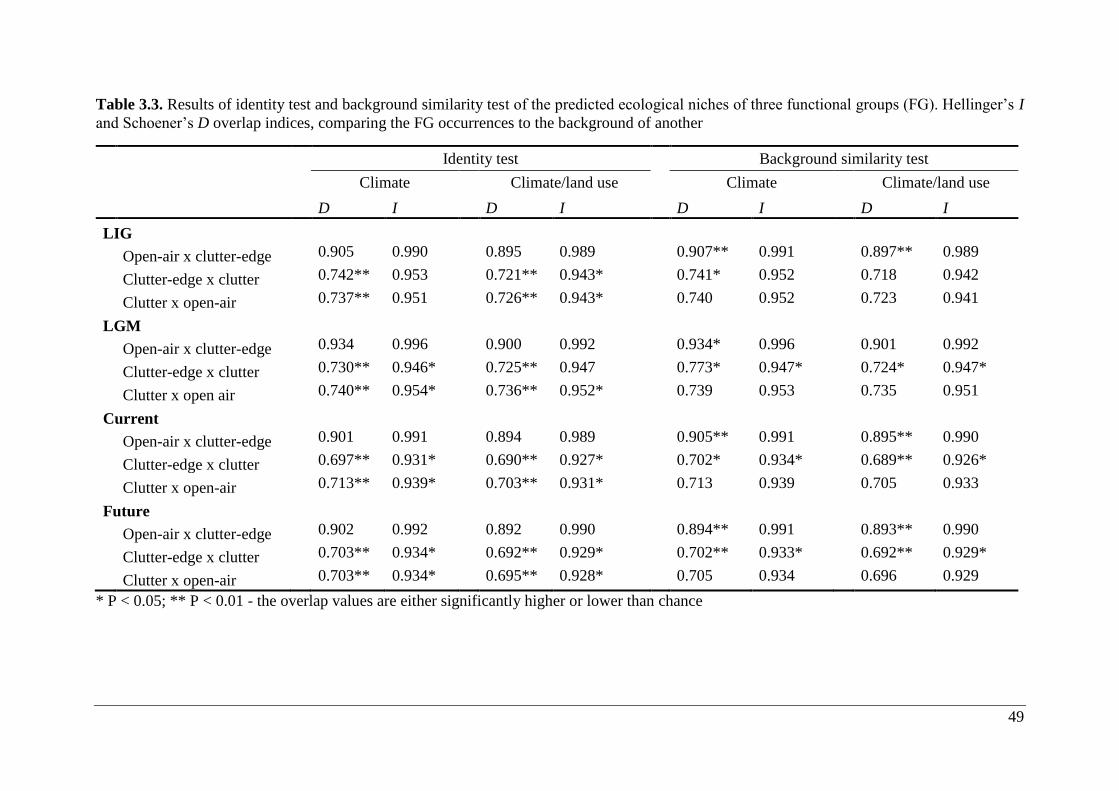
49
Table 3.3. Results of identity test and background similarity test of the predicted ecological niches of three functional groups (FG). Hellinger’s I
and Schoener’s D overlap indices, comparing the FG occurrences to the background of another
Identity test Background similarity test
Climate Climate/land use Climate Climate/land use
D I D I D I D I
LIG
Open-air x clutter-edge 0.905 0.990 0.895 0.989 0.907** 0.991 0.897** 0.989
Clutter-edge x clutter 0.742** 0.953 0.721** 0.943* 0.741* 0.952 0.718 0.942
Clutter x open-air 0.737** 0.951 0.726** 0.943* 0.740 0.952 0.723 0.941
LGM
Open-air x clutter-edge 0.934 0.996 0.900 0.992 0.934* 0.996 0.901 0.992
Clutter-edge x clutter 0.730** 0.946* 0.725** 0.947 0.773* 0.947* 0.724* 0.947*
Clutter x open air 0.740** 0.954* 0.736** 0.952* 0.739 0.953 0.735 0.951
Current
Open-air x clutter-edge 0.901 0.991 0.894 0.989 0.905** 0.991 0.895** 0.990
Clutter-edge x clutter 0.697** 0.931* 0.690** 0.927* 0.702* 0.934* 0.689** 0.926*
Clutter x open-air 0.713** 0.939* 0.703** 0.931* 0.713 0.939 0.705 0.933
Future
Open-air x clutter-edge 0.902 0.992 0.892 0.990 0.894** 0.991 0.893** 0.990
Clutter-edge x clutter 0.703** 0.934* 0.692** 0.929* 0.702** 0.933* 0.692** 0.929*
Clutter x open-air 0.703** 0.934* 0.695** 0.928* 0.705 0.934 0.696 0.929
* P < 0.05; ** P < 0.01 - the overlap values are either significantly higher or lower than chance
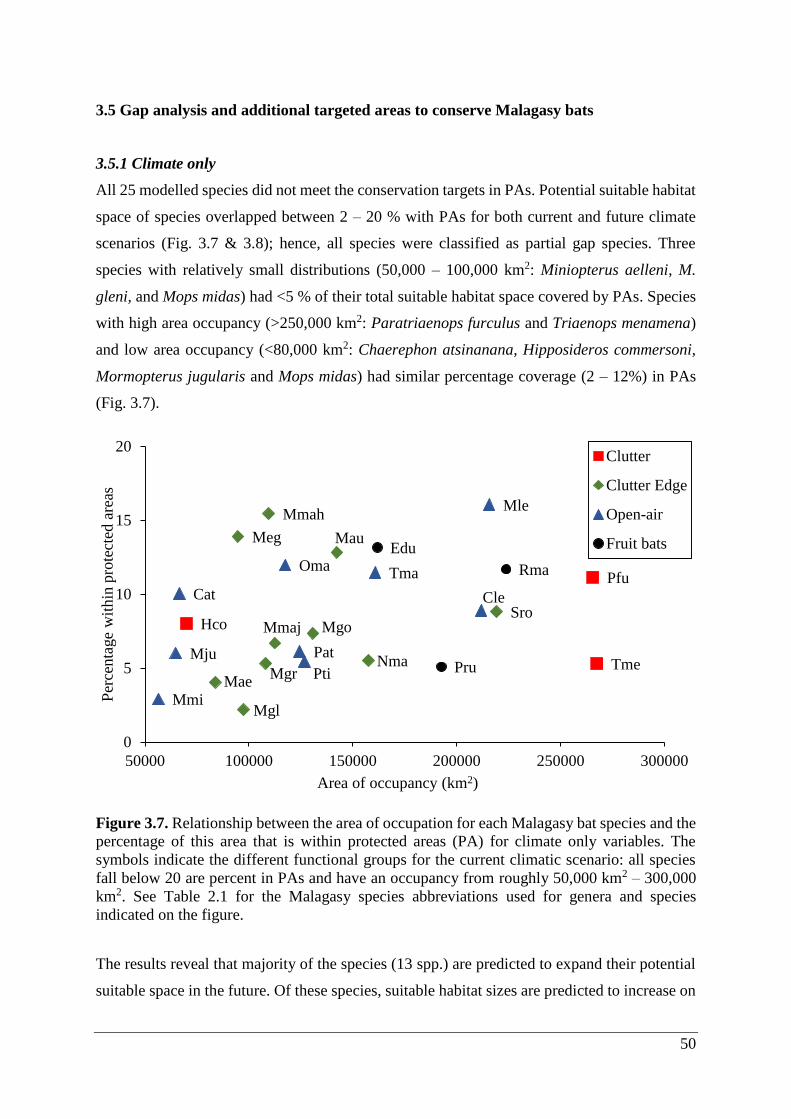
50
3.5 Gap analysis and additional targeted areas to conserve Malagasy bats
3.5.1 Climate only
All 25 modelled species did not meet the conservation targets in PAs. Potential suitable habitat
space of species overlapped between 2 – 20 % with PAs for both current and future climate
scenarios (Fig. 3.7 & 3.8); hence, all species were classified as partial gap species. Three
species with relatively small distributions (50,000 – 100,000 km2: Miniopterus aelleni, M.
gleni, and Mops midas) had <5 % of their total suitable habitat space covered by PAs. Species
with high area occupancy (>250,000 km2: Paratriaenops furculus and Triaenops menamena)
and low area occupancy (<80,000 km2: Chaerephon atsinanana, Hipposideros commersoni,
Mormopterus jugularis and Mops midas) had similar percentage coverage (2 – 12%) in PAs
(Fig. 3.7).
Figure 3.7. Relationship between the area of occupation for each Malagasy bat species and the
percentage of this area that is within protected areas (PA) for climate only variables. The
symbols indicate the different functional groups for the current climatic scenario: all species
fall below 20 are percent in PAs and have an occupancy from roughly 50,000 km2 – 300,000
km2. See Table 2.1 for the Malagasy species abbreviations used for genera and species
indicated on the figure.
The results reveal that majority of the species (13 spp.) are predicted to expand their potential
suitable space in the future. Of these species, suitable habitat sizes are predicted to increase on
Hco
Pfu
TmeMae
Meg
Mgl
Mgr
Mmah
Mmaj Mgo
Mau
Nma
SroCat Cle
Mle
Mmi
Mju
Oma
Pat
Pti
Tma
Edu
Pru
Rma
0
5
10
15
20
50000 100000 150000 200000 250000 300000
Per
centa
ge
wit
hin
pro
tect
ed a
reas
Area of occupancy (km2)
Clutter
Clutter Edge
Open-air
Fruit bats
51
average by 60% (Fig. 3.8). Potential suitable habitat space of the remainder of the species (12
spp., 48%) decreased on average by 37%. Suitable habitat space of nine species decreased
<50%; two species <20%; and one species <5% of its current size (Fig. 3.8).
Under future climate change scenario, there were predicted gains in suitable habitat space in
one clutter, five open-air (5 spp., 78%), six clutter-edge and one fruit bat species (Fig. 3.8). By
contrast, suitable habitat space was predicted to decrease for the reminder of the FGs species;
two clutter, four clutter-edge, two fruit bats, and four open-air bats (Fig. 3.8).
Figure 3.8. Relationship between the area of occupation for each Malagasy bat species and the
percentage of this area that is within protected areas (PA) for climate only variables. The
symbols indicate the different functional groups for the future climatic scenario: all species are
below 25 percent coverage by PAs and have occupancy from roughly 50,000 km2 – 350,000
km2. See Table 2.1 for the Malagasy species abbreviations used for genera and species
indicated on the figure.
Of the 25 species modelled, 15 species (60%) increased in their percentage coverage between
>1 and 12% in the southeast, southwest and western interior. Hipposideros commersoni
increased from 8% in current to 20.1% coverage in future climate scenarios (Fig. 3.7 & 3.8).
The remainder of species decreased in their percentage coverage between >1 and 13% in the
northern, northeast and western regions. Notably, Mops leucostigma decreased from 15.5% in
current climate to 2.5% in future climate scenario (Figs. 3.7 & 3.8).
Hco
Pfu
Tme
Mae
Meg
MglMgr
Mmah
Mmaj
Mgo
Mae
Nma
Sro
Cat
Cle Mle
Mmi
Mju
Oma
Pat
Pti
Tma
Edu
Pru
Rma
0
5
10
15
20
25
50000 100000 150000 200000 250000 300000 350000
Per
centa
ge
wit
hin
pro
tect
ed a
reas
Area of occupancy (km2)
Clutter
Clutter Edge
Open-air
Fruit bats
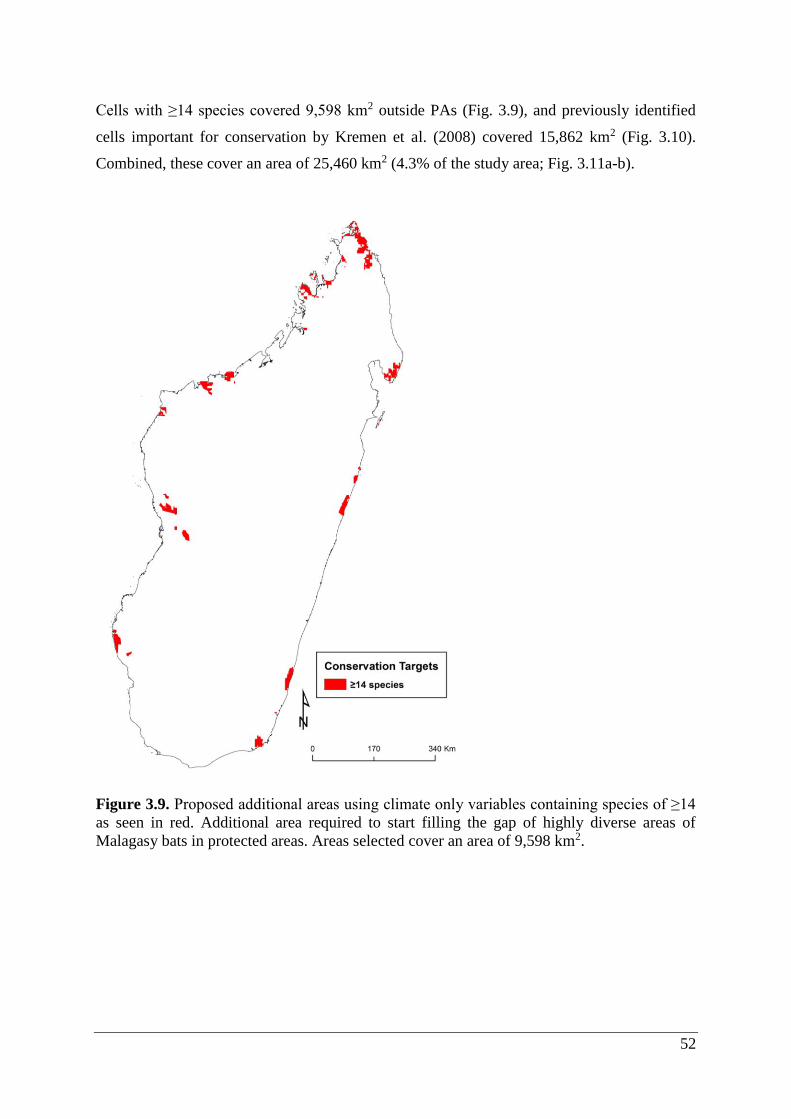
52
Cells with ≥14 species covered 9,598 km2 outside PAs (Fig. 3.9), and previously identified
cells important for conservation by Kremen et al. (2008) covered 15,862 km2 (Fig. 3.10).
Combined, these cover an area of 25,460 km2 (4.3% of the study area; Fig. 3.11a-b).
Figure 3.9. Proposed additional areas using climate only variables containing species of ≥14
as seen in red. Additional area required to start filling the gap of highly diverse areas of
Malagasy bats in protected areas. Areas selected cover an area of 9,598 km2.

53
Figure 3.10. Proposed additional areas from Kremen et al. (2008) for future protection as seen
in green. These areas target high species value in terms of conservational efforts. The proposed
areas will add an additional 15,862 km2.
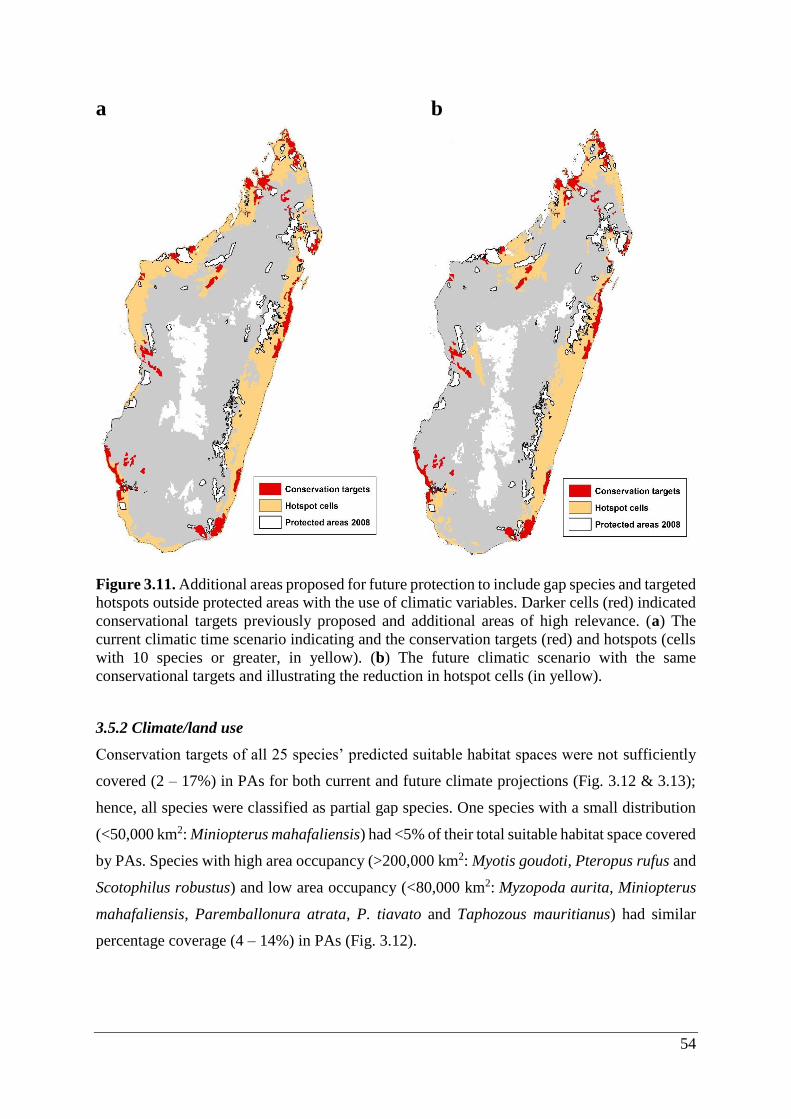
54
a b
Figure 3.11. Additional areas proposed for future protection to include gap species and targeted
hotspots outside protected areas with the use of climatic variables. Darker cells (red) indicated
conservational targets previously proposed and additional areas of high relevance. (a) The
current climatic time scenario indicating and the conservation targets (red) and hotspots (cells
with 10 species or greater, in yellow). (b) The future climatic scenario with the same
conservational targets and illustrating the reduction in hotspot cells (in yellow).
3.5.2 Climate/land use
Conservation targets of all 25 species’ predicted suitable habitat spaces were not sufficiently
covered (2 – 17%) in PAs for both current and future climate projections (Fig. 3.12 & 3.13);
hence, all species were classified as partial gap species. One species with a small distribution
(<50,000 km2: Miniopterus mahafaliensis) had <5% of their total suitable habitat space covered
by PAs. Species with high area occupancy (>200,000 km2: Myotis goudoti, Pteropus rufus and
Scotophilus robustus) and low area occupancy (<80,000 km2: Myzopoda aurita, Miniopterus
mahafaliensis, Paremballonura atrata, P. tiavato and Taphozous mauritianus) had similar
percentage coverage (4 – 14%) in PAs (Fig. 3.12).
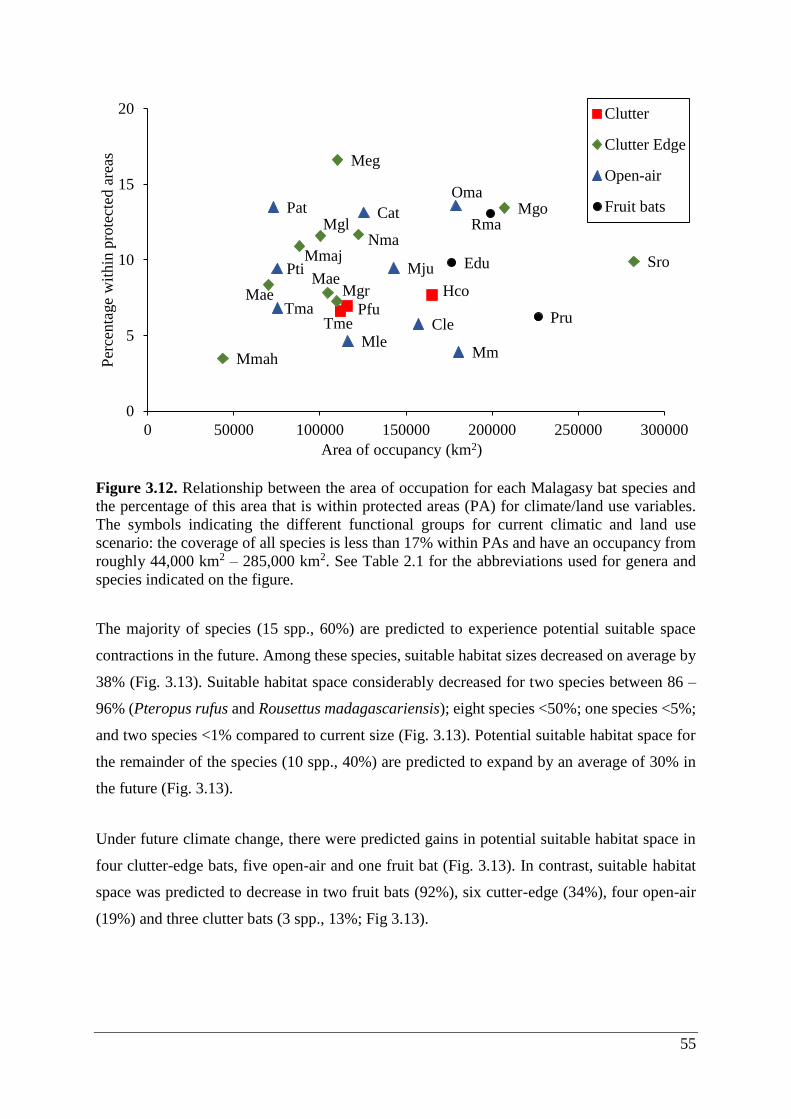
55
Figure 3.12. Relationship between the area of occupation for each Malagasy bat species and
the percentage of this area that is within protected areas (PA) for climate/land use variables.
The symbols indicating the different functional groups for current climatic and land use
scenario: the coverage of all species is less than 17% within PAs and have an occupancy from
roughly 44,000 km2 – 285,000 km2. See Table 2.1 for the abbreviations used for genera and
species indicated on the figure.
The majority of species (15 spp., 60%) are predicted to experience potential suitable space
contractions in the future. Among these species, suitable habitat sizes decreased on average by
38% (Fig. 3.13). Suitable habitat space considerably decreased for two species between 86 –
96% (Pteropus rufus and Rousettus madagascariensis); eight species <50%; one species <5%;
and two species <1% compared to current size (Fig. 3.13). Potential suitable habitat space for
the remainder of the species (10 spp., 40%) are predicted to expand by an average of 30% in
the future (Fig. 3.13).
Under future climate change, there were predicted gains in potential suitable habitat space in
four clutter-edge bats, five open-air and one fruit bat (Fig. 3.13). In contrast, suitable habitat
space was predicted to decrease in two fruit bats (92%), six cutter-edge (34%), four open-air
(19%) and three clutter bats (3 spp., 13%; Fig 3.13).
Hco
PfuTme
Mae
Meg
Mgl
Mgr
Mmah
Mmaj
Mgo
Mae
Nma
Sro
Cat
CleMle
Mm
Mju
OmaPat
Pti
Tma
Edu
Pru
Rma
0
5
10
15
20
0 50000 100000 150000 200000 250000 300000
Per
centa
ge
wit
hin
pro
tect
ed a
reas
Area of occupancy (km2)
Clutter
Clutter Edge
Open-air
Fruit bats
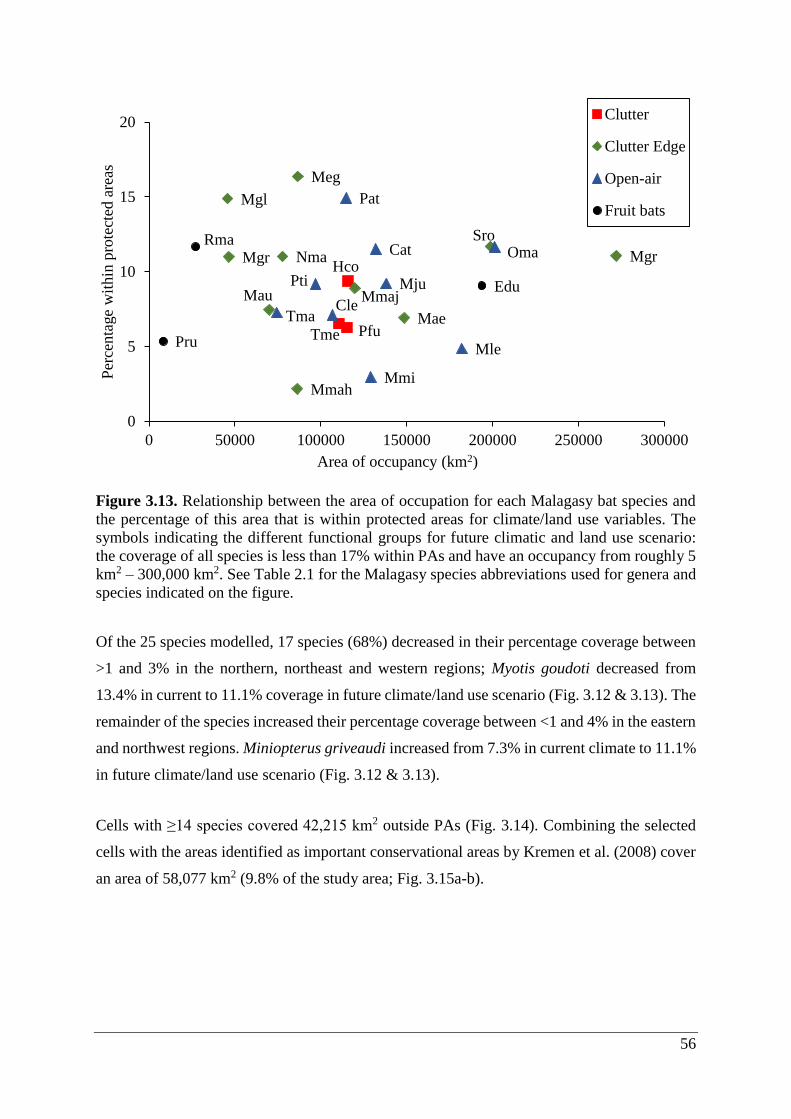
56
Figure 3.13. Relationship between the area of occupation for each Malagasy bat species and
the percentage of this area that is within protected areas for climate/land use variables. The
symbols indicating the different functional groups for future climatic and land use scenario:
the coverage of all species is less than 17% within PAs and have an occupancy from roughly 5
km2 – 300,000 km2. See Table 2.1 for the Malagasy species abbreviations used for genera and
species indicated on the figure.
Of the 25 species modelled, 17 species (68%) decreased in their percentage coverage between
>1 and 3% in the northern, northeast and western regions; Myotis goudoti decreased from
13.4% in current to 11.1% coverage in future climate/land use scenario (Fig. 3.12 & 3.13). The
remainder of the species increased their percentage coverage between <1 and 4% in the eastern
and northwest regions. Miniopterus griveaudi increased from 7.3% in current climate to 11.1%
in future climate/land use scenario (Fig. 3.12 & 3.13).
Cells with ≥14 species covered 42,215 km2 outside PAs (Fig. 3.14). Combining the selected
cells with the areas identified as important conservational areas by Kremen et al. (2008) cover
an area of 58,077 km2 (9.8% of the study area; Fig. 3.15a-b).
Hco
PfuTmeMae
Meg
Mgl
Mgr
Mmah
Mmaj
Mgr
Mau
Nma
SroCat
Cle
Mle
Mmi
Mju
Oma
Pat
Pti
Tma
Edu
Pru
Rma
0
5
10
15
20
0 50000 100000 150000 200000 250000 300000
Per
centa
ge
wit
hin
pro
tect
ed a
reas
Area of occupancy (km2)
Clutter
Clutter Edge
Open-air
Fruit bats
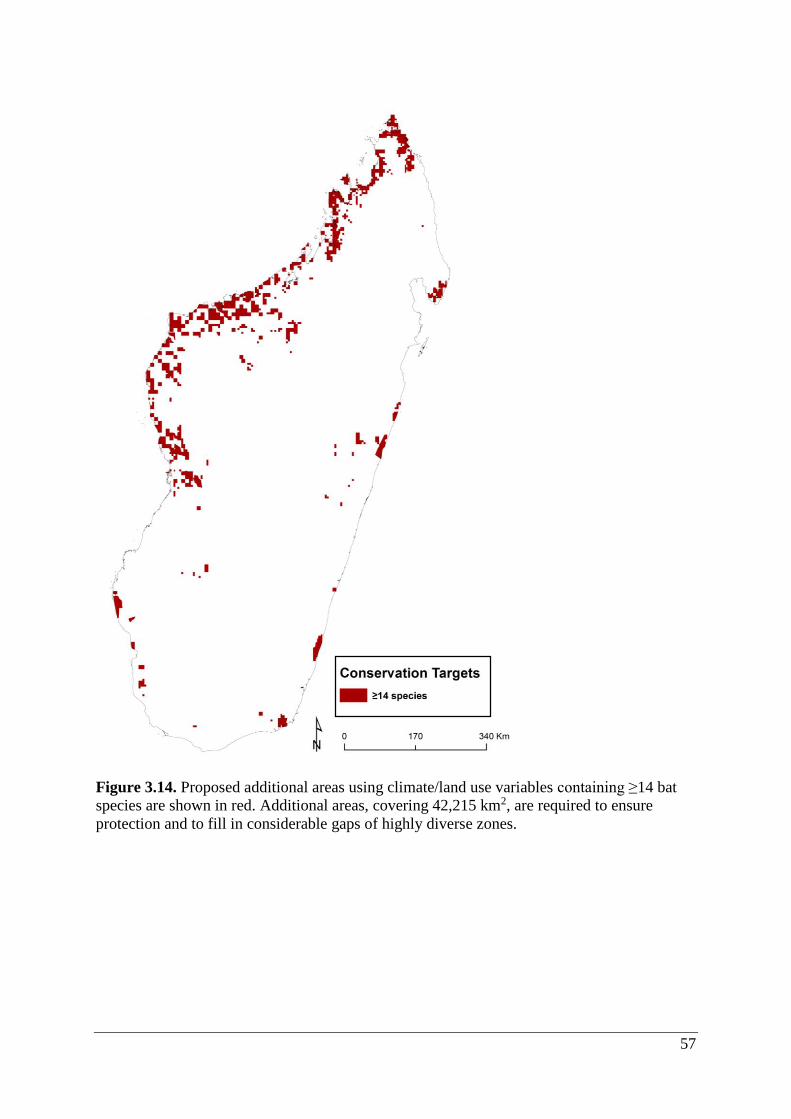
57
Figure 3.14. Proposed additional areas using climate/land use variables containing ≥14 bat
species are shown in red. Additional areas, covering 42,215 km2, are required to ensure
protection and to fill in considerable gaps of highly diverse zones.
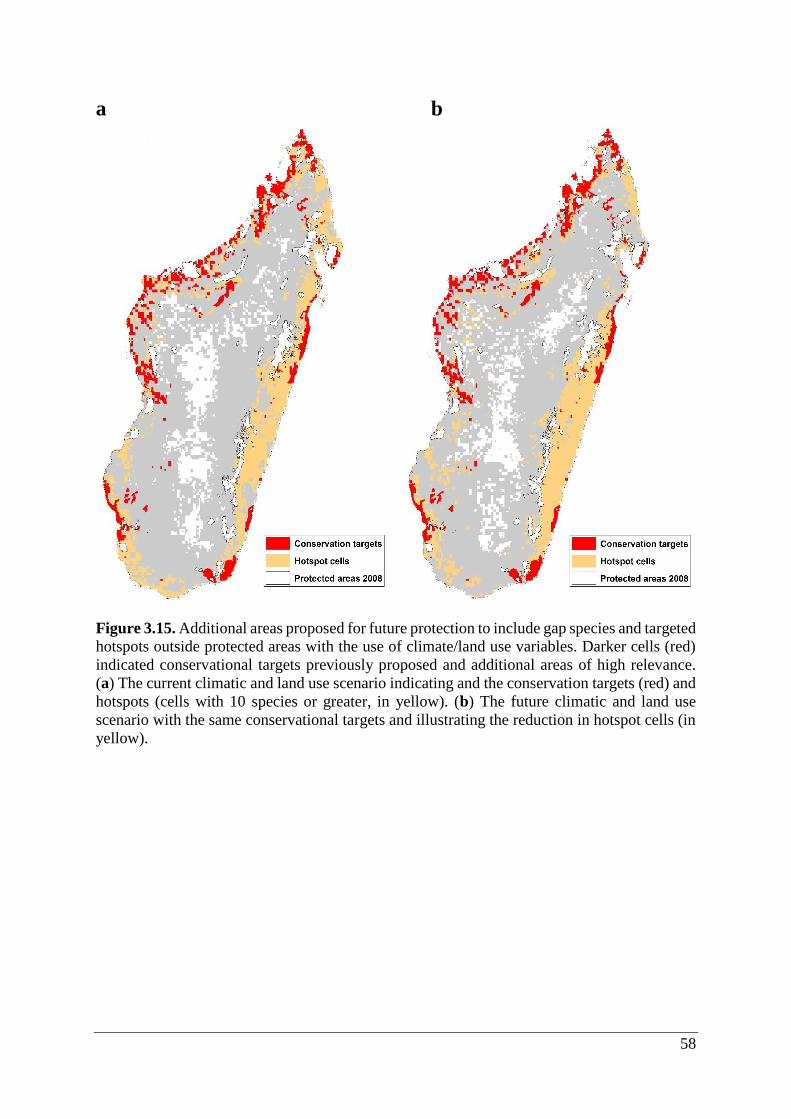
58
a b
Figure 3.15. Additional areas proposed for future protection to include gap species and targeted
hotspots outside protected areas with the use of climate/land use variables. Darker cells (red)
indicated conservational targets previously proposed and additional areas of high relevance.
(a) The current climatic and land use scenario indicating and the conservation targets (red) and
hotspots (cells with 10 species or greater, in yellow). (b) The future climatic and land use
scenario with the same conservational targets and illustrating the reduction in hotspot cells (in
yellow).
59
CHAPTER 4: DISCUSSION
Based on an extensive occurrence database for Malagasy bats and using an environmental niche
modelling (ENM) approach, support was found for the proposed predictions. First, suitable
habitat space for bat species and richness hotspots decreased under warmer – i.e. LIG and future
climate scenarios, particularly in combination with changes in human land use. Human land
use practices associated with modifications of the landscape and conversion of native forest
communities with anthropogenic degradation of vegetation and different forms of agricultural
production rapidly reduce suitable habitat for bats – particularly clutter bats (see second
prediction). Second, climate influenced bats similarly within functional groups (FGs) and
differently across FGs. Specifically, ENMs of bats adapted to forage in vegetation (clutter FG)
were more affected by changes in climate and land use than bats adapted to hunt insects near
vegetation (clutter-edge FG) and high above vegetation (open-air FG). Finally, hotspots of bat
richness was poorly covered for current and future scenarios by the current protected areas
(PA) network on the island, mostly associated with the broad distribution ranges of many bats
on Madagascar and limited area covered within the PAs system.
4.1 Bat hotspots under different climate change and human land use scenarios
Under all climatic conditions, Malagasy bat richness hotspots were concentrated in lowland
areas. High species richness hotspots during LGM were located in the north, northwest and
northeast regions (dry and humid bioclimatic zones), with hotspot patches in the south. A
number of phylogeographic studies are available for Malagasy bats that indicate isolation of
populations in recent geological time, specifically during the last glacial maxima (Goodman et
al., 2009; Richards et al., 2010; Taylor et al., 2012). An example is the genetic contrast between
the southern and central-northern populations in Myotis goudoti and other Malagasy bats (e.g.
Goodman et al., 2009; Ratrimomanarivo et al., 2009) suggesting a common phylogeographical
scenario that these populations had expanded during the Late Pleistocene (Weyeneth et al.,
2011). Similar latitudinal differentiations have been observed in terrestrial vertebrates such as
geckos, lemurs, boas, frogs, small mammals and primates (Weyeneth et al., 2011). This
suggests that in the latter portion of the Pleistocene, climatic variations resulted in the isolation
of certain populations of several different Malagasy taxa and gave rise to the northern and
southern refugia (Wilmé et al., 2006; Muldoon & Goodman, 2010; Reddy et al., 2012).
60
ENMs for Malagasy bat species in the current climatic scenario were similar to MaxEnt niche
models in Goodman & Ramasindrazana (2013). The majority of the current bat hotspots were
found in lowland areas of the humid, dry and sub-arid bioclimatic zones, with minor areas of
high species richness in inland areas of the west (Mahajanga and Marovoay). The future
projection indicated the largest change in location and area of bat hotspots (loss of ~28,744
km2). From current to future climatic scenarios, richness hotspots decreased particularly in
western lowland areas, and showed a displacement inland and to higher altitudes at
approximately 1200 m. Projected mean temperatures with respect to Madagascar indicate an
increase of 1.1–2.6°C across the island by the year 2080. The southern region, as well as
northern and eastern lowland areas are experiencing accelerated warming compared to the rest
of Madagascar (Tadross et al., 2008). Higher elevational zones may provide suitable habitat
with respect to cooler temperatures and higher levels of precipitation, with shorter annual
periods of dry local conditions.
Changes in climate could affect bats around the globe in a variety of ways. For instance, the
shifts in vegetation caused by climate change may result in decreased suitable habitat space for
some species, but an increase for others (Scheel et al., 1996). Increased temperatures in
Madagascar may reduce plant diversity in eastern humid forests (Brown et al., 2015). This will
negatively affect clutter species but may not influence or even favour certain clutter-edge and
open-air bat species. Further, climate change may change the behaviour or dispersal patterns
of species. For example, increased temperatures in Australia influenced the movement of
Pteropus populations to urban roost sites (Parris & Hazell, 2005).
El Niño Southern Oscillation (ENSO) events are correlated with vegetation growth in
Madagascar (Ingram & Dawson, 2005). Anthropogenic pressures may alter the frequency of
ENSO events (Dunham et al., 2010), which could lead to changes in vegetation cover across
Madagascar (Ingram & Dawson, 2005). Species with narrow climate envelopes may be
particularly vulnerable to such climatic changes (Bellard et al., 2012). These may include
animals such as lemurs (Goodman & Ganzhorn, 2004; Lehman et al., 2006; Bublitz et al.,
2015), reptiles and amphibians (Raxworthy & Nussbaum, 1994; Raxworthy et al., 2003;
Lehtinen & Ramanamanjato, 2006; Jenkins et al., 2014; Brown et al., 2016), butterflies (Lees
et al., 1999), snails (Emberton, 1997) and ants (Fisher, 2003), as well as plants (Dumetz, 1999;
Brown et al., 2015). In addition, increases in the frequency of cyclones in the southwest Indian
Ocean are predicted (McBride et al., 2015). Cyclones are known to have detrimental effects on
bat populations in other parts of the world (Jones et al., 2001; Mickleburgh et al., 2002; Xi,

61
2015), and the predicted increase in frequency and intensity of those reaching Madagascar
could affect bat populations. For example, Pteropus rufus commonly roost in trees and their
roost sites are vulnerable to cyclones falling trees (MacKinnon et al., 2003).
When human land use was also considered in combination with future climate change, suitable
habitat space for bat species, and bat richness hotspots decreased to an even greater extent. This
decline in richness hotspots from current to future climate and land use scenarios was mostly
concentrated in the northwest and eastern portions of the island, and shifted from lowland to
inland areas. The predicted decline in bat richness hotspots is consistent with observed and
predicted changes to climate and human land use along the eastern, northern and western
portions of Madagascar (Hannah et al., 2008). The north-western and western regions have
experienced deforestation and human habitat alterations proportionately more than other
forested zones (Harper et al., 2007; Brown & Yoder, 2015). Here, the movement of forest-
adapted species to more suitable habitat space in response to climate change could be further
restricted by encroachment, deforestation, forest degradation and fragmentation (Harper et al.,
2007).
Brown & Yoder (2015) modelled the effects of predicted climate change and human land use
on suitable habitat space for a variety of lemur species, and found similar shifts in species
suitable habitat locations, typically associated with range contractions, and the geographic
positions of hotspots were altered considerably. Hughes et al. (2012) showed that combined
effects of climatic change and land use would affect Southeast Asian bats (including forest-
dependent species) with changes in their predicted ranges in the future. Further, Smith et al.
(2016) found noticeable effects on the distributions of African bats with the combined effects
of future land use and climate changes. The hypothesized areas that bats were likely to move
to following climate change may have already be transformed to human land use and, in turn,
would not support bats (Smith et al., 2016). Similarly, in Madagascar, large areas of forests
with little disturbance for current scenarios may shift to agricultural areas in the future and
areas that bats are likely to move to are already transformed.
4.2 Niche overlap of functional groups
Suitable habitat space of bat species was similar within functional groups (FGs), because
member species exploit similar resources and have similar foraging and echolocation
morphology and behaviour (Denzinger & Schnitzler, 2013). For example, Hipposideros
commersoni, Paratriaenops furculus and Triaenops menamena, are all clutter bat species, and
62
their suitable habitat space is located in the western portion of Madagascar. In contrast,
Grinnellian niches of clutter, clutter-edge and open-air bats were not identical for past, current
and future climate scenarios, which was not surprising given that bats in these FGs differ in
wing morphology, echolocation and foraging behaviour (Denzinger & Schnitzler, 2013). Most
overlap of suitable habitat was between clutter-edge and open-air bats in eastern Madagascar
from inland areas to the more coastal lowlands (sub-humid and humid forests). The niche
overlap between ca. 66% of all possible FG pairs (n = 24 pairs) was significantly low,
suggesting that competition for suitable habitat space between most FG pairs is unlikely. This
percentage is consistent with other animal taxa with estimated values of 64 – 72% overlap
(Fitzpatrick & Turelli, 2006; Wollenberg et al., 2011; Schoeman et al., 2015).
In accordance with predictions, ENMs of clutter bats were more influenced by changes in
climate and land use than those of clutter-edge and open-air FGs. This may be due to clutter
bats being highly adapted to forage in vegetation, and vegetation is likely to be affected by
climate and land use change. Conversely, clutter-edge bats are less constricted by vegetation
and open-air bats the least. Thus, they should be least affected by climate and land use changes.
In some instances, modified habitats can support similar or higher species richness than
unmodified habitats (Gardner, 2009). For example, some bat species potentially benefit from
forest degradation, such as Myzopoda aurita from the endemic family Myzopodidae (Gardner,
2009). This species roots in the travellers tree (Ravenala madagascariensis), which is a
pioneering plant of degraded forest habitats (Ralisata et al., 2015).
Future work should use alternative ENM methods such as mechanistic models (Dormann et
al., 2012) and alternative measures for niche overlap, for example applying kernel smoothers
to provide more informative estimations (Broennimann et al., 2012). Although bats have high
mobility which enables them to exploit natural habitats patches in land use areas (urban
settlements and agricultural landscapes), bat species display high variability in their dispersal
aptitudes at the mesoscale, also within FGs (Smith et al., 2016). Therefore, these models could
be refined by using individual species dispersal abilities (Smith et al., 2016).
4.3 Coverage of bats in Madagascar’s protected areas
Madagascar’s protected areas (PA) system does not adequately cover bat richness hotspots for
current and future scenarios. Notably, increasing climate change and land use result in a
decrease in the coverage the PA network provides associated with bat richness hotspots.
63
Similarly, estimated distribution ranges of various Malagasy taxa (ants, butterflies, frogs,
geckos, lemurs and plants) under current climate change were unrepresented in PAs (Kremen
et al., 2008), with values ranging from a low of 16.2% for plants, a moderate value of 38.5%
for geckos, and a high of about 70% for lemurs (Brown & Yoder, 2015).
The lack of coverage of many species in PAs may be because they were designed to protect
whole habitats (e.g. forests) rather than particular taxonomic groups (Gardner, 2011). Some
Malagasy bats roost in caves and these are more or less covered in PA networks (Cardiff &
Jenkins, 2016). Specifically, several important bat-rooting caves (Ankarana, Namoroka and
Bemaraha) are within PAs. However, sites such as Anjohibe that contain high bat diversity are
still unprotected (Cardiff & Jenkins, 2016). Loss or lack of roosts within PAs may result in
lower species richness. For example, molossid bats are rarely captured in PAs, possibly because
of lack of roost availability (pers. comm. B. Ramasindrazana). Thus, increased roost
availability and protection of roosts in PAs will probably favour greater bat species richness.
Throughout Madagascar’s dry regions, in PAs and non-PAs, caves are subjected to numerous
forms of anthropogenic pressures including mineral exploitation, uncontrolled tourism and
bush meat collection (Cardiff et al., 2009).
Few studies have used ENMs to assess coverage of PAs (Araújo et al., 2011). Bellard et al.
(2012) suggests that areas that could potentially minimize the effects of climate change and
land use should be prioritized for protection, as well as habitats with high biodiversity. Herein,
adequate representation of Malagasy bats in the PAs network will require other additions with
respect to particular habitats and surface area. The results indicate that by increasing the area
of existing PAs x 2.6 times (~93,400 km2), coverage would be improved from 5.9 to 15.6%.
The size and location of the additional areas are similar to those proposed by Kremen et al.
(2008).
In 2003, the former Malagasy President, Marc Ravalomanana, proposed to increase PAs by
60,000 km2 over a course of five years (Norris, 2006). The steering committees (referred to as
the ‘Durban Vision Community’) identified two critical obstacles before establishing these
PAs: i) Madagascar National Parks (MNP), the principal protected area managing group of that
period, did not have the resources/or capacity to manage the expansion themselves; and ii) most
of the priority sites contained significant human populations that depend on natural resources
from within the PAs (Gardner, 2011). By the year 2012, almost a hundred new protected areas
64
had been established legally (Gardner, 2011). However, large gaps remain with respect to how
to resolve conservation and development efforts in Madagascar’s PAs (Gardner, 2011).
Should conservation focus on geographic areas that have high species richness or selected
species? For example, protect a cave roost with high species richness or increase the knowledge
on the hunted roosting colonies such as Pteropus rufus (MacKinnon et al., 2003)? Further,
management variables such as costs, opportunities or threats need also to be considered
(Gardner et al., 2013). Many of the sites prioritized for protection include areas where human
populations depend on local natural resources (Gardner et al., 2013). One way to resolve
conflict between conservation of natural forests and meeting human requirements is by
substitutions, for example, plant plantations on degraded land for alternative sources of wood
(Hannah et al., 2008). However, this may be notably expensive; to grow plantations equivalent
to one-quarter of the natural forest found outside PAs would cost approximately US$ 400
million (Hannah et al., 2008). Alternatively, areas targeted for protection could comprise large
areas for sustainable land use, and small areas for conservation (Gardner, 2009). For example,
the newly named protected area of Ankodida in the southwest has a total area of 107.44 km2,
of which 20.19 km2 (18%) has been allocated for conservation, and the remainder for activities
such as charcoal mining and timber (WWF, 2008).
An integral tool to help with conservational planning strategies would be to use groups of
species that could be used as bio-indicators. These species need to be sensitive to change and
easily sampled, as well as providing objective results (Moreno et al., 2007). Bats are an
important part in the global biodiversity and play key biological functions within ecosystems
(Wilson & Reeder, 2005). Their life history traits (Section 1.4.2; Smith et al., 2016) render
them as good bio-indicators of ecological systems, climate and land use changes and habitat
quality (Jones et al., 2009; Cunto & Bernard, 2012; Heer et al., 2015). However, few studies
have tested this (Smith et al., 2016), for instance the correlation between bat indictors on habitat
changes with those of other taxa (e.g. mammals and birds; Brooks, 2007). Therefore, although
bats may potentially be an important bio-indicator, other taxa that utilise the landscapes in
similar ways to bats should be included in conservation surveys (Pocock & Jennings, 2007).
4.4 Model limitations and future work
ENMs used in this study were correlative models rather than mechanistic models. Mechanistic
models differ from correlative models in that they link functional traits and/or the physiological
performance of species with environmental variables to map distribution ranges of species.
65
Thus, to construct and validate models, mechanistic models require more time, effort, resources
and knowledge of the biology of the organism than correlative models. An advantage of
mechanistic models is that they contain clearly defined parameters and can therefore provide a
better understanding of the underlying factor(s) that drive responses to environmental changes
(Dormann et al., 2012). Further, mechanistic modelling estimate species distribution
independent of current ranges, and therefore their predictions may be more robust than
correlative models which extrapolate potential ranges of species (Elith et al., 2010; Kearney et
al., 2010; Buckley & Kingsolver, 2012). Mechanistic models may better address managerial
questions, given their ability to infer beyond the known conditions and identify traits that
determine biogeography (Evans et al., 2015). For example, including flight and echolocation
aspects (Morin & Thuiller, 2009) of Malagasy bats would refine estimates of distribution
capabilities of species. Studies that include morphological, demographic and genetic data may
further refine predictions on bat species distributions (Razgour et al., 2016). For example, the
use of genetic data offers insight into the evolutionary history of bat populations (Flanders et
al., 2011) and help identify locations of high genetic diversity (Razgour et al., 2016). Several
Malagasy bat species have been the subjects of phylogeographical studies and such data, at
least for mitochondrial markers, are available (e.g. Goodman et al., 2009; Richards et al., 2010;
Taylor et al., 2012).
Additional threats impacting bat species and their habitats (i.e. hunting, persecution, tourism
and rooting disturbances, pesticides, mining, fire, invasive species and diseases; Cardiff &
Jenkins, 2016), were not investigated in this study, yet should be considered in future work.
Ultimately, continued survey work in Madagascar will provide greater refinement for
occurrence data, and improve knowledge of taxonomy and biogeographic patterns of Malagasy
bats.
4.5 Conclusions
This study used a novel approach of combining climatic scenarios and land use data in an
ensemble modelling framework to better understand the vulnerability of Malagasy bats in the
face of climate and land use changes. ENMs predicted considerable change in future patterns
of suitable habitat in response to combined effects of climate change and land use. Specifically,
suitable habitat space will be reduced for most Malagasy bat species, and richness hotspots will
shift and become reduced. Moreover, Madagascar’s bat diversity is vulnerable to both
individual and combined effects of climatic scenarios and human land use, suggesting that
66
depending on the geographical region, priorities on mitigating these effects may be
challenging. The results suggest that Malagasy bats adapted to forage in vegetation will
probably be most vulnerable to both climate change and land use. Whether these bats will be
able to shift their distribution to more suitable habitat will be determined by two important
factors — the likelihood of locating and colonizing suitable habitats within their physiological
tolerances and the presence of dispersal corridors. Further, results also indicate that coverage
of bat richness is poor in PAs, and additional land should be allocated to the PAs system to
better conserve bat diversity under climate and human land use changes. However, PAs are not
managed only by Madagascar National Parks. Certain parts of Madagascar are managed by
non-governmental organizations as New Protected Area or Protected Area (Virah-Sawmy et
al., 2014). At a more local scale, local populations are sometimes involved in the management
and protection of important bat roost sites. These measures of protection of the natural habitat
and resources follow the “Durban Vision” (Virah-Sawmy et al., 2014). Regardless, given the
global importance of Madagascar as a biodiversity hotspot, there is an urgent need to tackle
these challenges at national and provincial levels, as well as on the ground at community level.
67
REFERENCES
Acevedo P., Melo-Ferreira J., Real R., & Alves P.C. (2012) Past, present and future
distributions of an Iberian endemic, Lepus granatensis: Ecological and evolutionary
clues from species distribution models. PLoS ONE, 7, e51529.
Agarwal C., Green G.M., Grove J.M., Evans T.P., & Schweik C.M. (2002) A review and
assessment of land-use change models: Dynamics of space, time, and human choice,
pp. 61. General Technical Report NE-297. Newton Square, PA: U.S.D.A. Forest
Service, Northeastern Research Station.
Allnutt T.F., Asner G.P., Powell G.V.N., & Golden C.D. (2013) Mapping recent
deforestation and forest disturbance in northeastern Madagascar. Tropical
Conservation Science, 6, 1–15.
Allnutt T.F., Ferrier S., Manion G., Powell G.V.N., Ricketts T.H., Fisher B.L., Harper G.J.,
Irwin M.E., Kremen C., Labat J.-N., Lees D.C., Pearce T.A., & Rakotondrainibe F.
(2008) A method for quantifying biodiversity loss and its application to a 50-year
record of deforestation across Madagascar. Conservation Letters, 1, 173–181.
Allouche O., Tsoar A., & Kadmon R. (2006) Assessing the accuracy of species distribution
models: Prevalence, kappa and the true skill statistic (TSS). Journal of Applied
Ecology, 43, 1223–1232.
Anderson R.P. (2013) A framework for using niche models to estimate impacts of climate
change on species distributions. Annals of the New York Academy of Sciences, 1297,
8–28.
Andreae M.O. & Merlet P. (2001) Emission of trace gases and aerosols from biomass
burning. Global biogeochemical cycles, 15, 955–966.
Araújo M.B. & Guisan A. (2006) Five (or so) challenges for species distribution modelling.
Journal of Biogeography, 33, 1677–1688.
Araújo M. & New M. (2007) Ensemble forecasting of species distributions. Trends in
Ecology & Evolution, 22, 42–47.
Araújo M.B., Alagador D., Cabeza M., Nogués-Bravo D., & Thuiller W. (2011) Climate
change threatens European conservation areas. Ecology Letters, 14, 484–492.
Bambini L., Kofoky A.F., Mbohoahy T., Ralisata M., Manjoazy T., Hosken D.J., & Jenkins
R.K.B. (2011) Do bats need trees? Habitat use of two Malagasy hipposiderid bats
Triaenops furculus and T. menamena in the dry southwest. Hystrix, the Italian
Journal of Mammalogy, 22, 81–92.
Bellard C., Bertelsmeier C., Leadley P., Thuiller W., & Courchamp F. (2012) Impacts of
climate change on the future of biodiversity. Ecology Letters, 15, 365–377.
Bellard C., Thuiller W., Leroy B., Genovesi P., Bakkenes M., & Courchamp F. (2013) Will
climate change promote future invasions? Global Change Biology, 19, 3740–3748.
68
Blaustein A.R., Walls S.C., Bancroft B.A., Lawler J.J., Searle C.L., & Gervasi S.S. (2010)
Direct and indirect effects of climate change on amphibian populations. Diversity, 2,
281–313.
Boria R.A., Olson L.E., Goodman S.M., & Anderson R.P. (2014) Spatial filtering to reduce
sampling bias can improve the performance of ecological niche models. Ecological
Modelling, 275, 73–77.
Breiman L. (1996) Bagging predictors. Machine Learning, 24, 123–140.
Breiman L. (2001) Random forests. Machine Learning, 45, 5–32.
Broennimann O., Fitzpatrick M.C., Pearman P.B., Petitpierre B., Pellissier L., Yoccoz N.G.,
Thuiller W., Fortin M.-J., Randin C., Zimmermann N.E., Graham C.H., & Guisan A.
(2012) Measuring ecological niche overlap from occurrence and spatial
environmental data. Global Ecology and Biogeography, 21, 481–497.
Brook B.W., Bradshaw C.J.A., Koh L.P., & Sodhi N.S. (2006) Momentum drives the crash:
Mass extinction in the tropics. Biotropica, 38, 302–305.
Brook B.W., Sodhi N.S., & Ng P.K.L. (2003) Catastrophic extinctions follow deforestation in
Singapore. Nature, 424, 420–426.
Brooks T.M. (2007) Shortcuts for biodiversity conservation planning: The effectiveness of
surrogates. Annual Review of Ecology, Evolution, and Systematics, 38, 713–737.
Brown J.L. & Yoder A.D. (2015) Shifting ranges and conservation challenges for lemurs in
the face of climate change. Ecology and Evolution, 5, 1–12.
Brown J.L., Sillero N., Glaw F., Bora P., Vieites D.R., & Vences M. (2016) Spatial
biodiversity patterns of Madagascar's amphibians and reptiles. PLoS ONE, 11,
e0144076.
Brown K.A., Parks K.E., Bethell C.A., Johnson S.E., & Mulligan M. (2015) Predicting plant
diversity patterns in Madagascar: Understanding the effects of climate and land cover
change in a biodiversity hotspot. PLoS ONE, 10, e0122721.
Bublitz D.C., Wright P.C., Rasambainarivo F.T., Arrigo-Nelson S.J., Bodager J.R., &
Gillespie T.R. (2015) Pathogenic enterobacteria in lemurs associated with
anthropogenic disturbance. American Journal of Primatology, 77, 330–337.
Buckley L.B. & Kingsolver J.G. (2012) Functional and phylogenetic approaches to
forecasting species' responses to climate change. Annual Review of Ecology,
Evolution, and Systematics, 43, 205–226.
Burney D.A., Burney L.P., Godfrey L.R., Jungers W.L., Goodman S.M., Wright H.T., & Jull
A.J.T. (2004) A chronology for late prehistoric Madagascar. Journal of Human
Evolution, 47, 25–63.
Busby J.R. (1991) BIOCLIM - a bioclimate analysis and prediction system. CSIRO
Publishing, Australia.

69
Cardiff S.G. & Jenkins R.K.B. (2016) The bats of Madagascar: A conservation challenge.
Lessons in Conservation, 6, 80–108.
Cardiff S.G., Ratrimomanarivo F.H., Rembert G., & Goodman S.M. (2009) Hunting,
disturbance and roost persistence of bats in caves at Ankarana, northern Madagascar.
African Journal of Ecology, 47, 640–649.
Chejanovski Z.A. & Wiens J.J. (2014) Climatic niche breadth and species richness in
temperate treefrogs. Journal of Biogeography, 41, 1936–1946.
Cincotta R.P., Wisnewski J., & Engelman R. (2000) Human population in the biodiversity
hotspots. Nature, 404, 990–992.
Clark M. (2012) Deforestation in Madagascar: Consequences of population growth and
unsustainable agricultural processes. Global Majority E-Journal, 3, 61–71.
Cohen J. (1960) A coefficient of agreement for nominal scales. Educational and
Psychological Measurement, 20, 37–46.
Colwell R.K. & Rangel T.F. (2009) Hutchinson's duality: The once and future niche.
Proceedings of the National Academy of Sciences, 106, 19651–19658.
Conde C., Estrada F., Martínez B., Sánchez O., & Gay C. (2011) Regional climate change
scenarios for Mexico. Atmósfera, 24, 125–140.
Cunto G.C. & Bernard E. (2012) Neotropical bats as indicators of environmental disturbance:
What is the emerging message? Acta Chiropterologica, 14, 143–151.
D'Amen M., Dubuis A., Fernandes R.F., Pottier J., Pellissier L., & Guisan A. (2015) Using
species richness and functional traits predictions to constrain assemblage predictions
from stacked species distribution models. Journal of Biogeography, 42, 1255–1266.
Dauber J. & Settele J. (2012) Shedding light on the biodiversity and ecosystem impacts of
modern land use. BioRisk, 7, 1–4.
Davis M.B., Shaw R.G., & Etterson J.R. (2005) Evolutionary responses to changing climate.
Ecology, 86, 1704–1714.
Denzinger A. & Schnitzler H.-U. (2013) Bat guilds, a concept to classify the highly diverse
foraging and echolocation behaviors of microchiropteran bats. Frontiers in
Physiology, 4, 1–15.
Devictor V., Clavel J., Julliard R., Lavergne S., Mouillot D., Thuiller W., Venail P., Villéger
S., & Mouquet N. (2010) Defining and measuring ecological specialization. Journal
of Applied Ecology, 47, 15–25.
Diniz-Filho J.A.F., Bini L.M., & Hawkins B.A. (2003) Spatial autocorrelation and red
herrings in geographical ecology. Global Ecology and Biogeography, 12, 53–64.
Distler T., Schuetz J.G., Velásquez-Tibatá J., & Langham G.M. (2015) Stacked species
distribution models and macroecological models provide congruent projections of
avian species richness under climate change. Journal of Biogeography, 42, 976–988.
70
Dixon M.D. (2011) Post-Pleistocene range expansion of the recently imperiled eastern little
brown bat (Myotis lucifugus lucifugus) from a single southern refugium. Ecology and
Evolution, 1, 191–200.
Dormann C.F. (2007) Effects of incorporating spatial autocorrelation into the analysis of
species distribution data. Global Ecology and Biogeography, 16, 129–138.
Dormann C.F., Schymanski S.J., Cabral J., Chuine I., Graham C., Hartig F., Kearney M.,
Morin X., Römermann C., Schröder B., & Singer A. (2012) Correlation and process
in species distribution models: Bridging a dichotomy. Journal of Biogeography, 39,
2119–2131.
Dumetz N. (1999) High plant diversity of lowland rainforest vestiges in eastern Madagascar.
Biodiversity and Conservation, 8, 273–315.
Dunham A.E., Erhart E.M., & Wright P.C. (2010) Global climate cycles and cyclones:
Consequences for rainfall patterns and lemur reproduction in southeastern
Madagascar. Global Change Biology, 17, 219–227.
Dávila N.V. & López-Iborra G.M. (2015) Amphibian hotspots and conservation priorities in
eastern Cuba identified by species distribution modeling. Biotropica, 47, 119–127.
Elith J. & Leathwick J.R. (2009) Species distribution models: Ecological explanation and
prediction across space and time. Annual Review of Ecology, Evolution, and
Systematics, 40, 677–697.
Elith J., Graham C.H., Anderson R.P., Dudík M., Ferrier S., Guisan A., Hijmans R.J.,
Huettmann F., Leathwick J.R., Lehmann A., Li J., Lohmann L.G., Loiselle B.A.,
Manion G., Moritz C., Nakamura M., Nakazawa Y., Overton J.M.M., Peterson A.T.,
Phillips S.J., Richardson K., Scachetti-Pereira R., Schapire R.E., Soberón J., Williams
S., Wisz M.S., & Zimmermann N.E. (2006) Novel methods improve prediction of
species’ distributions from occurrence data. Ecography, 29, 129–151.
Elith J., Kearney M., & Phillips S. (2010) The art of modelling range-shifting species.
Methods in Ecology and Evolution, 1, 330–342.
Elith J., Phillips S.J., Hastie T., Dudík M., Chee Y.E., & Yates C.J. (2011) A statistical
explanation of MaxEnt for ecologists. Diversity and Distributions, 17, 43–57.
Ellis E.A., Baerenklau K.A., Marcos-Martínez R., & Chávez E. (2010) Land use/land cover
change dynamics and drivers in a low-grade marginal coffee growing region of
Veracruz, Mexico. Agroforestry Systems, 80, 61–84.
Ellison J.C. (1993) Mangrove retreat with rising sea-level, Bermuda. Estuarine, Coastal and
Shelf Science, 37, 75–87.
Emberton K.C. (1997) Diversities and distributions of 80 land-snail species in southeastern-
most Madagascan rainforests, with a report that lowlands are richer than highlands in
endemic and rare species. Biodiversity and Conservation, 6, 1137–1154.
Evans T.G., Diamond S.E., & Kelly M.W. (2015) Mechanistic species distribution modelling
as a link between physiology and conservation. Conservation Physiology, 3, cov056.
71
Findley J.S. (1993) Bats: A community perspective. Journal of Mammalogy, 76, 264–266.
Fisher B. (2003) Formicidae, ants. The natural history of Madagascar (ed. by S.M. Goodman
and J.P. Benstead), pp. 811–820. University of Chicago Press, Chicago.
Fitzpatrick B.M. & Turelli M. (2006) The geography of mammalian speciation: Mixed
signals from phylogenies and range maps. Evolution, 60, 601–615.
Flanders J., Wei L., Rossiter S.J., & Zhang S. (2011) Identifying the effects of the Pleistocene
on the greater horseshoe bat, Rhinolophus ferrumequinum, in East Asia using
ecological niche modelling and phylogenetic analyses. Journal of Biogeography, 38,
439–452.
Fleming T.H. & Racey P.A. (2010) Island bats: Evolution, ecology, and conservation.
Chicago University Press, Chicago.
Fong G.A., Viña Dávila N., & López Iborra G.M. (2015) Amphibian hotspots and
conservation priorities in eastern Cuba identified by species distribution modeling.
Biotropica, 47, 119–127.
Fordham D.A., Akçakaya H.R., Araújo M.B., Elith J., Keith D.A., Pearson R., Auld T.D.,
Mellin C., Morgan J.W., Regan T.J., Tozer M., Watts M.J., White M., Wintle B.A.,
Yates C., & Brook B.W. (2012) Plant extinction risk under climate change: Are
forecast range shifts alone a good indicator of species vulnerability to global
warming? Global Change Biology, 18, 1357–1371.
Freeman B.G. & Freeman A.M.C. (2014) Rapid upslope shifts in New Guinean birds
illustrate strong distributional responses of tropical montane species to global
warming. Proceedings of the National Academy of Sciences, 111, 4490–4494.
Friedman J.H. (1991) Rejoinder: Multivariate adaptive regression splines. The Annals of
Statistics, 19, 123–141.
Gabriel D.N., Gould L., & Kelley E.A. (2014) Seasonal patterns of male affiliation in ring-
tailed lemurs (Lemur catta) in diverse habitats across southern Madagascar.
Behaviour, 151, 935–961.
Gama M., Crespo D., Dolbeth M., & Anastácio P. (2016) Predicting global habitat suitability
for Corbicula fluminea using species distribution models: The importance of different
environmental datasets. Ecological Modelling, 319, 163–169.
Garcia R.A., Araújo M.B., Burgess N.D., Foden W.B., Gutsche A., Rahbek C., & Cabeza M.
(2014) Matching species traits to projected threats and opportunities from climate
change. Journal of Biogeography, 41, 724–735.
Gardner C.J. (2009) A review of the impacts of anthropogenic habitat change on terrestrial
biodiversity in Madagascar: Implications for the design and management of new
protected areas. Malagasy Nature, 2, 2–29.
Gardner T.A., Barlow J., Chazdon R., Ewers R.M., Harvey C.A., Peres C.A., & Sodhi N.S.
(2009) Prospects for tropical forest biodiversity in a human-modified world. Ecology
Letters, 12, 561–582.
72
Gardner C.J. (2011) IUCN management categories fail to represent new, multiple-use
protected areas in Madagascar. Oryx, 45, 336–346.
Gardner C.J., Nicoll M.E., Mbohoahy T., Oleson K.L.L., Ratsifandrihamanana A.N.,
Ratsirarson J., de Roland L.-A.R., Virah-Sawmy M., Zafindrasilivonona B., & Davies
Z.G. (2013) Protected areas for conservation and poverty alleviation: Experiences
from Madagascar. Journal of Applied Ecology, 50, 1289–1294.
Gastón A. & García-Viñas J.I. (2013) Evaluating the predictive performance of stacked
species distribution models applied to plant species selection in ecological restoration.
Ecological Modelling, 263, 103–108.
Goodman S.M. & Ganzhorn J.U. (2004) Elevational ranges of lemurs in the humid forests of
Madagascar. International Journal of Primatology, 25, 331–350.
Goodman S.M. & Jungers W.L. (2014) Extinct Madagascar: Picturing the island's past. The
University of Chicago Press, Chicago.
Goodman S.M. & Patterson B.D. (1997) Natural change and human impact in Madagascar.
Smithsonian Institution Press, Washington.
Goodman S.M & Raherilalao M.J. (2013) Atlas d’une sélection de vertébrés terrestres de
Madagascar/Atlas of selected land vertebrates of Madagascar. Association Vahatra,
Antananarivo.
Goodman, S.M & Ramasindrazana, B. (2013) Bats or the order Chiroptera. Atlas d’une
sélection de vertébrés terrestres de Madagascar/Atlas of selected land vertebrates of
Madagascar (ed. by S.M. Goodman and M.J. Raherilalao), pp. 169–209. Association
Vahatra, Antananarivo.
Goodman S.M., Andriafidison D., Andrianaivoarivelo R., Cardiff S.G., Ifticene E., Jenkins
R.K.B., Kofoky A., Mbohoahy T., Rakotondravony D., Ranivo J., Ratrimomanarivo
F., Razafimanahaka J., & Racey P.A. (2005) The distribution and conservation of bats
in the dry regions of Madagascar. Animal Conservation, 8, 153–165.
Goodman S.M., Bradman H.M., Maminirina C.P., Ryan K.E., & Appleton B. (2008) A new
species of Miniopterus (Chiroptera: Miniopteridae) from lowland southeastern
Madagascar. Mammalian Biology - Zeitschrift für Säugetierkunde, 73, 199–213.
Goodman S.M., Maminirina C.P., Bradman H.M., Christidis L., & Appleton B.R. (2009)
Patterns of morphological and genetic variation in the endemic Malagasy bat
Miniopterus gleni (Chiroptera: Miniopteridae), with the description of a new species,
M. griffithsi. Journal of Zoological Systematics and Evolutionary Research, 48, 75–
86.
Goodman S.M., Puechmaille S.J., Friedli-Weyeneth N., Gerlach J., Ruedi M., Schoeman
M.C., Stanley W.T., & Teeling E.C. (2012) Phylogeny of the Emballonurini
(Emballonuridae) with descriptions of a new genus and species from Madagascar.
Journal of Mammalogy, 93, 1440–1455.
73
Goodman S.M., Rakotondramanana C.F., Ramasindrazana B., Kearney T., Monadjem A.,
Schoeman M.C., Taylor P.J., Naughton K., & Appleton B. (2015) An integrative
approach to characterize Malagasy bats of the subfamily Vespertilioninae Gray, 1821,
with the description of a new species of Hypsugo. Zoological Journal of the Linnean
Society, 173, 988.
Goodman S.M., Rakotondraparany F., & Kofoky A. (2007) The description of a new species
of Myzopoda (Myzopodidae: Chiroptera) from western Madagascar. Mammalian
Biology - Zeitschrift für Säugetierkunde, 72, 65–81.
Goodman S.M., Ratrimomanarivo F.H., & Randrianandrianina F.H. (2006) A new species of
Scotophilus (Chiroptera: Vespertilionidae) from western Madagascar. Acta
Chiropterologica, 8, 21–37.
Gorenflo L.J., Corson C., Chomitz K.M., Harper G., Honzák M., & Özler B. (2011)
Exploring the association between people and deforestation in Madagascar.
Ecological Studies, 214, 197–221.
Gould L., Sussman R.W., & Sauther M.L. (1999) Natural disasters and primate populations:
The effects of a 2-year drought on a naturally occurring population of ring-tailed
lemurs (Lemur catta) in southwestern Madagascar. International Journal of
Primatology, 20, 69–84.
Guisan A. & Thuiller W. (2005) Predicting species distribution: Offering more than simple
habitat models. Ecology Letters, 8, 993–1009.
Haines-Young R. (2009) Land use and biodiversity relationships. Land Use Policy, 26, S178–
S186.
Hannah L., Dave R., Lowry P.P., Andelman S., Andrianarisata M., Andriamaro L., Cameron
A., Hijmans R., Kremen C., MacKinnon J., Randrianasolo H.H., Andriambololonera
S., Razafimpahanana A., Randriamahazo H., Randrianarisoa J., Razafinjatovo P.,
Raxworthy C., Schatz G.E., Tadross M., & Wilmé L. (2008) Climate change
adaptation for conservation in Madagascar. Biology Letters, 4, 590–594.
Harper G.J., Steininger M.K., Tucker C.J., Juhn D., & Hawkins F. (2007) Fifty years of
deforestation and forest fragmentation in Madagascar. Environmental Conservation,
34, 325–333.
Hastie T., Tibshirani R., & Buja A. (1994) Flexible discriminant analysis by optimal scoring.
Journal of the American Statistical Association, 89, 1255–1270.
Heer K., Helbig-Bonitz M., Fernandes R.G., Mello M.A.R., & Kalko E.K.V. (2015) Effects
of land use on bat diversity in a complex plantation–forest landscape in northeastern
Brazil. Journal of Mammalogy, 96, 720–731.
Hijmans R.J. & Graham C.H. (2006) Testing the ability of climate envelope models to predict
the effect of climate change on species distributions. Global change biology, 12,
2272–2281.

74
Hijmans R.J., Cameron S.E., Parra J.L., Jones P.G., & Jarvis A. (2005) Very high resolution
interpolated climate surfaces for global land areas. International Journal of
Climatology, 25, 1965–1978.
Hodgkison R., Balding S.T., Zubaid A., & Kunz T.H. (2004) Temporal variation in the
relative abundance of fruit bats (Megachiroptera: Pteropodidae) in relation to the
availability of food in a lowland Malaysian rain forest. Biotropica, 36, 522–533.
Hughes A.C., Satasook C., Bates P.J.J., Bumrungsri S., & Jones G. (2012) The projected
effects of climatic and vegetation changes on the distribution and diversity of
Southeast Asian bats. Global Change Biology, 18, 1854–1865.
Hughes L. (2000) Biological consequences of global warming: Is the signal already apparent?
Trends in Ecology & Evolution, 15, 56–61.
Ingram J.C. & Dawson T.P. (2005) Climate change impacts and vegetation response on the
island of Madagascar. Philosophical Transactions of the Royal Society A:
Mathematical, Physical and Engineering Sciences, 363, 55–59.
IPCC C.C. (2007) The physical science basis, Contribution of Working Group I to the Fourth
Assessment Report of the Intergovernmental Panel on Climate Change. Cambridge
University Press, Cambridge.
Jansson R. (2003) Global patterns in endemism explained by past climatic change.
Proceedings of the Royal Society B: Biological Sciences, 270, 583–590.
Jenkins R.K.B., Tognelli M.F., Bowles P., Cox N., Brown J.L., Chan L., Andreone F.,
Andriamazava A., Andriantsimanarilafy R.R., Anjeriniaina M., Bora P., Brady L.D.,
Hantalalaina E.F., Glaw F., Griffiths R.A., Hilton-Taylor C., Hoffmann M., Katariya
V., Rabibisoa N.H., Rafanomezantsoa J., Rakotomalala D., Rakotondravony H.,
Rakotondrazafy N.A., Ralambonirainy J., Ramanamanjato J.-B., Randriamahazo H.,
Randrianantoandro J.C., Randrianasolo H.H., Randrianirina J.E., Randrianizahana H.,
Raselimanana A.P., Rasolohery A., Ratsoavina F.M., Raxworthy C.J.,
Robsomanitrandrasana E., Rollande F., van Dijk P.P., Yoder A.D., & Vences M.
(2014) Extinction risks and the conservation of Madagascar's reptiles. PLoS ONE, 9,
e100173.
Jetz W., Wilcove D.S., & Dobson A.P. (2007) Projected impacts of climate and land-use
change on the global diversity of birds. PLoS Biology, 5, 1211–1219.
Jones G., Jacobs D.S., Kunz T.H., Willig M.R., & Racey P.A. (2009) Carpe noctem: The
importance of bats as bioindicators. Endangered Species Research, 8, 93–115.
Jones K.E., Barlow K.E., Vaughan N., Rodríguez-Durán A., & Gannon M.R. (2001) Short-
term impacts of extreme environmental disturbance on the bats of Puerto Rico.
Animal Conservation, 4, 59–66.
Kalka M.B., Smith A.R., & Kalko E.K.V. (2008) Bats limit arthropods and herbivory in a
tropical forest. Science, 320, 71.
Kasso M. & Balakrishnan M. (2013) Ecological and economic importance of bats (order
Chiroptera). ISRN Biodiversity, 2013, 1–9.

75
Kearney M.R., Wintle B.A., & Porter W.P. (2010) Correlative and mechanistic models of
species distribution provide congruent forecasts under climate change. Conservation
Letters, 3, 203–213.
Kistler P. & Spack S. (2003) Comparing agricultural systems in two areas of Madagascar.
The natural history of Madagascar (ed. by S.M. Goodman and J.P. Benstead), pp.
123–134. University of Chicago Press, Chicago.
Kitula R.A., Larwanou M., Munishi P.T.K., Muoghalu J.I., & Popoola L. (2015) Climate
vulnerability of biophysical systems in different forest types and coastal wetlands in
Africa: A synthesis. International Forestry Review, 17, 67–76.
Kramer-Schadt S., Niedballa J., Pilgrim J.D., Schröder B., Lindenborn J., Reinfelder V.,
Stillfried M., Heckmann I., Scharf A.K., Augeri D.M., Cheyne S.M., Hearn A.J., Ross
J., Macdonald D.W., Mathai J., Eaton J., Marshall A.J., Semiadi G., Rustam R.,
Bernard H., Alfred R., Samejima H., Duckworth J.W., Breitenmoser-Wuersten C.,
Belant J.L., Hofer H., & Wilting A. (2013) The importance of correcting for sampling
bias in MaxEnt species distribution models. Diversity and Distributions, 19, 1366–
1379.
Kremen C., Cameron A., Moilanen A., Phillips S.J., Thomas C.D., Beentje H., Dransfield J.,
Fisher B.L., Glaw F., Good T.C., Harper G.J., Hijmans R.J., Lees D.C., Louis E.,
Nussbaum R.A., Raxworthy C.J., Razafimpahanana A., Schatz G.E., Vences M.,
Vieites D.R., Wright P.C., & Zjhra M.L. (2008) Aligning conservation priorities
across taxa in Madagascar with high-resolution planning tools. Science, 320, 222–
225.
Kuiper T. (2014) Climate change, biodiversity and extinction risk. South African Journal of
Science, 110, 7.
Lahann P. (2007) Feeding ecology and seed dispersal of sympatric cheirogaleid lemurs
(Microcebus murinus, Cheirogaleus medius, Cheirogaleus major) in the littoral
rainforest of south-east Madagascar. Journal of Zoology, 271, 88–98.
Latinne A., Meynard C.N., Herbreteau V., Waengsothorn S., Morand S., & Michaux J.R.
(2015) Influence of past and future climate changes on the distribution of three
Southeast Asian murine rodents. Journal of Biogeography, 42, 1714–1726.
Lees D.C., Kremen C., & Andriamampianina L. (1999) A null model for species richness
gradients: Bounded range overlap of butterflies and other rainforest endemics in
Madagascar. Biological Journal of the Linnean Society, 67, 529–584.
Legendre P. (1993) Spatial autocorrelation: Trouble or new paradigm? Ecology, 74, 1659–
1673.
Lehman S.M., Rajaonson A., & Day S. (2006) Edge effects and their influence on lemur
density and distribution in Southeast Madagascar. American Journal of Physical
Anthropology, 129, 232–241.
Lehtinen R. & Ramanamanjato J.-B. (2006) Effects of rainforest fragmentation and correlates
of local extinction in a herpetofauna from Madagascar. Applied Herpetology, 3, 95–
110.
76
Lenton T.M., Held H., Kriegler E., Hall J.W., Lucht W., Rahmstorf S., & Schellnhuber H.J.
(2008) Tipping elements in the Earth's climate system. Proceedings of the National
Academy of Sciences, 105, 1786–1793.
Lepers E. (2003) Dynamics of land-use and land-cover change in tropical regions. Annual
Review of Environment and Resources, 28, 205–241.
Liu C., White M., & Newell G. (2013) Selecting thresholds for the prediction of species
occurrence with presence‐only data. Journal of Biogeography, 40, 778–789.
Loarie S.R., Duffy P.B., Hamilton H., Asner G.P., & Field C.B. (2009) The velocity of
climate change. Nature, 462, 1052–1057.
MacKinnon J.L., Hawkins C.E., & Racey P.A. (2003) Pteropodidae, fruit bats, Fanihy,
Angavo. The natural history of Madagascar (ed. by S.M. Goodman and J.P.
Benstead), pp. 1299–1302. University of Chicago Press, Chicago.
Malcolm J.R., Liu C., Neilson R.P., Hansen L., & Hannah L. (2006) Global warming and
extinctions of endemic species from biodiversity hotspots. Conservation Biology, 20,
538–548.
Manel S., Williams H.C., & Ormerod S.J. (2001) Evaluating presence-absence models in
ecology: The need to account for prevalence. Journal of Applied Ecology, 38, 921–
931.
Mateo R.G., Felicísimo Á.M., Pottier J., Guisan A., & Muñoz J. (2012) Do stacked species
distribution models reflect altitudinal diversity patterns? PLoS ONE, 7, e32586.
McBride J.L., Klotzbach P.J., Balachandran S., Camargo S.J., Holland G., Knutson T.R.,
Kossin J.P., Lee T.-C., Sobel A., & Sugi M. (2015) Tropical cyclones and climate
change. Wiley Interdisciplinary Reviews: Climate Change, 7, 65–89.
McCarty J.P. (2001) Ecological consequences of recent climate change. Conservation
Biology, 15, 320–331.
McCullagh P. & Nelder J.A. (1989) Generalized Linear Models. Chapman and Hall,
Washington.
Mickleburgh S.P., Hutson A.M., & Racey P.A. (2002) A review of the global conservation
status of bats. Oryx, 36, 18–34.
Monadjem A., Taylor P.J., & Schoeman M.C. (2010) Bats of southern and central Africa: A
biogeographic and taxonomic synthesis. Wits University Press, Johannesburg.
Moo-Llanes D., Ibarra-Cerdeña C.N., Rebollar-Téllez E.A., Ibáñez-Bernal S., González C., &
Ramsey J.M. (2013) Current and future niche of north and central American sand flies
(Diptera: Psychodidae) in climate change scenarios. PLoS Neglected Tropical
Diseases, 7, e2421.
Mooney H., Larigauderie A., & Cesario M. (2009) Biodiversity, climate change, and
ecosystem services. Current Opinion in Environmental Sustainability, 1, 46–54.
77
Moreno C.E., Rojas G.S., Pineda E., & Escobar F. (2007) Shortcuts for biodiversity
evaluation: A review of terminology and recommendations for the use of target
groups, bioindicators and surrogates'. International Journal of Environment and
Health, 1, 71–86.
Morin X. & Thuiller W. (2009) Comparing niche- and process-based models to reduce
prediction uncertainty in species range shifts under climate change. Ecology, 90,
1301–1313.
Muldoon K.M. & Goodman S.M. (2010) Ecological biogeography of Malagasy non‐volant
mammals: Community structure is correlated with habitat. Journal of Biogeography,
37, 1144–1159.
Myers N. (1987) The extinction spasm impending: Synergisms at work. Conservation
Biology, 1, 14–21.
Norris S. (2006) Madagascar defiant. BioScience, 56, 960–965.
Ordonez A. & Williams J.W. (2013) Projected climate reshuffling based on multivariate
climate-availability, climate-analog, and climate-velocity analyses: Implications for
community disaggregation. Climatic Change, 119, 659–675.
Parris K.M. & Hazell D.L. (2005) Biotic effects of climate change in urban environments:
The case of the grey-headed flying-fox (Pteropus poliocephalus) in Melbourne,
Australia. Biological Conservation, 124, 267–276.
Pearson R.G., Dawson T.P., & Liu C. (2004) Modelling species distributions in Britain: A
hierarchical integration of climate and land-cover data. Ecography, 27, 285–298.
Pearson R.G., Raxworthy C.J., Nakamura M., & Peterson A.T. (2006) Predicting species
distributions from small numbers of occurrence records: A test case using cryptic
geckos in Madagascar. Journal of Biogeography, 34, 102–117.
Peterson R.L., Eger J.L., & Mitchell L. (1995) Faune de Madagascar: Chiroptères. Muséum
national d’histoire naturelle, Paris, France.
Peterson A.T. (2002) Effects of sample size on accuracy of species distribution models.
Ecological Modelling, 148, 1–13.
Phillips S.J., Anderson R.P., & Schapire R.E. (2006) Maximum entropy modeling of species
geographic distributions. Ecological Modelling, 190, 231–259.
Pocock M.J.O. & Jennings N. (2007) Testing biotic indicator taxa: The sensitivity of
insectivorous mammals and their prey to the intensification of lowland agriculture.
Journal of Applied Ecology, 45, 151–160.
Pottier J., Dubuis A., Pellissier L., Maiorano L., Rossier L., Randin C.F., Vittoz P., & Guisan
A. (2012) The accuracy of plant assemblage prediction from species distribution
models varies along environmental gradients. Global Ecology and Biogeography, 22,
52–63.
R Development Core Team (2014) R: A language and environment for statistical computing.
R Foundation for Statistical Computing, Vienna, Austria.
78
Ralisata M., Andriamboavonjy F.R., Rakotondravony D., Ravoahangimalala O.R.,
Randrianandrianina F.H., & Racey P.A. (2010) Monastic Myzopoda: The foraging
and roosting ecology of a sexually segregated Malagasy endemic bat. Journal of
Zoology, 282, 130–139.
Ralisata M., Rakotondravony D., & Racey P.A. (2015) The relationship between male
sucker-footed bats Myzopoda aurita and the traveller's tree Ravenala
madagascariensis in south-eastern Madagascar. Acta Chiropterologica, 17, 95–103.
Rasolofoson R.A., Ferraro P.J., & Jenkins C.N. (2015) Effectiveness of Community Forest
Management at reducing deforestation in Madagascar. Biological Conservation, 184,
271–277.
Ratrimomanarivo F.H., Goodman S.M., Stanley W.T., Naidoo T., Taylor P.J., & Lamb J.
(2009) Geographic and phylogeographic variation in Chaerephon leucogaster
(Chiroptera: Molossidae) of Madagascar and the western Indian Ocean islands of
Mayotte and Pemba. Acta Chiropterologica, 11, 25–52.
Raxworthy C.J. & Nussbaum R.A. (1994) A rainforest survey of amphibians, reptiles and
small mammals at Montagne d'Ambre, Madagascar. Biological Conservation, 69, 65–
73.
Raxworthy C.J., Martinez-Meyer E., Horning N., Nussbaum R.A., Schneider G.E., Ortega-
Huerta M.A., & Peterson A.T. (2003) Predicting distributions of known and unknown
reptile species in Madagascar. Nature, 426, 837–841.
Razgour O., Juste J., Ibáñez C., Kiefer A., Rebelo H., Puechmaille S.J., Arlettaz R., Burke T.,
Dawson D.A., Beaumont M., & Jones G. (2013) The shaping of genetic variation in
edge-of-range populations under past and future climate change. Ecology Letters, 16,
1258–1266.
Razgour O., Rebelo H., Di Febbraro M., & Russo D. (2016) Painting maps with bats: Species
distribution modelling in bat research and conservation. Hystrix, 27, 1–8.
Reddy S., Driskell A., Rabosky D.L., Hackett S.J., & Schulenberg T.S. (2012) Diversification
and the adaptive radiation of the vangas of Madagascar. Proceedings of the Royal
Society B: Biological Sciences, 279, 2062–2071.
Richards L.R., Rambau R.V., Lamb J.M., Taylor P.J., Yang F., Schoeman M.C., & Goodman
S.M. (2010) Cross-species chromosome painting in bats from Madagascar: The
contribution of Myzopodidae to revealing ancestral syntenies in Chiroptera.
Chromosome Research, 18, 635–653.
Ridgeway G. (1999) The state of boosting. Computing Science and Statistics, 31, 172–181.
Ripley B.D. (1996) Pattern recognition and neural networks. Cambridge University Press,
New York.
Rodríguez-Castañeda G. (2012) The world and its shades of green: A meta-analysis on
trophic cascades across temperature and precipitation gradients. Global Ecology and
Biogeography, 22, 118–130.
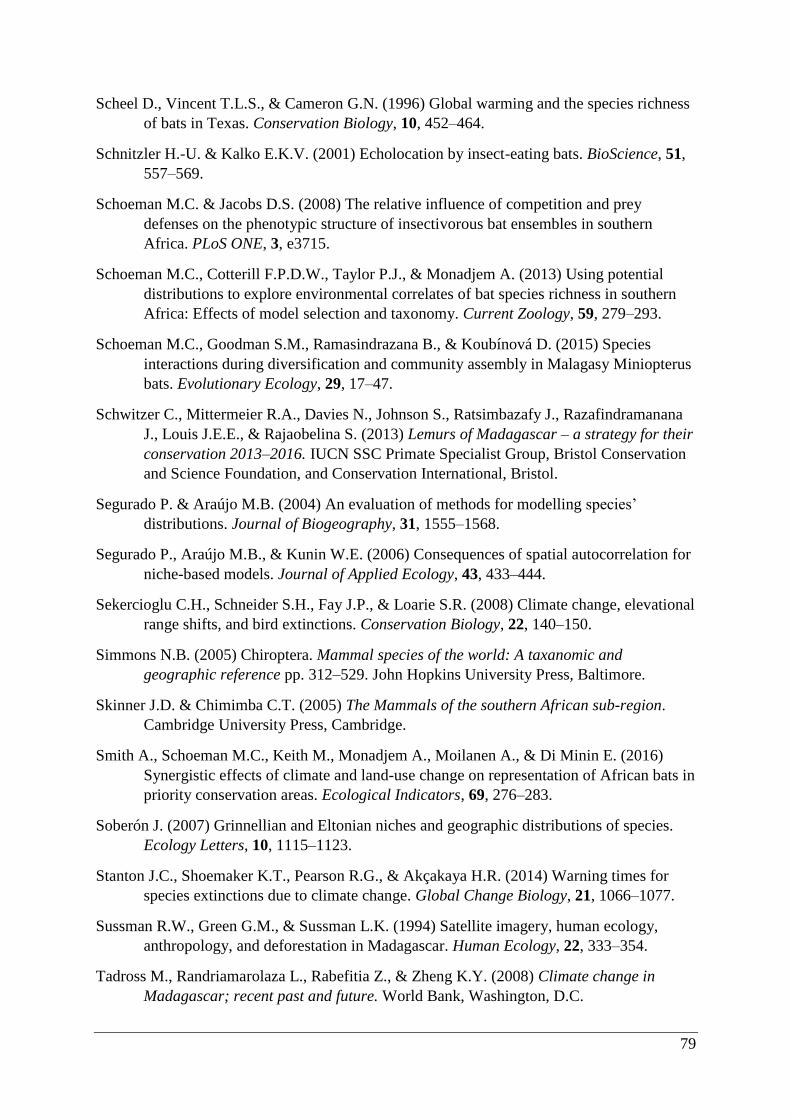
79
Scheel D., Vincent T.L.S., & Cameron G.N. (1996) Global warming and the species richness
of bats in Texas. Conservation Biology, 10, 452–464.
Schnitzler H.-U. & Kalko E.K.V. (2001) Echolocation by insect-eating bats. BioScience, 51,
557–569.
Schoeman M.C. & Jacobs D.S. (2008) The relative influence of competition and prey
defenses on the phenotypic structure of insectivorous bat ensembles in southern
Africa. PLoS ONE, 3, e3715.
Schoeman M.C., Cotterill F.P.D.W., Taylor P.J., & Monadjem A. (2013) Using potential
distributions to explore environmental correlates of bat species richness in southern
Africa: Effects of model selection and taxonomy. Current Zoology, 59, 279–293.
Schoeman M.C., Goodman S.M., Ramasindrazana B., & Koubínová D. (2015) Species
interactions during diversification and community assembly in Malagasy Miniopterus
bats. Evolutionary Ecology, 29, 17–47.
Schwitzer C., Mittermeier R.A., Davies N., Johnson S., Ratsimbazafy J., Razafindramanana
J., Louis J.E.E., & Rajaobelina S. (2013) Lemurs of Madagascar – a strategy for their
conservation 2013–2016. IUCN SSC Primate Specialist Group, Bristol Conservation
and Science Foundation, and Conservation International, Bristol.
Segurado P. & Araújo M.B. (2004) An evaluation of methods for modelling species’
distributions. Journal of Biogeography, 31, 1555–1568.
Segurado P., Araújo M.B., & Kunin W.E. (2006) Consequences of spatial autocorrelation for
niche-based models. Journal of Applied Ecology, 43, 433–444.
Sekercioglu C.H., Schneider S.H., Fay J.P., & Loarie S.R. (2008) Climate change, elevational
range shifts, and bird extinctions. Conservation Biology, 22, 140–150.
Simmons N.B. (2005) Chiroptera. Mammal species of the world: A taxanomic and
geographic reference pp. 312–529. John Hopkins University Press, Baltimore.
Skinner J.D. & Chimimba C.T. (2005) The Mammals of the southern African sub-region.
Cambridge University Press, Cambridge.
Smith A., Schoeman M.C., Keith M., Monadjem A., Moilanen A., & Di Minin E. (2016)
Synergistic effects of climate and land-use change on representation of African bats in
priority conservation areas. Ecological Indicators, 69, 276–283.
Soberón J. (2007) Grinnellian and Eltonian niches and geographic distributions of species.
Ecology Letters, 10, 1115–1123.
Stanton J.C., Shoemaker K.T., Pearson R.G., & Akçakaya H.R. (2014) Warning times for
species extinctions due to climate change. Global Change Biology, 21, 1066–1077.
Sussman R.W., Green G.M., & Sussman L.K. (1994) Satellite imagery, human ecology,
anthropology, and deforestation in Madagascar. Human Ecology, 22, 333–354.
Tadross M., Randriamarolaza L., Rabefitia Z., & Zheng K.Y. (2008) Climate change in
Madagascar; recent past and future. World Bank, Washington, D.C.

80
Taylor P.J., Goodman S.M., Schoeman M.C., Ratrimomanarivo F.H., & Lamb J.M. (2012)
Wing loading correlates negatively with genetic structuring of eight afro-Malagasy
bat species (Molossidae). Acta Chiropterologica, 14, 53–62.
Thomas C.D., Cameron A., Green R.E., & Bakkenes M. (2004) Extinction risk from climate
change. Nature, 427, 145–148.
Thomas C.D., Ohlemüller R., Anderson B., Hickler T., Miller P.A., Sykes M.T., & Williams
J.W. (2008) Exporting the ecological effects of climate change. Developed and
developing countries will suffer the consequences of climate change, but differ in
both their responsibility and how badly it will affect their ecosystems. EMBO reports,
9, S28–S33.
Trenberth K.E. (2011) Changes in precipitation with climate change. Climate Research, 47,
123–138.
Vallan D., Andreo F., Raherisoa V.H., & Dolch R. (2004) Does selective wood exploitation
affect amphibian diversity? The case of An'Ala, a tropical rainforest in eastern
Madagascar. Oryx, 38, 410–417.
Viera A.J. & Garrett J.M. (2005) Understanding interobserver agreement: the kappa statistic.
Family Medicine, 37, 360–363.
Virah-Sawmy M., Gardner C.J., & Ratsifandrihamanana A.N. (2014) The Durban Vision in
practice: Experiences in the participatory governance of Madagascar's new protected
areas. Conservation and Environmental Management in Madagascar (ed. by I.R.
Scales), pp. 216–252. Routledge, London.
Walther G.-R., Post E., Convey P., Menzel A., Parmesan C., Beebee T.J.C., Fromentin J.-M.,
Hoegh-Guldberg O., & Bairlein F. (2002) Ecological responses to recent climate
change. Nature, 416, 389–395.
Warren D.L. (2012) In defense of “niche modeling”. Trends in Ecology & Evolution, 27,
497–500.
Warren D.L., Glor R.E., & Turelli M. (2008) Environmental niche equivalency versus
conservatism: Quantitative approaches to niche evolution. Evolution, 62, 2868–2883.
Warren D.L., Glor R.E., & Turelli M. (2010) ENMTools: A toolbox for comparative studies
of environmental niche models. Ecography, 33, 607–611.
Weyeneth N., Goodman S.M., & Ruedi M. (2011) Do diversification models of
Madagascar’s biota explain the population structure of the endemic bat Myotis
goudoti (Chiroptera: Vespertilionidae)? Journal of Biogeography, 38, 44–54.
Williams-Guillén K., Perfecto I., & Vandermeer J. (2008) Bats limit insects in a Neotropical
agroforestry system. Science, 320, 70.
Wilmé L., Goodman S.M., & Ganzhorn J.U. (2006) Biogeographic evolution of
Madagascar's microendemic biota. Science, 312, 1063–1065.
Wilson D.E. & Reeder D.M. (2005) Mammal species of the world: A taxonomic and
geographic reference. John Hopkins University Press, Baltimore.

81
Wollenberg K.C., Vieites D.R., Glaw F., & Vences M. (2011) Speciation in little: The role of
range and body size in the diversification of Malagasy mantellid frogs. BMC
Evolutionary Biology, 11, 217.
WWF (2008) Plan de Gestion d’Ankodida. WWF Madagascar and Western Indian Ocean
Programme Office, Antananarivo.
Xi W. (2015) Synergistic effects of tropical cyclones on forest ecosystems: A global
synthesis. Journal of Forestry Research, 26, 1–21.
Yoder A.D. & Nowak M.D. (2006) Has vicariance or dispersal been the predominant
biogeographic force in Madagascar? Only time will tell. Annual Review of Ecology,
Evolution, and Systematics, 37, 405–431.
Zhao L., Lee W., Song C., Huber M., & Goldner A. (2010) “Bringing high performance
climate modeling into the classroom”, proceedings of the 5th Teragrid 10 conference
(TeraGrid-10). Pittsburgh, PA.
Citations and bibliography formatted according to Journal of Biogeography
82
APPENDIX 1: Supplementary materials for Chapter 2
Table A1.1. Malagasy bat species with less than 10 occurrence points after applying spatial
filtering of 10 km2
Species Occurrence
points Functional group
Chaerephon jobimena 4 open-air
Coleura kibomalandy 7 open-air
Hypsugo anchietae 7 clutter-edge
Miniopterus brachytragos 5 clutter-edge
Miniopterus griffithsi 6 clutter-edge
Miniopterus petersoni 5 clutter-edge
Miniopterus sororculus 8 clutter-edge
Myzopoda schliemanni 8 clutter-edge
Paratriaenops auritus 5 clutter
Pipistrellus hesperidus 8 clutter-edge
Pipistrellus raceyi 8 clutter-edge
Scotophilus marovaza 7 clutter-edge

83
APPENDIX 2: Supplementary materials for Chapter 3
Table A2.1. Ensemble modelling performance measures resulting from fitting environmental niche models (ENM; 10 models used) of 25 Malagasy
bat species under current climatic and climate/land use variables. The models evaluate the most effective ENM based on all three measure [area
under the receiver operating characteristic curve (AUC), true skill statistic (TSS), and kappa]. Models were ranked with high classification rates
(AUC, TSS, and kappa).
Species Models Climate only Climate/land use
AUC TSS Kappa Sensitivity Specificity AUC TSS Kappa Sensitivity Specificity
Chaerephon atsinanana ANN 0.999 0.979 0.965 0.995 0.984 0.999 0.983 0.977 0.991 0.992
CTA 0.997 0.978 0.972 0.977 0.995 0.998 0.978 0.964 0.993 0.984
FDA 0.987 0.963 0.942 0.981 0.982 0.992 0.971 0.952 0.987 0.985
GAM1 1 0.998 0.996 1 0.998 0.999 0.997 0.994 0.998 0.998
GBM 0.999 0.985 0.967 0.997 0.987 0.999 0.981 0.968 0.998 0.983
GLM 0.999 0.976 0.958 0.979 0.99 0.999 0.977 0.963 0.99 0.986
MARS 0.999 0.978 0.958 0.997 0.981 0.999 0.974 0.958 0.996 0.978
MAXENT 0.99 0.971 0.964 0.975 0.993 0.988 0.972 0.973 0.977 0.995
RF2 0.9 0.991 0.985 0.991 0.996 1 0.998 0.982 0.998 0.991
SRE 0.917 0.834 0.871 0.843 0.99 0.916 0.831 0.87 0.84 0.99
Chaerephon leucogaster ANN 0.997 0.944 0.931 0.974 0.969 0.996 0.956 0.931 0.984 0.971
CTA 0.995 0.964 0.958 0.973 0.99 0.994 0.96 0.954 0.978 0.981
FDA 0.989 0.92 0.899 0.958 0.961 0.988 0.922 0.894 0.968 0.983
GAM1 1 0.986 0.983 0.992 0.993 0.999 0.981 0.976 0.991 0.989
GBM 0.997 0.941 0.925 0.982 0.959 0.997 0.946 0.933 0.986 0.959
GLM 0.998 0.957 0.93 0.94 0.987 0.997 0.96 0.933 0.985 0.974
MARS 0.994 0.916 0.909 0.961 0.955 0.996 0.93 0.912 0.98 0.949
MAXENT 0.981 0.912 0.884 0.874 0.986 0.984 0.891 0.815 0.958 0.933
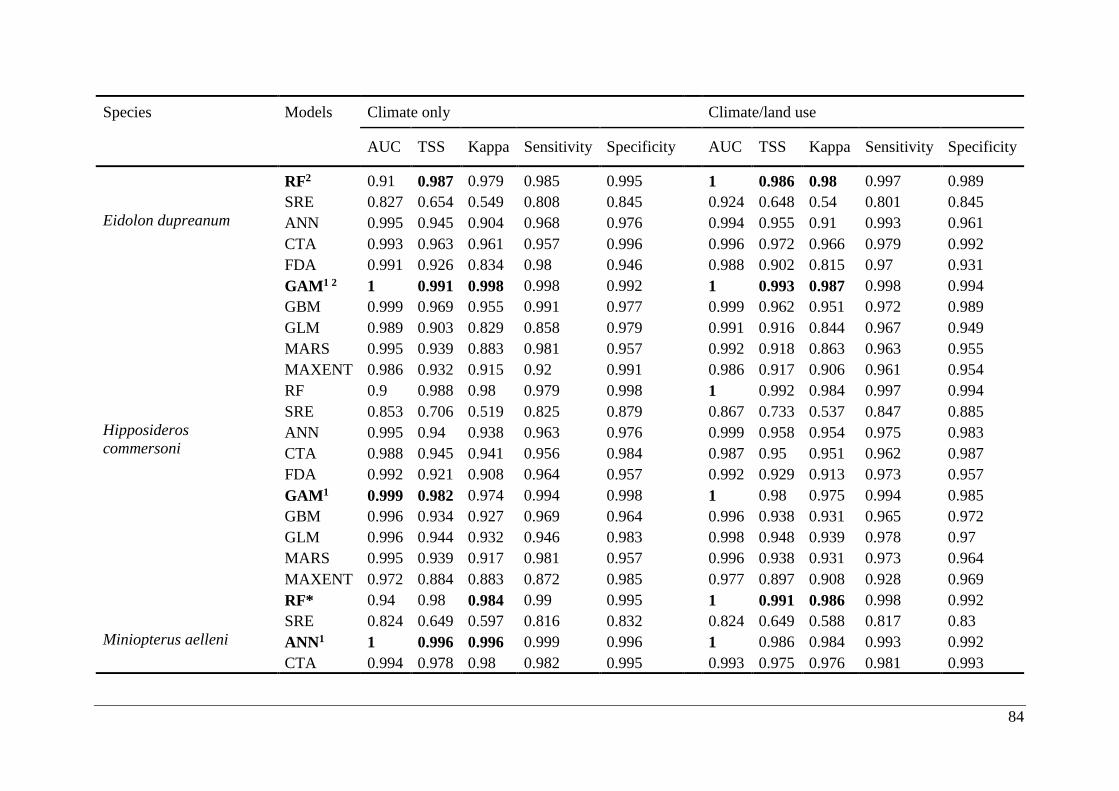
84
Species Models Climate only Climate/land use
AUC TSS Kappa Sensitivity Specificity AUC TSS Kappa Sensitivity Specificity
RF2 0.91 0.987 0.979 0.985 0.995 1 0.986 0.98 0.997 0.989
SRE 0.827 0.654 0.549 0.808 0.845 0.924 0.648 0.54 0.801 0.845
Eidolon dupreanum ANN 0.995 0.945 0.904 0.968 0.976 0.994 0.955 0.91 0.993 0.961
CTA 0.993 0.963 0.961 0.957 0.996 0.996 0.972 0.966 0.979 0.992
FDA 0.991 0.926 0.834 0.98 0.946 0.988 0.902 0.815 0.97 0.931
GAM1 2 1 0.991 0.998 0.998 0.992 1 0.993 0.987 0.998 0.994
GBM 0.999 0.969 0.955 0.991 0.977 0.999 0.962 0.951 0.972 0.989
GLM 0.989 0.903 0.829 0.858 0.979 0.991 0.916 0.844 0.967 0.949
MARS 0.995 0.939 0.883 0.981 0.957 0.992 0.918 0.863 0.963 0.955
MAXENT 0.986 0.932 0.915 0.92 0.991 0.986 0.917 0.906 0.961 0.954
RF 0.9 0.988 0.98 0.979 0.998 1 0.992 0.984 0.997 0.994
SRE 0.853 0.706 0.519 0.825 0.879 0.867 0.733 0.537 0.847 0.885
Hipposideros
commersoni ANN 0.995 0.94 0.938 0.963 0.976 0.999 0.958 0.954 0.975 0.983
CTA 0.988 0.945 0.941 0.956 0.984 0.987 0.95 0.951 0.962 0.987
FDA 0.992 0.921 0.908 0.964 0.957 0.992 0.929 0.913 0.973 0.957
GAM1 0.999 0.982 0.974 0.994 0.998 1 0.98 0.975 0.994 0.985
GBM 0.996 0.934 0.927 0.969 0.964 0.996 0.938 0.931 0.965 0.972
GLM 0.996 0.944 0.932 0.946 0.983 0.998 0.948 0.939 0.978 0.97
MARS 0.995 0.939 0.917 0.981 0.957 0.996 0.938 0.931 0.973 0.964
MAXENT 0.972 0.884 0.883 0.872 0.985 0.977 0.897 0.908 0.928 0.969
RF* 0.94 0.98 0.984 0.99 0.995 1 0.991 0.986 0.998 0.992
SRE 0.824 0.649 0.597 0.816 0.832 0.824 0.649 0.588 0.817 0.83
Miniopterus aelleni ANN1 1 0.996 0.996 0.999 0.996 1 0.986 0.984 0.993 0.992
CTA 0.994 0.978 0.98 0.982 0.995 0.993 0.975 0.976 0.981 0.993

85
Species Models Climate only Climate/land use
AUC TSS Kappa Sensitivity Specificity AUC TSS Kappa Sensitivity Specificity
FDA 0.998 0.949 0.95 0.979 0.97 0.998 0.957 0.957 0.974 0.982
GAM2 0.999 0.998 0.998 0.999 0.999 1 0.999 0.999 0.999 0.999
GBM 1 0.986 0.986 0.994 0.991 1 0.982 0.981 0.991 0.99
GLM 0.999 0.999 0.999 0.998 0.999 1 0.999 0.999 0.999 0.999
MARS 0.999 0.973 0.967 0.989 0.983 0.998 0.967 0.962 0.983 0.983
MAXENT 0.993 0.93 0.932 0.945 0.982 0.986 0.94 0.941 0.957 0.983
RF 0.99 0.99 0.99 0.993 0.997 1 0.994 0.994 0.998 0.996
SRE 0.897 0.794 0.833 0.804 0.989 0.889 0.777 0.818 0.789 0.987
Miniopterus egeri ANN 0.992 0.944 0.91 0.98 0.963 0.998 0.974 0.961 0.99 0.983
CTA 0.997 0.975 0.964 0.976 0.992 0.997 0.975 0.968 0.988 0.986
FDA 0.988 0.952 0.926 0.981 0.972 0.986 0.955 0.94 0.976 0.978
GAM1 2 1 0.996 0.995 0.996 0.998 1 0.998 0.995 0.999 0.998
GBM 0.999 0.977 0.97 0.993 0.982 1 0.979 0.97 0.999 0.979
GLM 0.999 0.972 0.958 0.968 0.991 0.999 0.978 0.967 0.992 0.985
MARS 0.999 0.966 0.949 0.993 0.972 0.999 0.968 0.949 0.99 0.977
MAXENT 0.996 0.956 0.935 0.955 0.986 0.983 0.956 0.944 0.969 0.986
RF 0.942 0.99 0.985 0.984 0.998 1 0.994 0.991 0.999 0.994
SRE 0.918 0.836 0.868 0.848 0.987 0.911 0.823 0.862 0.833 0.988
Miniopterus gleni ANN 0.977 0.877 0.875 0.913 0.965 0.978 0.889 0.898 0.922 0.967
CTA 0.993 0.95 0.95 0.956 0.99 0.988 0.945 0.943 0.959 0.985
FDA 0.992 0.909 0.88 0.961 0.946 0.99 0.918 0.893 0.965 0.952
GAM 0.999 0.98 0.971 0.992 0.988 0.999 0.982 0.973 0.994 0.987
GBM 0.995 0.939 0.921 0.979 0.96 0.996 0.943 0.916 0.986 0.956
GLM 0.986 0.866 0.843 0.881 0.964 0.986 0.876 0.84 0.95 0.926
MARS 0.992 0.928 0.886 0.977 0.95 0.992 0.9 0.881 0.963 0.936
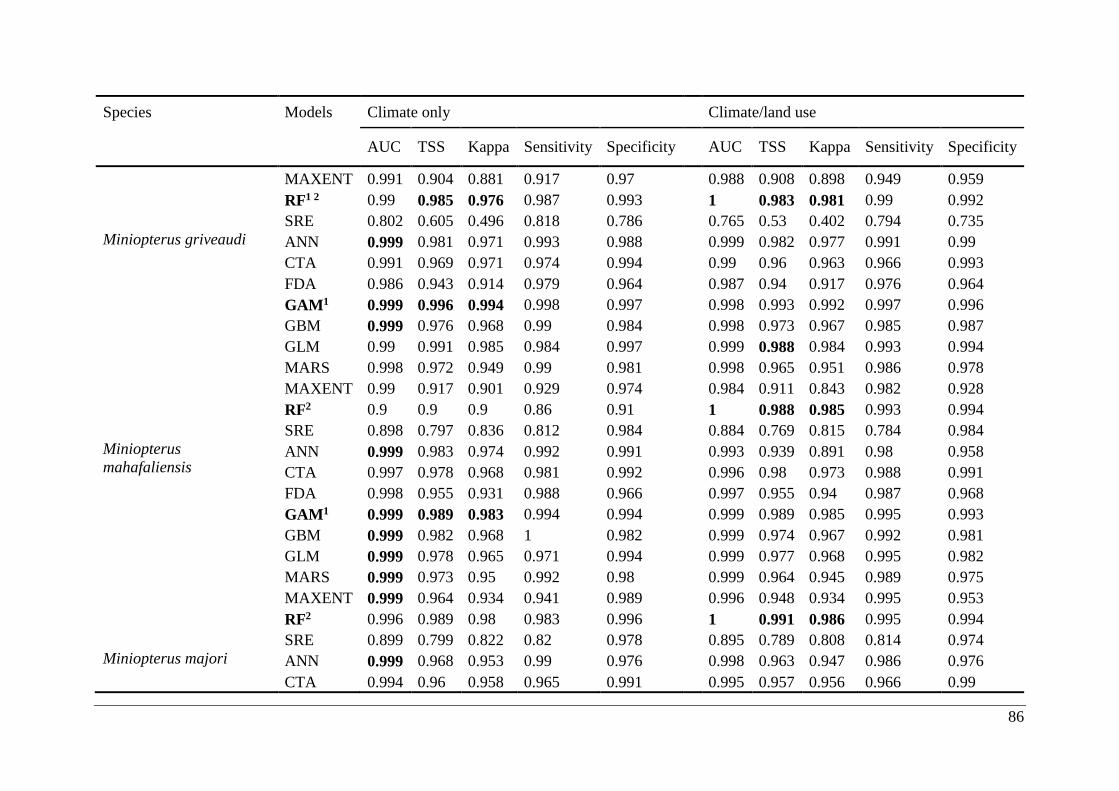
86
Species Models Climate only Climate/land use
AUC TSS Kappa Sensitivity Specificity AUC TSS Kappa Sensitivity Specificity
MAXENT 0.991 0.904 0.881 0.917 0.97 0.988 0.908 0.898 0.949 0.959
RF1 2 0.99 0.985 0.976 0.987 0.993 1 0.983 0.981 0.99 0.992
SRE 0.802 0.605 0.496 0.818 0.786 0.765 0.53 0.402 0.794 0.735
Miniopterus griveaudi ANN 0.999 0.981 0.971 0.993 0.988 0.999 0.982 0.977 0.991 0.99
CTA 0.991 0.969 0.971 0.974 0.994 0.99 0.96 0.963 0.966 0.993
FDA 0.986 0.943 0.914 0.979 0.964 0.987 0.94 0.917 0.976 0.964
GAM1 0.999 0.996 0.994 0.998 0.997 0.998 0.993 0.992 0.997 0.996
GBM 0.999 0.976 0.968 0.99 0.984 0.998 0.973 0.967 0.985 0.987
GLM 0.99 0.991 0.985 0.984 0.997 0.999 0.988 0.984 0.993 0.994
MARS 0.998 0.972 0.949 0.99 0.981 0.998 0.965 0.951 0.986 0.978
MAXENT 0.99 0.917 0.901 0.929 0.974 0.984 0.911 0.843 0.982 0.928
RF2 0.9 0.9 0.9 0.86 0.91 1 0.988 0.985 0.993 0.994
SRE 0.898 0.797 0.836 0.812 0.984 0.884 0.769 0.815 0.784 0.984
Miniopterus
mahafaliensis ANN 0.999 0.983 0.974 0.992 0.991 0.993 0.939 0.891 0.98 0.958
CTA 0.997 0.978 0.968 0.981 0.992 0.996 0.98 0.973 0.988 0.991
FDA 0.998 0.955 0.931 0.988 0.966 0.997 0.955 0.94 0.987 0.968
GAM1 0.999 0.989 0.983 0.994 0.994 0.999 0.989 0.985 0.995 0.993
GBM 0.999 0.982 0.968 1 0.982 0.999 0.974 0.967 0.992 0.981
GLM 0.999 0.978 0.965 0.971 0.994 0.999 0.977 0.968 0.995 0.982
MARS 0.999 0.973 0.95 0.992 0.98 0.999 0.964 0.945 0.989 0.975
MAXENT 0.999 0.964 0.934 0.941 0.989 0.996 0.948 0.934 0.995 0.953
RF2 0.996 0.989 0.98 0.983 0.996 1 0.991 0.986 0.995 0.994
SRE 0.899 0.799 0.822 0.82 0.978 0.895 0.789 0.808 0.814 0.974
Miniopterus majori ANN 0.999 0.968 0.953 0.99 0.976 0.998 0.963 0.947 0.986 0.976
CTA 0.994 0.96 0.958 0.965 0.991 0.995 0.957 0.956 0.966 0.99
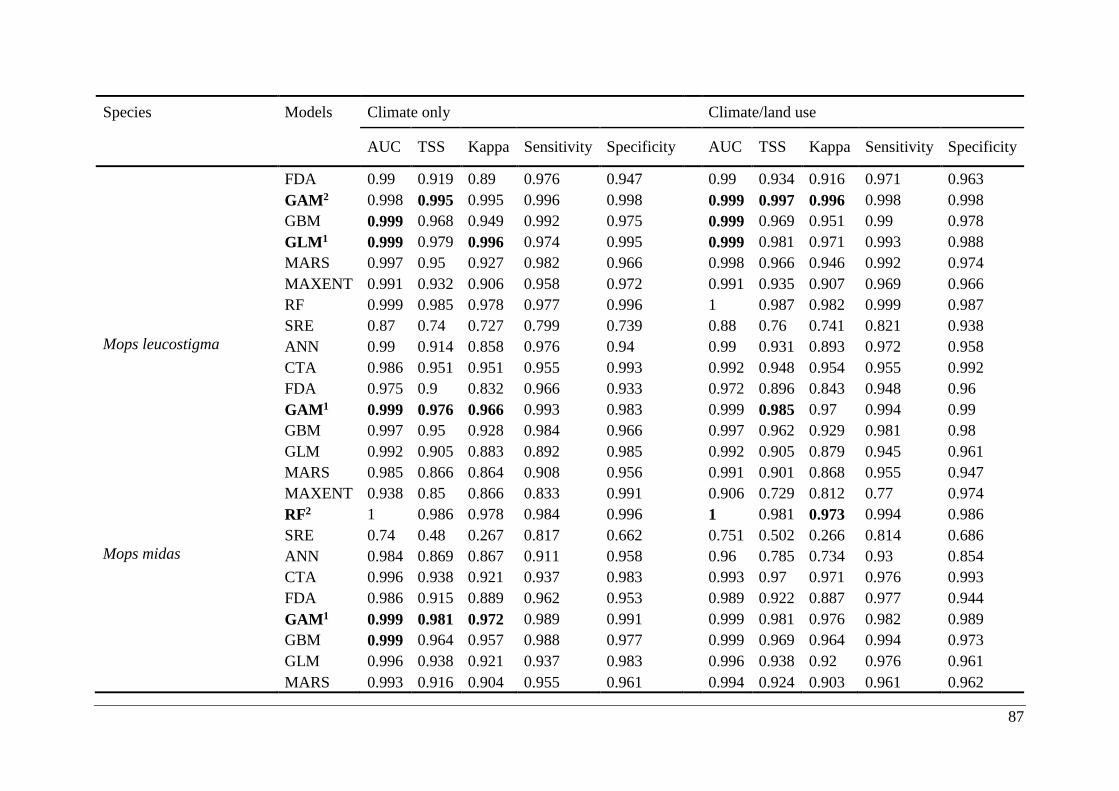
87
Species Models Climate only Climate/land use
AUC TSS Kappa Sensitivity Specificity AUC TSS Kappa Sensitivity Specificity
FDA 0.99 0.919 0.89 0.976 0.947 0.99 0.934 0.916 0.971 0.963
GAM2 0.998 0.995 0.995 0.996 0.998 0.999 0.997 0.996 0.998 0.998
GBM 0.999 0.968 0.949 0.992 0.975 0.999 0.969 0.951 0.99 0.978
GLM1 0.999 0.979 0.996 0.974 0.995 0.999 0.981 0.971 0.993 0.988
MARS 0.997 0.95 0.927 0.982 0.966 0.998 0.966 0.946 0.992 0.974
MAXENT 0.991 0.932 0.906 0.958 0.972 0.991 0.935 0.907 0.969 0.966
RF 0.999 0.985 0.978 0.977 0.996 1 0.987 0.982 0.999 0.987
SRE 0.87 0.74 0.727 0.799 0.739 0.88 0.76 0.741 0.821 0.938
Mops leucostigma ANN 0.99 0.914 0.858 0.976 0.94 0.99 0.931 0.893 0.972 0.958
CTA 0.986 0.951 0.951 0.955 0.993 0.992 0.948 0.954 0.955 0.992
FDA 0.975 0.9 0.832 0.966 0.933 0.972 0.896 0.843 0.948 0.96
GAM1 0.999 0.976 0.966 0.993 0.983 0.999 0.985 0.97 0.994 0.99
GBM 0.997 0.95 0.928 0.984 0.966 0.997 0.962 0.929 0.981 0.98
GLM 0.992 0.905 0.883 0.892 0.985 0.992 0.905 0.879 0.945 0.961
MARS 0.985 0.866 0.864 0.908 0.956 0.991 0.901 0.868 0.955 0.947
MAXENT 0.938 0.85 0.866 0.833 0.991 0.906 0.729 0.812 0.77 0.974
RF2 1 0.986 0.978 0.984 0.996 1 0.981 0.973 0.994 0.986
SRE 0.74 0.48 0.267 0.817 0.662 0.751 0.502 0.266 0.814 0.686
Mops midas ANN 0.984 0.869 0.867 0.911 0.958 0.96 0.785 0.734 0.93 0.854
CTA 0.996 0.938 0.921 0.937 0.983 0.993 0.97 0.971 0.976 0.993
FDA 0.986 0.915 0.889 0.962 0.953 0.989 0.922 0.887 0.977 0.944
GAM1 0.999 0.981 0.972 0.989 0.991 0.999 0.981 0.976 0.982 0.989
GBM 0.999 0.964 0.957 0.988 0.977 0.999 0.969 0.964 0.994 0.973
GLM 0.996 0.938 0.921 0.937 0.983 0.996 0.938 0.92 0.976 0.961
MARS 0.993 0.916 0.904 0.955 0.961 0.994 0.924 0.903 0.961 0.962
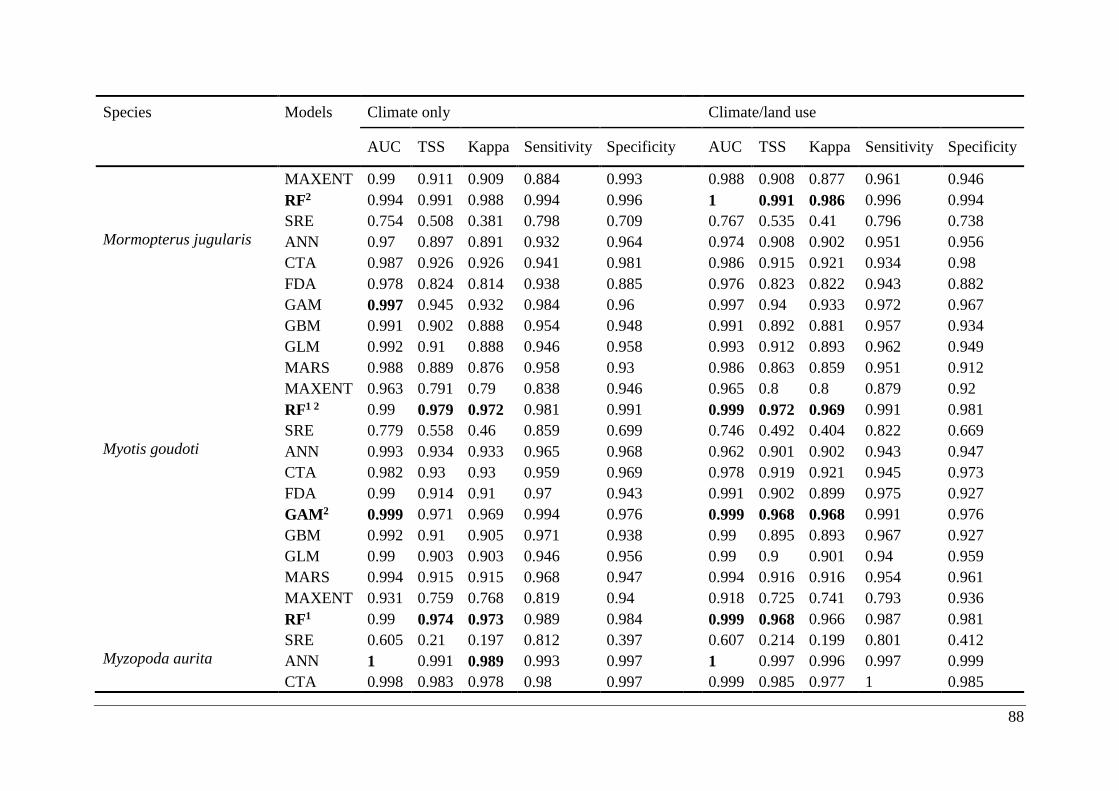
88
Species Models Climate only Climate/land use
AUC TSS Kappa Sensitivity Specificity AUC TSS Kappa Sensitivity Specificity
MAXENT 0.99 0.911 0.909 0.884 0.993 0.988 0.908 0.877 0.961 0.946
RF2 0.994 0.991 0.988 0.994 0.996 1 0.991 0.986 0.996 0.994
SRE 0.754 0.508 0.381 0.798 0.709 0.767 0.535 0.41 0.796 0.738
Mormopterus jugularis ANN 0.97 0.897 0.891 0.932 0.964 0.974 0.908 0.902 0.951 0.956
CTA 0.987 0.926 0.926 0.941 0.981 0.986 0.915 0.921 0.934 0.98
FDA 0.978 0.824 0.814 0.938 0.885 0.976 0.823 0.822 0.943 0.882
GAM 0.997 0.945 0.932 0.984 0.96 0.997 0.94 0.933 0.972 0.967
GBM 0.991 0.902 0.888 0.954 0.948 0.991 0.892 0.881 0.957 0.934
GLM 0.992 0.91 0.888 0.946 0.958 0.993 0.912 0.893 0.962 0.949
MARS 0.988 0.889 0.876 0.958 0.93 0.986 0.863 0.859 0.951 0.912
MAXENT 0.963 0.791 0.79 0.838 0.946 0.965 0.8 0.8 0.879 0.92
RF1 2 0.99 0.979 0.972 0.981 0.991 0.999 0.972 0.969 0.991 0.981
SRE 0.779 0.558 0.46 0.859 0.699 0.746 0.492 0.404 0.822 0.669
Myotis goudoti ANN 0.993 0.934 0.933 0.965 0.968 0.962 0.901 0.902 0.943 0.947
CTA 0.982 0.93 0.93 0.959 0.969 0.978 0.919 0.921 0.945 0.973
FDA 0.99 0.914 0.91 0.97 0.943 0.991 0.902 0.899 0.975 0.927
GAM2 0.999 0.971 0.969 0.994 0.976 0.999 0.968 0.968 0.991 0.976
GBM 0.992 0.91 0.905 0.971 0.938 0.99 0.895 0.893 0.967 0.927
GLM 0.99 0.903 0.903 0.946 0.956 0.99 0.9 0.901 0.94 0.959
MARS 0.994 0.915 0.915 0.968 0.947 0.994 0.916 0.916 0.954 0.961
MAXENT 0.931 0.759 0.768 0.819 0.94 0.918 0.725 0.741 0.793 0.936
RF1 0.99 0.974 0.973 0.989 0.984 0.999 0.968 0.966 0.987 0.981
SRE 0.605 0.21 0.197 0.812 0.397 0.607 0.214 0.199 0.801 0.412
Myzopoda aurita ANN 1 0.991 0.989 0.993 0.997 1 0.997 0.996 0.997 0.999
CTA 0.998 0.983 0.978 0.98 0.997 0.999 0.985 0.977 1 0.985
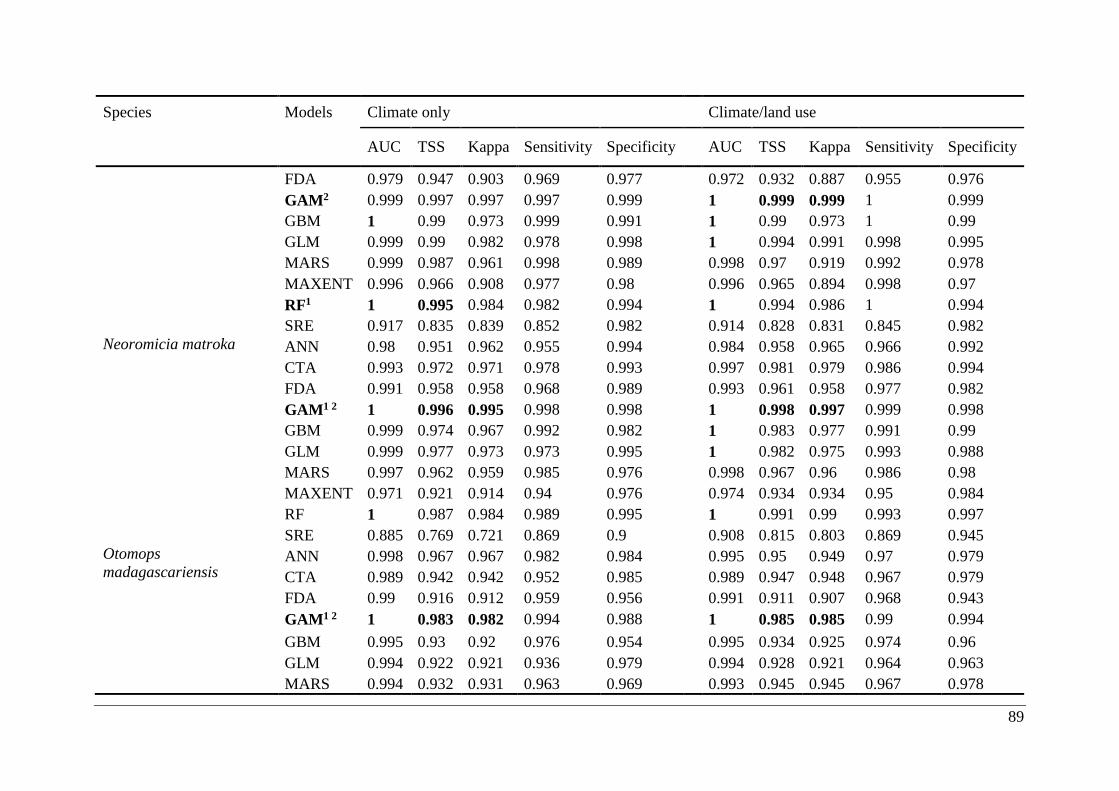
89
Species Models Climate only Climate/land use
AUC TSS Kappa Sensitivity Specificity AUC TSS Kappa Sensitivity Specificity
FDA 0.979 0.947 0.903 0.969 0.977 0.972 0.932 0.887 0.955 0.976
GAM2 0.999 0.997 0.997 0.997 0.999 1 0.999 0.999 1 0.999
GBM 1 0.99 0.973 0.999 0.991 1 0.99 0.973 1 0.99
GLM 0.999 0.99 0.982 0.978 0.998 1 0.994 0.991 0.998 0.995
MARS 0.999 0.987 0.961 0.998 0.989 0.998 0.97 0.919 0.992 0.978
MAXENT 0.996 0.966 0.908 0.977 0.98 0.996 0.965 0.894 0.998 0.97
RF1 1 0.995 0.984 0.982 0.994 1 0.994 0.986 1 0.994
SRE 0.917 0.835 0.839 0.852 0.982 0.914 0.828 0.831 0.845 0.982
Neoromicia matroka ANN 0.98 0.951 0.962 0.955 0.994 0.984 0.958 0.965 0.966 0.992
CTA 0.993 0.972 0.971 0.978 0.993 0.997 0.981 0.979 0.986 0.994
FDA 0.991 0.958 0.958 0.968 0.989 0.993 0.961 0.958 0.977 0.982
GAM1 2 1 0.996 0.995 0.998 0.998 1 0.998 0.997 0.999 0.998
GBM 0.999 0.974 0.967 0.992 0.982 1 0.983 0.977 0.991 0.99
GLM 0.999 0.977 0.973 0.973 0.995 1 0.982 0.975 0.993 0.988
MARS 0.997 0.962 0.959 0.985 0.976 0.998 0.967 0.96 0.986 0.98
MAXENT 0.971 0.921 0.914 0.94 0.976 0.974 0.934 0.934 0.95 0.984
RF 1 0.987 0.984 0.989 0.995 1 0.991 0.99 0.993 0.997
SRE 0.885 0.769 0.721 0.869 0.9 0.908 0.815 0.803 0.869 0.945
Otomops
madagascariensis ANN 0.998 0.967 0.967 0.982 0.984 0.995 0.95 0.949 0.97 0.979
CTA 0.989 0.942 0.942 0.952 0.985 0.989 0.947 0.948 0.967 0.979
FDA 0.99 0.916 0.912 0.959 0.956 0.991 0.911 0.907 0.968 0.943
GAM1 2 1 0.983 0.982 0.994 0.988 1 0.985 0.985 0.99 0.994
GBM 0.995 0.93 0.92 0.976 0.954 0.995 0.934 0.925 0.974 0.96
GLM 0.994 0.922 0.921 0.936 0.979 0.994 0.928 0.921 0.964 0.963
MARS 0.994 0.932 0.931 0.963 0.969 0.993 0.945 0.945 0.967 0.978
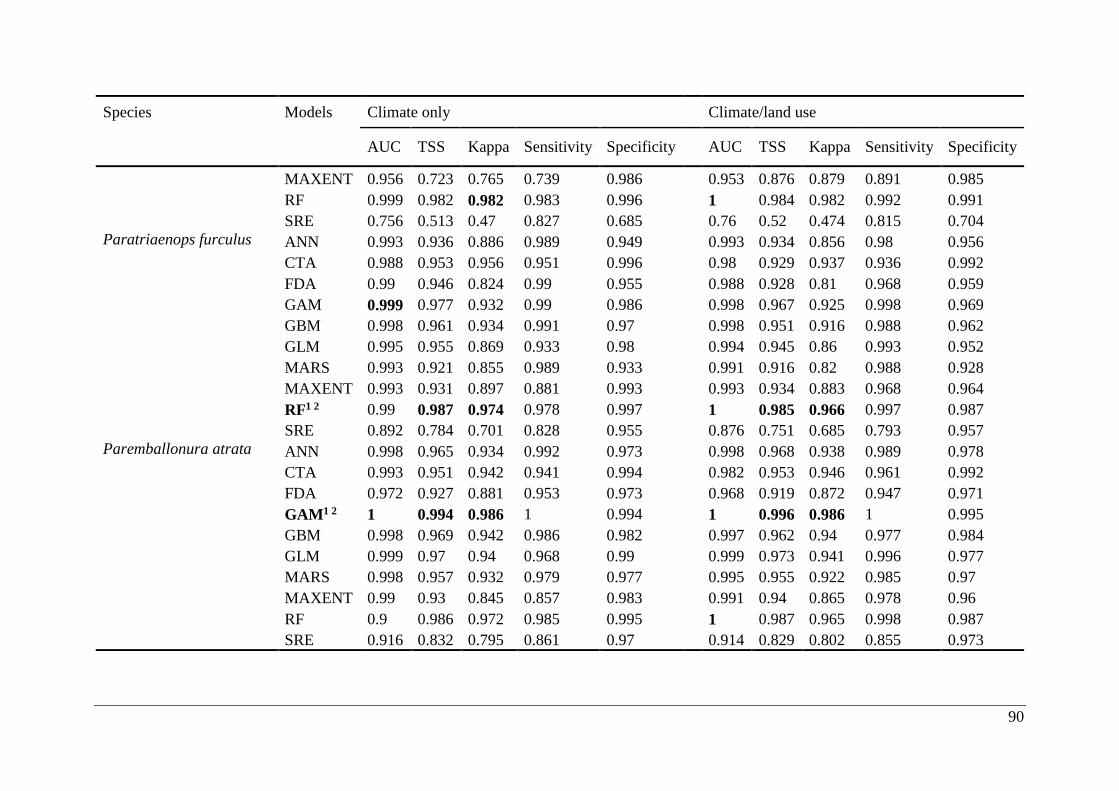
90
Species Models Climate only Climate/land use
AUC TSS Kappa Sensitivity Specificity AUC TSS Kappa Sensitivity Specificity
MAXENT 0.956 0.723 0.765 0.739 0.986 0.953 0.876 0.879 0.891 0.985
RF 0.999 0.982 0.982 0.983 0.996 1 0.984 0.982 0.992 0.991
SRE 0.756 0.513 0.47 0.827 0.685 0.76 0.52 0.474 0.815 0.704
Paratriaenops furculus ANN 0.993 0.936 0.886 0.989 0.949 0.993 0.934 0.856 0.98 0.956
CTA 0.988 0.953 0.956 0.951 0.996 0.98 0.929 0.937 0.936 0.992
FDA 0.99 0.946 0.824 0.99 0.955 0.988 0.928 0.81 0.968 0.959
GAM 0.999 0.977 0.932 0.99 0.986 0.998 0.967 0.925 0.998 0.969
GBM 0.998 0.961 0.934 0.991 0.97 0.998 0.951 0.916 0.988 0.962
GLM 0.995 0.955 0.869 0.933 0.98 0.994 0.945 0.86 0.993 0.952
MARS 0.993 0.921 0.855 0.989 0.933 0.991 0.916 0.82 0.988 0.928
MAXENT 0.993 0.931 0.897 0.881 0.993 0.993 0.934 0.883 0.968 0.964
RF1 2 0.99 0.987 0.974 0.978 0.997 1 0.985 0.966 0.997 0.987
SRE 0.892 0.784 0.701 0.828 0.955 0.876 0.751 0.685 0.793 0.957
Paremballonura atrata ANN 0.998 0.965 0.934 0.992 0.973 0.998 0.968 0.938 0.989 0.978
CTA 0.993 0.951 0.942 0.941 0.994 0.982 0.953 0.946 0.961 0.992
FDA 0.972 0.927 0.881 0.953 0.973 0.968 0.919 0.872 0.947 0.971
GAM1 2 1 0.994 0.986 1 0.994 1 0.996 0.986 1 0.995
GBM 0.998 0.969 0.942 0.986 0.982 0.997 0.962 0.94 0.977 0.984
GLM 0.999 0.97 0.94 0.968 0.99 0.999 0.973 0.941 0.996 0.977
MARS 0.998 0.957 0.932 0.979 0.977 0.995 0.955 0.922 0.985 0.97
MAXENT 0.99 0.93 0.845 0.857 0.983 0.991 0.94 0.865 0.978 0.96
RF 0.9 0.986 0.972 0.985 0.995 1 0.987 0.965 0.998 0.987
SRE 0.916 0.832 0.795 0.861 0.97 0.914 0.829 0.802 0.855 0.973
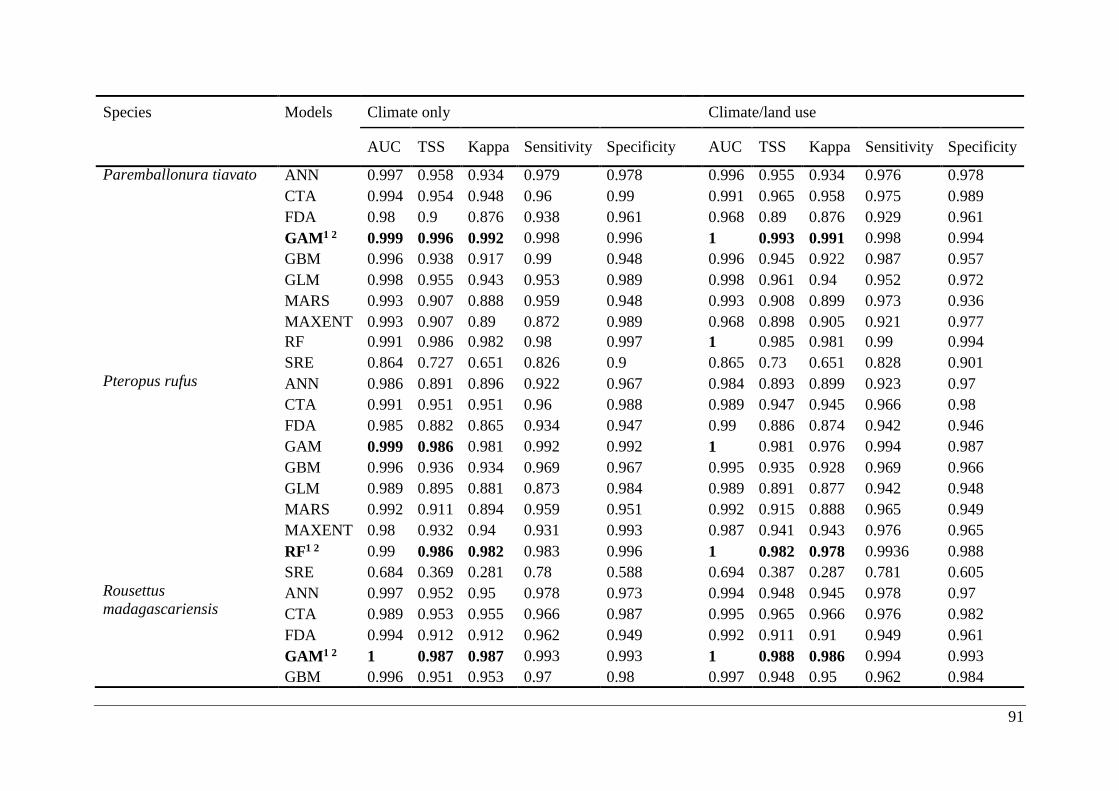
91
Species Models Climate only Climate/land use
AUC TSS Kappa Sensitivity Specificity AUC TSS Kappa Sensitivity Specificity
Paremballonura tiavato ANN 0.997 0.958 0.934 0.979 0.978 0.996 0.955 0.934 0.976 0.978
CTA 0.994 0.954 0.948 0.96 0.99 0.991 0.965 0.958 0.975 0.989
FDA 0.98 0.9 0.876 0.938 0.961 0.968 0.89 0.876 0.929 0.961
GAM1 2 0.999 0.996 0.992 0.998 0.996 1 0.993 0.991 0.998 0.994
GBM 0.996 0.938 0.917 0.99 0.948 0.996 0.945 0.922 0.987 0.957
GLM 0.998 0.955 0.943 0.953 0.989 0.998 0.961 0.94 0.952 0.972
MARS 0.993 0.907 0.888 0.959 0.948 0.993 0.908 0.899 0.973 0.936
MAXENT 0.993 0.907 0.89 0.872 0.989 0.968 0.898 0.905 0.921 0.977
RF 0.991 0.986 0.982 0.98 0.997 1 0.985 0.981 0.99 0.994
SRE 0.864 0.727 0.651 0.826 0.9 0.865 0.73 0.651 0.828 0.901
Pteropus rufus ANN 0.986 0.891 0.896 0.922 0.967 0.984 0.893 0.899 0.923 0.97
CTA 0.991 0.951 0.951 0.96 0.988 0.989 0.947 0.945 0.966 0.98
FDA 0.985 0.882 0.865 0.934 0.947 0.99 0.886 0.874 0.942 0.946
GAM 0.999 0.986 0.981 0.992 0.992 1 0.981 0.976 0.994 0.987
GBM 0.996 0.936 0.934 0.969 0.967 0.995 0.935 0.928 0.969 0.966
GLM 0.989 0.895 0.881 0.873 0.984 0.989 0.891 0.877 0.942 0.948
MARS 0.992 0.911 0.894 0.959 0.951 0.992 0.915 0.888 0.965 0.949
MAXENT 0.98 0.932 0.94 0.931 0.993 0.987 0.941 0.943 0.976 0.965
RF1 2 0.99 0.986 0.982 0.983 0.996 1 0.982 0.978 0.9936 0.988
SRE 0.684 0.369 0.281 0.78 0.588 0.694 0.387 0.287 0.781 0.605
Rousettus
madagascariensis ANN 0.997 0.952 0.95 0.978 0.973 0.994 0.948 0.945 0.978 0.97
CTA 0.989 0.953 0.955 0.966 0.987 0.995 0.965 0.966 0.976 0.982
FDA 0.994 0.912 0.912 0.962 0.949 0.992 0.911 0.91 0.949 0.961
GAM1 2 1 0.987 0.987 0.993 0.993 1 0.988 0.986 0.994 0.993
GBM 0.996 0.951 0.953 0.97 0.98 0.997 0.948 0.95 0.962 0.984
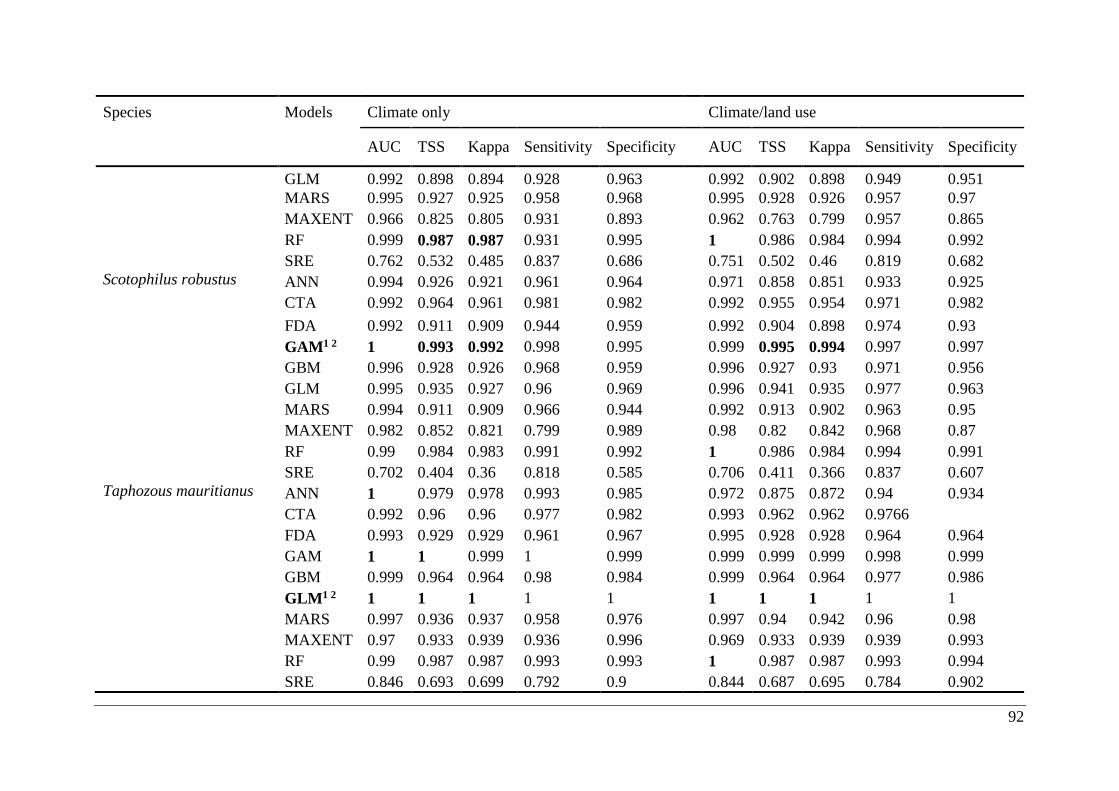
92
Species Models Climate only Climate/land use
AUC TSS Kappa Sensitivity Specificity AUC TSS Kappa Sensitivity Specificity
GLM 0.992 0.898 0.894 0.928 0.963 0.992 0.902 0.898 0.949 0.951
MARS 0.995 0.927 0.925 0.958 0.968 0.995 0.928 0.926 0.957 0.97
MAXENT 0.966 0.825 0.805 0.931 0.893 0.962 0.763 0.799 0.957 0.865
RF 0.999 0.987 0.987 0.931 0.995 1 0.986 0.984 0.994 0.992
SRE 0.762 0.532 0.485 0.837 0.686 0.751 0.502 0.46 0.819 0.682
Scotophilus robustus ANN 0.994 0.926 0.921 0.961 0.964 0.971 0.858 0.851 0.933 0.925
CTA 0.992 0.964 0.961 0.981 0.982 0.992 0.955 0.954 0.971 0.982
FDA 0.992 0.911 0.909 0.944 0.959 0.992 0.904 0.898 0.974 0.93
GAM1 2 1 0.993 0.992 0.998 0.995 0.999 0.995 0.994 0.997 0.997
GBM 0.996 0.928 0.926 0.968 0.959 0.996 0.927 0.93 0.971 0.956
GLM 0.995 0.935 0.927 0.96 0.969 0.996 0.941 0.935 0.977 0.963
MARS 0.994 0.911 0.909 0.966 0.944 0.992 0.913 0.902 0.963 0.95
MAXENT 0.982 0.852 0.821 0.799 0.989 0.98 0.82 0.842 0.968 0.87
RF 0.99 0.984 0.983 0.991 0.992 1 0.986 0.984 0.994 0.991
SRE 0.702 0.404 0.36 0.818 0.585 0.706 0.411 0.366 0.837 0.607
Taphozous mauritianus ANN 1 0.979 0.978 0.993 0.985 0.972 0.875 0.872 0.94 0.934
CTA 0.992 0.96 0.96 0.977 0.982 0.993 0.962 0.962 0.9766
FDA 0.993 0.929 0.929 0.961 0.967 0.995 0.928 0.928 0.964 0.964
GAM 1 1 0.999 1 0.999 0.999 0.999 0.999 0.998 0.999
GBM 0.999 0.964 0.964 0.98 0.984 0.999 0.964 0.964 0.977 0.986
GLM1 2 1 1 1 1 1 1 1 1 1 1
MARS 0.997 0.936 0.937 0.958 0.976 0.997 0.94 0.942 0.96 0.98
MAXENT 0.97 0.933 0.939 0.936 0.996 0.969 0.933 0.939 0.939 0.993
RF 0.99 0.987 0.987 0.993 0.993 1 0.987 0.987 0.993 0.994
SRE 0.846 0.693 0.699 0.792 0.9 0.844 0.687 0.695 0.784 0.902
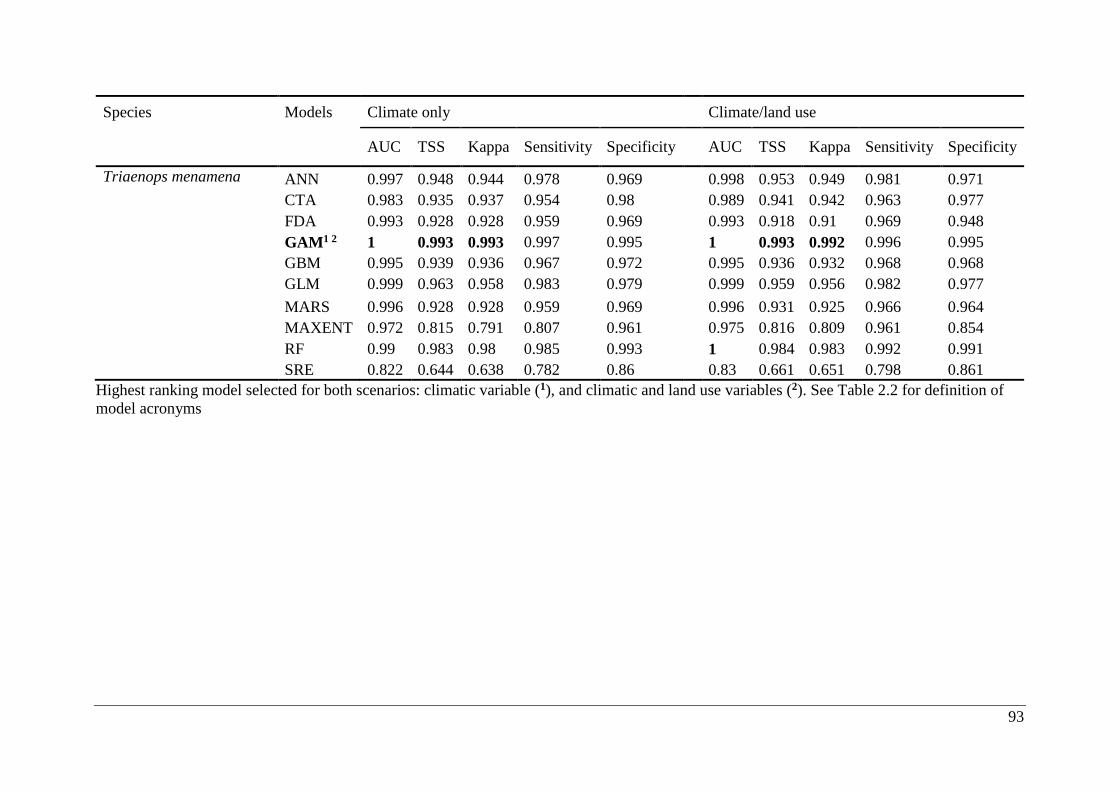
93
Species Models Climate only Climate/land use
AUC TSS Kappa Sensitivity Specificity AUC TSS Kappa Sensitivity Specificity
Triaenops menamena ANN 0.997 0.948 0.944 0.978 0.969 0.998 0.953 0.949 0.981 0.971
CTA 0.983 0.935 0.937 0.954 0.98 0.989 0.941 0.942 0.963 0.977
FDA 0.993 0.928 0.928 0.959 0.969 0.993 0.918 0.91 0.969 0.948
GAM1 2 1 0.993 0.993 0.997 0.995 1 0.993 0.992 0.996 0.995
GBM 0.995 0.939 0.936 0.967 0.972 0.995 0.936 0.932 0.968 0.968
GLM 0.999 0.963 0.958 0.983 0.979 0.999 0.959 0.956 0.982 0.977
MARS 0.996 0.928 0.928 0.959 0.969 0.996 0.931 0.925 0.966 0.964
MAXENT 0.972 0.815 0.791 0.807 0.961 0.975 0.816 0.809 0.961 0.854
RF 0.99 0.983 0.98 0.985 0.993 1 0.984 0.983 0.992 0.991
SRE 0.822 0.644 0.638 0.782 0.86 0.83 0.661 0.651 0.798 0.861
Highest ranking model selected for both scenarios: climatic variable (1), and climatic and land use variables (2). See Table 2.2 for definition of
model acronyms
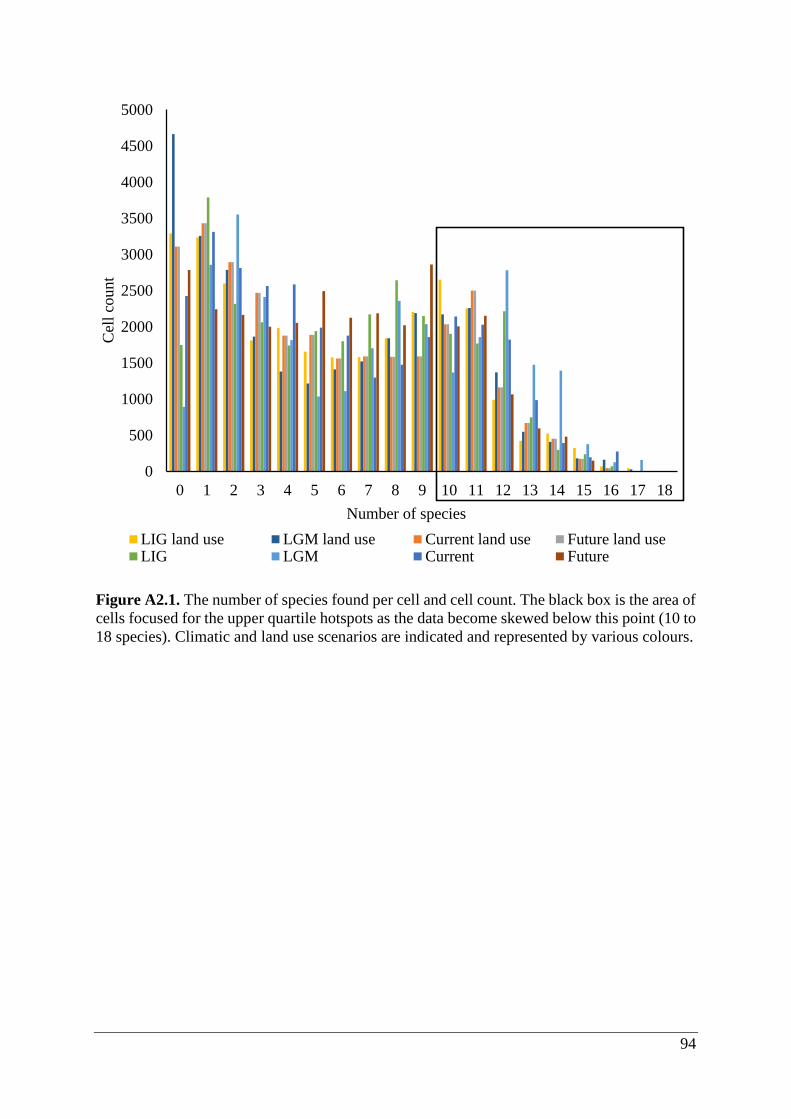
94
Figure A2.1. The number of species found per cell and cell count. The black box is the area of
cells focused for the upper quartile hotspots as the data become skewed below this point (10 to
18 species). Climatic and land use scenarios are indicated and represented by various colours.
0
500
1000
1500
2000
2500
3000
3500
4000
4500
5000
0 1 2 3 4 5 6 7 8 9 10 11 12 13 14 15 16 17 18
Cel
l co
unt
Number of species
LIG land use LGM land use Current land use Future land useLIG LGM Current Future


![The Causatives of Malagasy [1986] - Charles Randriamasimanana](https://img.pdfslide.us/doc/110x75/55cf8562550346484b8d6de7/the-causatives-of-malagasy-1986-charles-randriamasimanana.jpg)
![Malagasy for Beginner - (Rev.) J. Richardson [1884]](https://img.pdfslide.us/doc/110x75/55cf98b8550346d033994c0b/malagasy-for-beginner-rev-j-richardson-1884.jpg)