Embed Size (px)
Citation preview
Socio-Econ. Ph. Sci Vol. 14,pp. 129-M @ Pcrgamon Press Ltd., 1980. Printed in Great Britain
USING ENVIRONMENTAL BELIEFS AND PERCEPTIONS TO PREDICT TRADE-OFFS AND CHOICES AMONG WATER
QUALITY PLAN ALTERNATIVES?
LESTER W. MILBRATH
Environmental Studies Center, 123 Wilkeson Quadrangle, State University of New York, Buffalo, NY 14261, U.S.A.
(Received 27 June 1979)
Abstract-A sample of the broad public and leaders on the Niagara Frontier (of New York State) were interviewed in the summer of I976 as input to a “208” water quality plan being developed for the region. In a follow-up survey I8 months later, they were interviewed further on their beliefs and on their choice among plan alternatives. Prediction from first wave evidence to second wave choices was considerably better than chance; but aggregate predictions (where random error becomes self-cancelling) were better than individual level predictions. Problems of utilization of survey evidence by environmental planners also are discussed.
CITIZEN PARTICIPATION INENVIRONMENTALPLANNING
Many recent United States laws stipulate that the public shall be invited to be involved in environmental planning. Several of these laws even authorize resources to be used to encourage citizen participation. For example, Section 208 of the 1972 Water Quality Act Amendments authorizes funds to “designated areas” to develop com- prehensive water quality management plans. It is man- dated that citizens shall participate in the development of these so-called “208” plans and a specific portion of the planning budget (typically from 2 to 10%) is set aside to encourage this participation. Most “208” planning operations have hired one or more “public participation coordinators” to give fulltime attention to this effort. The federal and regional offices of the Environmental Pro- tection Agency, which has responsibility for ad- ministration of the Act, also has placed considerable emphasis on developing adequate programs enabling citizens to participate in the development of these environmental plans.
Despite this official encouragement for citizen parti- cipation, it has been exceedingly difficult to get wide- spread citizen participation. Personnel at our Center have had contact with a wide variety of citizen participation efforts in environmental planning; it is overwhelmingly evident from these contacts that the vast majority of citizens have little interest in such participation.
Some might argue that Congress never intended or expected that the average citizen would get involved in these planning efforts, that citizen participation really means the participation of local officials who, in most cases, must cooperate if the environmental plans are to be implemented. However, the leaders of many “citizens organizations” would vehemently disagree with ihat perspective and insist that public participation was meant to include all the people. It is probably impossible to ascertain what Congress “really intended” since it is quite likely that members of Congress had various images in mind about the citizen participation process at the time they voted on the provision.
t’fhe author gratefully acknowledges support from the Rocke- feller, Ford and Kettering Foundations for the study on which this paper is based.
In point of fact, at the present time there is consider- able pressure from the federal government to encourage citizen participation (of some sort) in these environ- mental planning efforts. These efforts are meeting with meager results, however. The traditional method for incorporating citizen input is to set up citizen committees that interact with the planners and with the public officials who supervise the activities of planners. These committees often are supplemented by public hearings, usually at the stage of presentation of alternative plans. Of course, citizens may also transmit oral and written messages to planners and public officials any time they choose.
These methods of citizen representation in environ- mental planning suffer some serious deficiencies. The greatest deficiency is that citizen committees and even hearings are by no means representative. A few citizens with special interests to protect or promote will join in the committee activities. Most of the “citizen parti- cipants” in the 208 planning effort on the Niagara Fron- tier were representatives of governments, corporations and interest groups. A tiny fraction of people parti- cipated out of a sense of citizen duty or because of special interest in environmental matters. The number of citizens involved in these planning committees is typic- ally less the l/lOth of 1% of the adult population. On the Niagara Frontier, for example, the maximum of 200 peo- ple who have become involved in the water quality planning effort constitutes about l/lOOth of 1% of the adults in the region. If 1000 people could be brought out to a public hearing (a highly unlikely prospect since the top attendance at a hearing on the Niagara Frontier was 40), it still would constitute less than l/lOth of 1% of the public in this region; furthermore, these people would by no means be representative of public views in the two countries. Most people are totally oblivious to “208” water quality planning efforts; our study shows, for example, that about 3/4 of the people in the region had never heard of the water quality plan despite valiant efforts by the public participation coordinators to obtain publicity.
A second deficiency of traditional methods of citizen participation in environmental planning is that it is extremely difficult to sustain interest in active parti-
129
130 L. W. MILESLATH
cipation over several months. In the Niagara Frontier region, considerable time was devoted at first by the Citizens’ Advisory Committee to a discussion of the proper role of the committee and to whether it had any role to play at all. Midway through the plan, it died altogether due to lack of interest.
Media attention to the planning effort, or to citizen participation in the effort, has provided little or no sup- plement to other efforts to obtain citizen participation. For the most part local media attention has been scanty or non-existent. Environmental planning just doesn’t seem to be. newsworthy.
Given the above situation, some planning operations have decided to reach out to the people through sample surveys and thus add an extra dimension of represen- tation in environmental planning. A well-designed and executed sample survey can improve representation in two important respects. First, by interviewing a random sample of the people in the region it is possible to obtain the views on environmental matters of an accurate representation of all of the types of people to be found in the area. Secondly, a well-designed and lengthy interview can obtain the beliefs and attitudes of people on a wide variety of environmental matters and related concerns. The specific beliefs on the specific planning effort (e.g. water quality), then, are seen in perspective as they are embedded in an overall set of environmental and economic beliefs and attitudes. When environmental beliefs are seen “in context” they can be interpreted more accurately than if they are elicited as a specific response to a single question.
If citizen participation is to be truly meaningful, it should be available at all stages of the planning process; it is particularly important that the views of the citizens be obtained relatively early in the process so that they can influence the development of the plan alternatives. While it makes good sense to most of the people in- volved in planning to receive citizen inputs early in the planning stages, a nagging question remains that was brought up with us frequently as we interacted with local planners and officials. Can the environmental beliefs and perceptions of the people obtained by a sample survey early in the planning process, be used as a guide as to whether or not public officials will be supported if they choose one or another environmental plan?
The question is put in this form for several reasons: (1) Alternative environmental plans seldom, if ever,
are put to a referendum vote. The decision to accept one or another plan usually lies with local, state, or federal officials.
(2) Decisions about the plan must be taken publicly and can result in a public outcry. The public officials faced with such an outcry, via the media or at a public hearing, are hardpressed to know how to interpret it. The persons crying out may well be only a small fraction of the public but how can the public official know what the rest of the people think?
(3) Most public officials also do not know whether they
“A comparison of demographic characteristics of first and second wave samples discloses that the second wave sample is a bit higher in education and general socio-economic stat& than
the original sample (higher SES persons tend to be more stable
residents of a &mm&y). This’upward bias is very slight and could at most bias responses to belief and perception questions by 5%.
can believe what people tell researchers on surveys. Is the opinion given in a brief interview at the doorstep a solid position or will it change with the next whim of feeling? Are environmental beliefs embedded in a stable philosophy which provides long-range guidance as to the way an individual interprets his world? How can a public official know what the people really would want if they had the occasion to gather lots of information and really think through a problem?
These are exceedingly difficult questions for which there is no clearcut yes or no answer. An opinion given at time 1 to a survey interviewer may be very firm and well thought out, but thought provoking intervening events may produce a different opinion when the res- pondent is questioned at time 2 which will be equally firm and well thought out. The survey may very ac- curately record the change but the consumers of survey findings may conclude that the survey measured inac- curately or that this person’s opinion was fickle. The Environmental Studies Center at SUNY/Buffalo has conducted a study which sheds some light on these difficult questions even though it cannot provide definitive answers.
THE DATA BASE FOR THE STUDY With support from the Rockefeller, Ford and Kettering
Foundations, the Environmental Studies Center conduc- ted a survey study of the environmental perceptions and beliefs of a cross-section random sample of people living on the Niagara Frontier of New York State (Erie and Niagara Counties). A “208” water quality management plan was being developed for the region by the Erie and Niagara Counties Regional Planning Board. Lengthy in- terviews (approx. 70min.) were conducted with 1021 respondants selected by a four-stage area-prob- ability sample (68% response rate). The sampling frame was developed at considerable expense by the Survey Research Center at SUNY/Buffalo; the Survey Center also executed the fieldwork and coding of the sample survey of the public.
The staff of the Environmental Studies Center also conducted personal interviews with 233 leaders drawn from different sectors of leadership from the two coun-
ties (%% response rate). These leaders are represen- tative of those who are most likely to participate in the development of the water quality plan or in the approval of the plan[ I]. The first wave interviews were conducted in the summer of 1976 and data from the study were presented to the planners and the public at large, late in 1976 and early 1977.
In the summer of 1977 the Environmental Studies Center received additional funding from the Rockefeller Foundation to conduct a “follow-on” study to discover how the public and the leaders in this community reacted to the presentation of the water quality plan alternatives and to the planning process itself. As many of the original broad public sample as could be reached were re-interviewed by telephone by the staff of the Survey Research Center at SUNY/Buffalo during the winter (January-March 1978). As is usual in our mobile society, a substantial proportion of the original sample (ap- prox. 120) had died, moved out of the region, or were otherwise unavailable. Approximately 70% of those recontacted consented to be re-interviewed for a total second wave sample of 631.” For most respondents the time lapse between interviews was approximately 18 months.
Choices among water quality pian alternatives 131.
Of the original 233 leaders that were sampled, ap- proximately 220 continued to live in the region and 180 of these responded to a mailed questionnaire. This 81% response rate was achieved by sending reminders and making phone calls to stimuiate respondents.
The data base from the two waves of interviews with both public and leader samples is quite rich requiring storage on approximately 18,000 computer cards. Only a few questions from the first wave were repeated on the second wave. A number of new questions were put to respondents to fill in information that analysis of the first wave data had disclosed would be desirable to have. Leaders, particularly, were questioned about their per- ceptions of the “208” planning process as well as per- ceptions of our own survey study.
A key question for both public and leaders concerned the water quality plan alternatives presented by the “208” planers. The question read:
“The Erie-Niagara Regional Planning Board recently proposed a plan which, if implemented, would bring the quality of the water in the area‘s inland lakes and streams in line with current governmental standards. Most of these lakes and streams could then be used for fishing but would not be suitable for swimming. Carrying out this plan would cost an average of $57 per person in extra taxes each year. A second plan would improve water quality even more and many lakes and streams would then be suitable for swim- ming. Carrying out this second plan would cost an average of $67 per person in extra taxes each year, $10 more than the first plan. Of these two plans, which do you prefer?+
Those who were opposed to both plans were coded as such. Those expressing a preference for one of the two plans were asked to indicate the strength of their pref- erence. Additionally, leaders were asked to predict how
“The cost figures used in the question were provided hy the “208” planners and the wording of the question was carefully reviewed by the “208” planning staff. Three months later, after most of the public and leader reinterviews had already taken place, the “208” planners revised the figures slightly: a per capita cost for the first plan was re-estimated to be $53 and the per capita cost for the second plan was re-estimated at $69. The per capita cost difference between the two plans, according to the updated figures, would then be $16 rather than $10.
Would $16 vs $10 a year extra make a difference in response? We think it would he only slight. Most people who preferred the second plan preferred it sfrongly. A person who really wants clean water will readily pay an additional $6 a year. The table should not he interpreted to seek a single precise percentage figure; rather that a majority of the people supported a more ambitious and costly water clean-up effort, far exceeding the expectations of leaders.
‘The env~onmental conditions that were measured on both waves by identical items were: (1) “in the past year, do you think economic conditions in the Erie-Niagara region have gotten better, gotten worse, or stayed about the same?‘, (2) “Imagine a ladder with ten steps. The top of the ladder represents the best possible environmental conditions and the bottom of the ladder represents the worst possible environmental conditions. Where do you think the conditions you have in your ~~~~u~~~y stand on the ladder at the present time? Which step?“, (3) “Again, think of the ladder with ten steps. This time imagine the top of the ladder as very clean water and the bottom as filthy water. Where on the ladder would you rate the quality of the water in most inland lakes and streams in Erie and Niagara Counties at the present time?‘.
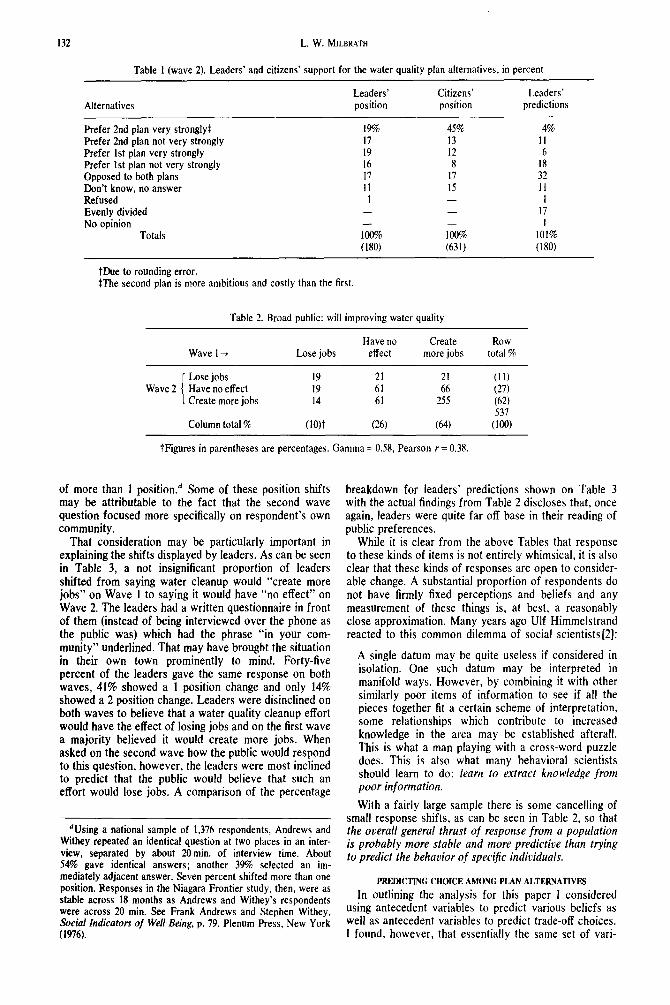
the public would be likely to answer that question. The response of both leaders and citizens to this question as well as leader’s predictions of citizen response to that question is shown in Table 1.
The data disclose that citizens quite strongly prefer the second plan over the first plan. Leaders were more evenly divided in their plan preferences. Only 17% of each group opposed both plans.
The most interesting finding from Table 1 is how poorly the leaders predicted how the public would react to that question. Only 4% believed the public would strongly prefer the second plan in contrast to the 45% who expressed such a preference. The most popular prediction of the leaders was that people would be opposed to both plans: 32% selected that alternative. Not only were the leaders own views somewhat out of step with those of the public but their beliefs concerning public preferences were even further out of step.
STABtLlTY OF BELIEFS OVER TIME As mentioned above, we repeated some items from
Wave 1 in the Wave 2 interviews. We wished to know if certain important beliefs and perceptions were sufficiently stable to provide some guide to choice behavior a few years into the future. Generally we found that beliefs about human nature and society were more stable from time 1 to time 2 than were perceptions about environmental conditions; test-retest correlations of the same belief items across the two waves generally were in the 0.45-0.50 range while time l-time 2 correlations Of perceptions about env~onmental conditions were more likely to fall in the 0.25-0.30 range.’ It is possible, of course, that respondents perceived environmental con- ditions to have changed from the first to the second wave and that was reflected in their differing judgements about those conditions. It seems more likely, however, that respondents are less certain to begin with when making judgements about env~onmen?al conditions than they are about their own beliefs.
The following item which was repeated for both leaders and the public on the second wave is the most suitable to illustrate stability and change in beliefs:
“Overall, do you think an effort to improve water quality in your community would cause people to lose their jobs, create more jobs, or would it have no effect?”
The phrase “in your community” was added to the item in the second wave because we decided to focus the second wave interviews more specifically on respon- dent’s community. Unfortunately, this move erodes somewhat the strict comparability needed to illustrate stability in beliefs across time. (Re~e~bly, no other belief item is exactly comparable across the two waves.)
Table 2 reports a cross-tabulation of broad public responses to those closely comparable items on the two waves of interviews. Looking first at the percentages in the margins (in parentheses) showing the proportions in each category, one can see that the percentage break- down is very similar on both waves. This near identity in proportions falling in each category disguises, however, some modest shifting by individual respondents from Wave 1 to Wave 2; 62% of the respondents gave iden- tical responses on both waves, another 31% showed a change of only 1 position (e.g. from “create jobs” to “have no effect”), and only 7% showed a strong switch
132 L. W. MILBRATH
Table 1 (wave 2). Leaders’ and citizens’ support for the water quality plan alternatives, in percent
Leaders’ Alternatives position
Prefer 2nd plan very strongly+ 1% Prefer 2nd plan not very strongly 17 Prefer 1st plan very strongly 19 Prefer 1st plan not very strongly 16 Opposed to both plans 17 Don’t know, no answer II Refused I Evenly divided - No opinion -
Totals ig
tDue to rounding error. SThe second plan is more ambitious and costly than the first.
Citizens’ position
45% 13 12 8
17 15 -
1% (631)
Leaders’ predictions
4% II 6
18 32 II 1
17 I
101% (180)
Table 2. Broad public: will improving water quality
Have no Create Row Wave I+ Lose jobs effect more jobs total %
{
Lose jobs 19 21 21 (11) Wave 2 Have no effect 19 61 66 (27)
Create more jobs 14 61 255 (62) 537
Column total % VJjt (26) (64) (100)
tFigures in parentheses are percentages. Gamma = 0.58, Pearson r = 0.38.
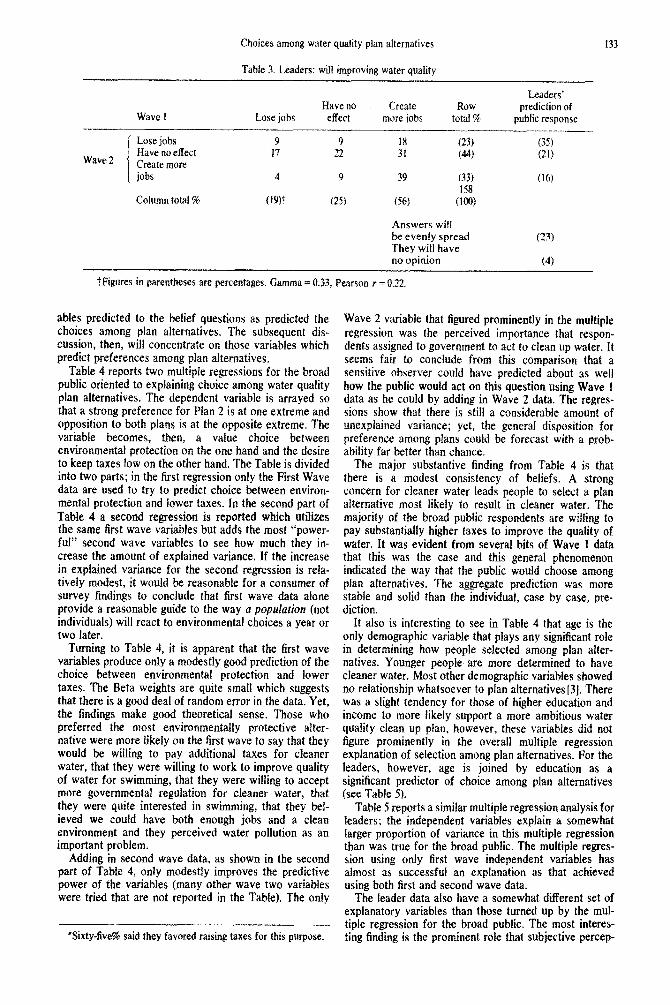
of more than 1 position.d Some of these position shifts breakdown for leaders’ predictions shown on Table 3 may be attributable to the fact that the second wave with the actual findings from Table 2 discloses that, once question focused more specifically on respondent’s own again, leaders were quite far off base in their reading of community. public preferences.
That consideration may be particularly important in explaining the shifts displayed by leaders. As can be seen in Table 3, a not insignificant proportion of leaders shifted from saying water cleanup would “create more jobs” on Wave 1 to saying it would have “no effect” on Wave 2. The leaders had a written questionnaire in front of them (instead of being interviewed over the phone as the public was) which had the phrase “in your com- munity” underlined. That may have brought the situation in their own town prominently to mind. Forty-five percent of the leaders gave the same response on both waves, 41% showed a 1 position change and only 14% showed a 2 position change. Leaders were disinclined on both waves to believe that a water quality cleanup effort would have the effect of losing jobs and on the first wave a majority believed it would create more jobs. When asked on the second wave how the public would respond to this question, however, the leaders were most inclined to predict that the public would believe that such an effort would lose jobs. A comparison of the percentage
While it is clear from the above Tables that response to these kinds of items is not entirely whimsical, it is also clear that these kinds of responses are open to consider- able change. A substantial proportion of respondents do not have firmly fixed perceptions and beliefs and any measurement of these things is, at best, a reasonably close approximation. Many years ago Ulf Himmelstrand reacted to this common dilemma of social scientists[2]:
A single datum may be quite useless if considered in isolation. One such datum may be interpreted in manifold ways. However, by combining it with other similarly poor items of information to see if all the pieces together fit a certain scheme of interpretation, some relationships which contribute to increased knowledge in the area may be established afterall. This is what a man playing with a cross-word puzzle does. This is also what many behavioral scientists should learn to do: learn to extract knowledge from poor information.
dUsing a national sample of 1,376 respondents, Andrews and Withey repeated an identical question at two places in an inter- view, separated by about 20min. of interview time. About 54% gave identical answers; another 3% selected an im- mediately adjacent answer. Seven percent shifted more than one position. Responses in the Niagara Frontier study, then, were as stable across 18 months as Andrews and Withey’s respondents were across 20 min. See Frank Andrews and Stephen Withey, Social Indicators of Well Being, p. 79. Plenum Press, New York (1976).
With a fairly large sample there is some cancelling of small response shifts, as can be seen in Table 2, so that the overall general thrust of response from a population is probably more stable and more predictive than trying to predict the behavior of specific individuals.
PREDICTING CHOICE AMONG PLAN ALTERNATIVES
In outlining the analysis for this paper I considered using antecedent variables to predict various beliefs as well as antecedent variables to predict trade-off choices. I found, however, that essentially the same set of vari-
Choices among water quality plan alternatives
Table 3. Leaders: will improving water quality
133
Wave I Lose jobs
Leaders’ Haveno Create Row prediction of effect more jobs total % public response
Lose jobs 9 9 I8 (23)
Wave 2 Have no effect 17 22 31 (44) Create more jobs 4 9 39 (33)
158 Column total % (19tt (25) (56) MJO)
Answers wilt be evenly spread They will have no opinion
tFigures in parentheses are percentages. Gamma = 0.33, Pearson r = 0.22.
(35) (21)
(16)
(23)
(4)
ables predicted to the belief questions as predicted the choices among plan alternatives. The subsequent dis- cussion, then, will concentrate on those variables which predict preferences among plan alternatives.
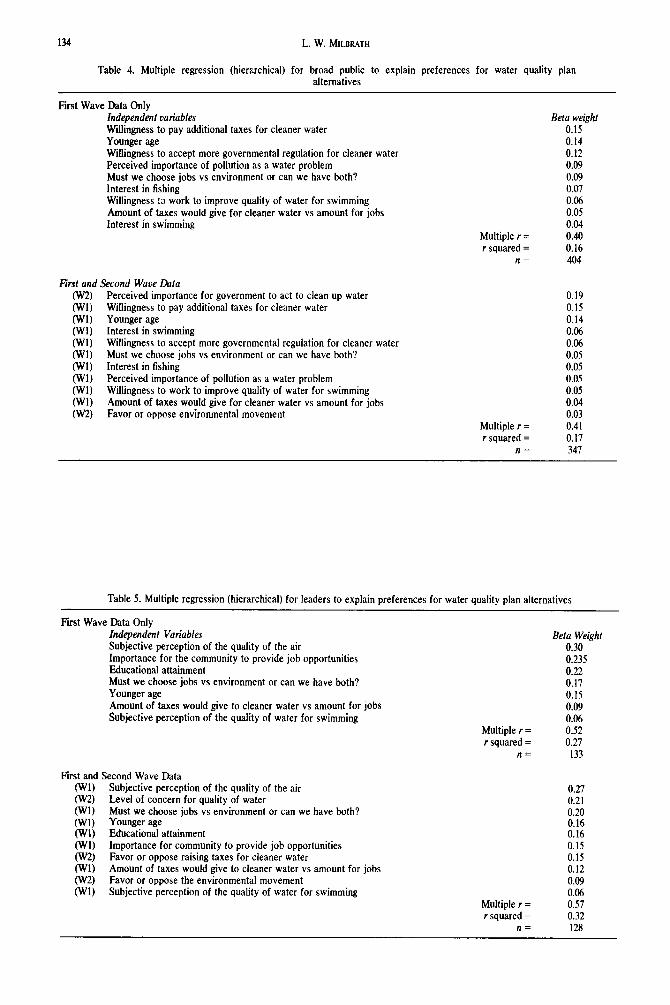
Table 4 reports two multiple regressions for the broad public oriented to explaining choice among water quality plan alternatives. The dependent variable is arrayed so that a strong preference for Plan 2 is at one extreme and opposition to both plans is at the opposite extreme. The variable becomes, then, a value choice between env~onmental protection on the one hand and the desire to keep taxes low on the other hand. The Table is divided into two parts; in the first regression only the First Wave data are used to try to predict choice between environ- mental protection and lower taxes. In the second part of Table 4 a second regression is reported which utilizes the same first wave variables but adds the most “power- ful” second wave variables to see how much they in- crease the amount of explained variance. If the increase in exptained variance for the second regression is rela- tively modest, it would be reasonable for a consumer of survey findings to conclude that first wave data alone provide a reasonable guide to the way a population (not individuals) will react to environmental choices a year or two later.
Turning to Table 4, it is apparent that the first wave variables produce onty a modestly good prediction of the choice between environmentat protection and lower taxes. The Beta weights are quite small which suggests that there is a good deal of random error in the data. Yet, the findings make good theoretical sense. Those who preferred the most environmentally protective alter- native were more likely on the first wave to say that they would be willing to pay additional taxes for cleaner water, that they were willing to work to improve quality of water for swimming, that they were willing to accept more governmentaf regulation for cleaner water, that they were quite interested in swimming, that they bel- ieved we could have both enough jobs and a clean environment and they perceived water pollution as an important problem.
Adding in second wave data, as shown in the second part of Table 4, only modestly improves the predictive power of the variables (many other wave two variables were tried that are not reported in the Table). The only
‘Sixty-five% said they favored raising taxes for this purpose.
Wave 2 variable that figured prominently in the multiple regression was the perceived importance that respon- dents assigned to government to act to clean up water, It seems fair to conclude from this comparison that a sensitive observer could have predicted about as well how the public wouId act on this question using Wave 1 data as he could by adding in Wave 2 data. The regres- sions show that there is still a considerable amount of unexplained variance; yet, the general disposition for preference among ptans could be forecast with a prob- ability far better than chance.
The major substantive finding from Table 4 is that there is a modest consistency of beliefs. A strong concern for cleaner water leads people to select a plan aIternative most likely to result in cleaner water. The majority of the broad public respondents are willing to pay substantially higher taxes to improve the quality of water. It was evident from several bits of Wave 1 data that this was the case and this genera1 phenomenon indicated the way that the public would choose among plan alternatives. The aggregate prediction was more stable and solid than the individual, case by case, pre- diction.
It also is interesting to see in Table 4 that age is the only demographic variable that plays any significant role in determining how people selected among plan alter- natives. Younger people are more determined to have cleaner water. Most other demographic variables showed no relationship whatsoever to plan alternatives [3]. There was a slight tendency for those of higher education and income to more likely support a more ambitious water quality clean up plan, however, these variables did not figure prominentIy in the overall multiple regression explanation of selection among plan alternatives. For the leaders, however, age is joined by education as a significant predictor of choice among plan alternatives (see Table 5).
Table 5 reports a similar multiple regression analysis for leaders; the independent variables explain a somewhat larger proportion of variance in this multiple regression than was true for the broad public. The multiple regres- sion using only first wave independent variables has almost as successful an expIanation as that achieved using both first and second wave data.
The leader data also have a somewhat different set of explanatory variables than those turned up by the mul- tiple regression for the broad public. The most interes- ting finding is the prominent role that subjective percep-
134 L. W. MILBRATH
Table 4. Multiple regression (hiercrchical) for broad public to explain preferences for water quality plan alternatives
Fist Wave Data Only Independent variables Willingness to pay additional taxes for cleaner water Younger age Willingness to accept more governmental regulation for cleaner water Perceived importance of pollution as a water problem Must we choose jobs vs environment or can we have both? Interest in fishing Willingness to work to improve quality of water for swimming Amount of taxes would give for cleaner water vs amount for jobs Interest in swimming
First and Second Wave Data (W2) Perceived importance for government to act to clean up water (WI) Willingness to pay additional taxes for cleaner water (Wl) Younger age (Wl) Interest in swimming (WI) Willingness to accept more governmental regulation for cleaner water (WI) Must we choose jobs vs environment or can we have both? (WI) Interest in fishing (WI) Perceived importance of pollution as a water problem (Wl) Willingness to work to improve quality of water for swimming (WI) Amount of taxes would give for cleaner water vs amount for jobs (W2) Favor or oppose environmental movement
Beta weight 0.15 0.14 0.12 0.09 0.09 0.07 0.06 0.05 0.04
Multiple r = 0.40 r squared = 0.16
ll= 404
Multiple r = r squared =
n=
0.19 0.15 0.14 0.06 0.06 0.05 0.05 0.05 0.05 0.04 0.03 0.41 0.17 347
Table 5. Multiple regression (hierarchical) for leaders to explain preferences for water quality plan alternatives
Fist Wave Data Only Independent Variables Subjective perception of the quality of the air Importance for the community to provide job opportunities Educational attainment Must we choose iobs vs environment or can we have both? Younger age . Amount of taxes would give to cleaner water vs amount for Jobs Subjective perception of the quality of water for swimming
Fist and Second Wave Data fJ+‘l) Subjective perception of the quality of the air (W2) Level of concern for quality of water (WI) Must we choose jobs vs environment or can we have both? (wl) Younger age (Wl) Educational attainment (Wl) Importance for community to provide job opportunities (W2) Favor or oppose raising taxes for cleaner water (Wl) Amount of taxes would give to cleaner water vs amount for jobs (w2) Favor or oppose the environmental movement (WI) Subjective perception of the quality of water for swimming
Multiple r = r squared =
n=
Beta Weight 0.30 0.235 0.22 0.17 0.15 0.09 0.06 0.52 0.27 133
Multiple r = r squared =
n=
0.27 0.21 0.20 0.16 0.16 0.15 0.15 0.12 0.09 0.06 0.57 0.32 128
Choices among water quality plan alternatives 135
tion of the quality of the air plays in explaining pref- erences for the water quality plan alternatives. Among the leader sample, perception of quality of air was an important indicator of the general emphasis that a person placed on environmental protection. Leaders showed considerable variation in their judgements about the quality of the air. As a whole, they judged it to be of higher quality than did the broad public. Furthermore, they placed it lower in importance for leading to quality of life than did the broad public. It seems that as some leaders denied the importance of environmental protec- tion and the environmental movement, they also denied that there was anything wrong with the air in the community [4].
Another interesting difference between the multiple regression for leaders, as contrasted to the broad public, is that leaders tended more to trade off the provision of job opportunities against the value of environmental protection in contrast to the broad public which more likely traded off environmental protection against higher taxes. It seems that as the leaders judged among the plan alternatives they were much more concerned about the provision of job opportunities than was the public. This interpretation is given credence by other data from the study. For example, on the first wave all respondents filled out an Environmental Quality Module. For each element in that Module, respondents judged whether the element was pleasing or displeasing and also then judged how important it would be to improve that element, if it were of poor quality, in order to bring overall quality to one’s life. Mean scores were calculated for each of these scales and then ranked for the broad public and for the leaders. For the public, “job opportunities” ranked 13th in importance; for the leaders they ranked 9th in im- portance; for the elected leaders they ranked 2nd in importance. This rank was even higher than the ranking given to job opportunities by the unemployed who ran- ked it 6th.
Another bit of evidence is that each respondent was asked:
“Some people believe that improving the environment causes a loss of jobs; others believe that improving the environment creates more jobs. What do you think; can we have both an improved environment and enough jobs or must we choose between the two?“.
Eighty percent of both the broad public and the leaders believed that we can have both and need not choose. Yet, when leaders were asked to predict how the public would answer the question, 52% believed that the public would believe we must choose between jobs and environment. This jobs vs environment item showed a Beta weight of approximately 0.20 in the regressions in Table 5.
It is quite obvious, from this and other data, that the leadership in this community, particularly the elected leaders, believe that the provision of jobs is extremely important. This value is the major one they balance off against environmental protection. The public, on the other hand, is perceptibly less concerned with the pro- vision of jobs and the main value that they balance off against environmental protection is the possibility of higher taxes. It is also fair to say that the public placed a higher value on environmental protection than did the leadership in the community. This higher valuation clearly was expressed in the much stronger preference for the more ambitious water quality improvement plan than was shown by the leaders; yet, the leaders tended to
perceive the public as having even less support for water quality cleanup than they (the leaders) expressed.
CANSURVEYSVALIDLYREPRFSENTTHEPUBLICIN ENVIRONMENTALPLANNING?
A wide variety of variables and analyses disclose that a genera1 environmentally protective and enhancing motivation lies behind the preference of a majority of the public for the more ambitious and more costly water plan alternative. The major opposing value that the public weighed against environmental protection was the attraction of lower taxes. The major opposing value that the leaders contrasted with environmental protection was their concern to provide more jobs for the community. All three of these general thrusts were visible on the first wave of interviews and could have been used to predict how the leaders and the public would be likely to select among plan alternatives. Leaders who were sensitive to the findings from our first wave could have known that if they pushed for a fairly ambitious water cleanup plan they would be supported by the public in the community. Yet, the leaders demonstrated again and again, on both waves of interviews, their inability to predict how the public would stand on a variety of environmental beliefs and values. It is curious that even though leaders were sent copies of papers reporting findings from the first wave, they apparently did not believe them or did not integrate them into their belief system (they may not have even read them). Their predictions of public res- ponses on the second wave were just as far off as they were on the first wave.
Even though the general aggregate thrust of response on the first wave was adequate for predicting aggregate selection among plan alternatives on the second wave, survey data were not particularly powerful for predicting choice behavior at the individual level. Many of the individual level correlations were clearly statistically significant but they were not very high. Respondents views are probably not sufficiently fixed, and social measurement is not sufficiently precise, to achieve high correlations with individual level data. Responses. to survey questions are not a function of pure whimsy to any significant extent. The problem, rather, is lack of precision in belief holding and lack of precision in belief measurement. The aggregation of responses for a reasonably large sample tends to cancel out a substantial portion of this random error. Hence, aggregate in- dications of thrust or emphasis are more likely valid and sufficiently stable to be predictive of choice in the near- term future than are individual level measures.
Had the water quality leaders on the Niagara Frontier paid closer attention to our first wave data, could they have produced a water quality plan that was better and/or more in tune with the needs of the people? Put in that form the question cannot be answered clearly. The Regional Planning Board has recently postponed for the third time making its own recommendations among the plan alternatives. The choice of plan emphasis also must be made by the State Department of Environmental Conservation and by the regional office of the Environ- mental Protection Agency. In this context it is doubtful that there will be any clearcut choice of plan emphasis and it is quite certain that the broad public will not be called upon to make a choice by any type of formal vote.
Perhaps a more fundamental question should be asked. Should citizens’ wishes be followed in the making of environmental plans? One could imagine many leaders
136 L. W. MILBRATH
on the Niagara Frontier arguing that, “citizens are not very interested in environmental planning, they are poorly informed and they don’t really know what is best for them. They do not realize that the important trade-off against environmental protection is provision of jobs and when it comes right down to it we must do everything we can to develop more jobs in this community and environmental protection will just have to take a lower priority.”
Yet, our survey data show that most citizens have a very different perception. They want the environment cleaned up, particularly they want the quality of the water to be improved and they even are willing to pay higher taxes in order to achieve that. They want job opportunities in the community as well but they do not believe that it is necessary to choose between jobs and environmental protection. As a matter of fact, a majority of them believe that taking strong action to clean up the water will create more jobs. It is impossible to say, without waiting for future developments, which of these perspectives is most correct. It is clear, however, that if citizens’ wishes, as expressed on both waves of inter- views, were followed, the more ambitious and costly water cleanup plan would be adopted and carried into implementation by local political leaders.
Laying survey facts of this sort before leaders does not seem to be sufficient to turn the tide of political decision. Maybe it requires the earnest clamoring of “fired up” citizens to impress most leaders that the people really mean what they say. As indicated earlier, there is insufficient interest in environmental planning among the broad public to result in this kind of fired up participation. Leaders may think that the people don’t really mean what they say if they are not prompted to take overt action. In my judgement, such leaders are making an inaccurate assessment of the wishes of the public; but without strong and visible clamor from the public there is little that social researchers can do to get local decision makers to attend to their findings. Indeed, they can ignore citizen participation altogether and suffer no sanctions; at least they can on the Niagara Frontier.
This leads to the conclusion that if surveys are to be successful as a citizen input to environmental planning they either must be welcomed by planners or they must be backed up by an active and visible citizen’s movement to insist that leaders attend to the survey findings. The researcher conducting a survey in a community with little or no citizen activity is thus left dangling on the horns of a dilemma: should he conduct his survey, present his findings and then step back to maintain his objectivity or should he present his findings and use them to stir up a political movement to force the local leadership to pay attention? Perhaps our experience on the Niagara Frontier will help others to seek out environmental planning settings in which to conduct surveys where there is sufficient interest by planners or sufficient political activism to help insure that the survey will meaningfully be integrated into the planning process.
REFERENCES
1. Details of the leadership sampling procedure are set forth in George With, Joseph Sedransk and Paul Reitan, Strategies for Selection of a Leadership Sample in Applied Survey Research: a case study in Erie and Niagara Counties. New York, 1976, Environmental Studies Center, SUNY/Buffalo, 1977.
2. Ulf Himmelstrand, Social Pressures, Attitudes and Demo- cratic Processes p. 11. Stockholm, Almquist and Wiksell w60).
3. Sheldon Kamieniecki, An Examination of the Socio- Economic and Demographic Characteristics of Leader and Citizen Supporfers of the Niagara Frontier “208” Water Quality Plan Alternatives. Environmental Studies Center, SUNY/Buffalo (June 1978).
4. For further discussion of leaders’ subjective perceptions of air quality, see Lester W. Milbrath, An Extra Dimension of Representation in Water Quality Planning: A Survey Study of Erie and Niagara Counties in New York (1976). Occasional Paper No. 1 of the Environmental Studies Center, SUNY/Buffalo (January 1916). Also see Lester W. Milbrath, Qualitv of Life on the Niaaara Frontier Region of New York .!?tate,~Occasi&al Paper No. 8 from the Environmental Stu- dies Center, SUNY/Buffalo (December 1977).