Embed Size (px)
Citation preview
USING EDUCATIONAL TOOLS AND INTEGRATIVE EXPERIENCES VIA
GEOVISUALIZATIONS THAT INCORPORATE SPATIAL THINKING, REAL WORLD
SCIENCE AND OCEAN LITERACY STANDARDS IN THE CLASSROOM:
A CASE STUDY EXAMINED
by
Michelle Rene Kinzel
A RESEARCH PAPER
submitted to
THE GEOSCIENCES DEPARTMENT
OREGON STATE UNIVERSITY
in partial fulfillment of the
requirements for the degree of
MASTER OF SCIENCE
GEOGRAPHY PROGRAM
February 2009
Directed by
Dr. Dawn J. Wright

In Gratitude
I would first and foremost like to thank the most influential women in my life, my major advisor,
Dr. Dawn Wright (Deepsea Dawn), and my mother, Patricia Kinzel. They have both inspired
me, supported me, and shown me tough love when I needed it. Without their presence and
influence, I would not have been able to do all I have in this life.
Dawn has been supportive and unfalteringly present during my tenure as a Master’s student in
the Geosciences Department. Her dedication and commitment to all of her students is inspiring,
her patience with me is often heart-warming, and her positive guidance contributed to the
success and sense of belonging I found here at OSU. Her ability to keep it real and remain
accessible despite numerous great achievements in her career and high demands on her time and
attention is nothing short of amazing. In the toughest of times, I was comforted by knowing
what a great mentor I was able to work with and for, and have learned far more than I could have
imagined I would when I decided to come back to graduate school.
My mother Patricia taught me at an early age to love words, books and reading, and led me to
success in academia. Her dedication and selfless love have been a constant source of sustenance
and guidance in my life. Her example as a caring educator helped shape my career choices and
contributed to my character development. Like a lighthouse guiding sailors back to port, she
always kept the light on for me and sheltered me during the rough storms. Every day of my life
is filled with gifts because of the circumstance of my birth and the warmth of her love. I can’t
imagine a greater fortune in my life or feeling more love for someone.
I want to extend a tremendous thank you to my committee members, Dr. Becker and Dr. Mate,
for providing the greatest of all services, that of mentorship. Dr. Hannah Gosnell reached out to
me and solidified my sense of confidence early in my stay here at OSU (and has introduced me
to 2 of the best little friends I have ever had). Dr. Jon Kimerling and Dr. Julia Jones of the
Geography Department were truly supportive above and beyond my expectations. Mark Meyers,
Dr. Becker and Nancee Hunter all contributed time and expertise in the development of my
research methods and assessments. Brian Wake of Corvallis High School worked patiently with
me through many schedule changes and helped me jump many hurdles in my research. Dr. Bill
Prothero helped me learn about educational tools and calmed me during a few frantic phone

calls. Dr. Anne Nolin encouraged me to strive for excellence and move upward and onward. Dr.
Gordon Matzke introduced me to life as a Geography student, smiling and jovial as I gazed at
him over my coffee in the wee hours of the morning my first term. Dr. Michael Wing provided
support and encouragement and last minute letters of recommendation to assist me in seeking
funding and scholarships, many thanks are extended back to him.
There are many others who have been there for and with me, and I want to thank them for all
they have done and been in my lives. To Deby, I love you like a sister, and don’t know what I
did to deserve your goodness in my life, but I am so very glad. To my Paul and Adam, I love
you guys so much my heart actually swells when I think of you. To Cindy, whom I love beyond
words, I truly do believe we were separated at birth, and am so glad we have stayed friends since
5th grade. To Melinda, you have been my friend, confidant, sounding board, salvation and best
part of many, many days (no one makes me smile bigger or laugh louder) and I love you (you
can keep Kujo Kittie). To Karen, I will ignore the sentiment because I can (and because you
know how I feel, you rock). And I will always be here to help you move whatever needs
moving. To Svenja, a kindred pirate spirit, we shall sail on many more great adventures. To
William, and the many CERF crew, thanks for sharing so many magical memories with me and
for telling me it was going to be okay (it finally is). To Bob, your calming and comforting
friendship are a rare gift in this world, thank you for encouraging me to rediscover my true self.
To Joe, a heaping wallop of gratitude for believing in me and encouraging me to pursue this
wonderful path, and for showing me how to be peaceful and happy even when the tent was
falling down and the wheels were coming off in Baja. To Jose Maria, my fellow Baja/GIS
compadre, thank you for sharing your beautiful family and kind spirit with me, there will be
more mapping excursions to wild places for us. To Dave, good fortune crossed our paths, and I
see many more adventures on the weathered horizon, you are a truly amazing human being,
thank you for being who you are.
There are countless others to appreciate and thank; my fellow rogues in Davey Jones Locker
(Celeste, Jed, Brett, Kyle, Dylan); my fellow graduate students who often burned the midnight
oil next to me in Wilkinson; my family and friends who were always supportive and true
believers; Dr. Joseph Kerski, whose passion for Geography and ability to captivate a room full of
teachers still wows me; Eileen Goff and Ange Mason for joining me to teach GIS to teachers

each summer; Dr. Stephen Moore, one of the most gentle and wonderful souls I know, and
someone with a fabulous smile; the tribal family that I found in SCGIS, who are truly my birds
of a feather, especially Susan Miller, a true goddess who I am lucky to know; Greg Carter for
sending me a box of ArcGIS 3.2 with a note saying “You should learn this stuff”; and everyone
else who has joined me along this wonderful journey, full of trials and tribulations, but so very
fulfilling and worth every minute.
I truly believe The Journey is the Reward. And I have been infinitely blessed with rewards.
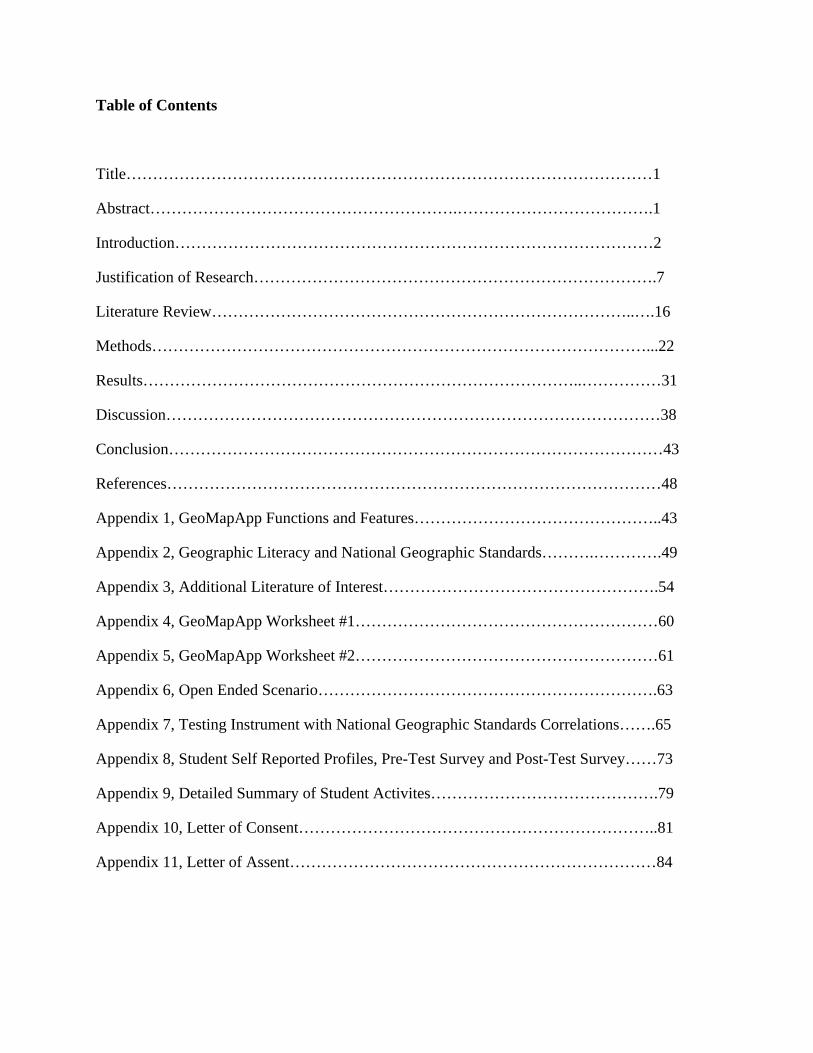
Table of Contents
Title………………………………………………………………………………………1
Abstract………………………………………………….……………………………….1
Introduction………………………………………………………………………………2
Justification of Research………………………………………………………………….7
Literature Review……………………………………………………………………..….16
Methods…………………………………………………………………………………...22
Results………………………………………………………………………..……………31
Discussion…………………………………………………………………………………38
Conclusion…………………………………………………………………………………43
References…………………………………………………………………………………48
Appendix 1, GeoMapApp Functions and Features………………………………………..43
Appendix 2, Geographic Literacy and National Geographic Standards……….………….49
Appendix 3, Additional Literature of Interest…………………………………………….54
Appendix 4, GeoMapApp Worksheet #1…………………………………………………60
Appendix 5, GeoMapApp Worksheet #2…………………………………………………61
Appendix 6, Open Ended Scenario……………………………………………………….63
Appendix 7, Testing Instrument with National Geographic Standards Correlations…….65
Appendix 8, Student Self Reported Profiles, Pre-Test Survey and Post-Test Survey……73
Appendix 9, Detailed Summary of Student Activites…………………………………….79
Appendix 10, Letter of Consent…………………………………………………………..81
Appendix 11, Letter of Assent……………………………………………………………84
LIST OF FIGURES
Figure Page Number
1. GIS Map representing migratory route of gray whales in North America, an example of a
static geovisualization. Created with ArcGIS 9.1……………………………………...3
2. Screen shot from GeoMapApp………………………………………………………..5
3. GIS created map showing distribution of 3 species of whales, Bowhead, Blue and
Northern Right whales…………………………………………………………………13
4. Map Layout showing map elements used in ArcGIS 9.1 sessions…………………….15
5. Screenshot from an ArcMap 9.1 session, showing the Basic Tool Bar……………….16
6. Poster collage of student created map layouts…………………………..…………….16
7. Pre and Post Assessment Questions 10-12…………………………………………...21
8. Box plot of pre and post assessment scores of all quantitative questions combined
………………………………………………………………………………………………...22
9. Box plot of pre and post assessment scores of all map interpretation questions
combined……………………………………………………………………………………....22
10. Box plot of pre and post assessment scores of all graph interpretation questions
combined……………………………………………………………………………………….22
11. Box plot of pre and post assessment scores of all spatial analysis questions
combined………………………………………………………………………………….……22
12. Male versus female scores for all quantitative pre assessment questions
combined……………………………………………………………………………………….23
13. Male versus female scores for all quantitative post assessment questions
combined………………………………………………………………………………….……23
14. Scored Responses For Qualitative Question Number 10, all
scores…………………………………………………………….…………………………….25
15. Scored Responses For Qualitative Question Number 10, female versus
male………………………………………………………………………………….………...25
16. Scored Responses For Qualitative Question Number 11, all
scores…………………………………………………………….……………………………26
LIST OF FIGURES, continued
Figure Page Number
17. Scored Responses For Qualitative Question Number 11, female versus
male……………………………………………………………………………….…………..26
18. Scored Responses For Qualitative Question Number 12, all
scores…………………………………………………………….………………………..…..27
19. Scored Responses For Qualitative Question Number 12, female versus
male………………………………………………………………………………...…………27
Appendix 1. GeoMapApp Functions and Features
A1.1 Screen shot of Menu Functions and Tool Buttons of GeoMapApp…………………44
A1.2 GeoMapApp screenshot showing Distance ProfileTool results……………………..45
A1.3 Screenshot of GeoMapApp project displaying imported data………………………46
A1.4 Screenshot displaying the functionality of the GeoMapApp DigitzerTool……………..
……………………………………………………………………………………………….47
A1.5 GeoMapApp session highlighting the grid functions………………………………..48
Appendix 3. Additional Literature of Interest
A3.1 The Numerology of Place Based Geography……………………………………..…58
Appendix 8. Student Self Reported Profiles, Pre-Test Survey and Post-Test Survey
A8.1. Computer Related Activities Outside of Class Time………………………………..76
A8.2. Frequency of Video Game Activity…………………………….…………………..77
A8.3. Duration of Video Game Activity……………………………..……………………77
A8.4. GPS Usage Rates……………………………………………………………………78
A8.5. Google Earth Usage…………………………………………………………………78

LIST OF TABLES
Table PageNumber
1. Table of Statistical Results of Pre and Post Assessment Score Analysis…………….23-24
2. Student comments on the use of GeoMapApp, ArcGIS Mapping Software and hand held GPS units………………………………………………………………………………...28
Appendix 2. Geographic Literacy and National Geographic Standards
A2.1. Using Multimedia Tools in curricula and pedagogical applications according to Bloom’s taxonomy stages………………………………………………………………………….51
A2.2. Using multimedia digital technologies and geovisualizations in education……….…51-53
1
Using Educational Tools and Integrative Experiences via Geovisualizations That
Incorporate Spatial Thinking, Real World Science and Ocean Literacy Standards in the
Classroom: A Case Study Examined
Abstract
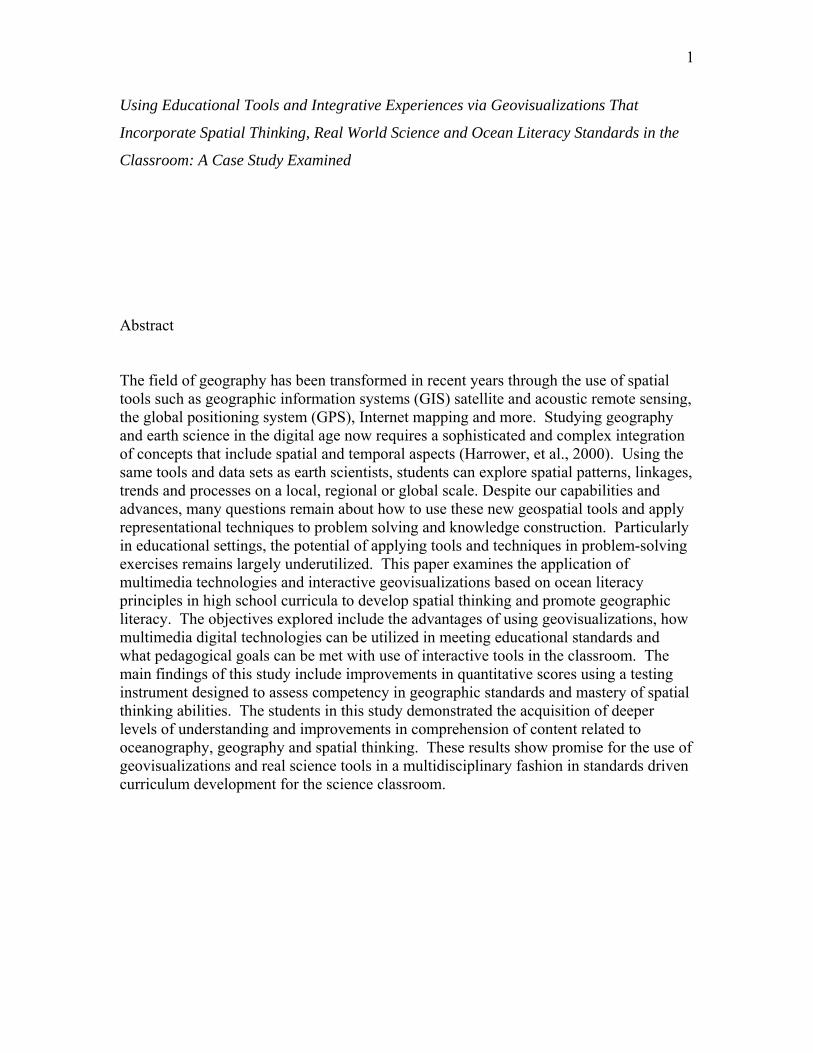
The field of geography has been transformed in recent years through the use of spatial tools such as geographic information systems (GIS) satellite and acoustic remote sensing, the global positioning system (GPS), Internet mapping and more. Studying geography and earth science in the digital age now requires a sophisticated and complex integration of concepts that include spatial and temporal aspects (Harrower, et al., 2000). Using the same tools and data sets as earth scientists, students can explore spatial patterns, linkages, trends and processes on a local, regional or global scale. Despite our capabilities and advances, many questions remain about how to use these new geospatial tools and apply representational techniques to problem solving and knowledge construction. Particularly in educational settings, the potential of applying tools and techniques in problem-solving exercises remains largely underutilized. This paper examines the application of multimedia technologies and interactive geovisualizations based on ocean literacy principles in high school curricula to develop spatial thinking and promote geographic literacy. The objectives explored include the advantages of using geovisualizations, how multimedia digital technologies can be utilized in meeting educational standards and what pedagogical goals can be met with use of interactive tools in the classroom. The main findings of this study include improvements in quantitative scores using a testing instrument designed to assess competency in geographic standards and mastery of spatial thinking abilities. The students in this study demonstrated the acquisition of deeper levels of understanding and improvements in comprehension of content related to oceanography, geography and spatial thinking. These results show promise for the use of geovisualizations and real science tools in a multidisciplinary fashion in standards driven curriculum development for the science classroom.
2
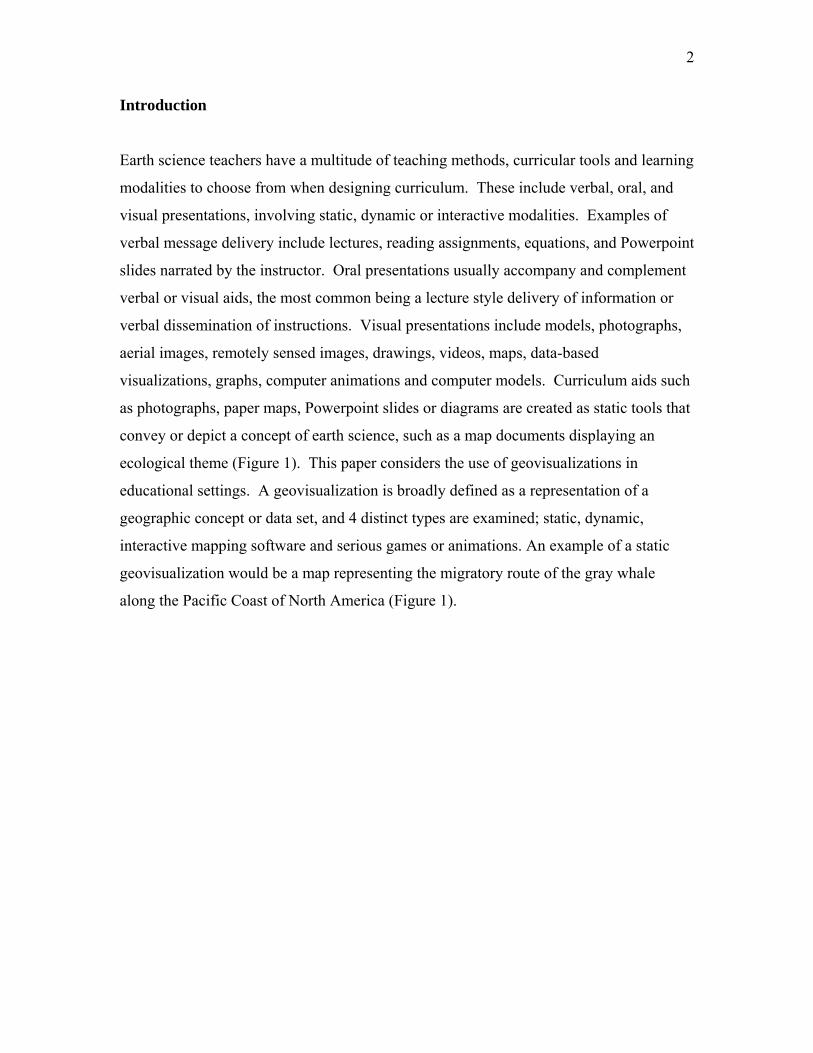
Introduction
Earth science teachers have a multitude of teaching methods, curricular tools and learning
modalities to choose from when designing curriculum. These include verbal, oral, and
visual presentations, involving static, dynamic or interactive modalities. Examples of
verbal message delivery include lectures, reading assignments, equations, and Powerpoint
slides narrated by the instructor. Oral presentations usually accompany and complement
verbal or visual aids, the most common being a lecture style delivery of information or
verbal dissemination of instructions. Visual presentations include models, photographs,
aerial images, remotely sensed images, drawings, videos, maps, data-based
visualizations, graphs, computer animations and computer models. Curriculum aids such
as photographs, paper maps, Powerpoint slides or diagrams are created as static tools that
convey or depict a concept of earth science, such as a map documents displaying an
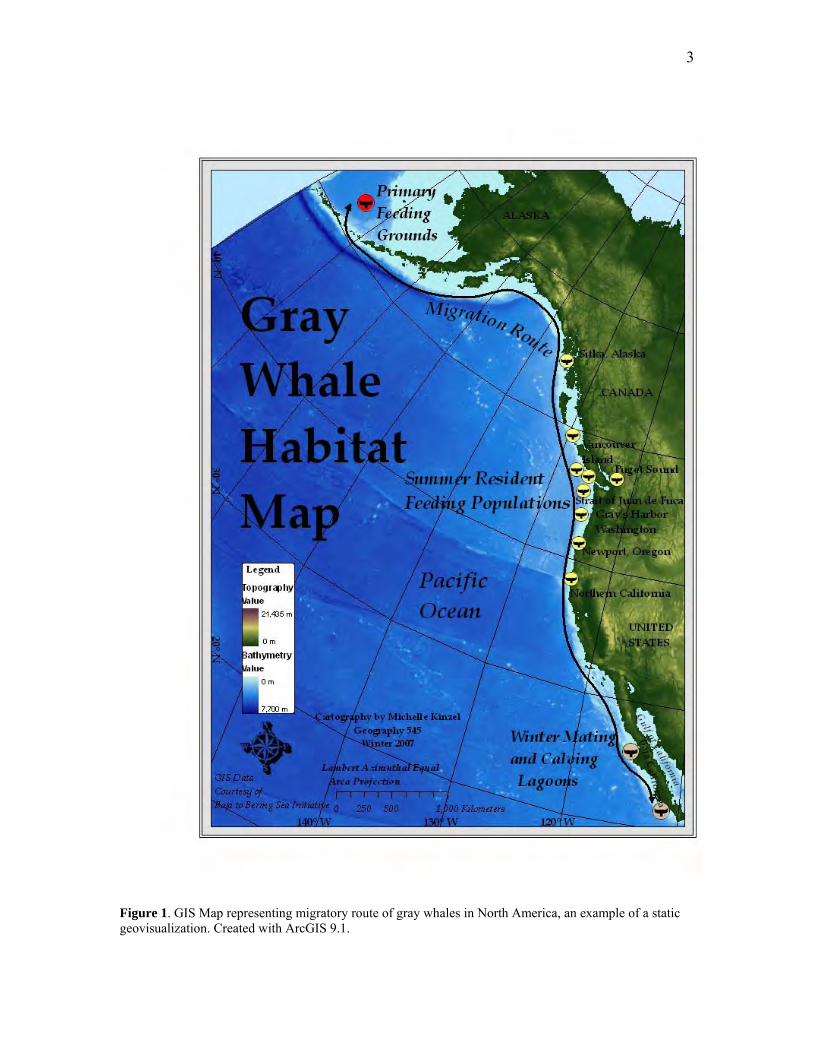
ecological theme (Figure 1). This paper considers the use of geovisualizations in
educational settings. A geovisualization is broadly defined as a representation of a
geographic concept or data set, and 4 distinct types are examined; static, dynamic,
interactive mapping software and serious games or animations. An example of a static
geovisualization would be a map representing the migratory route of the gray whale
along the Pacific Coast of North America (Figure 1).
3
Figure 1. GIS Map representing migratory route of gray whales in North America, an example of a static geovisualization. Created with ArcGIS 9.1.

4
The term geovisualization, known also now as geovisual analytics, is commonly
understood to represent a geographic visualization, and holds various definitions and
criterion in different academic circles (Buckley, et al, 2000; MacEachren and Kraak,
1997). MacEachren and Kraak describe “geographic visualizations” as products resulting
from linkages among cartography, GIS, and related visual information technologies. The
authors also describe geovisualization as both a research focus and a set of tools that hold
the promise to change and improve the very fundamental concepts of science and the
methods used to explore georeferenced data, the decisions made by society and the way
we learn about the world. And they certainly have. The use of mapping tools, internet
servers and multimedia has revolutionized the way we experience and explore our world.
For the purposes of this paper, geovisualizations are defined to be the tools and products
of geographically referenced datasets, including static maps and diagrams, animations,
outputs of mapping software and animated scenes of serious gaming environments.
Serious games are an emerging tool, a hybrid of education and fun, and include various
types of gaming technology that contain an educational component, namely the
integration of educational content into an online or electronic gaming environment
(Prensky, 2007). A serious game should be considered more of a simulation than a
computer game, with the distinction being that educationally oriented serious games are
about objects, concepts and systems and how they behave, while computer games are
about a fun experience for the user (Prensky, 2007). Ideally, the most appealing serious
games will be fun, but will also contain the pedagogical content necessary to merit use in
an educational curriculum.
Dynamic elements common in Earth science include movement with or without student
interaction, models that move, GIS maps, video clips, and some computer animations.
Typically, these types of tools utilize the highly engaging user interface programmed
with movement or dynamic data display to engage the learner in the concept. An example
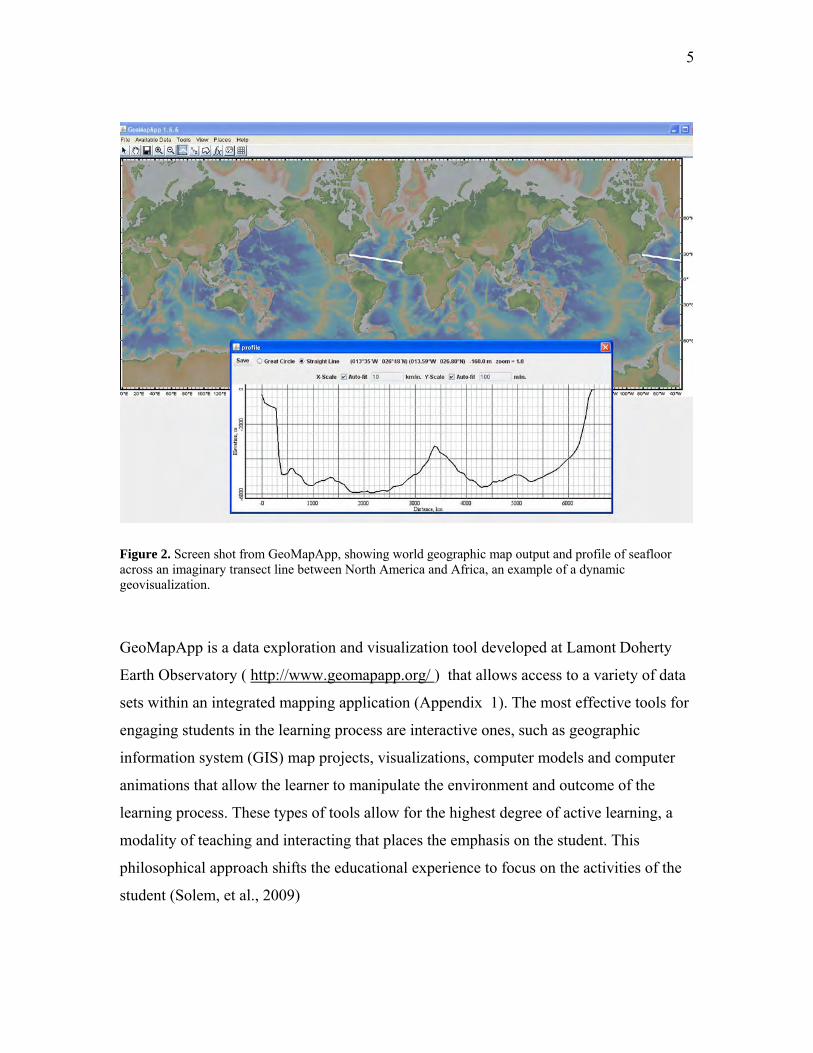
of a dynamic earth science tool is a depth profile created in GeoMapApp, which depicts
the bathymetry of the seafloor along a transect as chosen by the user in a graphical output
(Figure 2).
5
Figure 2. Screen shot from GeoMapApp, showing world geographic map output and profile of seafloor across an imaginary transect line between North America and Africa, an example of a dynamic geovisualization.
GeoMapApp is a data exploration and visualization tool developed at Lamont Doherty
Earth Observatory ( http://www.geomapapp.org/ ) that allows access to a variety of data
sets within an integrated mapping application (Appendix 1). The most effective tools for
engaging students in the learning process are interactive ones, such as geographic
information system (GIS) map projects, visualizations, computer models and computer
animations that allow the learner to manipulate the environment and outcome of the
learning process. These types of tools allow for the highest degree of active learning, a
modality of teaching and interacting that places the emphasis on the student. This
philosophical approach shifts the educational experience to focus on the activities of the
student (Solem, et al., 2009)
6
Active learning is based upon constructivism theory, which states that learning is a
process in which the learner actively constructs knowledge (Riggs and Kimbrough,
2002). The constructivist approach in science education is recognized as a valuable
approach for building deep student understanding of scientific content and inquiry (Riggs
and Kimbrough, 2002). This type of learning does not occur in lecture only
environments, as the students are merely passively listening and transcribing notes, at
best. The key to active learning is student participation. Many studies have shown that
active participants display superior learning and demonstrate higher levels of
comprehension and understanding (McConnell, et al., 2003). Asking students to apply
newly acquired knowledge in problem solving has been shown to improve student
retention, exam scores and scores on logical thinking assessment (McConnell, et al.,
2003). Activities involving active learning span the simple as well as more complex
tasks, ranging from multiple choice questions to project based exercises involving
multiple class periods (Silberman, 1996). Students using inquiry based learning or active
learning must form research questions, develop a methodology, gather and analyze data,
draw and report conclusions.
For Earth science teachers, the digital age offers a plethora of spatial tools and
techniques for implementing inquiry based activities and active learning into existing
curricula. Yet educators are reluctant to embrace the pedagogical shift required to acquire
and master the tools of higher technology (Kerski, 2000). Not all technology is
complicated or prohibitive and considering the adaptability and variety of pedagogical
tools, it becomes clear that the use of geovisualizations is an ideal way to address core
Earth science and geography concepts, meet standards based curriculum development
goals, incorporate technology standards and engage students in active learning that is
engaging and effective. In 2012, technological literacy is slated to become part of the
National Assessment of Educational Progress (NAEP) also referred to as the Nation’s
Report Card (eSchool News, 2008). Students will be required to demonstrate proficiency
with technology in 4th, 8th and 12th grades. The No Child Left Behind Act, passed into
law in 2002 includes technology goals, requiring students to be technologically literate by
the end of 8th grade (Learning Point Associates, 2007). It also includes geography as one

7
of nine key areas of instruction, yet Kimberly Crews, Executive Director for the National
Council on Geographic Education states that “With No Child Left Behind, it’s geography
that is being left behind” speaking to the fact that geography is the only key area of the
act not provided with funding (Chicago Tribune, December 2, 2007).
Justification for Research
Skill development is a primary component of any educational process. Recent trends in
educational standards have expanded, and are now acknowledging the importance of such
non traditional skill sets as geographic literacy, cognitive spatial thinking skills.
Proponents of these educational premises assert that in order to achieve a goal of spatial
literacy, a literate person will display three characteristics: knowledge of concepts,
command over ways of thinking and acting and the development of capabilities (National
Research Council, 2006). The National Research Council details three characteristics of
a spatially literate student as (1) having the habit of mind to think spatially, (2) practice
spatial thinking in an informed way, specifically having well-developed spatial
capabilities for using supporting tools and technologies and (3) ability to evaluate spatial
data based on the source and using this data to construct and articulate a line of reasoning
or point of view in problem solving.
Spatial thinking is not only beneficial to understanding our increasingly digitally
represented world through mediums such as Google Earth and Map Servers, but is a
useful skill set in a variety of disciplines. The fields of architecture, medicine, physics
and biology all rely to some degree on the development and application of concepts of
space, adeptness with the tools of representation and the process of reasoning (National
Research Council, 2006).
Additionally, there is a recognized need for increased understanding of the oceans, its
inhabitants and the effect of oceanic process for life on earth. In 1994, the National
Geographic Foundation established a set of standards for ocean literacy that link
oceanography with geography and include spatial thinking as a major element of its
8
foundation. The curriculum of choice for meeting most of these objectives is a
multidisciplinary fusion of ocean science, geography and social studies. The ultimate
message is that all life on Earth arises from, and is dependent upon, oceanic processes.
The main objective of the standards matrix is to encourage the development of ocean
literate citizens that will become Ocean Stewards in the 21st Century (Geography for
Life: National Geographic Standards, 1994).
The central premise of this research paper is that ocean science education should
incorporate the latest advances in science and technology with the tools and capabilities
of a geovisualization. There is a natural resonance between technological literacy and
spatial literacy, and the sharing of technological tools with curricular materials based on
spatiotemporal data sets represents an engaging and dynamic means of encouraging
concept comprehension and skill development.
The purpose of this case study is to use multimedia tools and real world scientific data
sets in the classroom and assess measurable changes in spatial thinking skills and
geographic literacy standards. It also seeks to evaluate effectiveness of geovisualizations
in an educational setting, changes in spatial thinking skills and level of geographic
literacy proficiency among students given the opportunity to explore multimedia tools
with guided discovery and open ended class time.
The four primary questions this study addresses are: 1) What advantages are there to using an interactive, immersive geovisualization in the design and implementation of curriculum at the high school level? 2) How can multimedia digital technologies best be utilized in aiding students to achieve the educational standards related to geography, science and technology? 3) What pedagogical issues in secondary school curriculum development can be addressed with the use of interactive, immersive geovisualizations? 4) How does the use of real world scientific data sets enhance educational practices?
9
Pedagogical Goals
Particularly in educational settings, the potential of applying tools and techniques in
problem solving exercises remains largely underutilized (Harrower, 2000). To date, much
of the research effort in geovisualization has been directed at an expert level, for
individuals who posses high level knowledge of the subject matter, such as the use of
ocean color by climatologists. Geovisualizations are also designed for those who work
routinely with large and cumbersome data sets, such as statisticians (Harrower, 2000).
Digital mapping tools such as Google Earth, GeoMapApp, AEJEE, ArcGIS and
ArcExplorer developed under the umbrella of geographic information systems have the
potential to revolutionize the traditional Earth Science or Geography curriculum. The
potential for harvesting these powerful tools to explore scientific data sets has yet to be
tapped. With the increasingly ubiquitous availability of the internet, the time has come
for educators to incorporate internet mapping into a variety of subjects, courses and
teaching practices. The issues are not centered on limited choices in technological tools,
but instead lack of accessibility due to funding or infrastructure and lack of time to
implement what is available (Kerski, 2000). Most educators, even those highly motivated
to explore new modalities and incorporate the latest technologies struggle under
standards based requirements, a schedule deficient in time, and inadequate funding to
acquire and maintain cutting edge technologies.
With today’s technologically savvy youth, the use of geovisualization offers the potential
of creating experiences at a more introductory and educational level, for use in high
school curricula. The educational objectives of introducing spatial concepts, promoting
spatial learning and achieving geographic literacy among students can be supported by
using mapping software, such as GIS applications, incorporating static images and
dynamic tools of geovisualizations and integrating serious games into learning units
across a multitude of core content subject areas and in diverse learning environments.
The most useful and effective means of implementing spatial tools and technologies into
a curriculum involve multi task and multi disciplinary activities, that extend beyond a

10
narrow range of subject matter (Cooper, et. al.. 2002; Kerski, 2000; McConnel, et.al.,
2003; White and Sims, 1993).
The rapid proliferation of computer technology has improved the options available for
many educators of Earth Science and Geography. There are a multitude of visual aids,
technologies, software packages and tools that can be integrated into traditional
educational practices. The lag time and weak link in the chain is that educators must
familiarize themselves with new computer software packages, learn new technological
skill sets and rework existing lesson plans to incorporate the new capabilities and spatial
products (Bishop and Shroder, 1995).
In a rush to accountability of the No Child Left Behind era and a political climate in
public education arenas that often emphasize preparing for standardized testing, teacher
evaluations and report cards for schools and districts are used as determinants to levels of
funding, social studies at the elementary level are being left behind (Alvarez, 2008). This
neglect of basic content areas such as geography and earth science will only magnify
throughout the school system. Without solid foundations to build upon, the achievement
of geographic literacy becomes increasingly difficult as students progress through the
school system. One fundamental feature of geographic literacy is the concept of spatial
thinking (National Geography Standards, 1994). Spatial thinking can be considered a
‘habit of mind’ related to the concepts of space, geospatial tools that represent process
and concept, and reasoning processes (National Research Council, 2006).
The concept of spatial thinking is not exclusive to the social sciences, nor is the pedagogy
a task solely for geography educators, rather it is important to integrate spatial thinking
across the curriculum (Alvarez, 2008). Educators are often overburdened and
constrained for time. By integrating activities that foster spatial literacy into a variety of
subject areas, such as science and mathematics, educators can teach across the
disciplines, and incorporate social studies into existing curricula.
11
Out of necessity, all too frequently, the main goals for today’s classroom sessions are to
teach to standards based learning objectives in preparation for standardized testing. The
current educational administration in the United States is focused on meeting national and
state objectives, which are disproportionately heralded as markers of success within
school systems. In order for change to occur, in particular a change that would embrace
the digital revolution and encourage or even allow educators to embrace new tools or
techniques in their curricula, there must be a means of assessing competencies and
mastery of learning objectives related to digital technologies. The standards vary widely
among subject areas, grade levels, states, counties and even school districts, but all
educational systems are looking towards the effectiveness of tools in meeting standards
and teaching the technological skills necessary for students to be successful in the global
workforce (eSchool News, 2008). As suggested in Table A1.2 (Appendix 1),
geovisualizations can be used to address these complex needs, including standards related
to geography. Further consideration of relevant and topical literature on the use of
geovisualizations is presented in Appendix 3 of this paper.
Static geovisualizations are the most diverse in terms of applications to standards. Some
geographic standards, such as the use of mental maps (Standard #2) only lend themselves
to a static geovisualizations such as a drawn map representation (Appendix 2). And some
standards are suitable for the use of static geovisualizations such as maps and diagrams,
as exemplified by the Standard #6 which emphasizes culture and experience (Appendix
2). Currently, dynamic geovisualizations such as animations are useful mainly for
demonstration and skill development. Due to the largely unchangeable nature of a video
clip or animation, these tools are not applicable as stand alone instruments of assessment.
Mapping software tools such as GeoMapApp or ArcGIS provide the greatest degree of
usage in both terms of skill development and assessment. The dynamic nature of mapping
software combined with the ability of the instructor to create assessment activities for
building and displaying mapping layers make this geovisualization ideal for integration
into most curricular plans and objectives. Yet the educational community and those who
govern it need research on the effectiveness of these tools, and a cadre of easily
accessible and easily implemented tools and resources (Kerski, 2000). Practical
12
applications and testing modules that could be integrated into educational curricula facing
pressures of funding issues and time constraints may increase the use of geovisualizations
across a broad spectrum of disciplines, grade levels and educational settings. Serious
games, while alluring and certainly high on the engagement scale, hold the most promise
as skill development tools. Assessment is not prohibited, yet is not as easily
accomplished as with the other types of geovisualizations.
Methods and Procedures School Setting
The setting for this study was two Horticulture classes at a local public high school,
Corvallis High School in Corvallis, Oregon. These courses consisted of students in
grades nine through twelve, in a course designed to be a science elective, and generally
comprised of lower than average academic performing students. These particular
students were not chosen at random, but were the ideal choice for a pilot study to
examine changes in spatial thinking and assessment of geographic literacy standards.
The main reasons for conducting the pilot study at this particular school were the
flexibility and interest of the science teacher, the structure of the daily class time blocks
(90 minutes in duration), the ongoing field work that included a mapping component in
existence at the time of the initiation of the study, and the class subject outside the main
focus of the GeoMapApp computer sessions and assessment questions, bathymetry and
seafloor mapping. The focus of this study is the use of geovisualizations, mapping
technologies, and scientific data sets in education, and not necessarily one of applications
of the scientific principles. The topic of the assessments and GeoMapApp computer
sessions was seafloor bathymetry, and for the reasons described above, it was not deemed
necessary to assess a group of students studying Geography, Oceanography or Marine
Science. In fact, students a class outside of these areas was suited to the assessment, as
the terminology and scientific principles would be novel to the student subjects, and a
more accurate assessment of changes or improvements on the testing instrument would
reflect effects of the classroom time using GeoMapApp.
13
Data Sets
Not all data sets are created equal in relation to uses in a geovisualization. The best fit for
GIS tools is with data that is less tangible and more difficult to observe directly, such as
cultural patterns, bathymetry or ground water contamination (Solem, et al., 2009). Data
sets with complex patterns or connections often work well with geovisualizations. GIS
education focuses on spatial concepts and theoretical considerations for the representation
of spatial data (Carlson, 2007). Scientific data with temporal and spatial components are
ideally suited to a geovisualization, such as displaying the movement of a tsunami across
an ocean basin and into low lying coastal areas. While animations capture time series
data in an easy to follow and organized fashion, changes over time can also be
represented with interactive mapping tools (Andrienko and Andrienko, 1999). Data sets
that have spatial coincidence, for example the location of satellite tagged whales and the
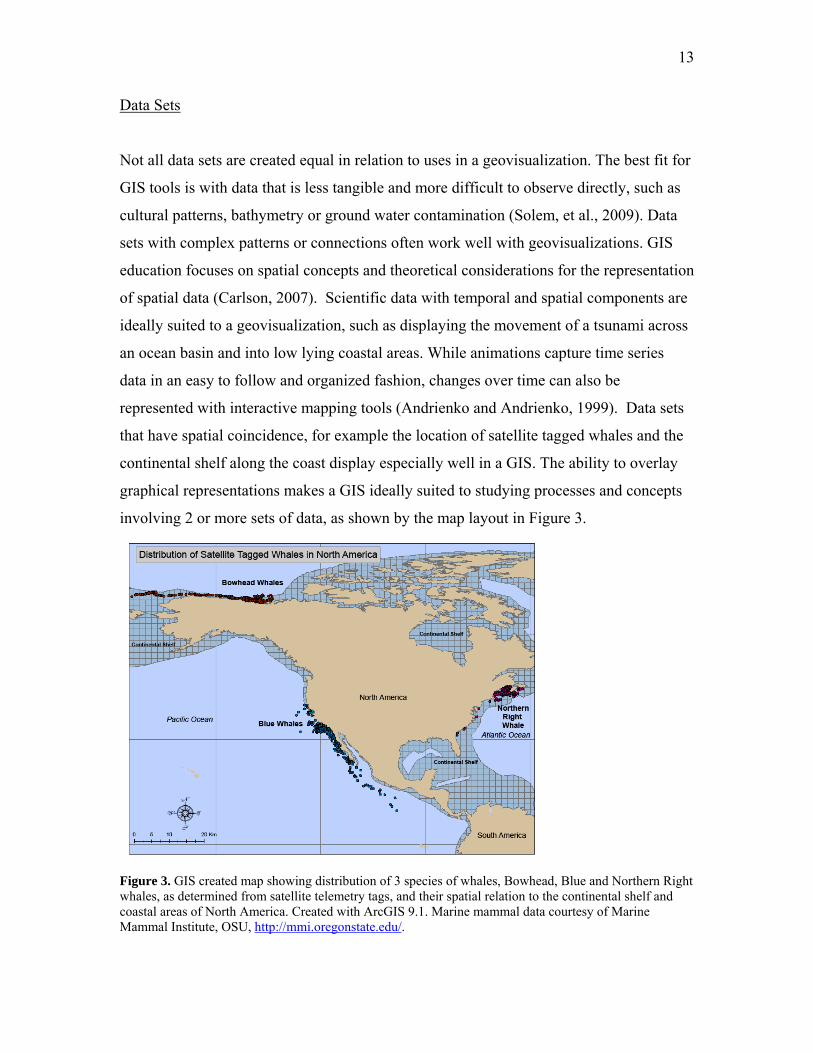
continental shelf along the coast display especially well in a GIS. The ability to overlay
graphical representations makes a GIS ideally suited to studying processes and concepts
involving 2 or more sets of data, as shown by the map layout in Figure 3.
Figure 3. GIS created map showing distribution of 3 species of whales, Bowhead, Blue and Northern Right whales, as determined from satellite telemetry tags, and their spatial relation to the continental shelf and coastal areas of North America. Created with ArcGIS 9.1. Marine mammal data courtesy of Marine Mammal Institute, OSU, http://mmi.oregonstate.edu/.

14
Geovisualization Tools Used
In this study, participants worked with software packages and hand held GPS units to
explore geospatial concepts. Two software packages were used, GeoMapApp and
ArcGIS 9.1. Both software platforms are categorized as GIS, or Geographic Information
Systems. A GIS is an integrated collection of both computer software and datasets used
to view and manage information about geographic locations. A GIS is also capable of
performing spatial analysis, modeling spatial processes, and providing a virtual
framework for gathering and organizing spatial data and related information for display
and analysis (ESRI Website, www.esri.com last accessed November 30, 2008).
ArcGIS is an integrated collection of GIS software products, and provides an industry
standard based platform for spatial analysis, data management and mapping. ArcGIS is
founded upon key interoperability and Web computing concepts. Environmental System
Research Institute, ESRI, is the commercial producer of ArcGIS, aligns to the
specifications and standards of the Open Geospatial Consortium, Inc. (OGC), as well as
those related to ISO, W3C, ANSI, and CEN. ArcGIS, in comparison to GeoMapApp,
represents a more advanced, industrial strength technological platform. The minimum
system requirements for the most basic of ArcGIS product call for 1 GB of RAM, a 1.6
GHz Processor and a PC-Intel platform running Windows Vista, Windows 2000 or
Windows XP. The capabilities of this software are much more extensive and robust than
GeoMapApp, and include mapping, advanced cartography, data support and
interoperability, data editing, raster editing and vectorization, geoprocessing, modeling.
In addition, there are hundreds of extensions and tools that work in conjunction with
ArcGIS software to enhance the geospatial needs of numerous sectors of industry and
academia. ArcGIS, in comparison to GeoMapApp, represents a more advanced,
industrial strength technological platform.
15
Student Activities
A total of six 90 minute classroom sessions were dedicated to the introduction of GIS and
GPS technology, field data collection and computer mapping. This included, two
sessions dedicated to learning basic geospatial concepts and GPS unit functionality, as
well as collecting data at a local watershed, Dixon Creek, one session using the ArcGIS
software, and three sessions using the GeoMapApp software.
The ArcGIS 9.1 sessions were conducted off the main high school campus, in the Digital
Earth Classroom at Oregon State University. For ease of facilitation and due to time
constraints, much of the data preparation was performed by an experienced GIS user.
The teaching portion of the activity focused on the following functions: basic navigation,
adding georeferenced data collected from a hand held Garmin eTrex GPS Unit, creating a
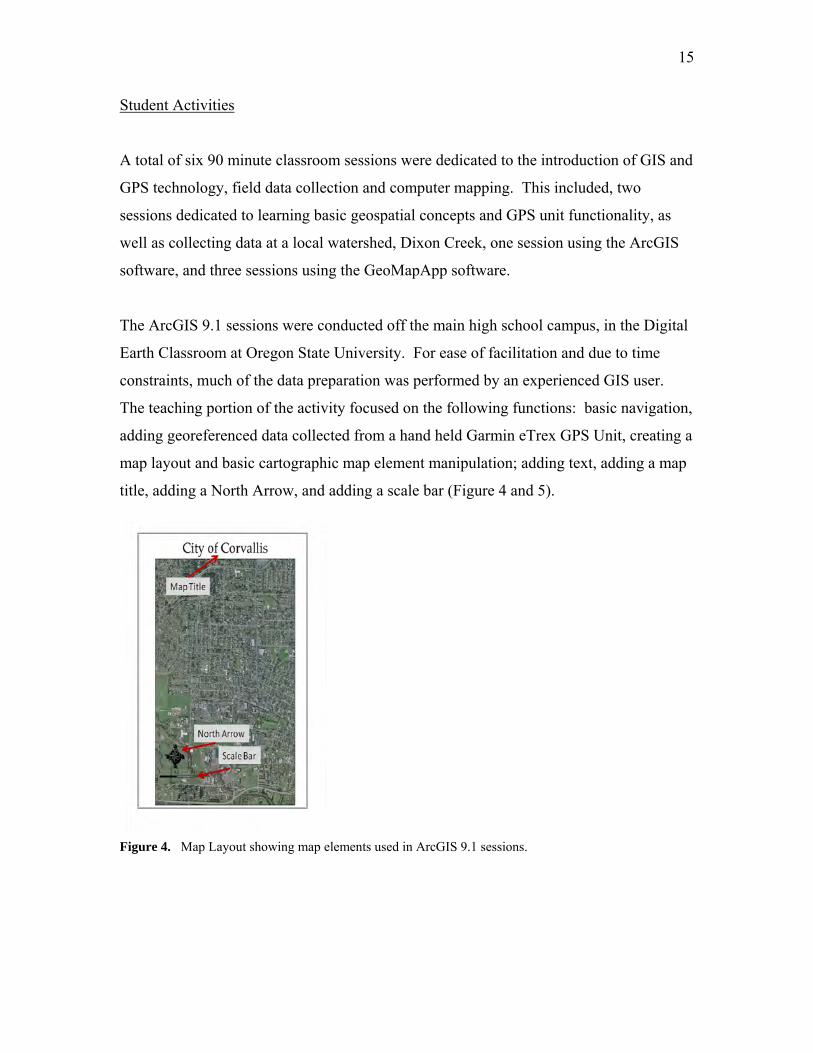
map layout and basic cartographic map element manipulation; adding text, adding a map
title, adding a North Arrow, and adding a scale bar (Figure 4 and 5).
Figure 4. Map Layout showing map elements used in ArcGIS 9.1 sessions.
16
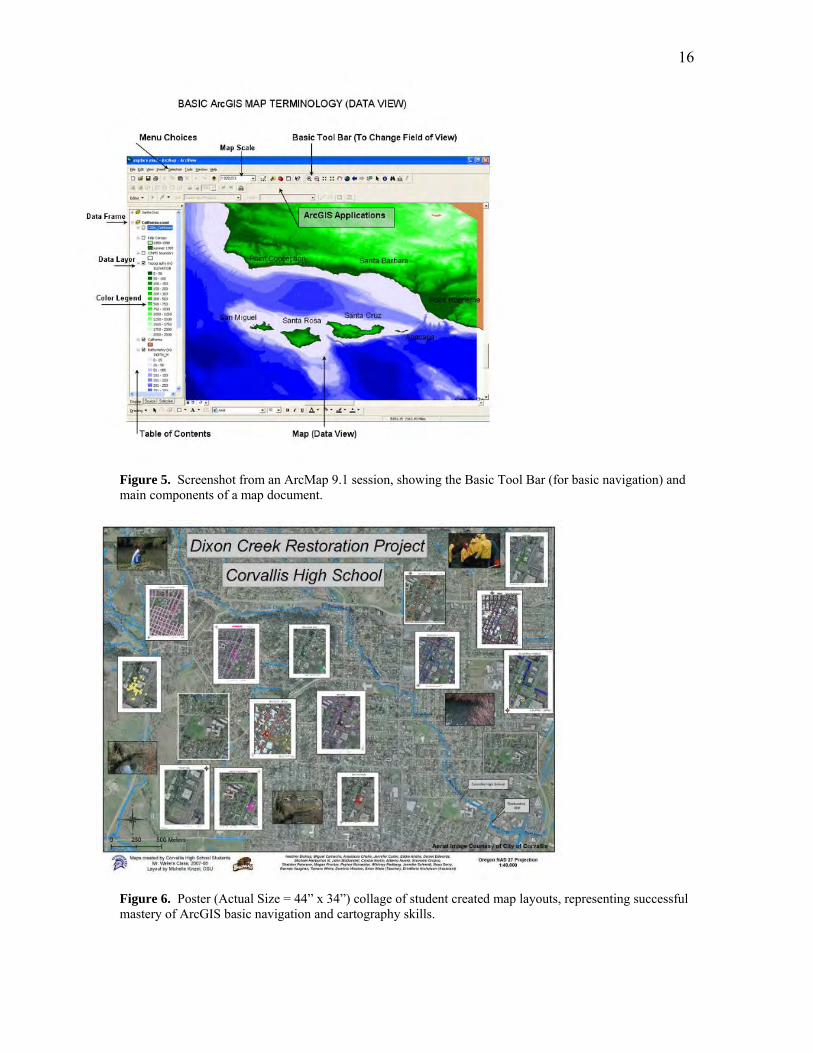
Figure 5. Screenshot from an ArcMap 9.1 session, showing the Basic Tool Bar (for basic navigation) and main components of a map document.
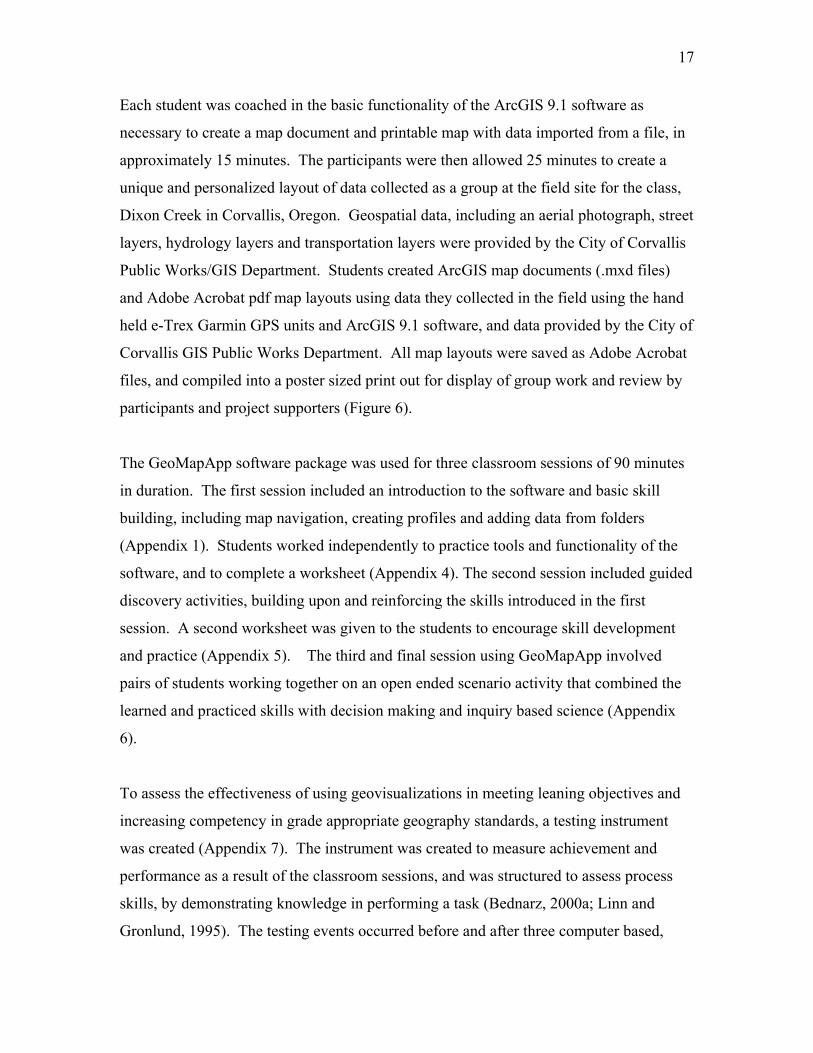
Figure 6. Poster (Actual Size = 44” x 34”) collage of student created map layouts, representing successful mastery of ArcGIS basic navigation and cartography skills.
17
Each student was coached in the basic functionality of the ArcGIS 9.1 software as
necessary to create a map document and printable map with data imported from a file, in
approximately 15 minutes. The participants were then allowed 25 minutes to create a
unique and personalized layout of data collected as a group at the field site for the class,
Dixon Creek in Corvallis, Oregon. Geospatial data, including an aerial photograph, street
layers, hydrology layers and transportation layers were provided by the City of Corvallis
Public Works/GIS Department. Students created ArcGIS map documents (.mxd files)
and Adobe Acrobat pdf map layouts using data they collected in the field using the hand
held e-Trex Garmin GPS units and ArcGIS 9.1 software, and data provided by the City of
Corvallis GIS Public Works Department. All map layouts were saved as Adobe Acrobat
files, and compiled into a poster sized print out for display of group work and review by
participants and project supporters (Figure 6).
The GeoMapApp software package was used for three classroom sessions of 90 minutes
in duration. The first session included an introduction to the software and basic skill
building, including map navigation, creating profiles and adding data from folders
(Appendix 1). Students worked independently to practice tools and functionality of the
software, and to complete a worksheet (Appendix 4). The second session included guided
discovery activities, building upon and reinforcing the skills introduced in the first
session. A second worksheet was given to the students to encourage skill development
and practice (Appendix 5). The third and final session using GeoMapApp involved
pairs of students working together on an open ended scenario activity that combined the
learned and practiced skills with decision making and inquiry based science (Appendix
6).
To assess the effectiveness of using geovisualizations in meeting leaning objectives and
increasing competency in grade appropriate geography standards, a testing instrument
was created (Appendix 7). The instrument was created to measure achievement and
performance as a result of the classroom sessions, and was structured to assess process
skills, by demonstrating knowledge in performing a task (Bednarz, 2000a; Linn and
Gronlund, 1995). The testing events occurred before and after three computer based,
18
hands-on inquiry lessons using the computer software GeoMapApp. Students explored
geographic data sets, oceanographic data sets and biological data on whale movements
during guided instruction that initially emphasized technological proficiency with the
multimedia tool GeoMapApp and progressed to an open ended scenario based activity
that required the students to work in pairs on an inquiry based lesson evaluating the most
suitable locations for Marine Protected Areas along the Pacific coast of North America
(Appendix 6). Open ended time was scheduled into the sessions to allow for reflections,
discussion and collaborative problem solving using the tools and concepts learned.
Research suggests that when students have time for reflections and discussion of a topic,
they perform better and retain more knowledge (McKeachie, 1994). A detailed summary
of student activities by day and topic is presented in Appendix 9.
Assessments Students were given a pre and post assessment test immediately before and after the
three, 90 minute computer activities using GeoMapApp. The pre assessments had
questionnaires assessing the students to report and rate their experiences and interest
levels with geospatial tools and computer technologies, including computer mapping,
GPS Units, Google Earth, video games and cell phones. The post assessments were also
preface with a questionnaire, asking students to report on their interest level in the cadre
of activities they participated in, including geocaching, using GPS in field work at Dixon
Creek, making maps with ArcGIS 9.1 software and using GeoMapApp software to
explore bathymetric data. Students were given open ended questions to self report what
they learned the most and least from (which activity). Permission to use the testing
instrument and collect data from the students was granted by the Oregon State University
Institutional Review Board in May 2008 and letters of consent and assent were completed
by all students and their parents or guardians (Appendix 10; Appendix 11).
The assessments were paper and pencil activities, with map graphics, bathymetry profile
graphics, Google Earth images and figures representing bathymetric features. The pre
assessment consisted of 28 questions covering spatial analysis, map interpretation, graph
interpretation and mathematical skills (Appendix 7). Students were not allowed access to
19
any resources during the assessment, and given a time limit of 45 minutes to complete all
the questions. The order of the questions was designed to begin with relatively simple
questions, proceeding to more difficult questions, and randomly presenting map
interpretation, graphic interpretation and spatial analysis questions.
The analyses of the quantitative portions of the assessments were performed to test the
following hypotheses:
1. There is no difference in the pre assessment and post assessment scores on
questions relating to map interpretation.
2. There is no difference in the pre assessment and post assessment scores on
questions relating to graph interpretation.
3. There is no difference in the pre assessment and post assessment scores on all
quantitative questions combined.
The quantitative portions of the assessments were scored and all data was analyzed using
paired t-tests with the statistical software package S-Plus 8.
The analysis of the qualitative portions of the assessments were evaluated in terms of the
hypothesis that the students would improve their demonstration of standards based
responses in alignment with spatial thinking, National Geography Standards appropriate
for grades 9-12, and National Educational Technology Standards for Students. It was
expected that students would increase their use of terms characteristic of one or more
modes of spatial thinking as described by Gersmehl and Gersmehl, 2007. It was expected
that evidence of standards mastery as well as proficiency in spatial thinking would
increase from pre to post assessment events. To examine these ideas, Questions 10-12 of
the assessment (Figure 7) were evaluated and scored for responses in the following
categories:
Spatial Thinking Modes
1) Hierarchy; nested areas of different sizes
2) Proximity; Location is close to…
20
3) Pattern; Non random arrangement of geographic features
Geographic Description
4) Absolute Location – Latitude/Longitude values
5) Relative Location – Map Position; 2 inches left of Baja California Coast
6) Relative Location – General Scaling; ½ way from top of map
7) Geographic Features; coast, shoreline, land, water, seamount, mountain, etc.
8) Absolute Location - Geographic Names Other
9) Map Color
10) I Don’t Know/Blank
11) Inference; blue whale habitat or reserve
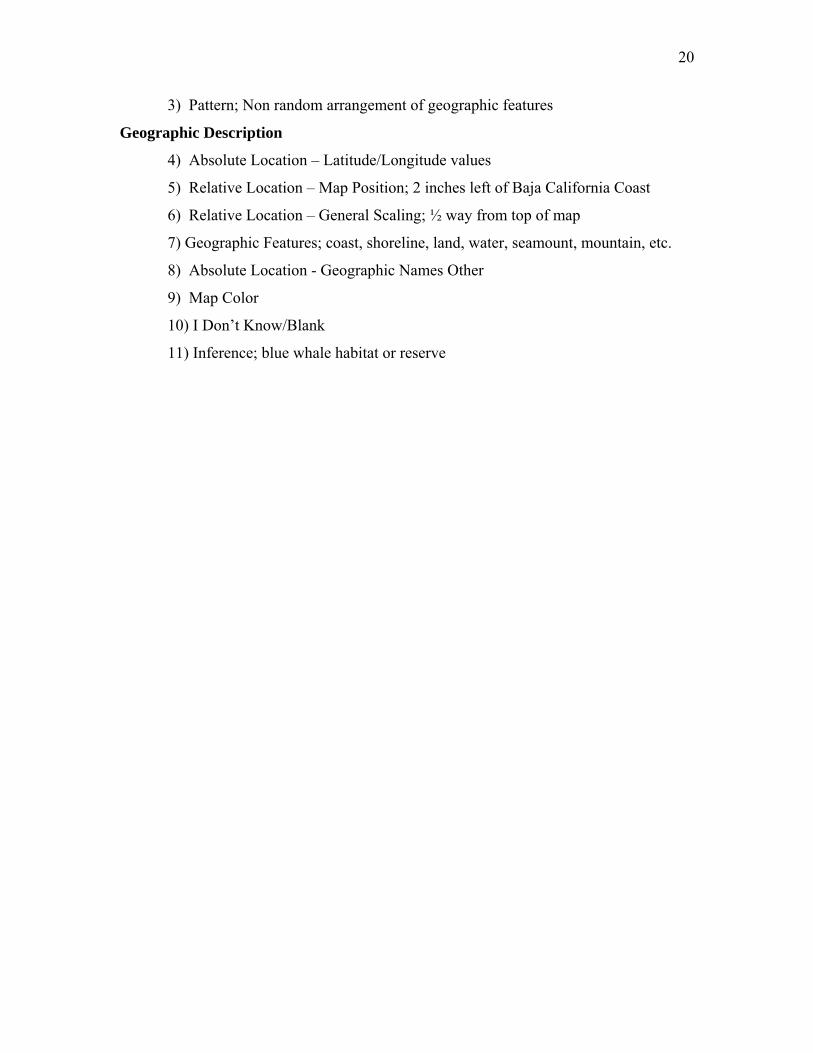
21
Figure 7. Pre and Post Assessment Questions 10-12. Open ended, map interpretation questions used to assess changes in spatial thinking modes and alignment with National Geographic and Technological Standards.
C
Use this image to answer parts A, B and C below. Question 10. A) Describe the location outlined in box A. List as many features and geographical descriptions as you can. Question 11. B) Describe the location outlined in box B. List as many features and geographical descriptions as you can. Question 12. C) Describe the location represented by the letter C.
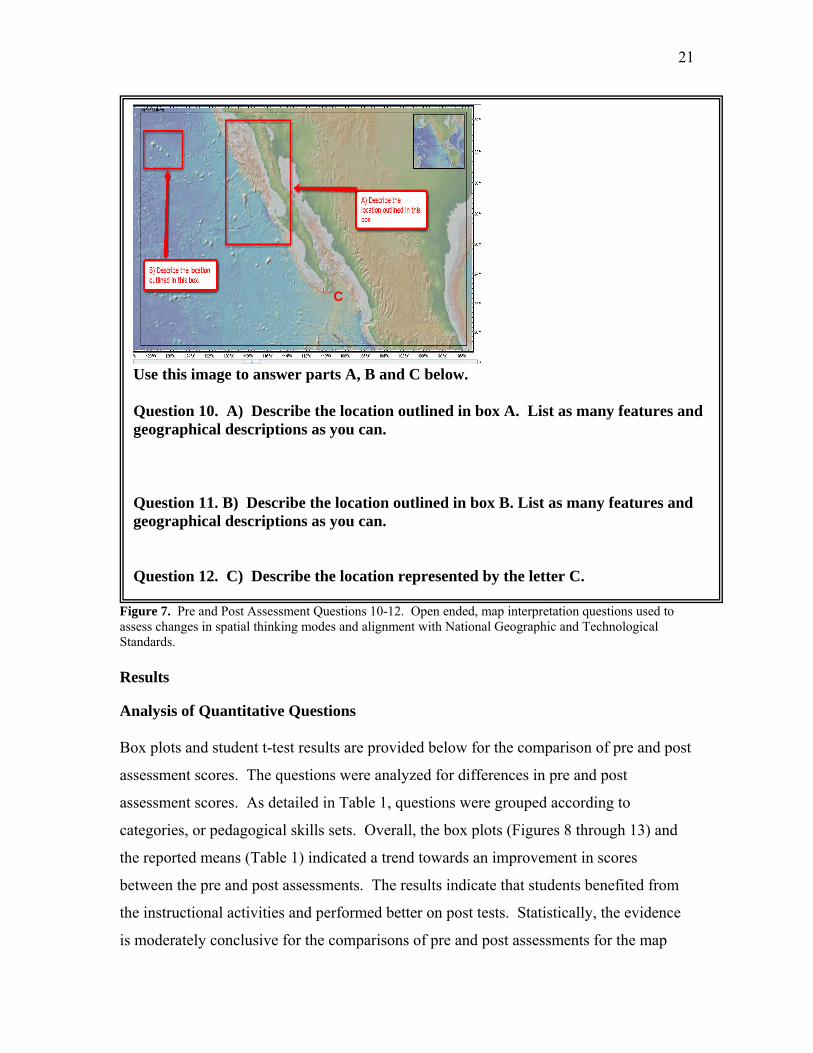
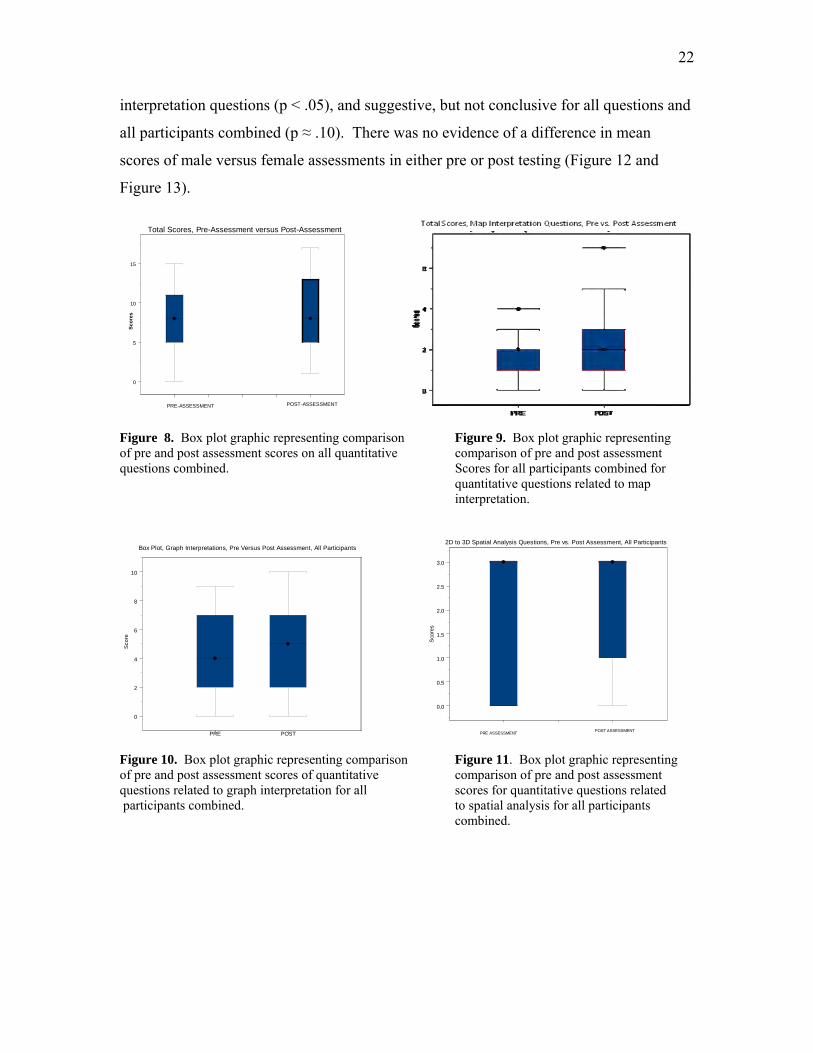
Results Analysis of Quantitative Questions Box plots and student t-test results are provided below for the comparison of pre and post
assessment scores. The questions were analyzed for differences in pre and post
assessment scores. As detailed in Table 1, questions were grouped according to
categories, or pedagogical skills sets. Overall, the box plots (Figures 8 through 13) and
the reported means (Table 1) indicated a trend towards an improvement in scores
between the pre and post assessments. The results indicate that students benefited from
the instructional activities and performed better on post tests. Statistically, the evidence
is moderately conclusive for the comparisons of pre and post assessments for the map
22
interpretation questions (p < .05), and suggestive, but not conclusive for all questions and
all participants combined (p ≈ .10). There was no evidence of a difference in mean
scores of male versus female assessments in either pre or post testing (Figure 12 and
Figure 13).
0
5
10
15
Total Scores, Pre-Assessment versus Post-Assessment
Scor
es
PRE-ASSESSMENT POST-ASSESSMENT Figure 8. Box plot graphic representing comparison Figure 9. Box plot graphic representing of pre and post assessment scores on all quantitative comparison of pre and post assessment questions combined. Scores for all participants combined for quantitative questions related to map interpretation.
0.0
0.5
1.0
1.5
2.0
2.5
3.0
Sco
res
POST ASSESSMENT
2D to 3D Spatial Analysis Questions, Pre vs. Post Assessment, All Participants
PRE ASSESSMENTPRE POST
0
2
4
6
8
10
Sc
ore
Box Plot, Graph Interpretations, Pre Versus Post Assessment, All Participants
Figure 10. Box plot graphic representing comparison Figure 11. Box plot graphic representing of pre and post assessment scores of quantitative comparison of pre and post assessment questions related to graph interpretation for all scores for quantitative questions related participants combined. to spatial analysis for all participants combined.

23
Male Female
0.0
2.5
5.0
7.5
10.0
12.5
15.0Sc
ores
Total Scores, Pre Assessments, Males vs. Females
Male Female
0
5
10
15
Sco
res
Total Scores, Post Assessment, Males vs. Females
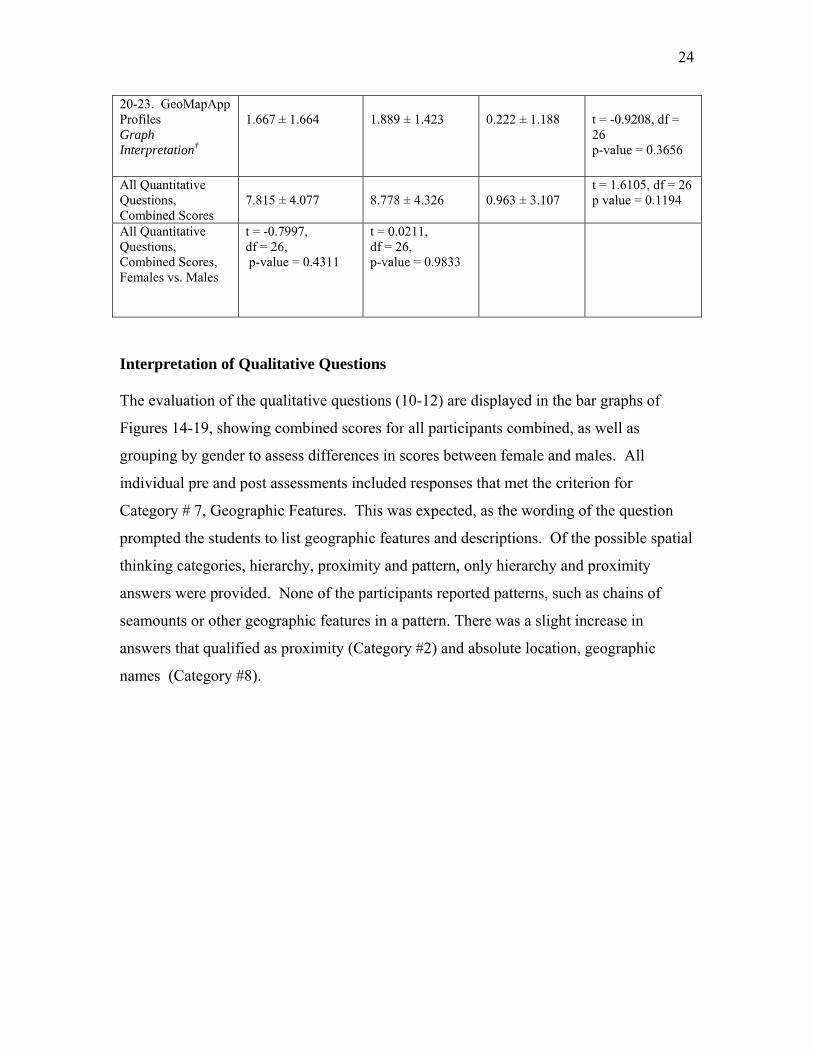
Figure 12. Box plot graphic representing Figure 13. Box plot graphic representing comparison of pre assessment scores of males comparison of post assessment scores of and females for all quantitative questions combined. males and females for all quantitative questions combined. Table 1. Table of Statistical Results of Pre and Post Assessment Score Analysis. Means ± 1 SD are reported for Pre Assessment, Post Assessment and Change in Mean Scores. P‐vales are reported based on Student t‐test analysis as determined using S‐Plus Statistical Package. *Questions 2 and 13‐15 were combined and analyzed under the category of Map Interpretation Skills. † Questions 3‐9 and 20‐23 were combined and analyzed statistically under the category of Graph Interpretation Skills. Question Number Pedagogical Skill
Set
PRE ASSESSMENT
POST ASSESSMENT
Change in Mean Scores
Student t-test paired means
2. Estimate Slope Across Contour Lines of Seafloor Math and Map Interpretation*
0.296 ± 0.465
0.444 ± 0.934
0.222 ± 1.086
t = -2.209, df = 26 p-value = 0.0362
3-9. Profile Across Atlantic Ocean Graph Interpretation†
2.481 ± 1.55
2.593 ± 1.67
0.444 ± 0.641
t = -0.9208, df = 26 p-value = 0.3656
13-15. Seafloor Bathymetry Visual Graphic Map Interpretation*
1.480 ± 0.802
1.926 ± 0.829
0.444 ± 0.641
t = -2.209, df = 26 p-value = 0.0362
16-18. 2D 3D Object Representation, Spatial Thinking
2.000 ± 1.359
2.111 ± 1.22
0.111 ± 1.396
t = -0.4136, df = 26 p-value = 0.6826
24
20-23. GeoMapApp Profiles Graph Interpretation†
1.667 ± 1.664
1.889 ± 1.423
0.222 ± 1.188
t = -0.9208, df = 26 p-value = 0.3656
All Quantitative Questions, Combined Scores
7.815 ± 4.077
8.778 ± 4.326
0.963 ± 3.107
t = 1.6105, df = 26 p value = 0.1194
All Quantitative Questions, Combined Scores, Females vs. Males
t = -0.7997, df = 26, p-value = 0.4311
t = 0.0211, df = 26, p-value = 0.9833
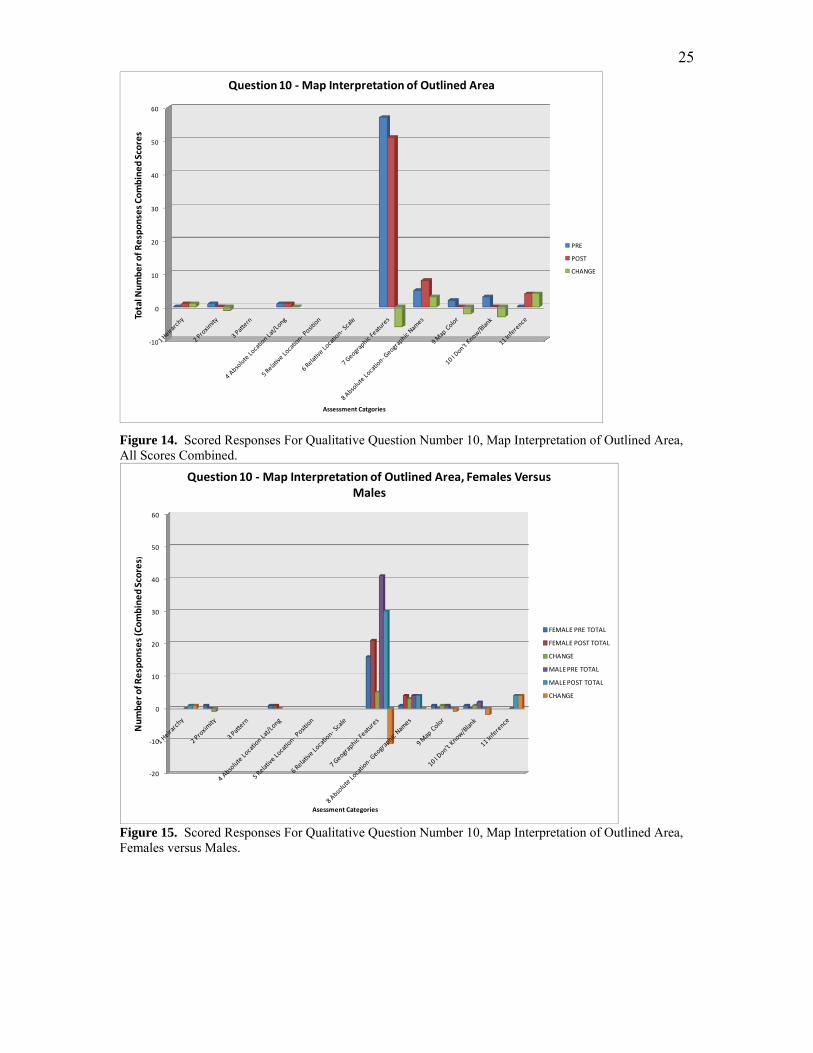
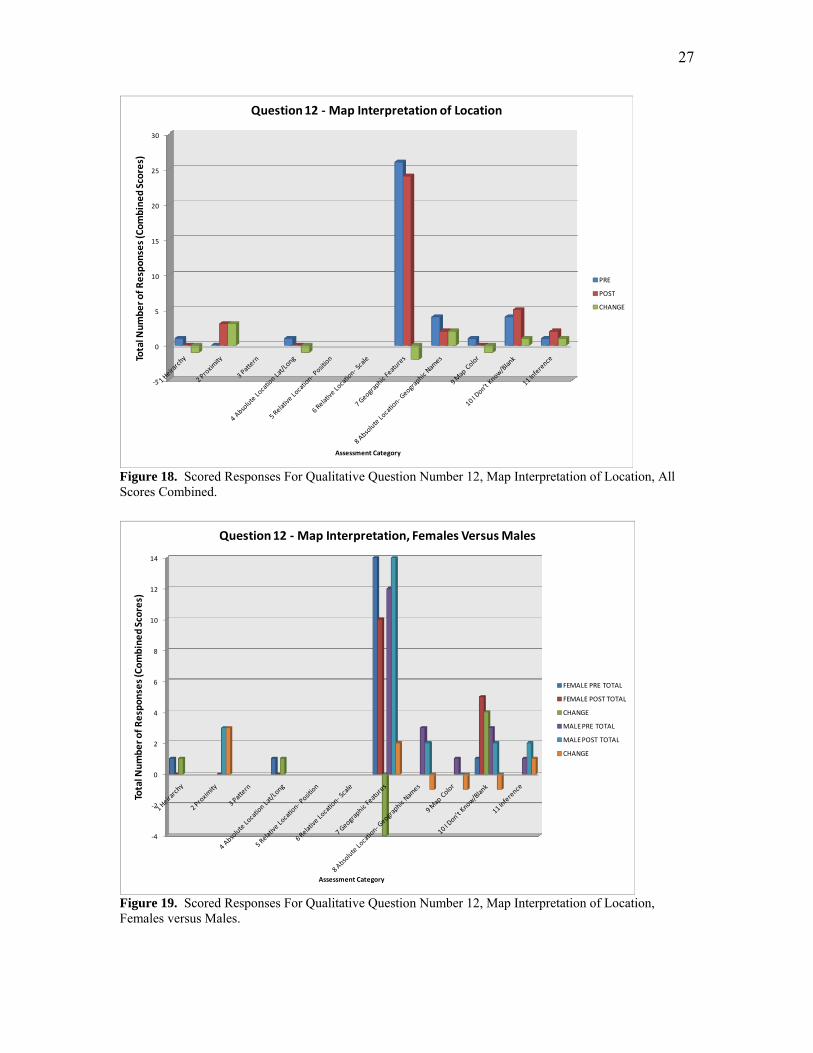
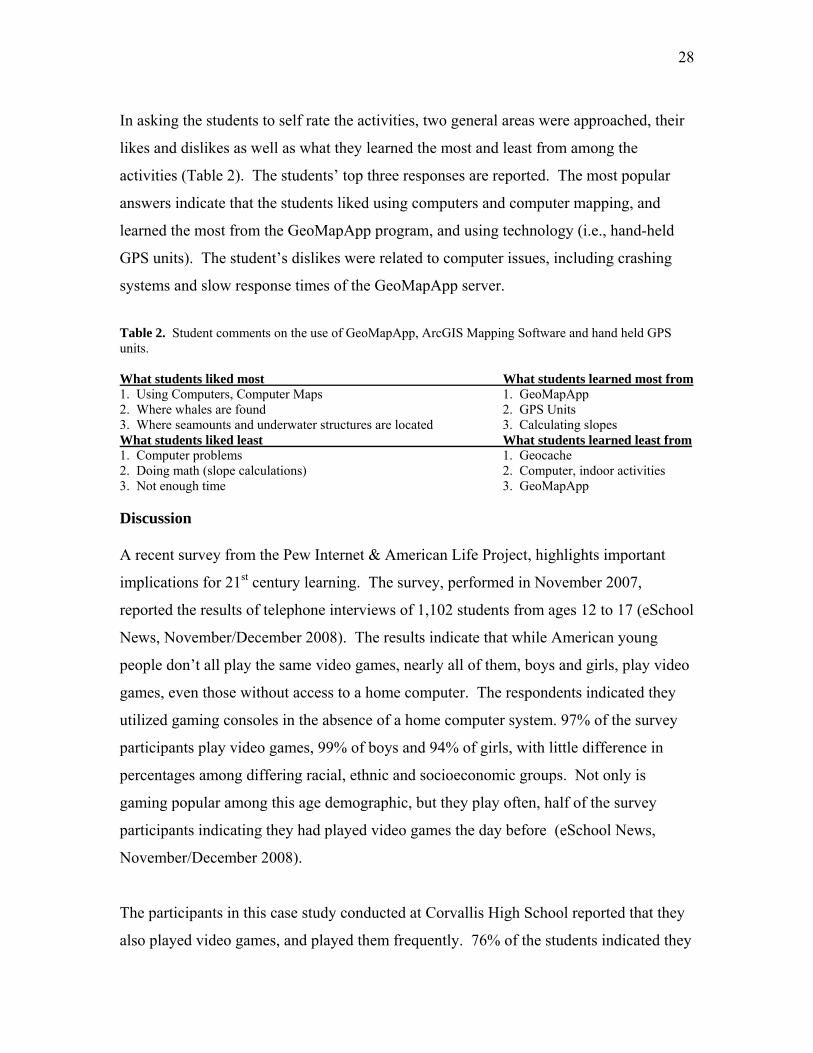
Interpretation of Qualitative Questions The evaluation of the qualitative questions (10-12) are displayed in the bar graphs of
Figures 14-19, showing combined scores for all participants combined, as well as
grouping by gender to assess differences in scores between female and males. All
individual pre and post assessments included responses that met the criterion for
Category # 7, Geographic Features. This was expected, as the wording of the question
prompted the students to list geographic features and descriptions. Of the possible spatial
thinking categories, hierarchy, proximity and pattern, only hierarchy and proximity
answers were provided. None of the participants reported patterns, such as chains of
seamounts or other geographic features in a pattern. There was a slight increase in
answers that qualified as proximity (Category #2) and absolute location, geographic
names (Category #8).
25
‐10
0
10
20
30
40
50
60
Total N
umbe
r of R
espo
nses Com
bine
d Scores
Assessment Catgories
Question 10 ‐Map Interpretation of Outlined Area
PRE
POST
CHANGE
Figure 14. Scored Responses For Qualitative Question Number 10, Map Interpretation of Outlined Area, All Scores Combined.
‐20
‐10
0
10
20
30
40
50
60
Num
ber o
f Respo
nses (Com
bine
d Scores
)
Asessment Categories
Question 10 ‐Map Interpretation of Outlined Area, Females Versus Males
FEMALE PRE TOTAL
FEMALE POST TOTAL
CHANGE
MALE PRE TOTAL
MALE POST TOTAL
CHANGE
Figure 15. Scored Responses For Qualitative Question Number 10, Map Interpretation of Outlined Area, Females versus Males.

26
‐5
0
5
10
15
20
25
30
35
40Total N
umbe
r of R
espo
nses (Com
bine
d Scores)
Assessment Category
Question 11 ‐Map Interpretation of Outlined Area
PRE
POST
CHANGE
Figure 16. Scored Responses For Qualitative Question Number 11, Map Interpretation of Outlined Area,All Scores Combined, Pre and Post Assessment.
‐5
0
5
10
15
20
25
Num
ber o
f Respo
nses (Com
bine
d Scores)
Assessment Category
Question 11 ‐Map Interpretation, Females Versus Males
FEMALE PRE TOTAL
FEMALE POST TOTAL
CHANGE
MALE PRE TOTAL
MALE POST TOTAL
CHANGE
Figure 17. Scored Responses For Qualitative Question Number 11, Map Interpretation of Outlined Area, Females versus Males.
27
‐5
0
5
10
15
20
25
30Total N
umbe
r of R
espo
nses (Com
bine
d Scores)
Assessment Category
Question 12 ‐Map Interpretation of Location
PRE
POST
CHANGE
Figure 18. Scored Responses For Qualitative Question Number 12, Map Interpretation of Location, All Scores Combined.
‐4
‐2
0
2
4
6
8
10
12
14
Total N
umbe
r of R
espo
nses (Com
bine
d Scores)
Assessment Category
Question 12 ‐Map Interpretation, Females Versus Males
FEMALE PRE TOTAL
FEMALE POST TOTAL
CHANGE
MALE PRE TOTAL
MALE POST TOTAL
CHANGE
Figure 19. Scored Responses For Qualitative Question Number 12, Map Interpretation of Location, Females versus Males.
28
In asking the students to self rate the activities, two general areas were approached, their
likes and dislikes as well as what they learned the most and least from among the
activities (Table 2). The students’ top three responses are reported. The most popular
answers indicate that the students liked using computers and computer mapping, and
learned the most from the GeoMapApp program, and using technology (i.e., hand-held
GPS units). The student’s dislikes were related to computer issues, including crashing
systems and slow response times of the GeoMapApp server.
Table 2. Student comments on the use of GeoMapApp, ArcGIS Mapping Software and hand held GPS units. What students liked most What students learned most from 1. Using Computers, Computer Maps 1. GeoMapApp 2. Where whales are found 2. GPS Units 3. Where seamounts and underwater structures are located 3. Calculating slopes What students liked least What students learned least from 1. Computer problems 1. Geocache 2. Doing math (slope calculations) 2. Computer, indoor activities 3. Not enough time 3. GeoMapApp Discussion A recent survey from the Pew Internet & American Life Project, highlights important
implications for 21st century learning. The survey, performed in November 2007,
reported the results of telephone interviews of 1,102 students from ages 12 to 17 (eSchool
News, November/December 2008). The results indicate that while American young
people don’t all play the same video games, nearly all of them, boys and girls, play video
games, even those without access to a home computer. The respondents indicated they
utilized gaming consoles in the absence of a home computer system. 97% of the survey
participants play video games, 99% of boys and 94% of girls, with little difference in
percentages among differing racial, ethnic and socioeconomic groups. Not only is
gaming popular among this age demographic, but they play often, half of the survey
participants indicating they had played video games the day before (eSchool News,
November/December 2008).
The participants in this case study conducted at Corvallis High School reported that they
also played video games, and played them frequently. 76% of the students indicated they
29
played video games at least once a week, and 16% claim they play video games daily. Of
note, all of the respondents that claimed to play video games daily, all were males (5 of
31) while none of the girls claimed to play video games daily, with most of the girls (6 of
11) reporting that they never played video games, and 4 of 11 girls indicating they played
video games once per week. Nearly half, 46% of the participants play video games 1-2
hours/week, with 7% claiming they play more than 8 hours per week.
The participants had a rather limited exposure to other geospatial technologies, including
GIS mapping software and GPS technology. On the pre assessment survey (Appendix 8 )
the participants were asked to report the frequency of using GPS units, and whether or
not they had used computer mapping software. All but one of the students reported
having used GPS Units at least 1-2 times, and this was expected, as there were 2 group
activities that used GPS units, the geocache around campus and the field work at Dixon
Creek prior to the survey. 46% of the participants indicated that they had used GPS units
outside of the scope of the case study, indicating they had prior experience with this
technology. One student reported having used a GPS unit 50 times, without doubt an
active participant in the sport of geocaching. All of the students, except for four who
were absent during the ArcGIS 9.1 classroom session, had used at least one mapping
software prior to the GeoMapApp work, yet 18 of the 32 participants reported that they
had not used other mapping software. The other students reported using ArcGIS, Google
Earth or EcoMaps.
The results of the pre assessment and post assessment comparison show trends of
improvement, indicative of positive shifts in certain areas of the students’ understanding
of seafloor topography; seamounts, ridges, basins and bathymetry; comprehension of
spatial representation of data with a geographic component in a static geovisualization;
map interpretation skills, graph interpretation skills and spatial thinking skill sets.
The box plots (Figures 8 through 13) indicate that the overall trend in this case study was
an increase in scores between pre and post assessment in all quantitative aspects assessed
with the testing instrument. Durbin (2002) examined the use of computers and the
Internet as a presentation tool in a college level Geosciences course to convey content

30
and found improvements of as much as 23% increase in exam scores and 11% in
comprehensive final scores. He cited that fewer students failed, and the student work
submitted was presented in a more ordered and organized fashion via technological
enhancements (Durbin, 2000). Durbin’s study concluded that this represented conclusive
evidence that computers were indeed beneficial as a tool for learning and retaining
information related to geovisualizations, in large part due to the benefit of allowing the
students access to extended exposure. In other words, having the ability to view and
interact with the geovisualizations beyond the short time span of presentation in a lecture
situation was highly beneficial. Interacting with a program such as GeoMapApp, as the
students in this case study did, allows for a more constructivist approach to the learning
process, encouraging the students to develop deeper levels of understanding and higher
levels of comprehension of the mapping and oceanographic concepts introduced.
While the statistical analyses performed, as represented by box plots (Figures 8-13) and
results of the student t-tests (Table 1) indicate that there is evidence of a positive change
in scores between the map interpretation questions and overall combined quantitative
questions, for the pre and post assessment phases of the case study, these results must be
interpreted with caution. This case study does not represent a truly scientific randomized
experiment. The school and classes were not chosen in a truly randomized fashion, and
there was no assessment of a control group. In a truly quantitative sense, this study is
classified as an observation study (Ramsey and Schafer, 1997). The caveat with
observational studies is that confounding variables, identifiable or not, may be
responsible for observed differences. In the case of the high school students participating
in the teaching activities of this six day study, those with more experience and comfort
with technological applications and computers may have had a distinct advantage. Also,
the assessment responses indicated that some of the students had more experience with
geography, as in the case of student # 751 who reported absolute geographic information
on Questions 10 and 11. When prompted to describe the geographic features in a
prescribed area on a map layout, the student noted a very precise location, citing also the
importance of reporting latitude and longitude in the interpretation of the map area shown
in the diagram. This student was the only one reporting this information. This could
31
indicate a prior experience with geography, but due to the nature of the anonymity and
pre and post assessment testing, the students were not individually interviewed, so it is
not possible to determine this possibility. Another student, #487, listed 15 distinct
geographical feature types for Question 10, an area that included the Baja Peninsula and
bathymetry of the nearby coastal Pacific Ocean. The student’s’ response included
terminology such as “peninsula”, “continental shelf”, “continental rise”, “continental
slope”, and “open ocean”. An interesting result was the decrease in the total number of
geographic features listed between pre and post assessments. In all of the qualitative
Questions 10-12, all groups of participants, with the exception of males on Question 12
listed fewer total numbers of geographic features in the post versus the pre assessment.
This could be due to a number of factors, but is most likely indicative of the fact that
during the GeoMapApp sessions, much attention was given to analyzing profiles of
seamounts in the same area depicted in the assessment graphic, the Pacific coastal area of
Baja California, Mexico (Figure 7). Nearly all of the students identified the features
within the outlined areas (e.g., Question 11 as “seamounts” or “seamount chain” in the
post assessments. Some students replaced a long list of features with these terms, as they
could quickly identify the familiar features of a seamount in the maps after working
through the classroom activities that centered on the seamount. Once the students had
been introduced to these terms, they had a new frame of reference for identifying the
features on the map that they did not possess before the classroom activities.
There was a slight increase in the proximity descriptions as well as the absolute locations
or geographic names in post testing. This is indicative of an increase in vocabulary, a
more well developed sense of spatial thinking and recognition of the area depicted in the
assessment graphic, the Baja California peninsula and surrounding Pacific coastal waters
(Figure 7). After spending three classroom sessions viewing and exploring the
bathymetry of this region, the students had an expanded frame of reference for this
particular location in the world, and were able to be more specific in the post assessment
in terms of place based geographical references as well as proximity of the features in the
diagram (e.g., providing responses such as “close to Mexico”, “near the Baja peninsula”).
32
Another noteworthy response on the pre assessment was the inclusion of a description by
student #628 of the darker colors representing deeper ocean water and the contour lines
as indicative of slope, a topic that was discussed during the GeoMapApp computer
sessions, but was completely unexpected in the pre-assessment. In planning discussions
with the students and the teacher, there did not appear to be any background or
educational experience with contour maps or bathymetric data sets. Some students could
have had exposure to contour maps in the course of their education, but it was not a given
and had not been covered in this particular course prior to this case study.
Overall, the students reported positive comments related to the activities of the case
study, including the GPS technology and practice, field work at Dixon Creek, map
making session using ArcGIS9 and exercises using GeoMapApp (Table 2). The post
assessment questionnaires (Appendix 8) asked students to self rate their enjoyment levels
as well as report what they learned the most from. The answers indicate that the students
enjoyed the use of computers, novel and cutting edge technologies, and participating in
activities that were outside of their expected classroom routines. The students indicated
that they learned the most from the technology, GeoMapApp and hand-held GPS units, as
well as the slope calculations using the Distance profile tool and resultant graphical
outputs in GeoMapApp. It is interesting to note that some students gave diametrically
opposed rankings of the usefulness of GeoMapApp as a teaching tool, indicating they
learned the least from this activity.
To categorize this study as observational is not to say the results have no value, nor
should they be dismissed. As Kerski (2000) states, empirical evidence is necessary to
establish whether GIS tools can substantiate their claims in educational arenas, and
whether a GIS can enhance the acquisition of geographic skills and knowledge. And
empirical evidence is broadly considered within the context of scientific research to be
evidence from observations, originating in or based on observation or experience, capable
of being verified or disproved (Montello and Sutton, 2006). Thus, the results of this
study are potentially useful to a myriad of communities, notably the growing geospatial
33
educators and academics interested in the application of geospatial technologies and
standards in K-12 education.
Microsoft has announced a new effort to study the use of computer games as teaching
tools for mathematics and science. (eSchool News, November/December 2008). A
spokesperson for Microsoft recently spoke to the organization’s mission, saying
“Technology has the potential to help reinvent the education process and excite and
inspire young learners to embrace science, math and technology” (eSchool News,
November/December 2008). The Games for Learning Institute (G4LI) is investigating
which qualities of computer games engage students in an effort to develop relevant
teaching strategies (eSchool News, November/December 2008).
As GIS become more and more mainstream, it is interesting to ponder what future
scientists and practitioners will point to as the greatest contribution of GIS to our society.
While the subjects of data visualization, geoprocessing capabilities and superior
cartographic products are important, another notable contribution on this list will
probably be the heightened role of spatial thinking (Dobson, 2004).
At the present, ArcGIS remains largely an expert based, “industrial strength” technology,
a powerful and intriguing tool that is at once challenging and inviting, but also
intimidating with a steep learning curve (National Research Council, 2006). A small but
growing number of educators and school systems are investing the time and budget to
installing computer labs and workstations capable of running ArcGIS. There are other
alternatives to implementing a full scale ArcGIS setup, software platforms and tools that
emphasize the use of geospatial technologies and promote or refine spatial thinking skills,
ArcExplorer Java Edition for Education (AEJEE), ArcExplorer, Google Earth, My
Wonderful World and GeoMapApp are some of the more well known. According to
National Research Council (2006), spatial thinking in the K-12 curriculum can be
supported and facilitated by choosing a tool that can (1) address a range of inquiry based
problems; (2) use a variety of types and amounts of data; and (3) require different levels
of skills and experience. In order to qualify as a support system for spatial thinking, three
34
basic requirements must be met by the suite of tools: (1) capability to spatialize data; (2)
facilitate visualization of the process and final results; and (3) perform a range of
functions to include, but not exclusive of transformations, operations and analyses
(National Research Council, 2006).
Conclusion
For the purposes of the case study with Corvallis High School which is the focus of this
paper, GeoMapApp was chosen as the software platform to bypass many of the
challenges of implementing a full suite of ArcGIS capable computer stations in a public
high school. The GeoMapApp application met the criteria of many of the aims of
integrating spatial thinking into a high school setting, including the ability to address a
range of inquiry based problems, use a variety of data types and function well among a
range of different technological proficiency levels. Even the most novice computer
users, those who self reported a low interest and experience level with computer mapping
were able to learn the tools and capabilities of the program within the three classroom
sessions to a level sufficient to complete the open ended scenario activity. The
participants were able to learn with a GIS, the GeoMapApp program, rather than spend
all the class time learning about the GIS (functionality and capabilities).
This study addressed four primary questions: 1) What advantages are there to using an interactive, immersive geovisualization in the design and implementation of curriculum at the high school level? As evidenced by the quantitative analysis and changes in scores, the main advantages to
using an interactive, immersive geovisualization in the classroom include a development
deeper levels of understanding and higher levels of comprehension of the mapping and
oceanographic concepts introduced. The level of engagement, as observed during the
classroom sessions was high and the interest level of the students, both observed and self
reported, showed promising results related to the use of geovisualizations. Based on this
study, I would recommend that all high school teachers with access to adequate
technologies consider using computer mapping software in their curriculum. By
35
presenting science material in a user friendly format, namely computer platforms,
students show a high degree of involvement, engagement and participation in the
educational process.
2) How can multimedia digital technologies best be utilized in aiding students to achieve the educational standards related to geography, science and technology? Based on the observations and results of this study, it is apparent that multimedia digital
technologies can be used to stimulate interest in science and encourage classroom
participation. These tools can also be used in a multidisciplinary fashion, and the
combination of skill development and higher level thinking, such as the open ended
scenarios the Corvallis High School students completed on the third day of computer
activities, extend beyond basic fact gathering and memorization, and in fact touch upon
the upper hierarchy of Bloom’s Taxonomy, to evaluation. The student’s demonstrated
knowledge acquisition was complemented with synthesis of facts and skills and included
the ability to make judgments, in the case of deciding the ideal geographic location for a
Marine Sanctuary. The best use of these multimedia digital technologies is in a
multidisciplinary fashion. If educators can combine subject and content areas, they can
meet multiple curricular goals within the constructs of the modern school systems,
inherent with time pressures and a focus on standards based assessments.
The use of GeoMapApp as an educational tool shows promise for the integration of real
world data sets and scientific tools in educational settings. The gap between how are
students are prepared for careers and the tools used in that preparation can be narrowed
by using tools that are derivations or subsets of the actual instruments and software
packages that scientists use in advanced study. GeoMapApp is a data exploration tool
that was originally designed to meet the needs of the oceanographic marine geology and
geophysics research community, and has recently been adapted for use as a tool in K-12
education. By combining the technological capabilities with the tools available in a high
school setting, educators can create dynamic, enriching and highly enjoyable educational
activities that meet standards based requirements and improve numerous skills sets and
pedagogical abilities. This evolution in applying real scientific tools represents a trend

36
towards making the educational process as close to the real world science as possible.
Improved technology has given our society access to digital multimedia and computing
powers that allow public school systems to access and utilize powerful tools that were
once exclusive to well funded scientific institutions. And the results described in this
study indicate that students are eager to use these technologies, quick to learn complex
skill sets, and capable of higher end learning in the classroom as a result of using them.
3) What pedagogical issues in secondary school curriculum development can be addressed with the use of interactive, immersive geovisualizations?
This study is promising in the consideration of how new technologies can help secondary
school teachers meet the current demands on their performance and the overall goals of
preparing students not only for assessments while in school, but for the high technology
market place that awaits them. The key to encouraging widespread implementation
seems to be mainly one of convincing administration, acquiring the necessary
infrastructure and training educators to use the tools. The students themselves are the
quickest to adopt the new and cutting edge tools, and are eager for curriculum that
stimulates new modes of thinking and rewards digital learners.
4) How does the use of real world scientific data sets enhance educational practices? The performance on the pre and post assessments indicates that using real world
scientific data produces positive changes in the acquisition and utilization of geographic
information and spatial thinking. The students self reported interests were high and
indicated that using multimedia technologies and scientific data sets of a visual nature are
excellent techniques for piquing interest and encouraging participation. Exploring data
sets and presenting real world challenges, such as requiring the students to create a map
layout of proposed marine reserves makes the task more credible, and gives the student’s
a sense of purpose in following through on a classroom task. As a result of this case
study, Corvallis High School is expanding its use of geospatial technologies in several
courses. At present, the lab consists of three workstations with ArcGIS software and
twenty work stations with GeoMapApp. The interest and enthusiasm from students and

37
staff is very encouraging, and validates the efforts of this study, while seeming to indicate
a future growth of using geospatial tools and technologies.
Hopefully, this study can represent a growing trend toward moving away from
memorization and teaching towards a select type of learner. Our culture and the digital
age seem to favor the development and application of spatial thinking skills, and GIS is
becoming mainstream. Perhaps it is time for our educational systems to discard worn out
methodologies and embrace new technologies for our students.
The National Research Council (2006), committee recommended systems for supporting
the use of spatial thinking developmental tools such as ArcGIS in schools, given the
pragmatic challenges facing educators within these systems. Many educators are in
agreement, and concur that a far superior and practical approach to teaching place based
geography, and one that is gaining popularity amongst modern geographic educators is to
teach to the habit of mind, a noted quality of a spatial thinker (National Research
Council, 2006).
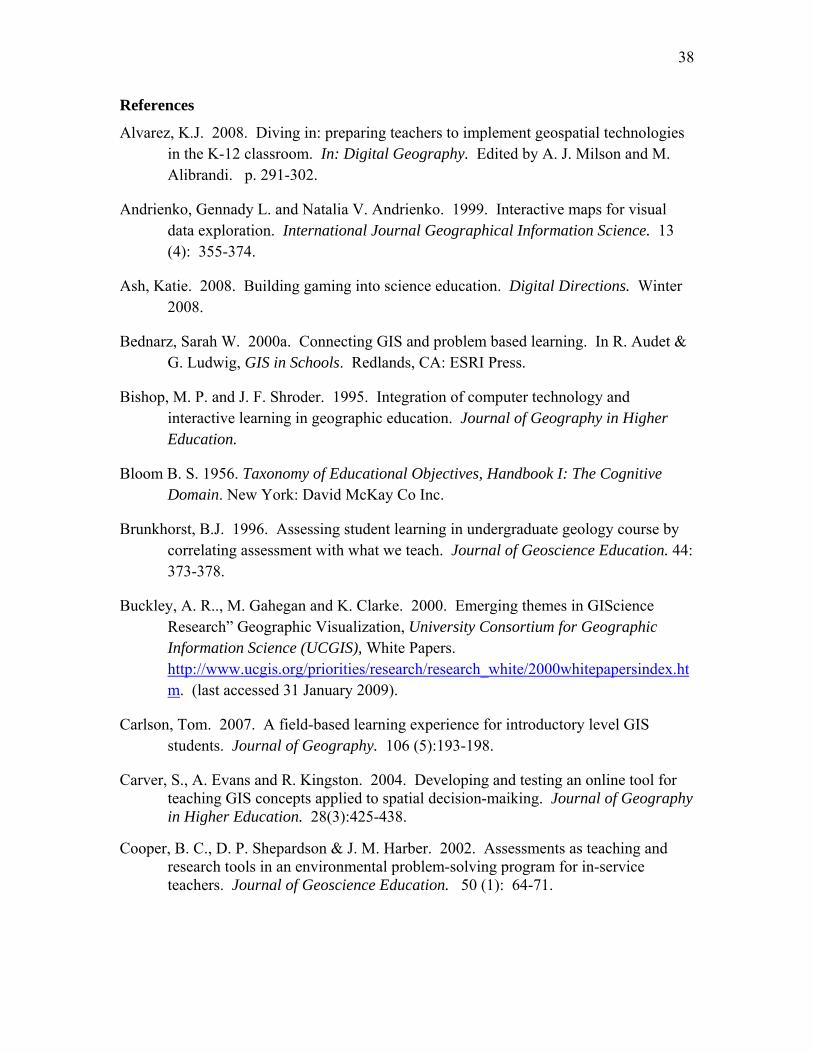
38
References
Alvarez, K.J. 2008. Diving in: preparing teachers to implement geospatial technologies in the K-12 classroom. In: Digital Geography. Edited by A. J. Milson and M. Alibrandi. p. 291-302.
Andrienko, Gennady L. and Natalia V. Andrienko. 1999. Interactive maps for visual data exploration. International Journal Geographical Information Science. 13 (4): 355-374.
Ash, Katie. 2008. Building gaming into science education. Digital Directions. Winter 2008.
Bednarz, Sarah W. 2000a. Connecting GIS and problem based learning. In R. Audet & G. Ludwig, GIS in Schools. Redlands, CA: ESRI Press.
Bishop, M. P. and J. F. Shroder. 1995. Integration of computer technology and interactive learning in geographic education. Journal of Geography in Higher Education.
Bloom B. S. 1956. Taxonomy of Educational Objectives, Handbook I: The Cognitive Domain. New York: David McKay Co Inc.
Brunkhorst, B.J. 1996. Assessing student learning in undergraduate geology course by correlating assessment with what we teach. Journal of Geoscience Education. 44: 373-378.
Buckley, A. R.., M. Gahegan and K. Clarke. 2000. Emerging themes in GIScience Research” Geographic Visualization, University Consortium for Geographic Information Science (UCGIS), White Papers. http://www.ucgis.org/priorities/research/research_white/2000whitepapersindex.htm. (last accessed 31 January 2009).
Carlson, Tom. 2007. A field-based learning experience for introductory level GIS students. Journal of Geography. 106 (5):193-198.
Carver, S., A. Evans and R. Kingston. 2004. Developing and testing an online tool for teaching GIS concepts applied to spatial decision-maiking. Journal of Geography in Higher Education. 28(3):425-438.
Cooper, B. C., D. P. Shepardson & J. M. Harber. 2002. Assessments as teaching and research tools in an environmental problem-solving program for in-service teachers. Journal of Geoscience Education. 50 (1): 64-71.
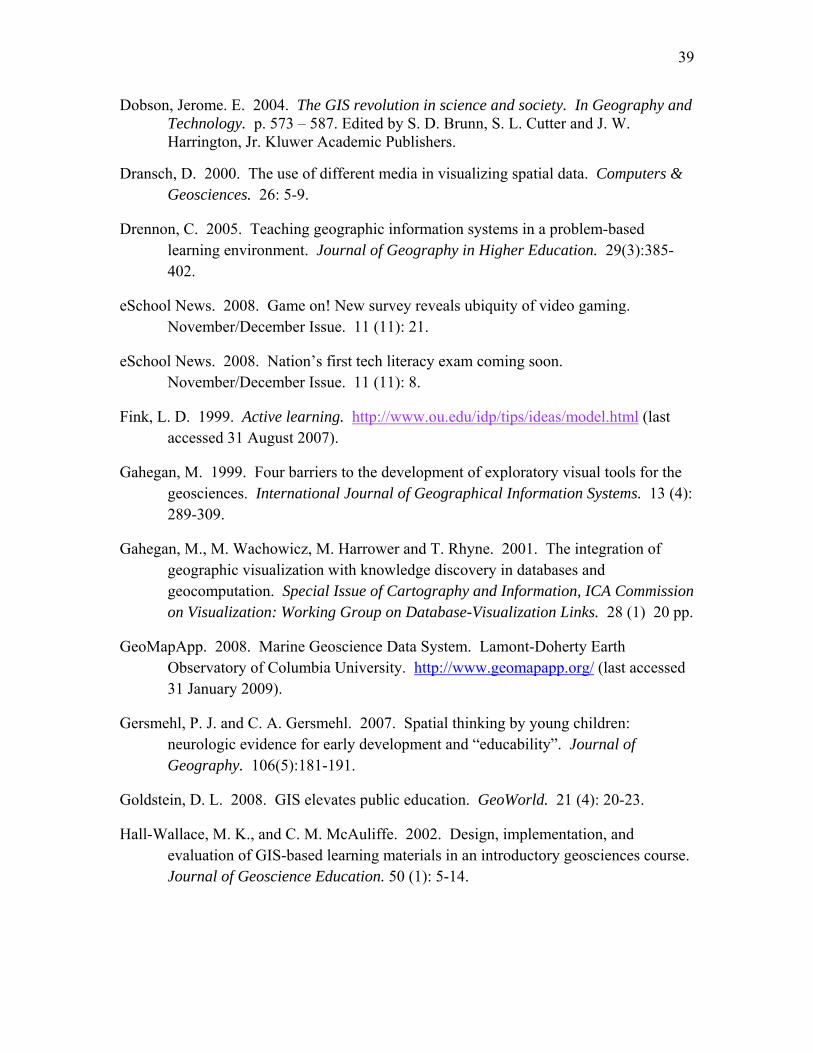
39
Dobson, Jerome. E. 2004. The GIS revolution in science and society. In Geography and Technology. p. 573 – 587. Edited by S. D. Brunn, S. L. Cutter and J. W. Harrington, Jr. Kluwer Academic Publishers.
Dransch, D. 2000. The use of different media in visualizing spatial data. Computers & Geosciences. 26: 5-9.
Drennon, C. 2005. Teaching geographic information systems in a problem-based learning environment. Journal of Geography in Higher Education. 29(3):385-402.
eSchool News. 2008. Game on! New survey reveals ubiquity of video gaming. November/December Issue. 11 (11): 21.
eSchool News. 2008. Nation’s first tech literacy exam coming soon. November/December Issue. 11 (11): 8.
Fink, L. D. 1999. Active learning. http://www.ou.edu/idp/tips/ideas/model.html (last accessed 31 August 2007).
Gahegan, M. 1999. Four barriers to the development of exploratory visual tools for the geosciences. International Journal of Geographical Information Systems. 13 (4): 289-309.
Gahegan, M., M. Wachowicz, M. Harrower and T. Rhyne. 2001. The integration of geographic visualization with knowledge discovery in databases and geocomputation. Special Issue of Cartography and Information, ICA Commission on Visualization: Working Group on Database-Visualization Links. 28 (1) 20 pp.
GeoMapApp. 2008. Marine Geoscience Data System. Lamont-Doherty Earth Observatory of Columbia University. http://www.geomapapp.org/ (last accessed 31 January 2009).
Gersmehl, P. J. and C. A. Gersmehl. 2007. Spatial thinking by young children: neurologic evidence for early development and “educability”. Journal of Geography. 106(5):181-191.
Goldstein, D. L. 2008. GIS elevates public education. GeoWorld. 21 (4): 20-23.
Hall-Wallace, M. K., and C. M. McAuliffe. 2002. Design, implementation, and evaluation of GIS-based learning materials in an introductory geosciences course. Journal of Geoscience Education. 50 (1): 5-14.
40
Harrower, M., A. MacEachern and A. Griffin. 2000. Design and assessment of a geographic visualization tool to support earth science learning. Cartography and Geographic Information Science. 27(4): 279-293.
International Society for Technology in Education. 2007. National Educational Technology Standards (NETS-S) and Performance Indicators for Students: The Next Generation.
Kerski, J. J. (2000). The implementation and effectiveness of geographic information systems technology and methods in secondary education. Doctoral dissertation, University of Colorado at Boulder.
Learning Point Associates. 2007. Understanding the No Child Left Behind Act: Technology Integration. U.S. Department of Education. 12 pp.
Linn, Robert L. & Norman E. Gronlund. 1995. Measurement and assessment in teaching. 7th Edition. Englewood Cliffs, New Jersy: Merrill.
Lo, C. P., J. M. Affolter, and T. C. Reeves. 2002. Building environmental literacy through participation in GIS and multimedia assisted field research. Journal of Geography. 101(1):10-19.
MacEachren, A. M. & Kraak, M. 2001. Research Challenges in Geovisualization, Cartography and Geographic Information Science, 28 (1): 3-12.
MacEachren, A.M., & Kraak, M.-J. 1997. Exploratory Cartographic Visualization: Advancing the Agenda. Computers & Geosciences (special issue), 23 (4): 335-344.
Mark, David and Holly J. Dickinson. 1991. GIS and the four traditions of geography. 1991-1992 International GIS Sourcebook. Fort Collins, Colorado: GIS World, Inc. pp. 407-408.
Marsh, M., R. Golledge, and S. Battersby. 2007. Geospatial concept understanding and recognition in G6-college students: A preliminary argument for minimal GIS. Annals of the Association of American Geographers. 97 (4): 696-712.
Mazur, E. 1977. Peer instruction: A User’s Manual. New York. Prentice Hall, 253 p.
McConnell, D. A., D. N. Steer, and K. D. Owens. 2003. Assessment and active learning strategies for introductory geology courses. Journal of Geoscience Education. V. 51 (2): 205-216.
41
Medyckyj-Scott, D. 1994. Visualization and human-computer interaction in GIS. In Visualization in geographic information systems, eds. H. M. Hearnshaw and D. J. Unwin, 200-211. New York: John Wiley & Sons.
Montello, Daniel R. and Paul C. Sutton. 2006. An Introduction to Scientific Research Methods in Geography. Thousand Oaks, California: Sage Publications, Inc.
National Geography Standards. 1994. Geography for Life. Washington, D. C. National Geographic Research and Education. 272 p.
National Research Council. 2000. Inquiry and the national science education standards. Washington, D.C. National Academy Press.
National Research Council. 2006. Learning to Think Spatially: GIS as a support system in the K-12 curriculum. Washington, D.C.: National Research Council and National Academies Press.
Nellis, M. Duane. 1994. Technology in geographic education: Reflections and future directions. In A Decade of Reform in Geographic Education: Inventory and Prospect, edited by Robert S. Bednarz and James F. Petersen. Indiana, Pennsylvania: National Council for Geographic Education, pp. 51-57.
Pattison, William D. 1964. The four traditions of geography. Journal of Geography. 63(5): 211-216.
Prensky, Marc. 2007. Simulation nation. Edutopia. 3: 34-39.
Ramsey and Schafer. 1997. The Statistical Sleuth: A Course in Methods and Data Analysis. Duxbury Press.
Riggs, Eric M. and David L. Kimbrough. 2002. Implementation of constructivist pedagogy in a geosciences course designed for pre-service K-6 teachers: progress, pitfalls and lessons learned. Journal of Geoscience Education. 50 (1): 49-55.
S-PLUS 8. 2008. Statistical Software. Insightful Corporation.
SERC Carleton, 2008. http://serc.carleton.edu/eet/seafloor/. Earth Exploration Toolbox Chapter – Explore A Visualization of the Seafloor, Parts 1, 2 and 4). http://serc.carleton.edu/eet/seafloor/index.html. (last accessed 31 January 2009).
Silberman, M. 1996. Active Learning: 101 Strategies to Teach Any Subject. Boston: Allyn and Bacon.
Solem, M., K. Foote, and J. Monk. 2009. Aspiring Academics: A Resource Book for Graduate Students and Early Career Faculty. Prentice Hall. 212p.
42
Stansbury, Meris. 2008. Students want more use of gaming technology; results from Project Tomorrow’s annual Speak Up survey reveal a disconnect between student’s, adults’ views on technology in school. eSchoolNews. 9 April. http://www.eschoolnews.com.
Stansfield, Charles A. Jr. 2008. Building Geographic Literacy: An Interactive Approach. Sixth Edition. Pearson Prentice Hall. 280p.
Swanson, Stevenson. 2007. When it comes to geography, why is the US in another world? Chicago Tribune. 2 December.
White, Shannon. 2005. Geographic Information Systems (GIS) and Instructional Technology (IT) diffusion : K-12 student and educator conceptualizations. Doctoral Dissertation, North Carolina State University.
White, K. L. and M. Simms. 1993. Geographic information systems as an educational tool. Journal of Geography. 92(2): 80-85.
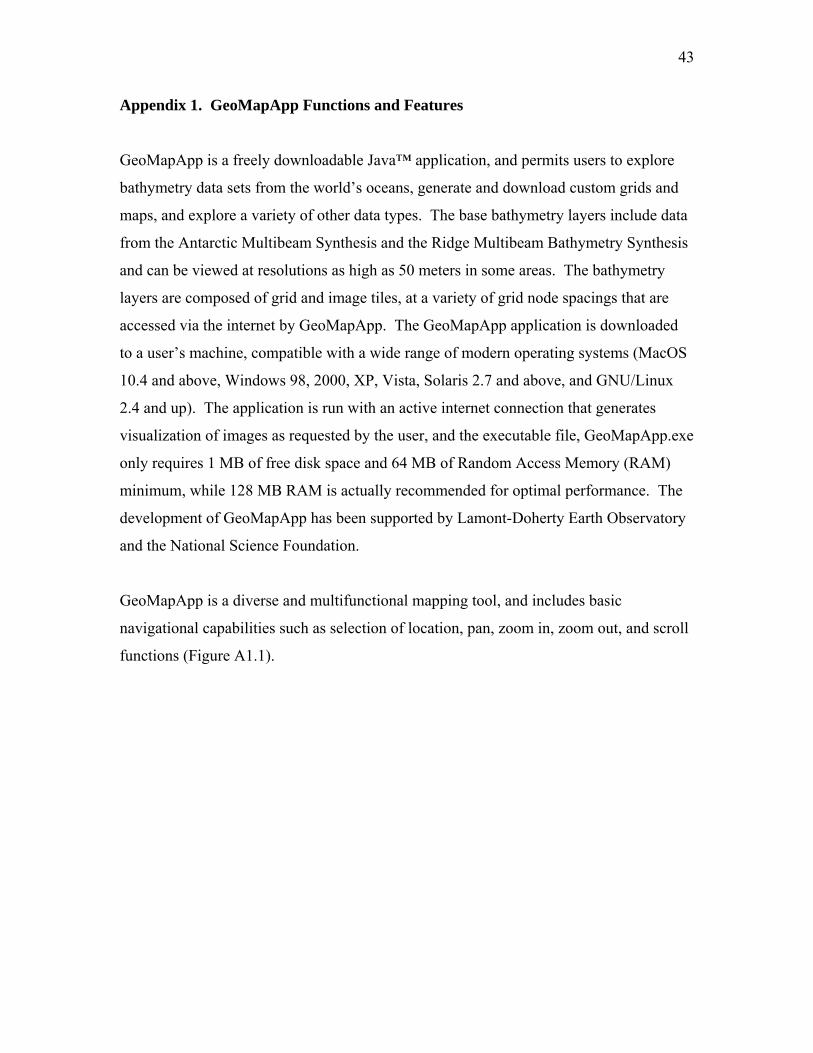
43
Appendix 1. GeoMapApp Functions and Features
GeoMapApp is a freely downloadable Java™ application, and permits users to explore
bathymetry data sets from the world’s oceans, generate and download custom grids and
maps, and explore a variety of other data types. The base bathymetry layers include data
from the Antarctic Multibeam Synthesis and the Ridge Multibeam Bathymetry Synthesis
and can be viewed at resolutions as high as 50 meters in some areas. The bathymetry
layers are composed of grid and image tiles, at a variety of grid node spacings that are
accessed via the internet by GeoMapApp. The GeoMapApp application is downloaded
to a user’s machine, compatible with a wide range of modern operating systems (MacOS
10.4 and above, Windows 98, 2000, XP, Vista, Solaris 2.7 and above, and GNU/Linux
2.4 and up). The application is run with an active internet connection that generates
visualization of images as requested by the user, and the executable file, GeoMapApp.exe
only requires 1 MB of free disk space and 64 MB of Random Access Memory (RAM)
minimum, while 128 MB RAM is actually recommended for optimal performance. The
development of GeoMapApp has been supported by Lamont-Doherty Earth Observatory
and the National Science Foundation.
GeoMapApp is a diverse and multifunctional mapping tool, and includes basic
navigational capabilities such as selection of location, pan, zoom in, zoom out, and scroll
functions (Figure A1.1).
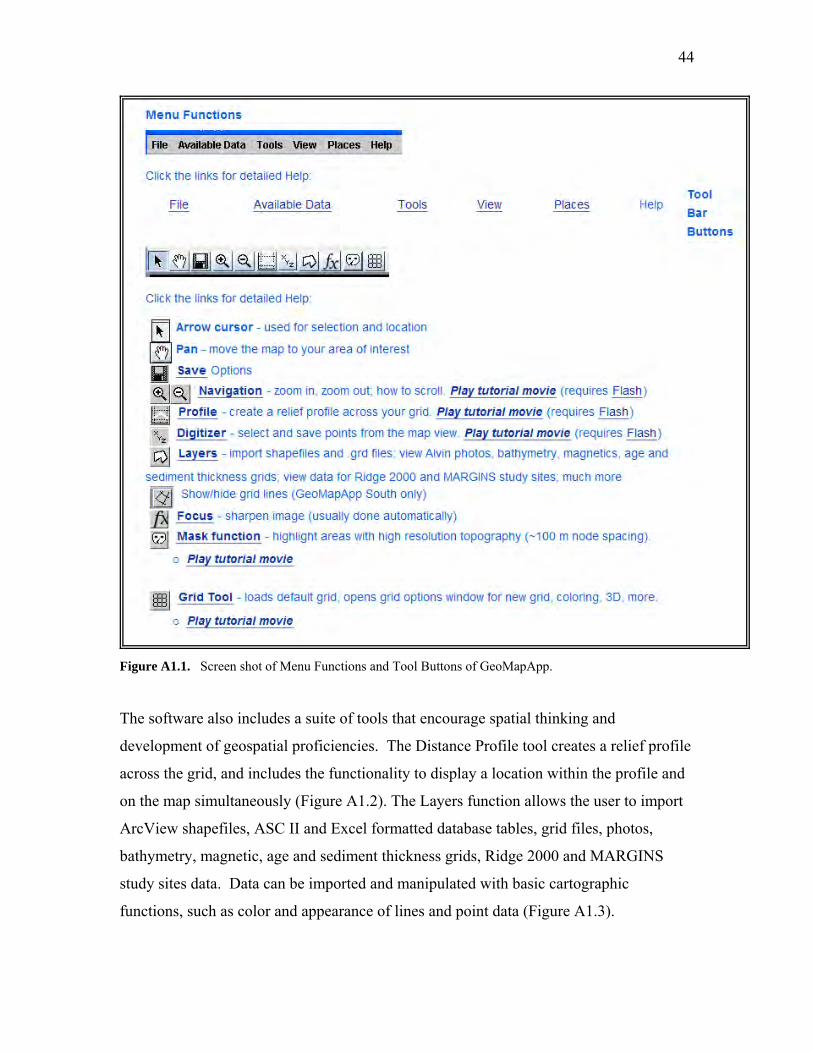
44
Figure A1.1. Screen shot of Menu Functions and Tool Buttons of GeoMapApp.
The software also includes a suite of tools that encourage spatial thinking and
development of geospatial proficiencies. The Distance Profile tool creates a relief profile
across the grid, and includes the functionality to display a location within the profile and
on the map simultaneously (Figure A1.2). The Layers function allows the user to import
ArcView shapefiles, ASC II and Excel formatted database tables, grid files, photos,
bathymetry, magnetic, age and sediment thickness grids, Ridge 2000 and MARGINS
study sites data. Data can be imported and manipulated with basic cartographic
functions, such as color and appearance of lines and point data (Figure A1.3).
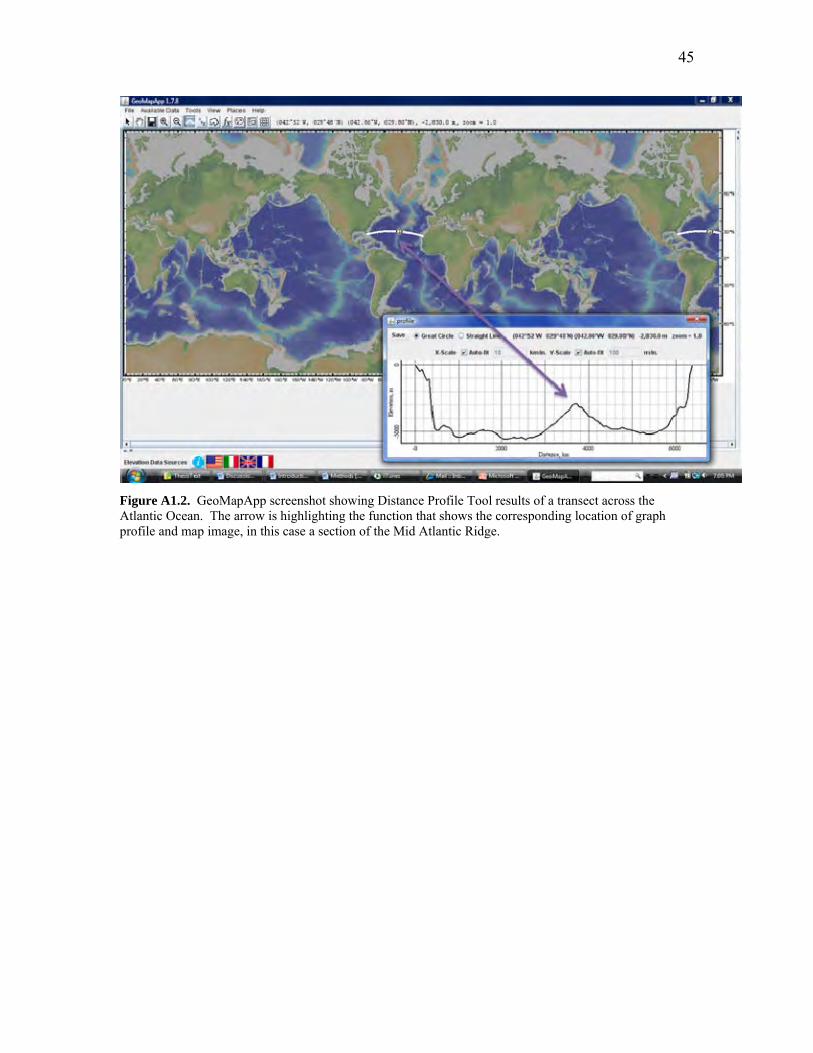
45
Figure A1.2. GeoMapApp screenshot showing Distance Profile Tool results of a transect across the Atlantic Ocean. The arrow is highlighting the function that shows the corresponding location of graph profile and map image, in this case a section of the Mid Atlantic Ridge.
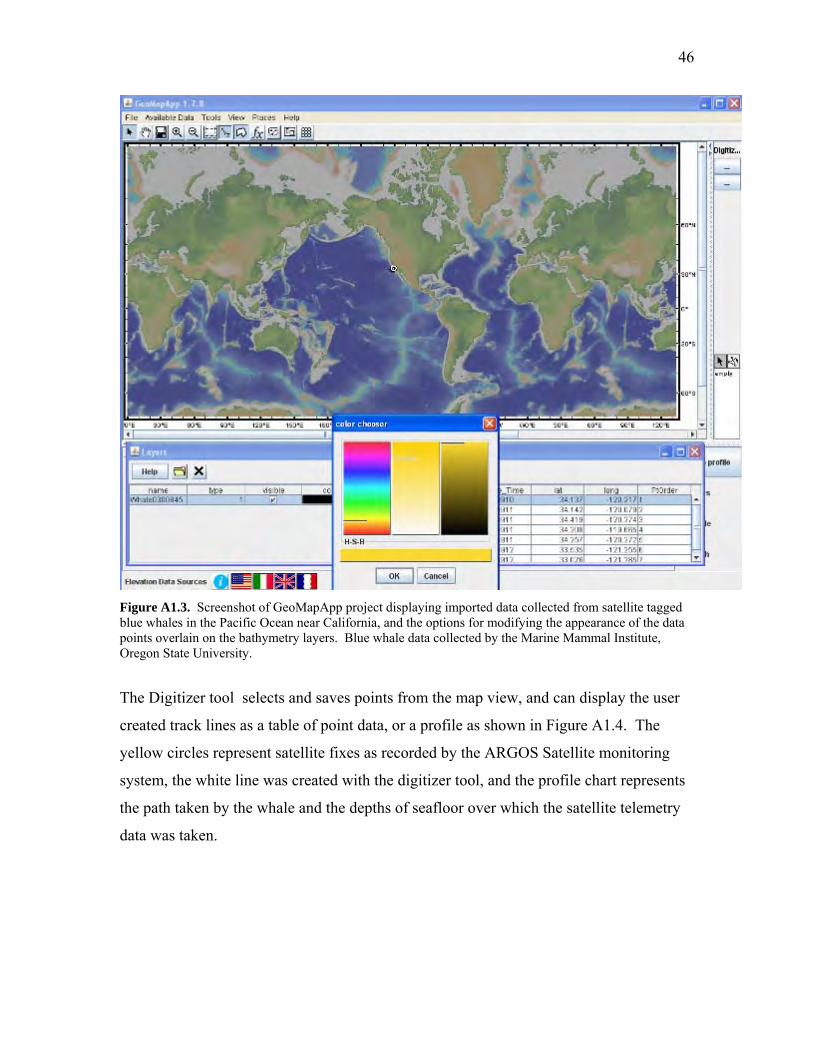
46
Figure A1.3. Screenshot of GeoMapApp project displaying imported data collected from satellite tagged blue whales in the Pacific Ocean near California, and the options for modifying the appearance of the data points overlain on the bathymetry layers. Blue whale data collected by the Marine Mammal Institute, Oregon State University.
The Digitizer tool selects and saves points from the map view, and can display the user
created track lines as a table of point data, or a profile as shown in Figure A1.4. The
yellow circles represent satellite fixes as recorded by the ARGOS Satellite monitoring
system, the white line was created with the digitizer tool, and the profile chart represents
the path taken by the whale and the depths of seafloor over which the satellite telemetry
data was taken.
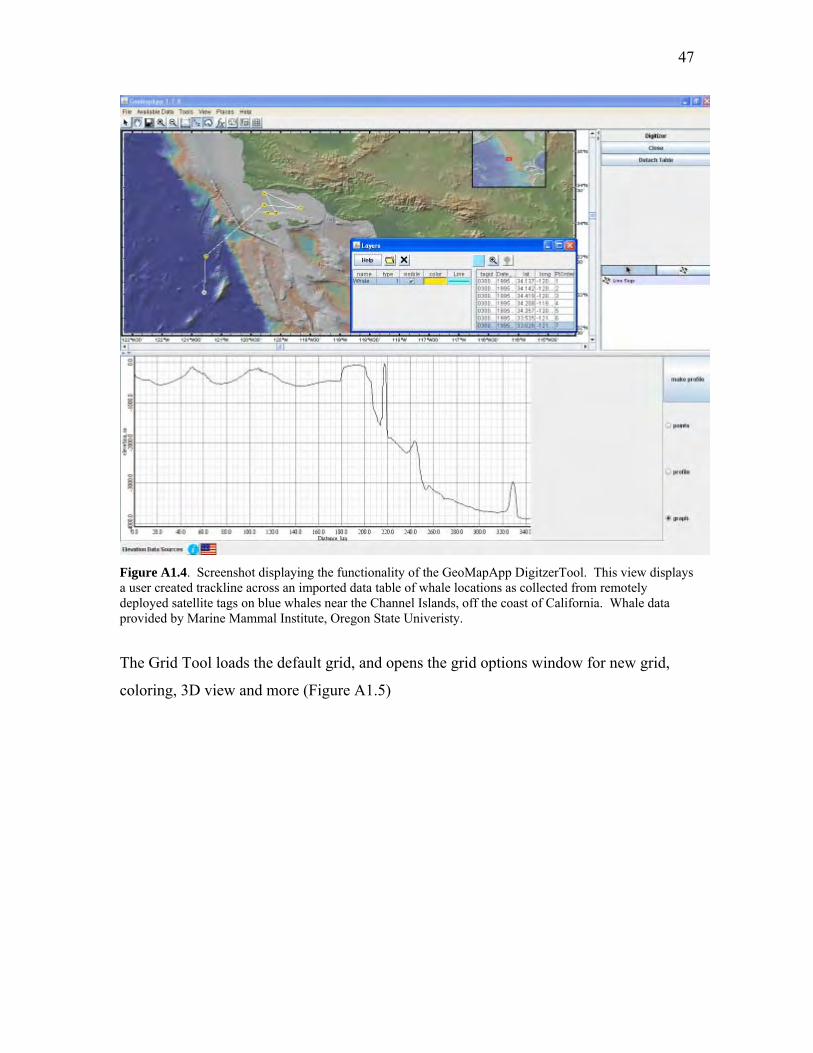
47
Figure A1.4. Screenshot displaying the functionality of the GeoMapApp DigitzerTool. This view displays a user created trackline across an imported data table of whale locations as collected from remotely deployed satellite tags on blue whales near the Channel Islands, off the coast of California. Whale data provided by Marine Mammal Institute, Oregon State Univeristy.
The Grid Tool loads the default grid, and opens the grid options window for new grid,
coloring, 3D view and more (Figure A1.5)
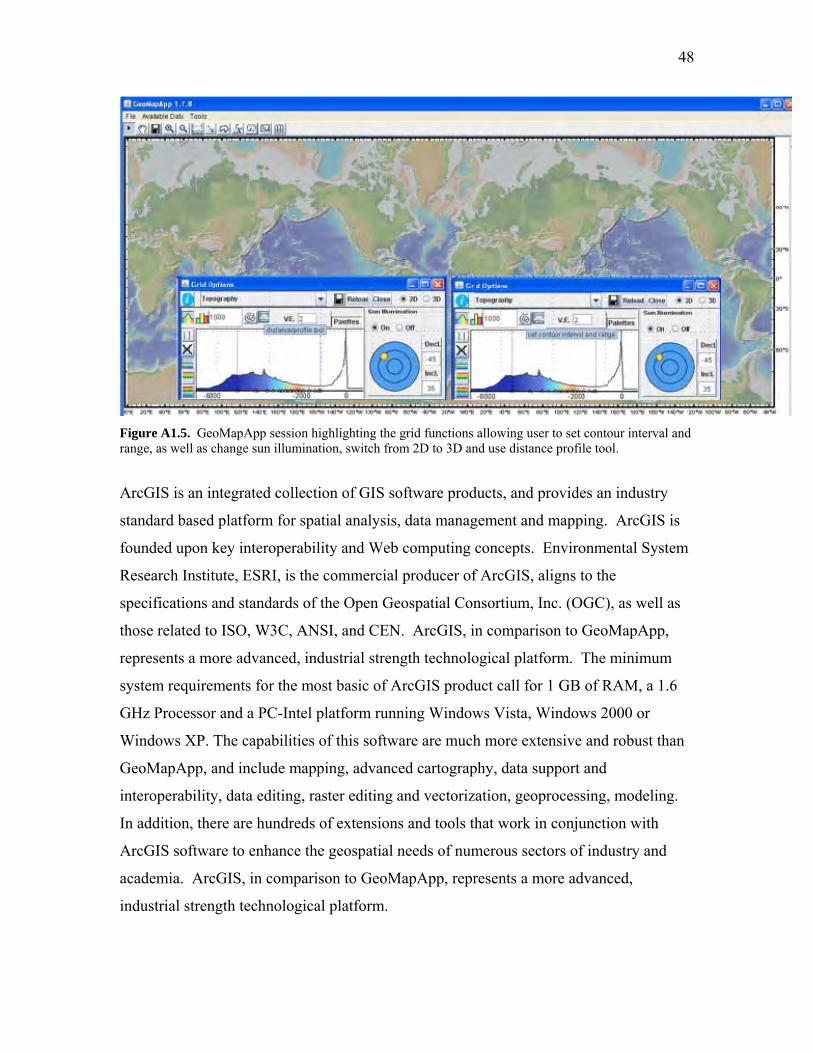
48
Figure A1.5. GeoMapApp session highlighting the grid functions allowing user to set contour interval and range, as well as change sun illumination, switch from 2D to 3D and use distance profile tool.
ArcGIS is an integrated collection of GIS software products, and provides an industry
standard based platform for spatial analysis, data management and mapping. ArcGIS is
founded upon key interoperability and Web computing concepts. Environmental System
Research Institute, ESRI, is the commercial producer of ArcGIS, aligns to the
specifications and standards of the Open Geospatial Consortium, Inc. (OGC), as well as
those related to ISO, W3C, ANSI, and CEN. ArcGIS, in comparison to GeoMapApp,
represents a more advanced, industrial strength technological platform. The minimum
system requirements for the most basic of ArcGIS product call for 1 GB of RAM, a 1.6
GHz Processor and a PC-Intel platform running Windows Vista, Windows 2000 or
Windows XP. The capabilities of this software are much more extensive and robust than
GeoMapApp, and include mapping, advanced cartography, data support and
interoperability, data editing, raster editing and vectorization, geoprocessing, modeling.
In addition, there are hundreds of extensions and tools that work in conjunction with
ArcGIS software to enhance the geospatial needs of numerous sectors of industry and
academia. ArcGIS, in comparison to GeoMapApp, represents a more advanced,
industrial strength technological platform.
49
Appendix 2. Geographic Literacy and National Geographic Standards
Geographic literacy is essential for living and functioning in a world that is rapidly
changing due to technology and the digital tools of our era (Geography Education
Standards Project, 1994). The world is becoming increasingly interconnected, globally,
economically and culturally. Making decisions about where to live, where to work, and
where to spend leisure time are all reliant upon knowing world geography. A
‘Geographically Informed Person’ sees meaning in the arrangement of things in space;
sees relations between people, place and environments; uses geographic skills; and
applies spatial and ecological perspectives to life situations. (Geography Education
Standards Project, 1994). Being geographically illiterate makes a citizen, and potentially
a community or nation isolated from the world. We now know that our own backyards
are reliant upon the communities and cultures in countries across the globe. Our world is
interconnected, integrated and interdependent. It is time for our curriculum across the
grade levels to follow suit.
To be successful in today’s global cultures and economies, students must develop a
strong sense of the world and its places, in spatial terms, what National Geographic
defines as ‘geographic literacy’. The elements that make a geographically informed
person, or one who is ‘literate’, are clearly outlined in the textbook Geography for Life,
grouped into six Essential Elements encompassing Eighteen Standards, all benchmarked
according to specific grade levels (Geography for Life, 1994). These recommendations
for a geographically literate citizen are characterized according to competencies to be
demonstrated at milestone grade levels, grouped as K-4, 5-8 and 9-12. These standards
are further defined by detailed listings of what students should know and understand
about a specific set of ideas and approaches, as well as skill sets describing what students
should be able to do on the basis of this knowledge upon reaching Grades 4, 8 and 12
(National Geographic, 1994). Each standard is further distinguished according to 5 skill
sets;
1. Asking geographic questions
2. Acquiring geographic information
50
3. Organizing geographic information
4. Analyzing geographic information
5. Answering geographic questions
The principles that underlie the five skill sets have been adapted from the Guidelines for
Geographic Education: Elementary and Secondary Schools, prepared by the Joint
Committee on Geographic Education and published in 1984 by the Association of
American Geographers and the National Council for Geographic Education.
(Bishop and John F. Shroder, 1995).
With a few exceptions, the different types of visualization tools, static geovisualzations,
dynamic geovisualizations, mapping software and serious games can all be used to
address each of the eighteen geography standards grouped according to the six essential
elements. Each tool type is appropriate within educational curricula in the development
of a geographically informed person;
1) who sees meaning in the arrangement of things in space;
2) who sees relations between people, place and environments;
3) who uses geographic skills; and
4) who applies spatial and ecological perspectives to life situations.
(Geography for Life, 1994).
Educational tools such as GeoMapApp, ArcExplorer – Java Edition for Education
(AEJEE) and ArcGIS can provide access to research quality data sets for use in
inquiry‐based activities. Despite our capabilities and advances, many questions remain
about how to use these new geospatial tools and apply representational techniques to
problem solving and knowledge construction. Table A2.1 suggests how the various types
of multimedia tools can be used in curricula to address knowledge construction, as well
as the other stages of learning described by Bloom’s Taxonomy (Bloom, 1956).
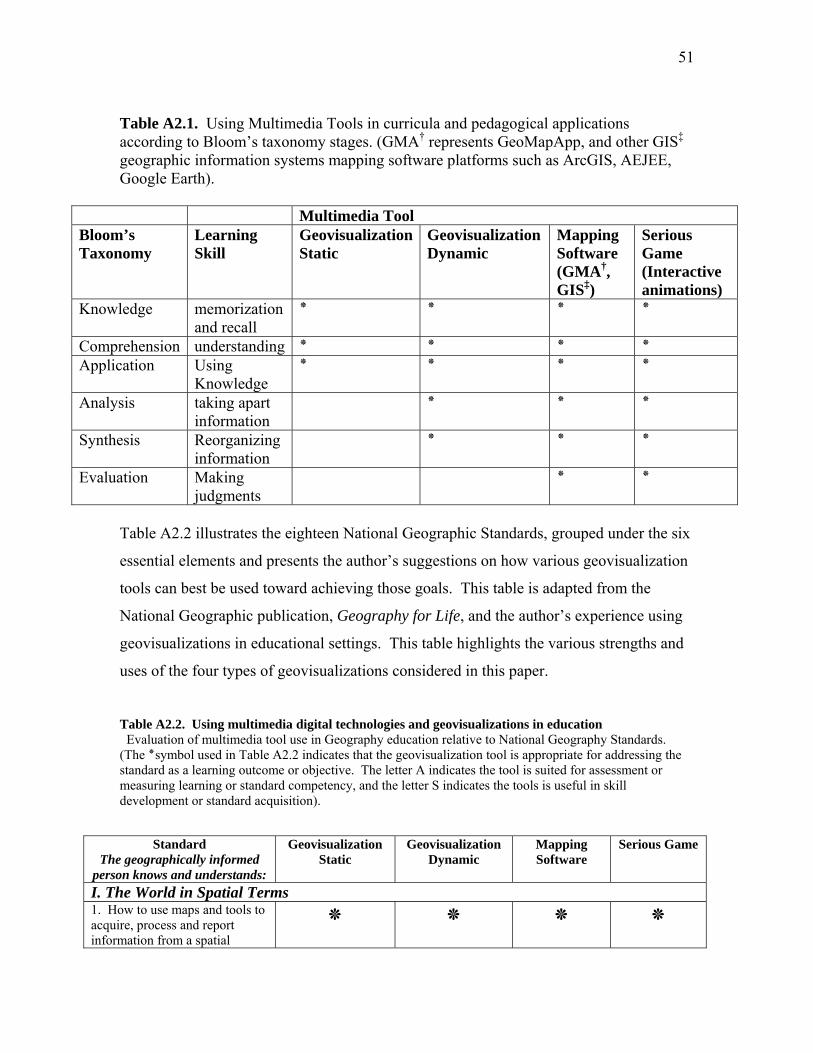
51
Table A2.1. Using Multimedia Tools in curricula and pedagogical applications according to Bloom’s taxonomy stages. (GMA† represents GeoMapApp, and other GIS‡ geographic information systems mapping software platforms such as ArcGIS, AEJEE, Google Earth).
Multimedia Tool Bloom’s Taxonomy
Learning Skill
GeovisualizationStatic
Geovisualization Dynamic
Mapping Software (GMA†, GIS‡)
Serious Game (Interactive animations)
Knowledge memorization and recall
٭ ٭ ٭ ٭
Comprehension understanding ٭ ٭ ٭ ٭ Application Using
Knowledge ٭ ٭ ٭ ٭
Analysis taking apart information
٭ ٭ ٭
Synthesis Reorganizing information
٭ ٭ ٭
Evaluation Making judgments
٭ ٭
Table A2.2 illustrates the eighteen National Geographic Standards, grouped under the six
essential elements and presents the author’s suggestions on how various geovisualization
tools can best be used toward achieving those goals. This table is adapted from the
National Geographic publication, Geography for Life, and the author’s experience using
geovisualizations in educational settings. This table highlights the various strengths and
uses of the four types of geovisualizations considered in this paper.
Table A2.2. Using multimedia digital technologies and geovisualizations in education Evaluation of multimedia tool use in Geography education relative to National Geography Standards. (The ٭symbol used in Table A2.2 indicates that the geovisualization tool is appropriate for addressing the standard as a learning outcome or objective. The letter A indicates the tool is suited for assessment or measuring learning or standard competency, and the letter S indicates the tools is useful in skill development or standard acquisition).
Standard The geographically informed
person knows and understands:
Geovisualization Static
Geovisualization Dynamic
Mapping Software
Serious Game
I. The World in Spatial Terms 1. How to use maps and tools to acquire, process and report information from a spatial
٭ ٭ ٭ ٭
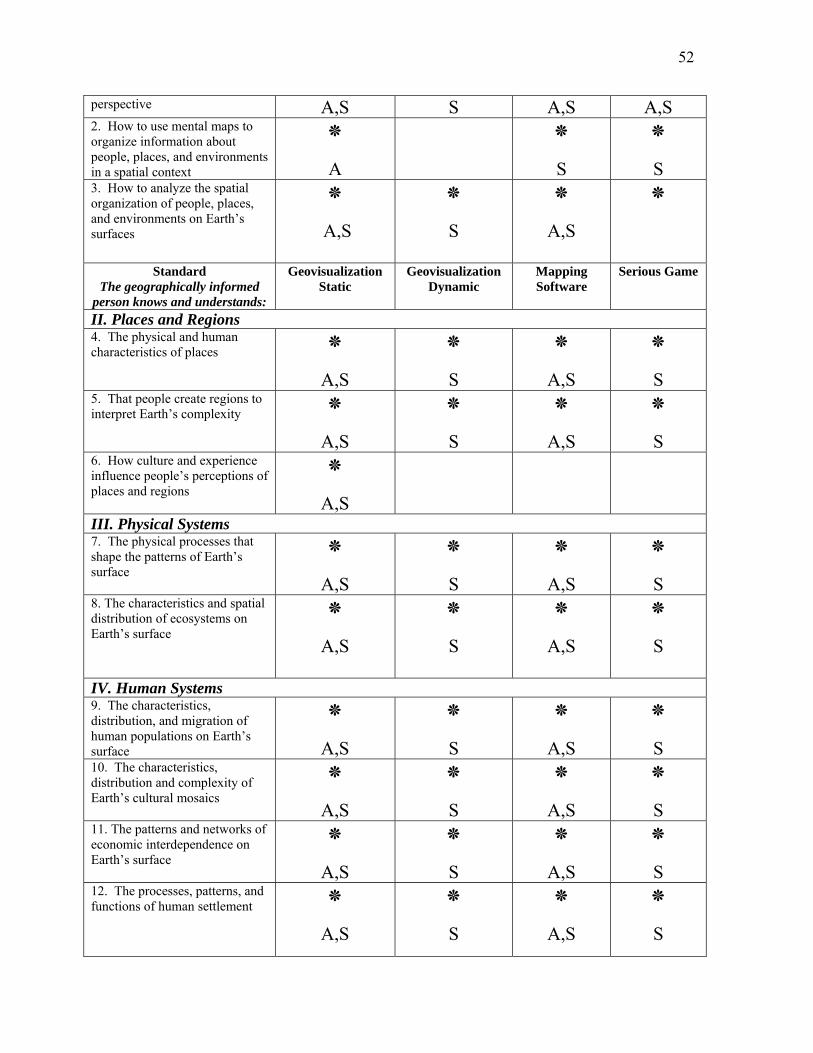
52
perspective A,S S A,S A,S 2. How to use mental maps to organize information about people, places, and environments in a spatial context
٭A
٭ S
٭ S
3. How to analyze the spatial organization of people, places, and environments on Earth’s surfaces
٭ A,S
٭S
٭A,S
٭
Standard The geographically informed
person knows and understands:
Geovisualization Static
Geovisualization Dynamic
Mapping Software
Serious Game
II. Places and Regions 4. The physical and human characteristics of places ٭
A,S ٭S
٭A,S
٭S
5. That people create regions to interpret Earth’s complexity ٭
A,S ٭S
٭A,S
٭S
6. How culture and experience influence people’s perceptions of places and regions
٭A,S
III. Physical Systems 7. The physical processes that shape the patterns of Earth’s surface
٭A,S
٭S
٭A,S
٭S
8. The characteristics and spatial distribution of ecosystems on Earth’s surface
٭A,S
٭S
٭A,S
٭S
IV. Human Systems 9. The characteristics, distribution, and migration of human populations on Earth’s surface
٭A,S
٭S
٭A,S
٭S
10. The characteristics, distribution and complexity of Earth’s cultural mosaics
٭A,S
٭S
٭A,S
٭S
11. The patterns and networks of economic interdependence on Earth’s surface
٭A,S
٭S
٭A,S
٭S
12. The processes, patterns, and functions of human settlement ٭
A,S ٭S
٭A,S
٭S
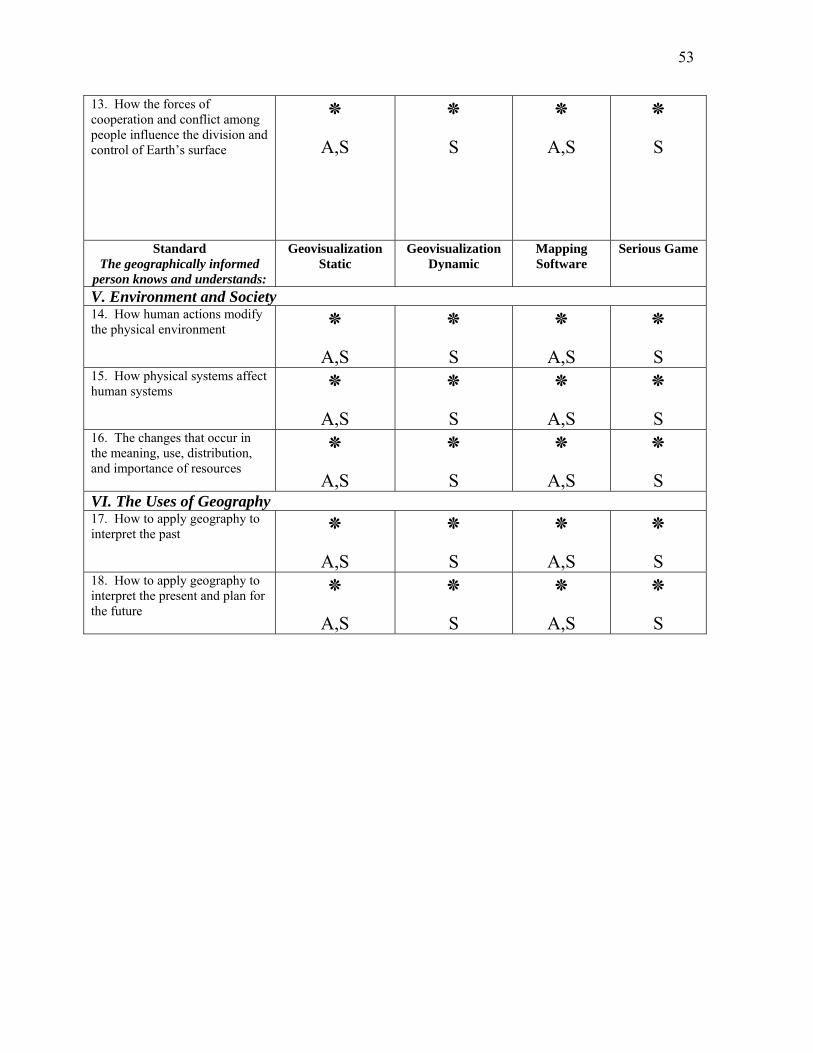
53
13. How the forces of cooperation and conflict among people influence the division and control of Earth’s surface
٭A,S
٭S
٭A,S
٭S
Standard The geographically informed
person knows and understands:
Geovisualization Static
Geovisualization Dynamic
Mapping Software
Serious Game
V. Environment and Society 14. How human actions modify the physical environment ٭
A,S ٭S
٭A,S
٭S
15. How physical systems affect human systems ٭
A,S ٭S
٭A,S
٭S
16. The changes that occur in the meaning, use, distribution, and importance of resources
٭A,S
٭S
٭A,S
٭S
VI. The Uses of Geography 17. How to apply geography to interpret the past ٭
A,S ٭S
٭A,S
٭S
18. How to apply geography to interpret the present and plan for the future
٭A,S
٭S
٭A,S
٭S
54
Appendix 3. Additional Literature of Interest
Our society has changed dramatically over the past few decades, and technology
permeates every aspect of our daily culture. Computers have literally revolutionized
every aspect of our lives, and we are moving from the industrial age to an informational
age (Goldstein, 2008). The way we communicate and experience the world has been
transformed through technological advances, yet our school systems are often lagging in
keeping up with all new trends and computing capabilities. Professional simulations are
used in many industries, city planning, military strategic planning, weather forecasting,
ecological studies, and engineering (Prensky, 2007). Proficiency in computer simulations
is required in these and other contemporary career fields, and numerous science
simulations are accepted as common in the workplace (Prensky, 2007). In a report
released in 2005 by the U.S. Department of Labor Employment and Training
Administration entitled High Growth Industry Profile, GIS was identified as one of the
three most important emerging and evolving fields, along with nanotechnology and
biotechnology (Goldstein, 2008). Over a quarter of the highly trained NASA geospatial
professionals are slated to retire in the next decade (Goldstein, 2008). Clearly, GIS has a
prominent and permanent position in the workforce, and a high potential in career and
higher-education opportunities, and should therefore be a priority for implementation in
K-12 classrooms.
To be proficient in geospatial technologies, candidates entering the work force need to
have fundamental geographic literacy as well as spatial literacy. In the linguistic
consideration, literacy entails the ability to read, write and speak in a language (National
Research Council, 2000). National Geographic has published Geography for Life which
defines geographic literacy according to benchmarks appropriate at grades 4, 8 and 12.
The National Research Council has published a report entitled Learning to Think
Spatially and defines spatial literacy as follows:
Spatial literacy involves the ability to draw upon the skills of spatial thinking. Spatial thinking has three core components; concepts of space, tools of representation and processes of reasoning (National Research
55
Council, 2000). The concept of space is demonstrated when an individual calculates distance (miles traveled, cost of travel), also in the concept of coordinate systems (e.g., Cartesian versus polar coordinates) as well as the nature of spaces (e.g., two dimensions versus three). Tools of representation can be the relationships among views (e.g., plans versus elevations of buildings, orthogonal versus perspective maps), differences among projections (e.g., Mercator versus equal-area map projections) and the principles of graphic design (e.g., legibility, visual contrast, figure-ground, graphing and mapping). The processes of reasoning can be defined as different modes of thinking about shortest distance (e.g., straight line ‘as the crow flies’ versus traversing along a rectangular city grid), extrapolation and interpolation (e.g., predicting a trend into the future based on a graph, estimating the slope of a map of contour lines) and making decisions (e.g., driving route chosen based on a radio traffic report). (National Research Council, 2000).
A spatially literate individual can draw upon spatial knowledge, has a core repertoire of
spatial ways of thinking and acting and has the capacity to use these spatial capabilities to
solve problems in all aspects of their lives (National Research Council, 2000).
Furthermore, studying geography and earth science in the digital age now requires a
sophisticated and complex integration of concepts that include spatial and temporal
aspects (Harrower, et al., 2000). The use of digital technology, including static and
dynamic geovisualizations, geographic information software packages, and serious games
or animations can encourage the development of spatial thinking skills and promote the
‘habit of mind’ characteristic of a spatial thinker.
One topic gaining popularity in this era of digital revolution is the idea of integrating
gaming platforms and educational settings. Many researchers and educators are looking
towards the use of gaming in education, and a small but growing number of advocates are
developing tools and simulations for use in meeting educational objectives. In a poll
conducted by eSchoolNews in March of 2008, only 19 percent of parents and 15 percent
of administrators agreed with the more than 50 percent of students that would like to see
gaming integrating into school work (Stansbury, 2008). These students already spend 8
to 10 hours per week on average playing online or electronic games. This seems like a
tremendous skill base with a high level of interest that educational systems could tap into.
56
How did the teachers rank in this survey? More than 50 percent of the teachers polled
said they would be interested in learning more about integrating gaming technologies and
spending time on professional development on this topic, yet only 11 percent indicated
they are currently incorporating some aspect of gaming in their instruction (Stansbury,
2008). Yet educators face the challenge of finding and integrating computer games that
are relevant to the established curriculum (Ash, 2008). Experts draw correlations
between science and gaming, pointing to the commonalities of curiosity, inquiry and
investigation – qualities which are fundamental to both scientists and avid gamers (Ash,
2008).
What can we do to begin educating our 21st Century children with 21st Century
technology tools? We must address the barriers to adoption of technologies such as GIS
and serious games in curricula; lack of money, lack of time, lack of knowledge or
training, lack of resources such as learning modules, lack of technology and a common
belief that serious games cannot address standards based curricula. The political factors
influencing educational content and operation will continue to be pressing issues;
funding, time and technological system support all need to be addressed. The pivotal
issue that can turn the focus in current school systems toward implementing serious
gaming is the standards based curriculum development. If we can design and offer
simulations that meet educational objectives currently delegated to our nation’s teachers,
the other issues of funding, time and access to technology will surely follow suit. The
key lies in rigorous assessment tools and capabilities built into the gaming environment,
to assure busy educators that the time spent in animated environments can also be
educational. Educators need empirical evidence for themselves as well as administrators
in order to encourage the curricular reform that would precede a shift in the use of
technology, including geovisualizations of all types.
The world wide web has made our global community come closer together, and has
resulted in a climate and culture than encourages and rewards individuals who can
assimilate facts and concepts from a multitude of disciplines into coherent and cognizant
thought processes. Learning with Geographic Information Systems (GIS) rather than
57
about them shows great potential in educational arenas (Hall-Wallace and McAuliffe,
2002). Field testing found positive correlations between spatial ability and performance
on assessment testing, and demonstrated that GIS was useful for identifying geographic
locations and features, interpreting topography and conceptualizing two and three
dimensional representations (Hall-Wallace and McAuliffe, 2002).
Carlson (2007) recognizes that Geographic Information System education blends a focus
on spatial concepts with theoretical foundations through the representation of spatial data.
The capabilities of GIS as a tool; query, analysis, representation and assimilation of data,
encourage thinking that spans many disciplines and schools of thought. The highly
engaging visual nature of a GIS suite of tools, combined with the interactive powers of a
geovisualization encourage creativity and success in students that might not excel in more
traditional pencil and paper based tasks or measures of aptitude.
As illustrated by the brief math lesson in Figure A3.1, the fact memorizing approach to
geography is futile and quickly reaches a point of staggering and overwhelming
dimensions (Gersmehl and Gersmehl, 2007).
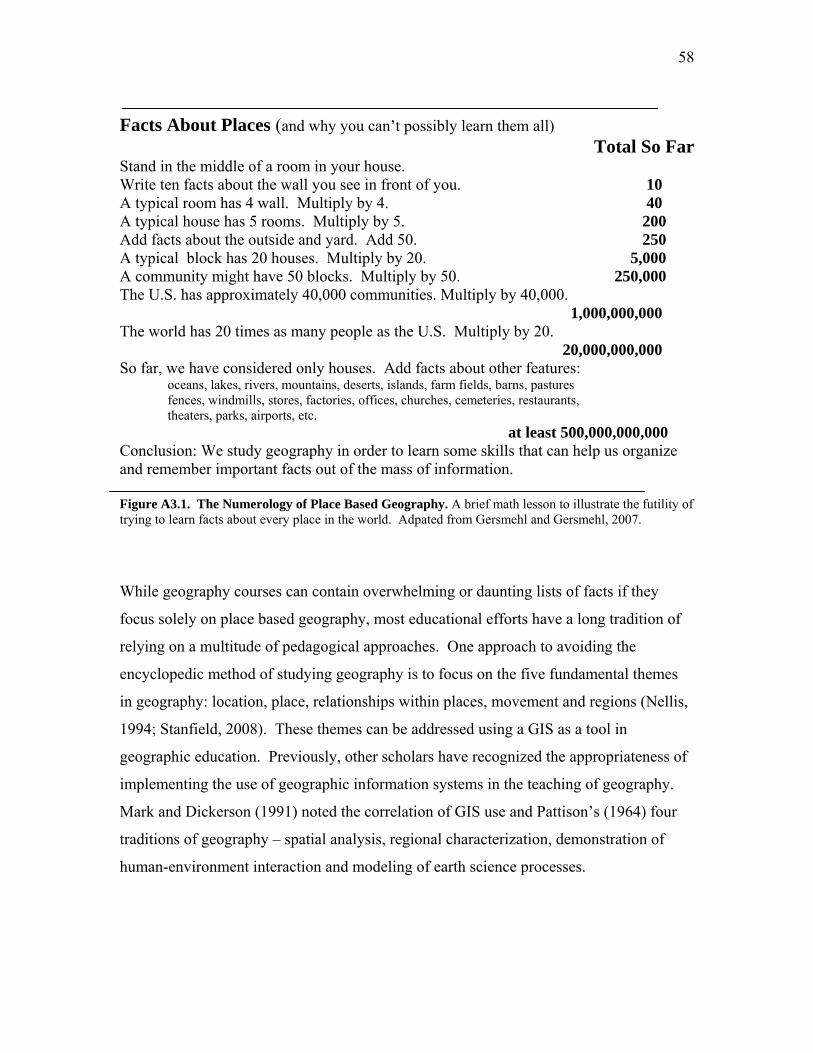
58
Facts About Places (and why you can’t possibly learn them all)
Total So Far Stand in the middle of a room in your house. Write ten facts about the wall you see in front of you. 10 A typical room has 4 wall. Multiply by 4. 40 A typical house has 5 rooms. Multiply by 5. 200 Add facts about the outside and yard. Add 50. 250 A typical block has 20 houses. Multiply by 20. 5,000 A community might have 50 blocks. Multiply by 50. 250,000 The U.S. has approximately 40,000 communities. Multiply by 40,000. 1,000,000,000 The world has 20 times as many people as the U.S. Multiply by 20. 20,000,000,000 So far, we have considered only houses. Add facts about other features: oceans, lakes, rivers, mountains, deserts, islands, farm fields, barns, pastures fences, windmills, stores, factories, offices, churches, cemeteries, restaurants, theaters, parks, airports, etc. at least 500,000,000,000 Conclusion: We study geography in order to learn some skills that can help us organize and remember important facts out of the mass of information. Figure A3.1. The Numerology of Place Based Geography. A brief math lesson to illustrate the futility of trying to learn facts about every place in the world. Adpated from Gersmehl and Gersmehl, 2007.
While geography courses can contain overwhelming or daunting lists of facts if they
focus solely on place based geography, most educational efforts have a long tradition of
relying on a multitude of pedagogical approaches. One approach to avoiding the
encyclopedic method of studying geography is to focus on the five fundamental themes
in geography: location, place, relationships within places, movement and regions (Nellis,
1994; Stanfield, 2008). These themes can be addressed using a GIS as a tool in
geographic education. Previously, other scholars have recognized the appropriateness of
implementing the use of geographic information systems in the teaching of geography.
Mark and Dickerson (1991) noted the correlation of GIS use and Pattison’s (1964) four
traditions of geography – spatial analysis, regional characterization, demonstration of
human-environment interaction and modeling of earth science processes.
59
GIS allows us to answer complex spatial questions, and in fact, can be considered a
spatial decision support system that integrates data and related information about
geographical locations of the world into a digital medium. This digital medium provides
a catalyst for creative thought (White and Sims, 1993). In this sense, a GIS fosters spatial
thinking and encourages the development of a ‘habit of mind’, as opposed to rote
memorization of factual information. And in this informational age, the value of skill
memorization is being replaced with the value of being skilled at accessing and
interpreting information. With the proliferation of technology in mainstream and the
workforce, today’s students must be adept at accessing, processing, interpreting, and
working with large amounts of data. By teaching with geovisualizations, we can foster
skill with digital technologies, develop spatial thinking skill sets and use geographic
based lessons to help students move towards mastery of geographic standards, and assist
students to become masterful spatial thinkers. The emphasis should not be on the box or
the buttons, but rather the use of the tools and technologies as catalysts for deeper
learning and higher comprehension in alignment with pedagogical agendas within
educational arenas.
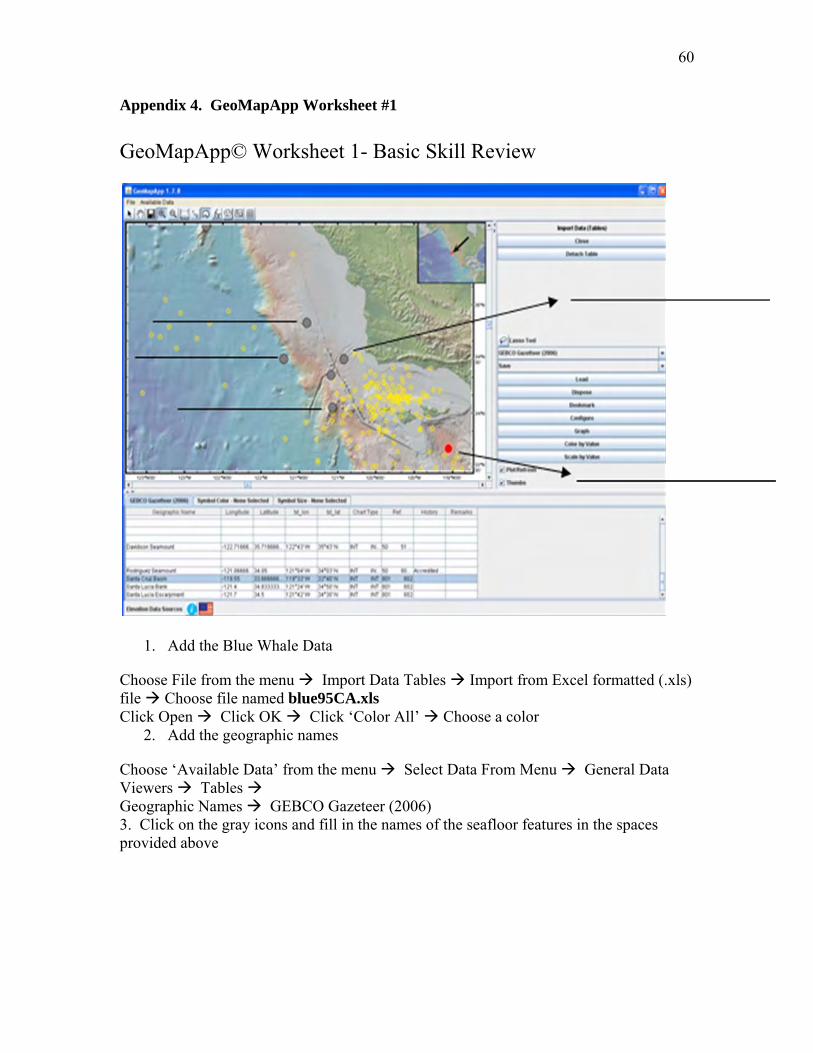
60
Appendix 4. GeoMapApp Worksheet #1 GeoMapApp© Worksheet 1- Basic Skill Review
1. Add the Blue Whale Data
Choose File from the menu Import Data Tables Import from Excel formatted (.xls) file Choose file named blue95CA.xls Click Open Click OK Click ‘Color All’ Choose a color
2. Add the geographic names
Choose ‘Available Data’ from the menu Select Data From Menu General Data Viewers Tables Geographic Names GEBCO Gazeteer (2006) 3. Click on the gray icons and fill in the names of the seafloor features in the spaces provided above
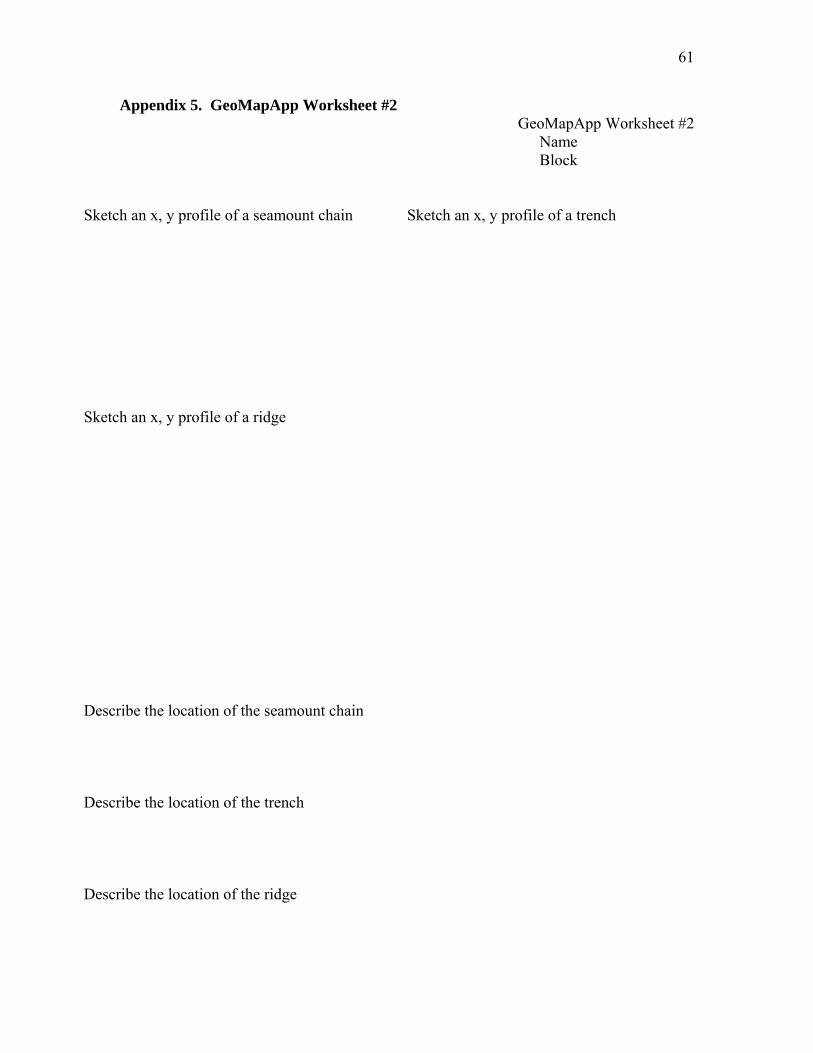
61
Appendix 5. GeoMapApp Worksheet #2 GeoMapApp Worksheet #2
Name Block
Sketch an x, y profile of a seamount chain Sketch an x, y profile of a trench Sketch an x, y profile of a ridge Describe the location of the seamount chain Describe the location of the trench Describe the location of the ridge
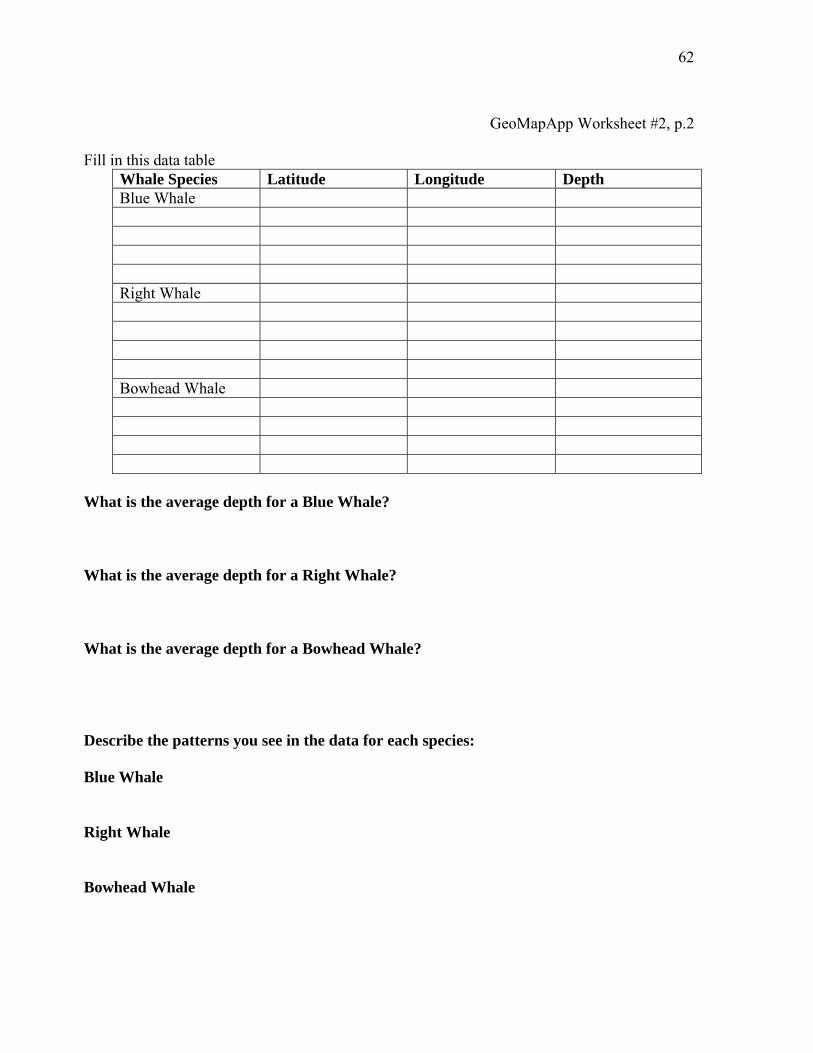
62
GeoMapApp Worksheet #2, p.2
Fill in this data table
Whale Species Latitude Longitude Depth Blue Whale Right Whale Bowhead Whale
What is the average depth for a Blue Whale? What is the average depth for a Right Whale? What is the average depth for a Bowhead Whale? Describe the patterns you see in the data for each species: Blue Whale Right Whale Bowhead Whale

63 Appendix 6. Open Ended Scenario Scenario: You are a marine mammal biologist working for the National Marine Fisheries Service. You have been asked to prepare a report about the migrations and movements of bluewhales along the Pacific Coast of North America. You must give information about the locations of the whales and the seamounts they might be feeding on. As part of your report, please propose an area in Canada, United States and Mexico for a Marine Reserve. You can propose a marine reserve area no greater than 250,000 square km. Your reserves in Mexico and the United States should include at least one seamount.
Once you have chosen your reserve, estimate and report the depth, distance from shore andslope of the seamounts inside the reserve. Draw your reserve on the map titled ‘Pacific Coastal Seamounts’
Table 1. Seamount Data for Pacific Coastal Regions of California and Baja California.
Longitude Latitude Depth of
Seamount Distance to shore
Slope of Seamount
Table 2. Seamount Data for Proposed Reserves Michelle Kinzel, Copyright 2008. Seamount Data adapted from the Baja to Bering Sea Initiative, Marine Conservation Biology Institute, www.mcbi.org.
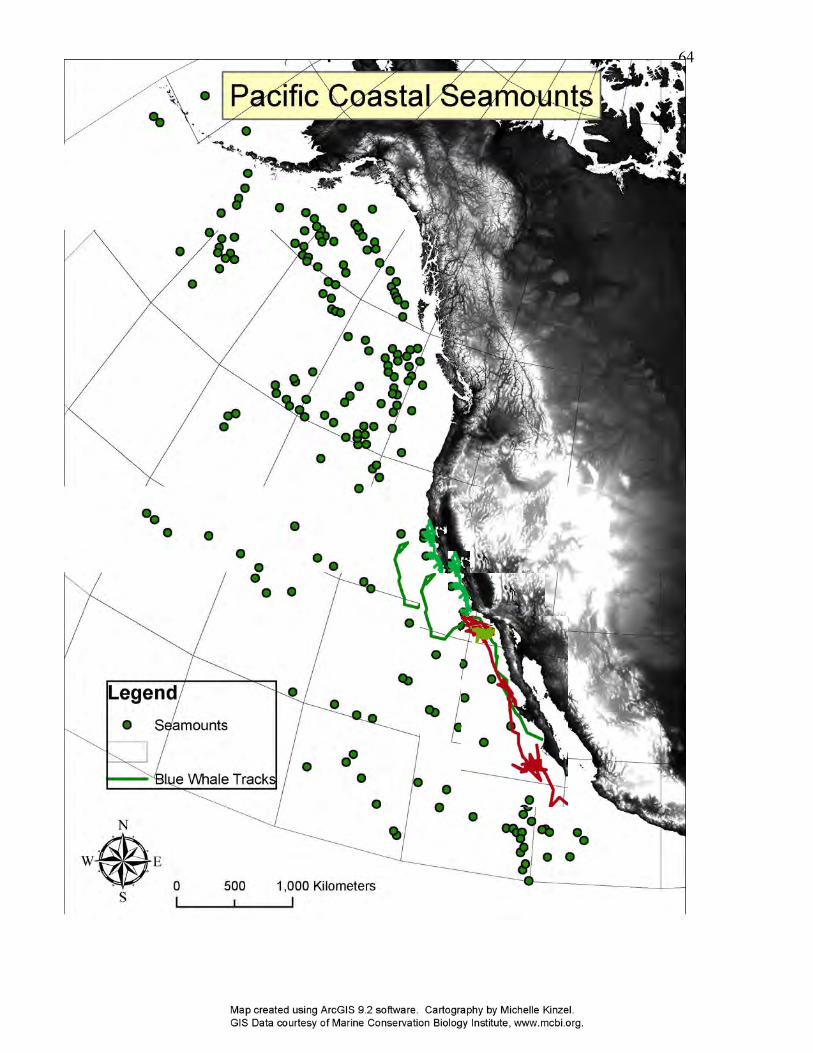
64
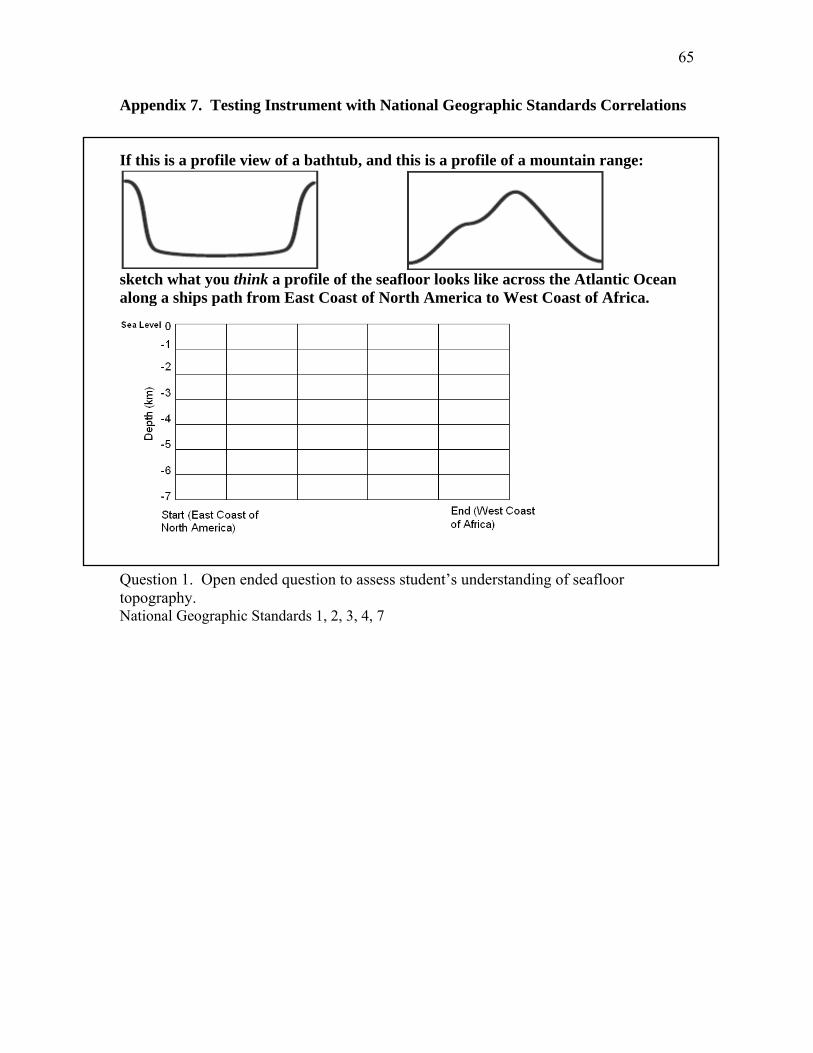
65
Appendix 7. Testing Instrument with National Geographic Standards Correlations If this is a profile view of a bathtub, and this is a profile of a mountain range:
sketch what you think a profile of the seafloor looks like across the Atlantic Ocean along a ships path from East Coast of North America to West Coast of Africa.
Question 1. Open ended question to assess student’s understanding of seafloor topography. National Geographic Standards 1, 2, 3, 4, 7
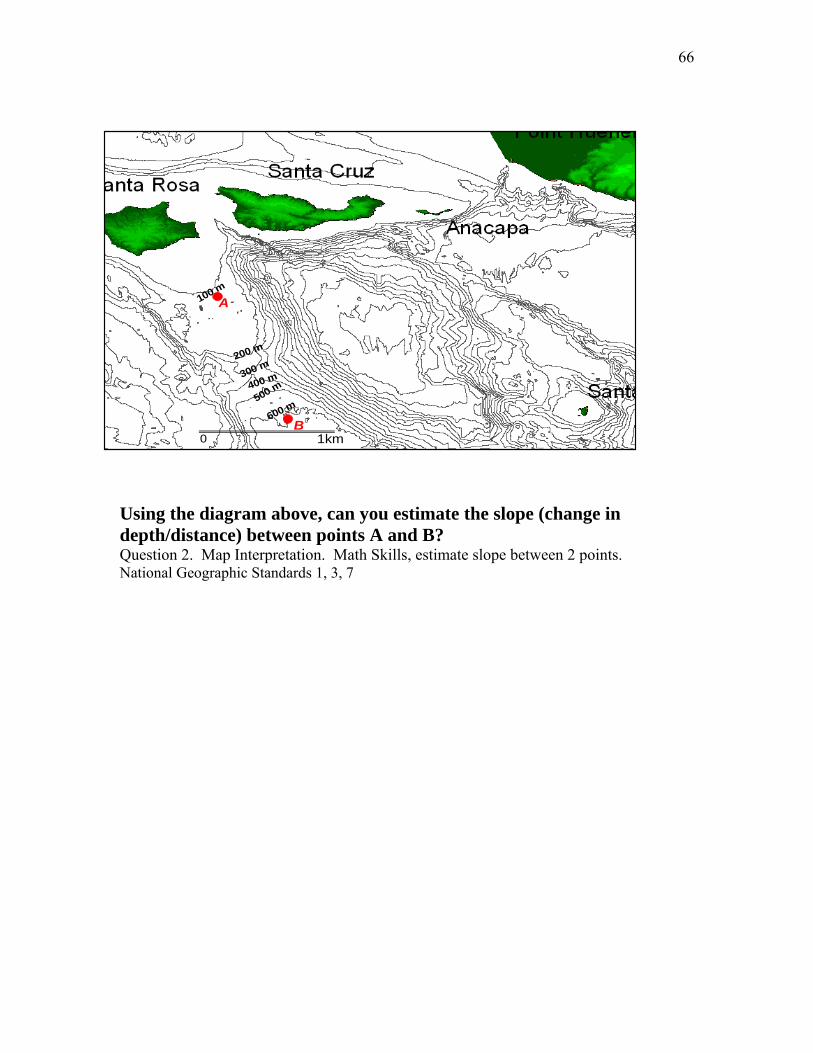
66
100 m
200 m
300 m
400 m
500 m
600 m
A
B0 1km
Using the diagram above, can you estimate the slope (change in depth/distance) between points A and B? Question 2. Map Interpretation. Math Skills, estimate slope between 2 points. National Geographic Standards 1, 3, 7

67
Instructions: Please complete the following questions. For the open ended questions, write as much as you know or can think of for the answers.
What does the x axis represent? What does the y axis represent? Question 3 and 4. Graph Interpretation National Geographic Standards 1, 3 Between 600 and 800 km along this profile line, how much does the elevation change? Question 5. Graph Interpretation. National Geographic Standards 1, 3 How would you describe the slope(change in elevation/change in distance) between 600 and 800 km: a) extremely steep b) steep c) flat d) gently sloping Question 6. Multiple Choice/Graph Interpretation. National Geographic Standards 1, 3 What is the slope in this area (change in elevation/change in distance)? Question 7. Graph Interpretation. Math Skills, estimate slope between 2 points. National Geographic Standards 1, 3
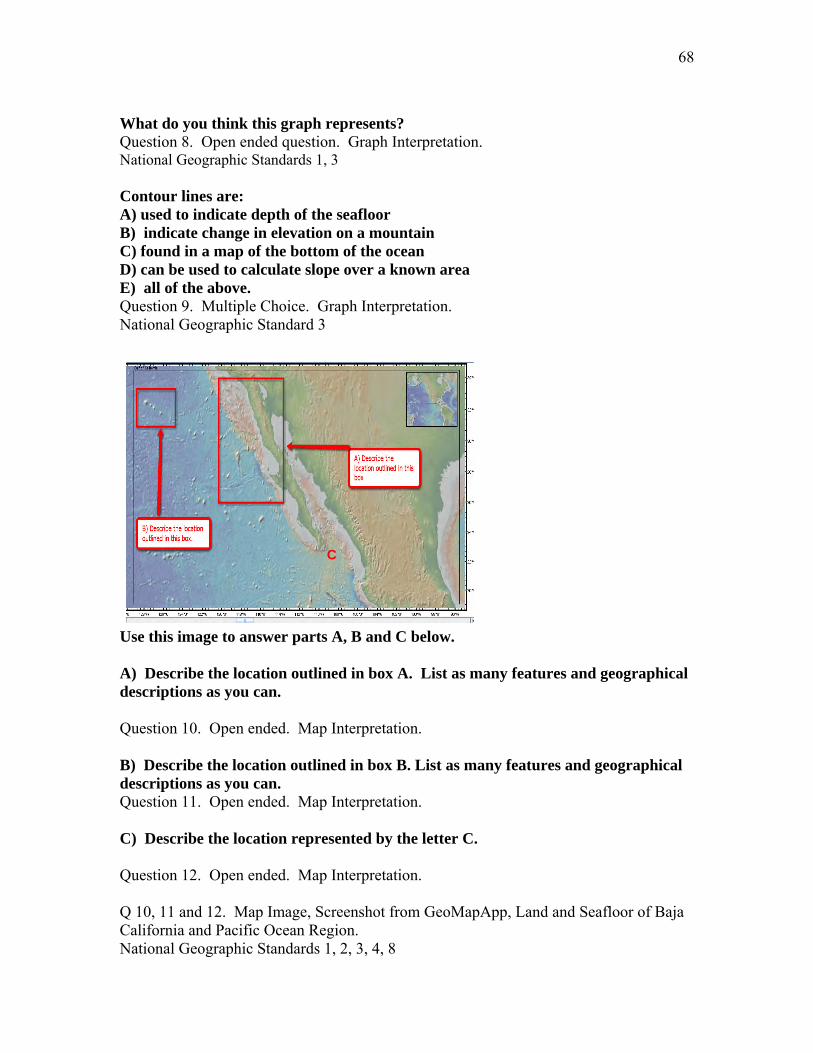
68
What do you think this graph represents? Question 8. Open ended question. Graph Interpretation. National Geographic Standards 1, 3 Contour lines are: A) used to indicate depth of the seafloor B) indicate change in elevation on a mountain C) found in a map of the bottom of the ocean D) can be used to calculate slope over a known area E) all of the above. Question 9. Multiple Choice. Graph Interpretation. National Geographic Standard 3
C
Use this image to answer parts A, B and C below. A) Describe the location outlined in box A. List as many features and geographical descriptions as you can. Question 10. Open ended. Map Interpretation. B) Describe the location outlined in box B. List as many features and geographical descriptions as you can. Question 11. Open ended. Map Interpretation. C) Describe the location represented by the letter C. Question 12. Open ended. Map Interpretation. Q 10, 11 and 12. Map Image, Screenshot from GeoMapApp, Land and Seafloor of Baja California and Pacific Ocean Region. National Geographic Standards 1, 2, 3, 4, 8
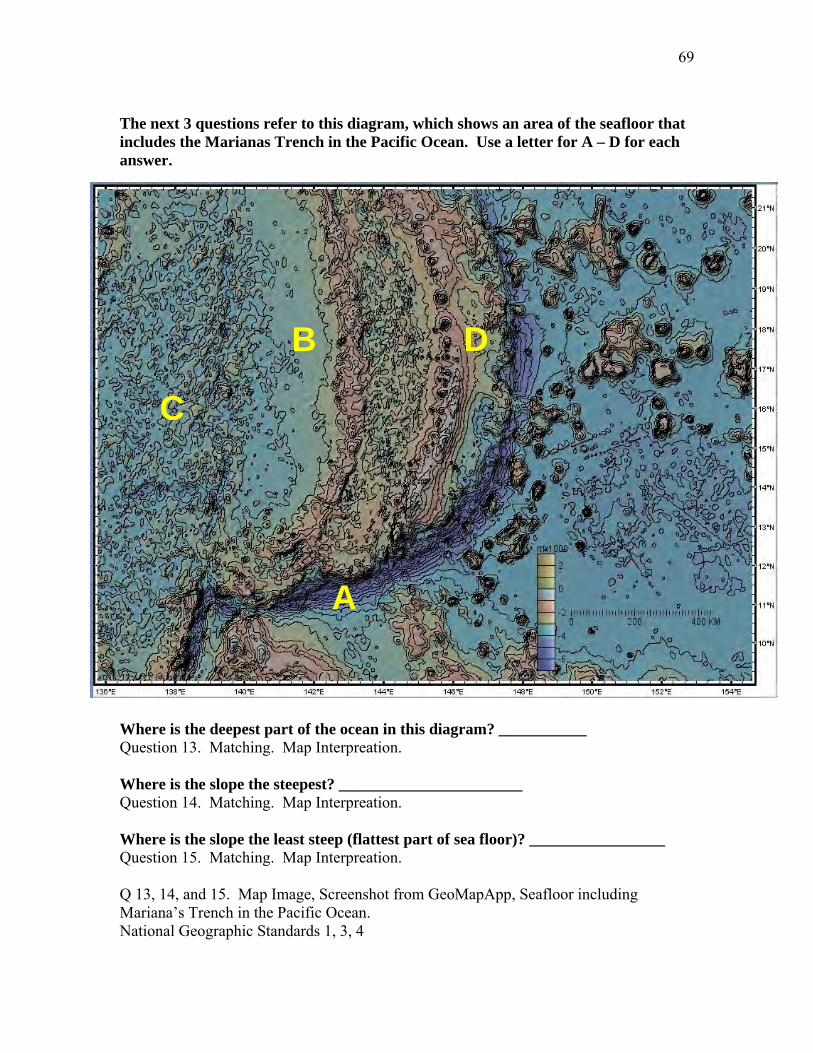
69
The next 3 questions refer to this diagram, which shows an area of the seafloor that includes the Marianas Trench in the Pacific Ocean. Use a letter for A – D for each answer.
A
B D
C
Where is the deepest part of the ocean in this diagram? ___________ Question 13. Matching. Map Interpreation. Where is the slope the steepest? _______________________ Question 14. Matching. Map Interpreation. Where is the slope the least steep (flattest part of sea floor)? _________________ Question 15. Matching. Map Interpreation. Q 13, 14, and 15. Map Image, Screenshot from GeoMapApp, Seafloor including Mariana’s Trench in the Pacific Ocean. National Geographic Standards 1, 3, 4
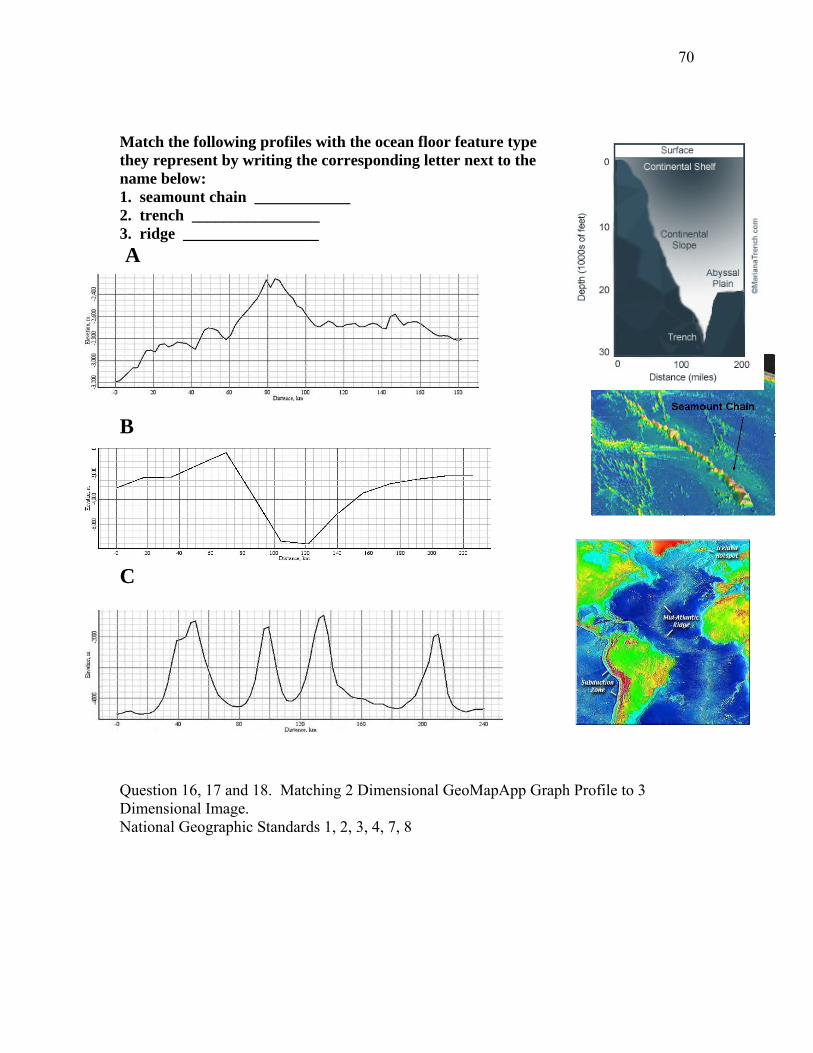
70
Match the following profiles with the ocean floor feature type they represent by writing the corresponding letter next to the name below: 1. seamount chain ____________ 2. trench ________________ 3. ridge _________________ A
B
C
Question 16, 17 and 18. Matching 2 Dimensional GeoMapApp Graph Profile to 3 Dimensional Image. National Geographic Standards 1, 2, 3, 4, 7, 8
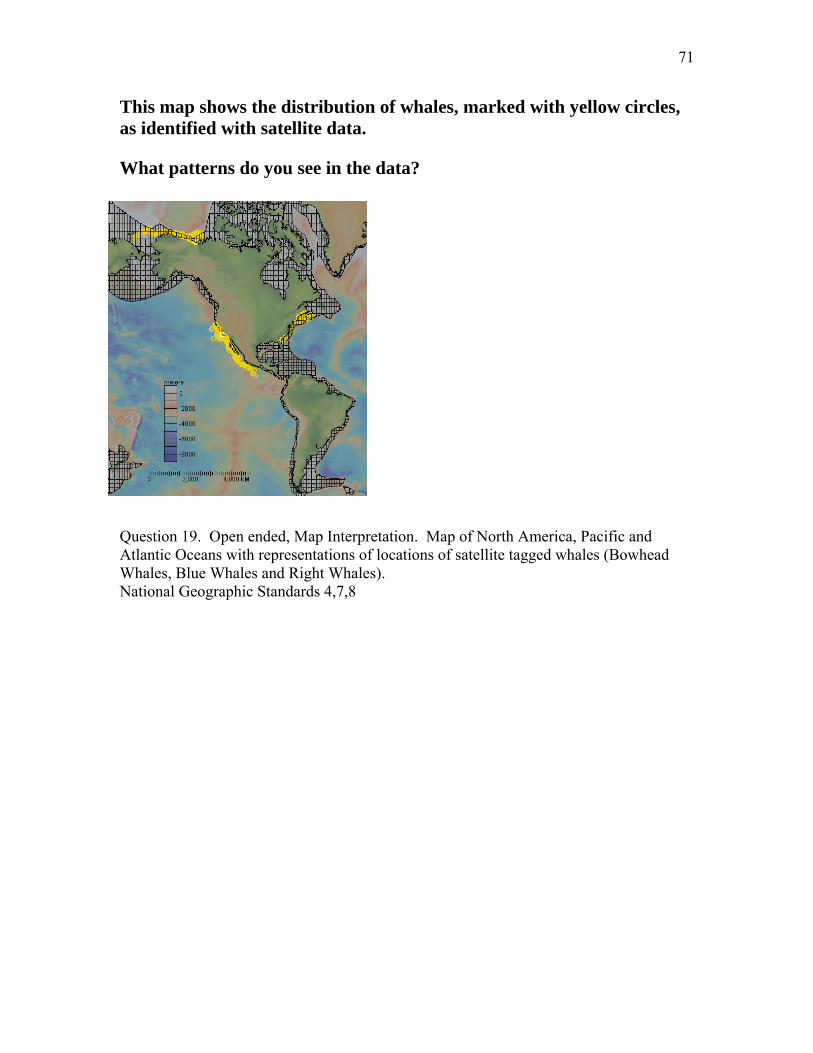
71
This map shows the distribution of whales, marked with yellow circles, as identified with satellite data. What patterns do you see in the data?
Question 19. Open ended, Map Interpretation. Map of North America, Pacific and Atlantic Oceans with representations of locations of satellite tagged whales (Bowhead Whales, Blue Whales and Right Whales). National Geographic Standards 4,7,8
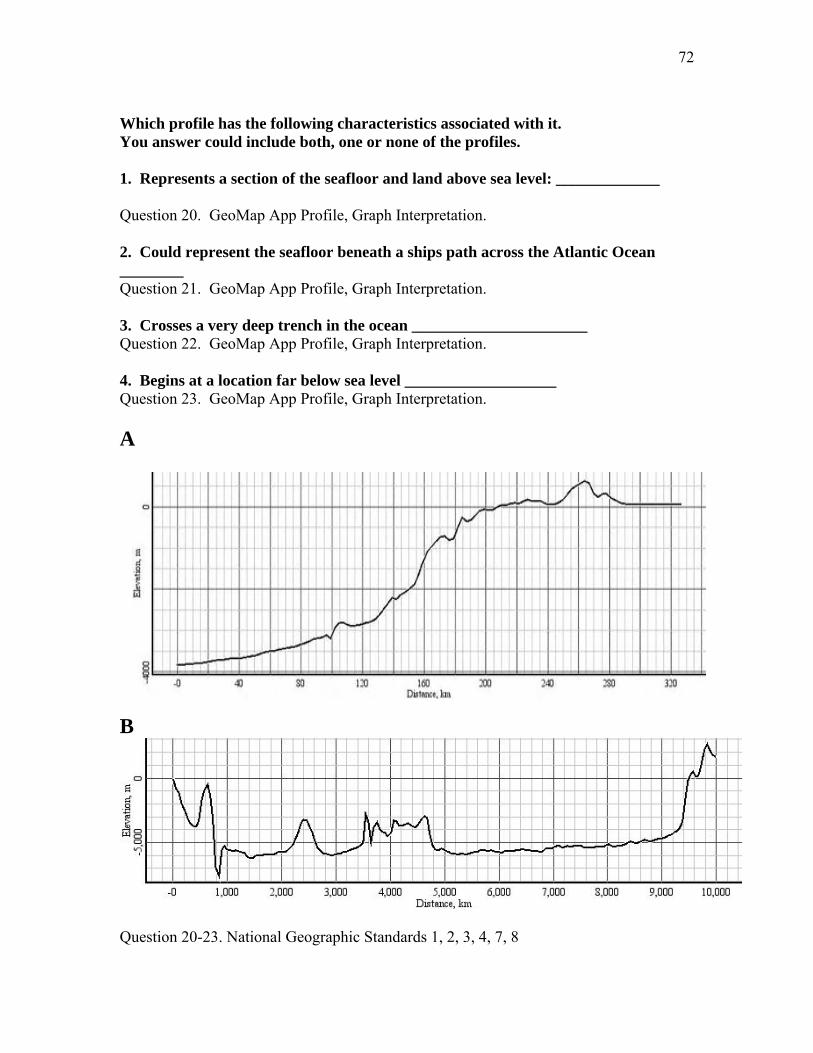
72
Which profile has the following characteristics associated with it. You answer could include both, one or none of the profiles. 1. Represents a section of the seafloor and land above sea level: _____________ Question 20. GeoMap App Profile, Graph Interpretation. 2. Could represent the seafloor beneath a ships path across the Atlantic Ocean ________ Question 21. GeoMap App Profile, Graph Interpretation. 3. Crosses a very deep trench in the ocean ______________________ Question 22. GeoMap App Profile, Graph Interpretation. 4. Begins at a location far below sea level ___________________ Question 23. GeoMap App Profile, Graph Interpretation. A
B
Question 20-23. National Geographic Standards 1, 2, 3, 4, 7, 8

73
Appendix 8. Student Self Reported Profiles, Pre-Test Survey and Post-Test Survey
Pre-test Student Survey Code Number _____________________
Please answer these questions: 1. I have used a GPS unit a. Never b. 1-2 times c. 3-5 times d. More than 5 times If you chose “d”, approximately how many times have you used a GPS unit ________ 2. I have used Google Earth a. Never b. 1-2 times c. 3-5 times d. More than 5 times If you chose “d”, approximately how many times have you used Google Earth ________ 3. I have used other Computer Mapping Software (Yes/No) If yes, the name of the software I have used 4. I play video games a. Never b. Once a week c. 2-6 times a week d. Every day 5. The number of hours per week I play video games is a. 1-2 hours b. 3-4 hours c. 5-6 hours d. 7-8 hours e. +8 hours per week If you chose e, approximately how many hours per week do you play video games _______________

74
6. What are your top 3 favorite video games? 7. If you use a computer at home or during your free time (outside of class) what activities are you most likely to do? (email, Google Earth, surf the internet, play video games, watch DVD’s, others…) Please rank your interest in the following activities 0 = I am not at all interested, and 10 = I am very interested Playing Video Games 0 1 2 3 4 5 6 7 8 9 10 Using a cell phone to talk 0 1 2 3 4 5 6 7 8 9 10 Using a cell phone for text messaging 0 1 2 3 4 5 6 7 8 9 10 Playing Online Video Games with Others 0 1 2 3 4 5 6 7 8 9 10 Surfing the Internet 0 1 2 3 4 5 6 7 8 9 10 Using Google Earth 0 1 2 3 4 5 6 7 8 9 10 Using a GPS unit to Geocache 0 1 2 3 4 5 6 7 8 9 10 Making maps with a Computer Mapping Program 0 1 2 3 4 5 6 7 8 9 10 Studying Geography 0 1 2 3 4 5 6 7 8 9 10 Using animations or video games in school 0 1 2 3 4 5 6 7 8 9 10
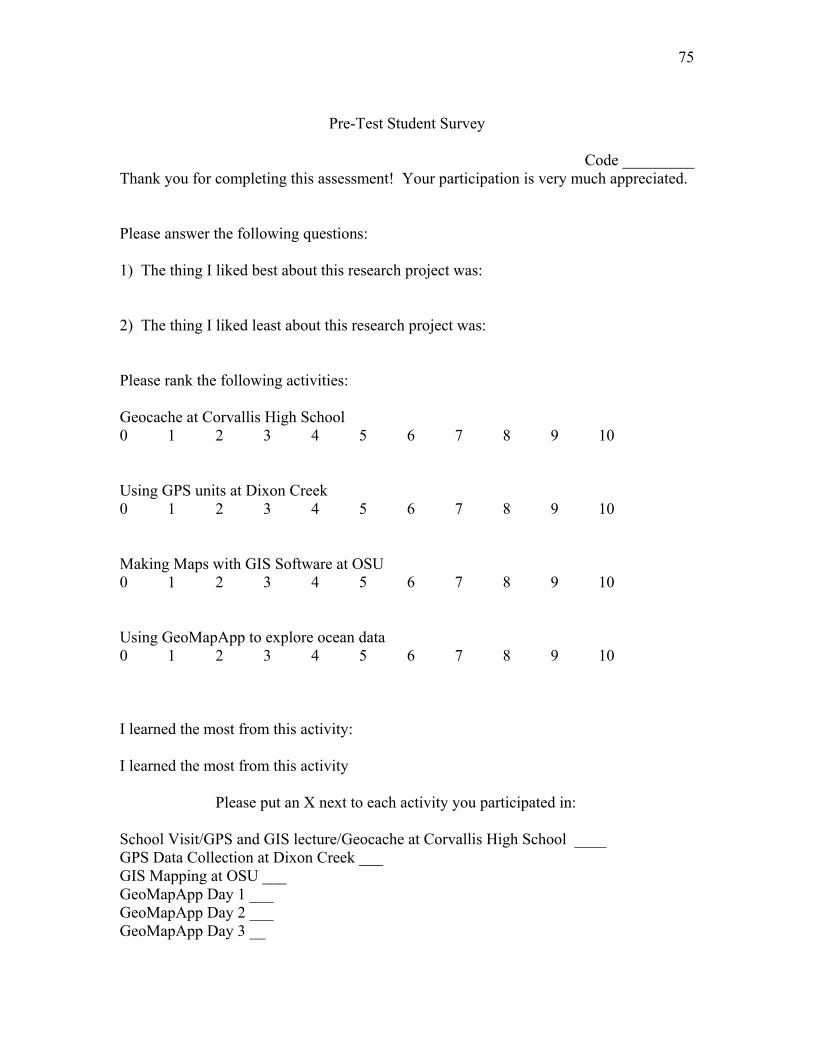
75
Pre-Test Student Survey
Code _________
Thank you for completing this assessment! Your participation is very much appreciated. Please answer the following questions: 1) The thing I liked best about this research project was: 2) The thing I liked least about this research project was: Please rank the following activities: Geocache at Corvallis High School 0 1 2 3 4 5 6 7 8 9 10 Using GPS units at Dixon Creek 0 1 2 3 4 5 6 7 8 9 10 Making Maps with GIS Software at OSU 0 1 2 3 4 5 6 7 8 9 10 Using GeoMapApp to explore ocean data 0 1 2 3 4 5 6 7 8 9 10 I learned the most from this activity: I learned the most from this activity Please put an X next to each activity you participated in: School Visit/GPS and GIS lecture/Geocache at Corvallis High School ____ GPS Data Collection at Dixon Creek ___ GIS Mapping at OSU ___ GeoMapApp Day 1 ___ GeoMapApp Day 2 ___ GeoMapApp Day 3 __
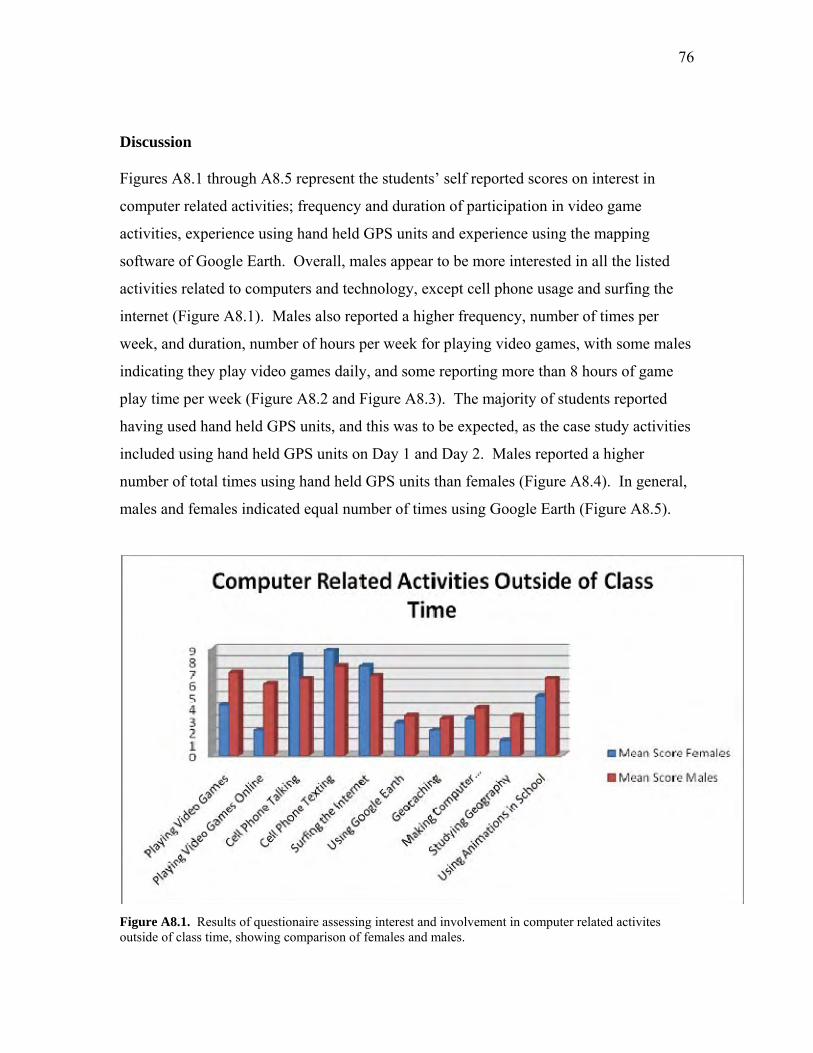
76
Discussion Figures A8.1 through A8.5 represent the students’ self reported scores on interest in
computer related activities; frequency and duration of participation in video game
activities, experience using hand held GPS units and experience using the mapping
software of Google Earth. Overall, males appear to be more interested in all the listed
activities related to computers and technology, except cell phone usage and surfing the
internet (Figure A8.1). Males also reported a higher frequency, number of times per
week, and duration, number of hours per week for playing video games, with some males
indicating they play video games daily, and some reporting more than 8 hours of game
play time per week (Figure A8.2 and Figure A8.3). The majority of students reported
having used hand held GPS units, and this was to be expected, as the case study activities
included using hand held GPS units on Day 1 and Day 2. Males reported a higher
number of total times using hand held GPS units than females (Figure A8.4). In general,
males and females indicated equal number of times using Google Earth (Figure A8.5).
Figure A8.1. Results of questionaire assessing interest and involvement in computer related activites outside of class time, showing comparison of females and males.
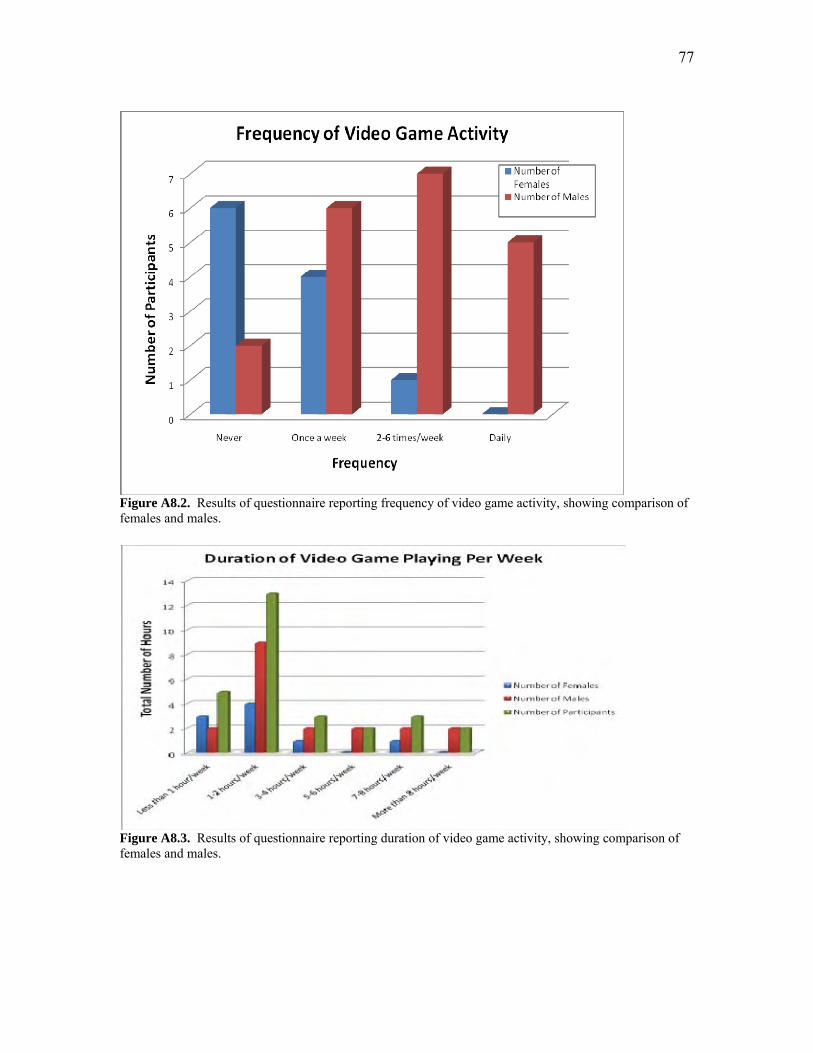
77
Figure A8.2. Results of questionnaire reporting frequency of video game activity, showing comparison of females and males.
Figure A8.3. Results of questionnaire reporting duration of video game activity, showing comparison of females and males.
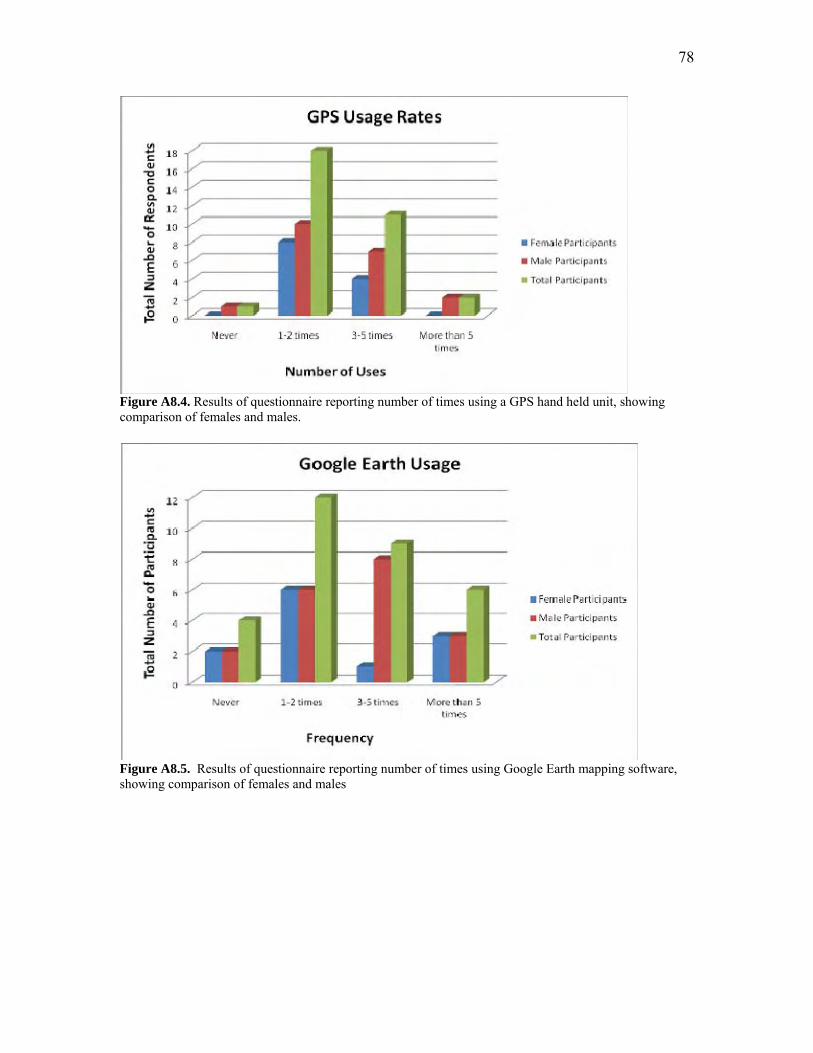
78
Figure A8.4. Results of questionnaire reporting number of times using a GPS hand held unit, showing comparison of females and males.
Figure A8.5. Results of questionnaire reporting number of times using Google Earth mapping software, showing comparison of females and males

79
Appendix 9. Detailed Summary of Student Activites. Activities Day 1. Classroom visit: 25 minute presentation on GIS, 60 minute practical exercises with GPS units around the Corvallis High School campus. Day 2. Field Data Collection: 90 minute outdoor laboratory session, GPS units used to collect geospatial data at Dixon Creek. Day 3. ArcGIS 9.1 computer session; imported data into a project, changed cartographic symbology, created jpeg map layouts. Day 4. Pre Assessment Testing Pre Test (Appendix 8)
1. Questionnaire to assess experience and interest with various types of technology a. GPS b. Google Earth c. Computer Mapping Software (e.g. ArcGIS) d. Video Games e. Animations f. Cell Phones
2. 28 question instrument a. open ended questions, multiple choice questions, matching b. graph interpretation, map interpretation, 2D to 3D visualization (spatial thinking), geographic literacy, mathematical skills Day 5. Introduction to GeoMapApp: Earth Exploration Toolbox Chapters 1, 2 and 4. Day 6. Practice with GeoMapApp: Worksheet 1 (Appendix 4) and Worksheet 2 (Appendix 5) 1. sketch profiles of seamount chain, trench and ridge 2. describe location of seamount chain, trench and ridge 3. Whale data table; lat/long/depth 4. Average depth of whale by species 5. Describe patterns you see for each species Day 7. Open Ended Scenario Activity (Appendix 6) Day 8. Post Assessment Testing Post test – The testing instrument was re-administered to the same students participants
upon completion of the three classroom sessions to evaluate changes in competencies,
and proficiencies in grade appropriate math, science, geography and spatial literacy
skills among the students.

80
Post Test
1. Questionnaire of student self evaluation of like/dislikes during activities, ranking of activities; geocache, Dixon Creek field work, computer sessions including map making with ArcGIS 9.1 software at Oregon State University, GeoMapApp computer activities on a scale of 1-10. (Appendix 8)
2. 23 question instrument (repeated questions 1-23 from pre test testing instrument, Appendix 7).
Materials used during the classroom sessions included:
• Lecture of conceptual material with Powerpoint slides and visuals (globes, paper maps and GPS units).
• Testing instrument (Appendix 7) • GeoMapApp Worksheet 1 (Appendix 4) • GeoMapApp Worksheet2 (Appendix 5) • Scenario (Appendix 6)
All research was granted approval on May 16, 2008, by the Oregon State University and
the Institutional Review Board process of review for research involving human subjects,
as Study Number 3925, Developing Educational Tools and Integrative Experiences Via
Geovisualization. All students considered minors, under 18 years of age, obtained parental
consent (Appendix 10). All students over 18 years of age indicated their permission to
participate in the study with a letter of assent (Appendix 11). To protect the identities of
the students and maintain confidentiality, all direct identifiers were removed from pre and
post assessments and worksheets. Codes were assigned to students using a random
numbers generator, and a code list was maintained separate from all documents during
the classroom sessions and data analysis. The master code list is maintained in written
format in a locked office and locked filing cabinet, as well as electronically on a
password protected computer, separate from the assessments, analysis and access of the
student researcher.
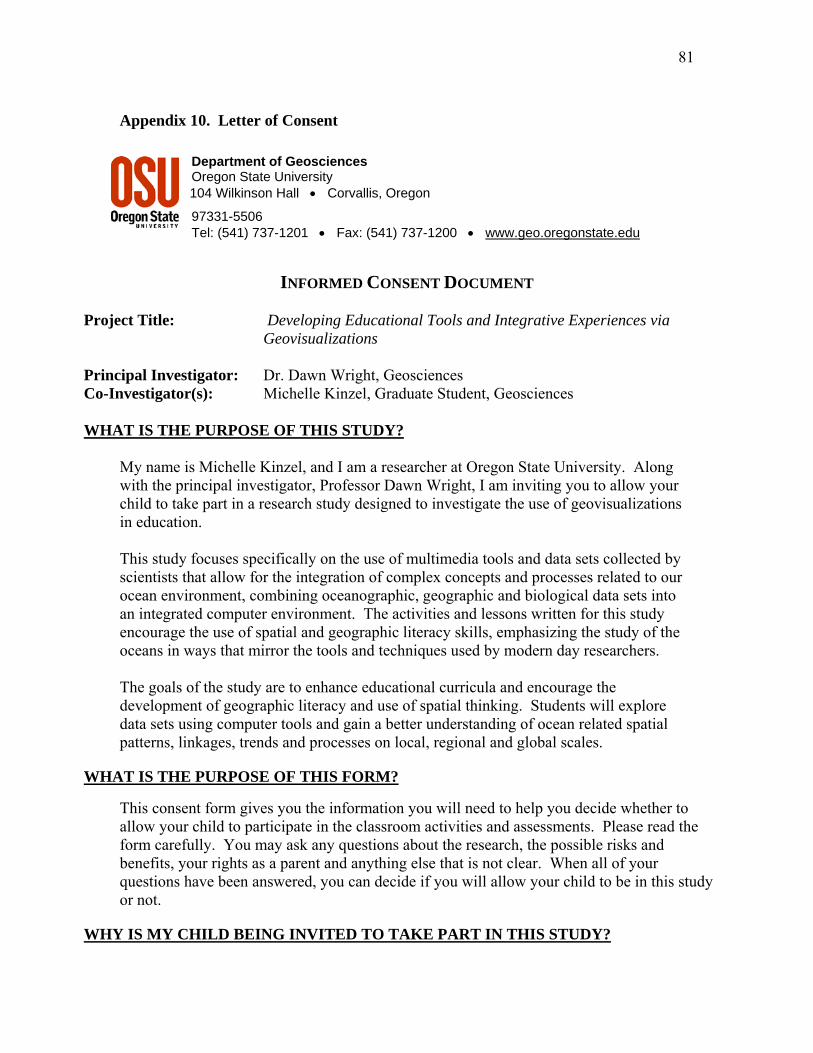
81
Appendix 10. Letter of Consent
Department of Geosciences Oregon State University
104 Wilkinson Hall • Corvallis, Oregon 97331-5506 Tel: (541) 737-1201 • Fax: (541) 737-1200 • www.geo.oregonstate.edu
INFORMED CONSENT DOCUMENT
Project Title: Developing Educational Tools and Integrative Experiences via Geovisualizations
Principal Investigator: Dr. Dawn Wright, Geosciences Co-Investigator(s): Michelle Kinzel, Graduate Student, Geosciences WHAT IS THE PURPOSE OF THIS STUDY?
My name is Michelle Kinzel, and I am a researcher at Oregon State University. Along with the principal investigator, Professor Dawn Wright, I am inviting you to allow your child to take part in a research study designed to investigate the use of geovisualizations in education. This study focuses specifically on the use of multimedia tools and data sets collected by scientists that allow for the integration of complex concepts and processes related to our ocean environment, combining oceanographic, geographic and biological data sets into an integrated computer environment. The activities and lessons written for this study encourage the use of spatial and geographic literacy skills, emphasizing the study of the oceans in ways that mirror the tools and techniques used by modern day researchers. The goals of the study are to enhance educational curricula and encourage the development of geographic literacy and use of spatial thinking. Students will explore data sets using computer tools and gain a better understanding of ocean related spatial patterns, linkages, trends and processes on local, regional and global scales.
WHAT IS THE PURPOSE OF THIS FORM?
This consent form gives you the information you will need to help you decide whether to allow your child to participate in the classroom activities and assessments. Please read the form carefully. You may ask any questions about the research, the possible risks and benefits, your rights as a parent and anything else that is not clear. When all of your questions have been answered, you can decide if you will allow your child to be in this study or not.
WHY IS MY CHILD BEING INVITED TO TAKE PART IN THIS STUDY?

82
Your child is being invited to take part in this study because he/she is a currently enrolled student at Corvallis High School. We are designing lessons that will be used in grades 9-12, incorporating cutting edge techniques and scientific data sets from researchers in oceanographic and geographic scientific communities and wish to test the effectiveness of our techniques and methods.
WHAT WILL HAPPEN DURING THIS STUDY AND HOW LONG WILL IT TAKE?
If you choose to allow your child to participate in this study during regular class time, your child will explore scientific data sets with multimedia tools in the computer lab at their school. The assessments will consist of questions designed to measure the use of spatial thinking skills and acquisition of geographic literacy. The assessments will be anonymous, and no identifiable data will be used in the study. There will be no names or student identifiers collected, and the assessments examined by the student researcher on the project will be completely anonymous.
If you agree to allow your child to participate in the study, their involvement will last for approximately three classroom sessions, for a total of 285 minutes.
WHAT ARE THE RISKS OF THIS STUDY?
The possible risks and/or discomforts associated with the procedures described in this study include: The only risks anticipated are minimal risks during the testing session associated with normal student activities of test taking and using a computer terminal in a secure classroom. A minimal risk is involved in protecting the confidentiality of the assessments (testing scores) of the students involved in the study.
WHAT ARE THE BENEFITS OF THIS STUDY?
Your child will receive the direct benefit of using multimedia cutting edge technology and use of real world scientific data from participating in this study. Additionally, we hope that the information gathered from this study will improve the quality of science education for grades 9-12.
WILL MY CHILD BE PAID FOR PARTICIPATING?
Your child will not be paid for being in this research study.
WHO WILL SEE THE INFORMATION I GIVE?
The information collected during this research study will be kept confidential to the extent permitted by law. To help protect your confidentiality, we will: • Ensure that the assessments and analysis are kept separate and in a secure location, i.e.,
only on a password secured laptop and locking filing cabinet maintained in the research institutions laboratory at Oregon State University.
83
• Refrain from collecting student names and assign random numerical identifiers to all assessment materials.
• Use random numerical identifiers or pseudonyms on assessment materials if the results are published in a scientific journal, at a professional science meeting, or in a thesis manuscript.
• Keep code lists and data files in separate secure locations. We will keep one copy of the code list on a password protected computer and another hard copy in a locked file cabinet.
• Use and protect all computer passwords and lock combinations/keys. If the results of this project are published student identities will not be made public, nor will the results be tracked or related to individual names before, during or after the research. The student researcher will not have access to individual student names while assessing, analyzing or reporting results from this study.
DO I HAVE A CHOICE FOR MY CHILD TO BE IN THE STUDY?
If you decide to allow your child to take part in the study, it should be because you approve of your child participating in an educational project. Your child will not be treated differently as a student if you decide to not allow them to take part in the study. Students not granted permission to participate in the computer laboratory sessions will attend their regularly scheduled classroom sessions.
WHAT IF I HAVE QUESTIONS? If you have any questions about this research project, please contact:
• Principal Investigator: Dawn Wright 541-737-1229 [email protected]
• Co-Investigator: Michelle Kinzel 541-737-8818 [email protected]
If you have questions about your child’s rights as a participant, please contact the Oregon State University Institutional Review Board (IRB) Human Protections Administrator, at (541) 737-4933 or by email at [email protected].
Your signature indicates that this research study has been explained to you, that your questions have been answered, and that you agree to allow your child to take part in this study. You can receive a copy of this form by contacting Michelle Kinzel, [email protected]. Parent/Guardian Name/ Participant's (Student) Name (printed): ___________________________________________________________________________ __________________________________________ _______________________________ (Signature of Parent/Guardian) (Date)
Oregon State University • IRB Study #:3925 Approval Date: 05/16/08 Expiration Date: 05/15/09
84
Appendix 11. Letter of Assent Department of Geosciences Oregon State University 104 Wilkinson Hall • Corvallis, Oregon 97331-5506 Tel: (541) 737-1201 • Fax: (541) 737-1200 • www.geo.oregonstate.edu
ASSENT DOCUMENT
Project Title: Developing Educational Tools and Integrative Experiences via Geovisualizations Principal Investigator: Dr. Dawn Wright, Department of Geosciences Co-Investigator(s): Michelle Kinzel, Graduate Student, Department of Geosciences We are doing a research study on the use of multimedia tools in high school curriculum. We are trying to find out how to improve educational practices using computer tools, or geovisualizations. This form contains information about the study, so that you can decide if you want to be in the study or not. You can ask any questions. After all of your questions have been answered, you can decide if you want to be in this study or not. If you decide that you want to be in this study, we will ask you to complete hands-on lessons using the computer lab at your school and oceanographic data sets. We will meet for 3 class periods of 95 minutes each. We want to tell you about some things that might happen to you if you are in this study and what to expect. You will be expected to work on the computers for some or all of the 90 minute class session. If you decide to be in this study, some of the expected benefits include an improvement in your geographic knowledge, spatial thinking skills and/or computer skills. We are not certain these improvements will occur. We may also discover methods and information that will help us design effective tools and lessons for use by other students and teachers. You do not have to take part in this study if you do not want to. You can use the class time to meet with the teacher’s aide in your regular classroom instead of in the computer lab. When we are done with the study, we will write a report about our observations and results. We will not use your name in the report. You do not have to participate in the study, the choice is yours. If you agree to begin the study but want to discontinue during the process, you merely need to inform one of the instructors. If you want to be in this study, please sign your name. I, ____________________________________, want to be in this research study.
(Print your name here) _____________________________________ _________________
(Sign your name here) (Date) Oregon State University • IRB Study #:3925 Approval Date: 05/16/08 Expiration Date: 05/15/09