Embed Size (px)
Citation preview
Using Dataflow Diagrams – Part 2
Systems Analysis and Design, 7e
Kendall & Kendall
7
© 2008 Pearson Prentice Hall
Kendall & Kendall 7-2
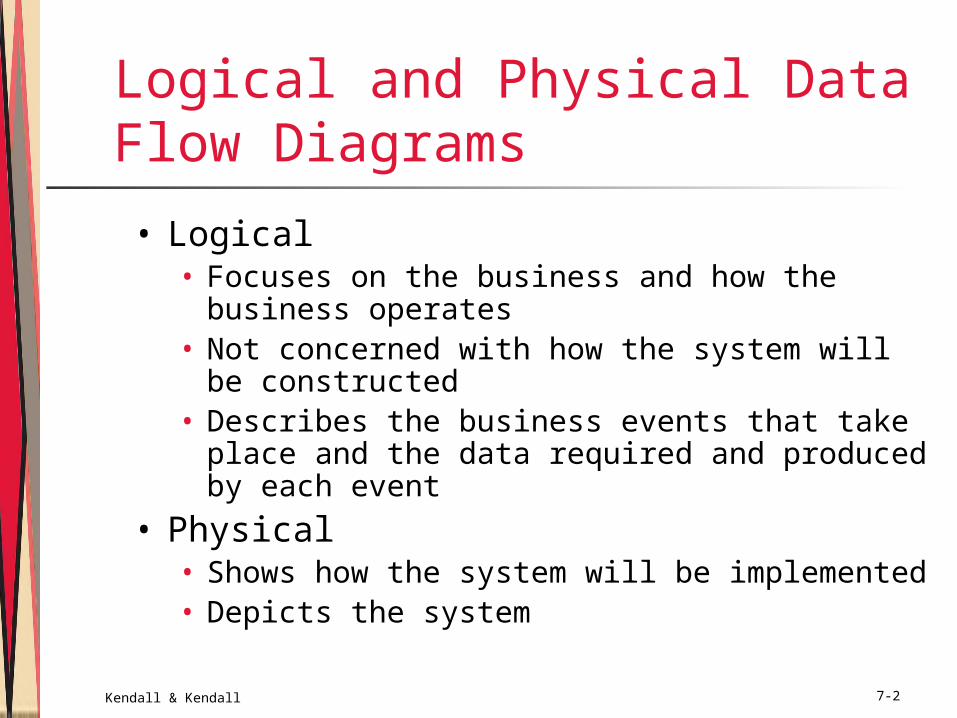
Logical and Physical Data Flow Diagrams
• Logical• Focuses on the business and how the
business operates• Not concerned with how the system will be
constructed• Describes the business events that take
place and the data required and produced by each event
• Physical• Shows how the system will be implemented• Depicts the system
Kendall & Kendall 7-3
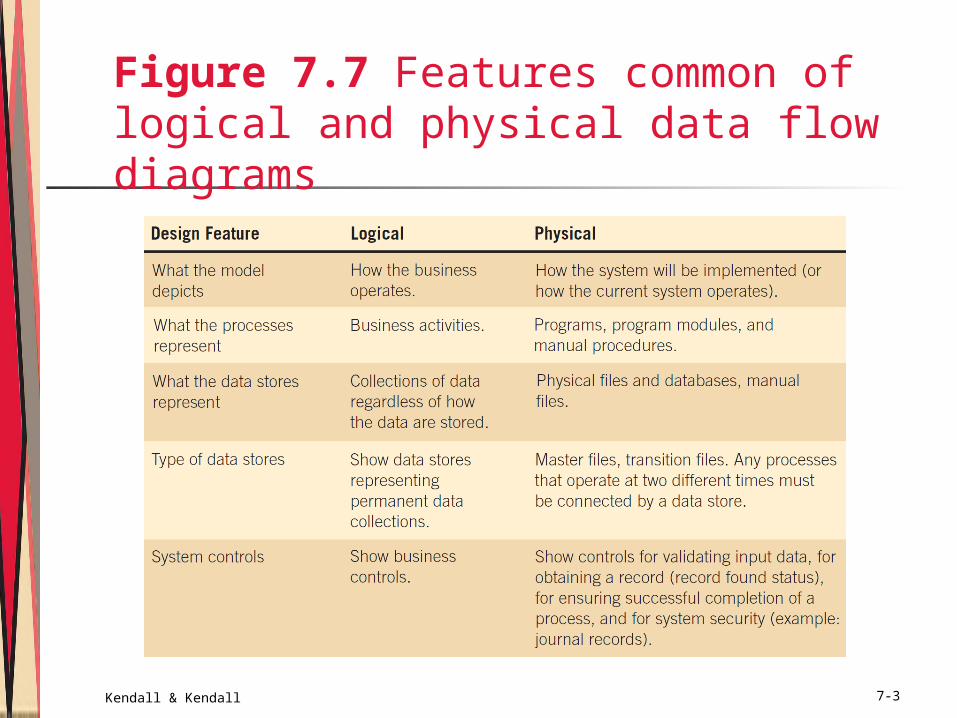
Figure 7.7 Features common of logical and physical data flow diagrams
Kendall & Kendall 7-4
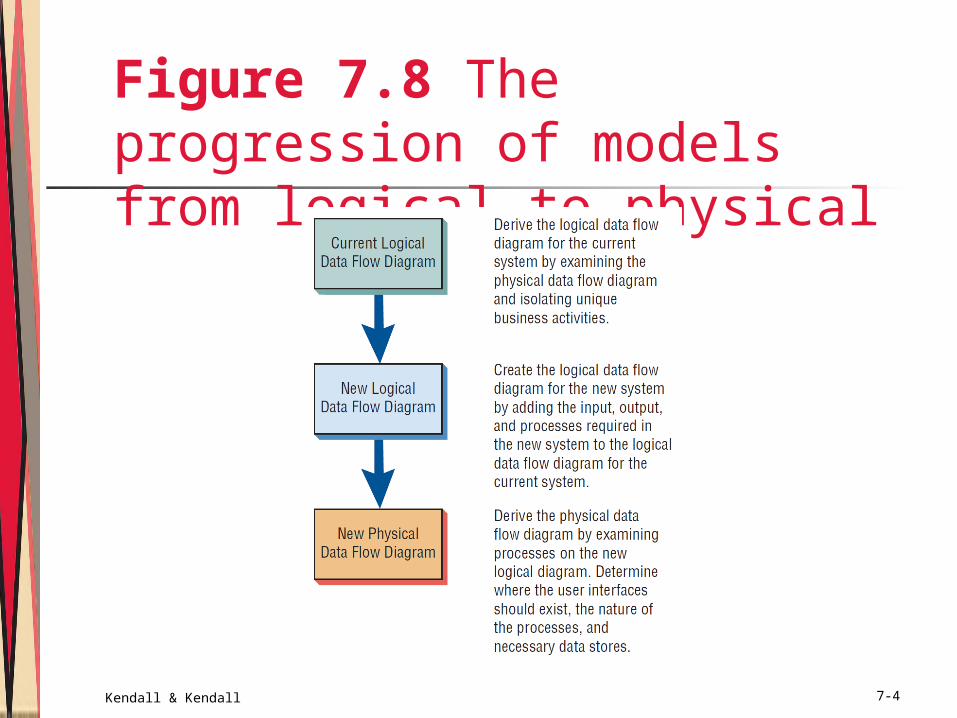
Figure 7.8 The progression of models from logical to physical
Kendall & Kendall 7-5
Developing Logical Data Flow Diagrams• Better communication with users• More stable systems• Better understanding of the
business by analysts• Flexibility and maintenance• Elimination of redundancy and
easier creation of the physical model
Kendall & Kendall 7-6
Developing Physical Data Flow Diagrams
• Clarifying which processes are performed by humans and which are automated
• Describing processes in more detail• Sequencing processes that have to be
done in a particular order• Identifying temporary data stores • Specifying actual names of files and
printouts• Adding controls to ensure the processes
are done properly
Kendall & Kendall 7-7
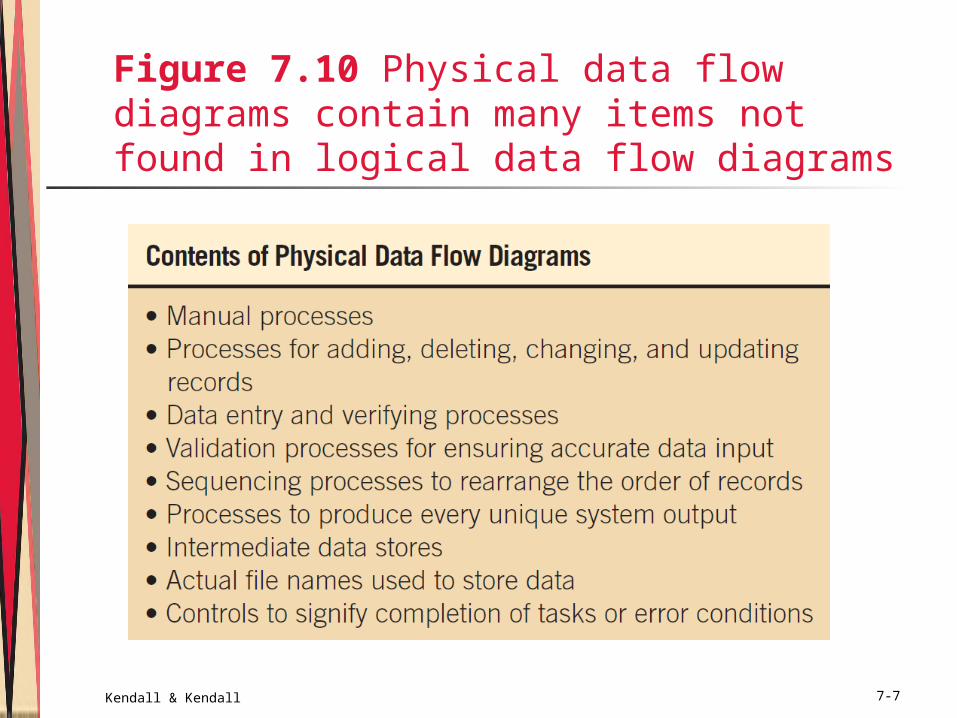
Figure 7.10 Physical data flow diagrams contain many items not found in logical data flow diagrams
Kendall & Kendall 7-8
Event Modeling and Data Flow Diagrams
• An input flow from an external entity is sometimes called a trigger because it starts the activities of a process
• Events cause the system to do something and act as a trigger to the system
• An approach to creating physical data flow diagrams is to create a data flow diagram fragment for each unique system event
Kendall & Kendall 7-9
Event Response Tables
• An event table is used to create a data flow diagram by analyzing each event and the data used and produced by the event
• Every row in an event table represents a data flow diagram fragment and is used to create a single process on a data flow diagram
Kendall & Kendall 7-10
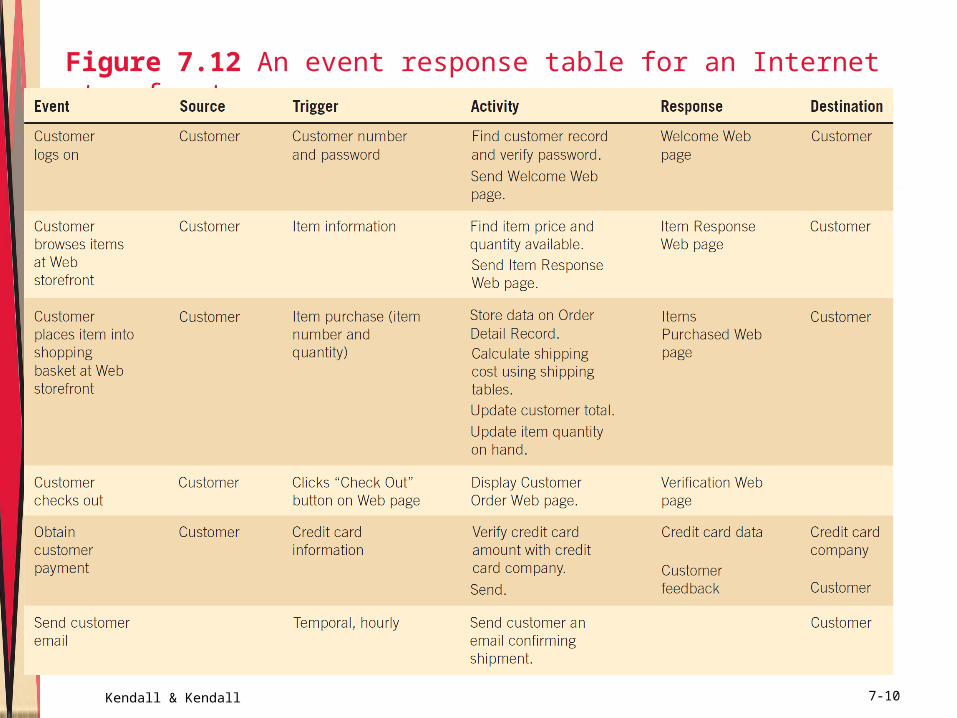
Figure 7.12 An event response table for an Internet storefront
Kendall & Kendall 7-11
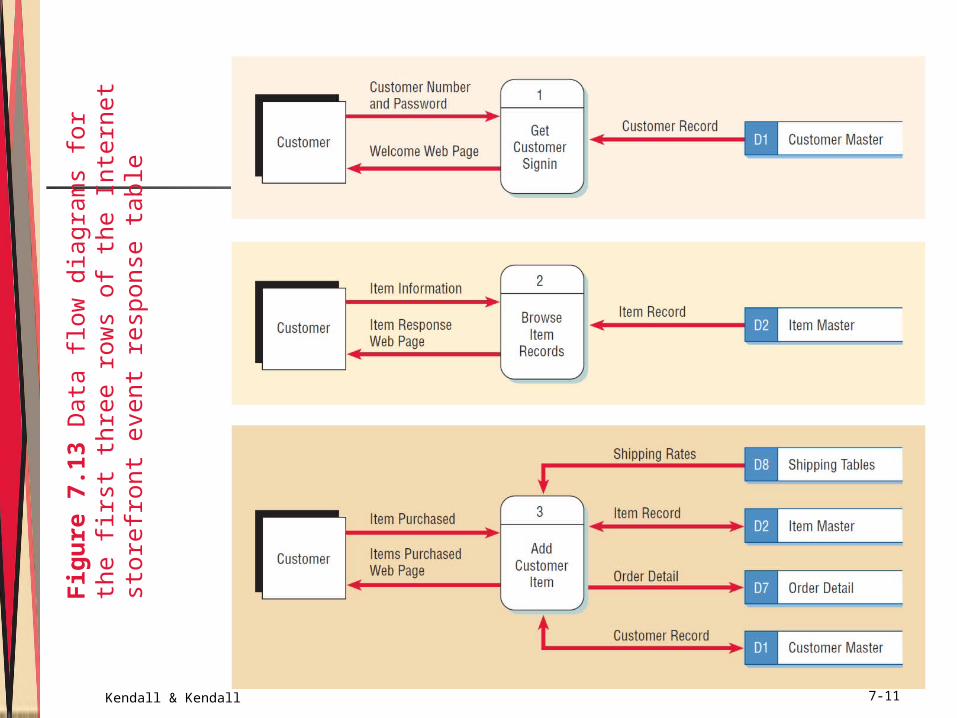
Fig
ure
7.1
3 D
ata
flow
dia
gra
ms
for
the fi
rst
thre
e r
ow
s of
the In
tern
et
store
front
even
t re
sponse
table
Kendall & Kendall 7-12
Use Cases and Data Flow Diagrams• Each use case defines one activity
and its trigger, input, and output • Allows the analyst to work with
users to understand the nature of the processes and activities and then create a single data flow diagram fragment
Kendall & Kendall 7-13
Partitioning Data Flow Diagrams
• Partitioning is the process of examining a data flow diagram and determining how it should be divided into collections of manual procedures and computer programs
• A dashed line is drawn around a process or group of processes that should be placed in a single computer program
Kendall & Kendall 7-14
Reasons for Partitioning
• Different user groups• Timing• Processes may be separated into
different programs for security• Similar tasks• Efficiency• Consistency• Security
Kendall & Kendall 7-15
Partitioning Web Sites
• Improves the way humans use the site
• Improves speed of processing• Ease of maintaining the site• Keep the transaction secure
Kendall & Kendall 7-16
Communicating Using Data Flow Diagrams
• Use unexploded data flow diagrams early when ascertaining information requirements
• Meaningful labels for all data components
Kendall & Kendall 7-17
Summary
• Data flow diagrams• Structured analysis and design tools
that allow the analyst to comprehend the system and subsystems visually as a set of interrelated data flows
• DFD symbols• Rounded rectangle• Double square• An arrow• Open-ended rectangle
Kendall & Kendall 7-18
Summary (Continued)
• Creating the logical DFD• Context-level data flow diagram• Level 0 logical data flow diagram• Child diagrams
• Creating the physical DFD• Create from the logical data flow
diagram• Partitioned to facilitate programming
Kendall & Kendall 7-19
Summary (Continued)
• Partitioning data flow diagrams• Whether processes are performed by
different user groups• Processes execute at the same time• Processes perform similar tasks• Batch processes can be combined for
efficiency of data• Processes may be partitioned into
different programs for security reasons