Embed Size (px)
Citation preview

© 2018. All rights reserved. | Premier Inc. | 1© 2018. All rights reserved. | Premier Inc.
Using Data to Improve the
Community’s Health
November 15, 2018

© 2018. All rights reserved. | Premier Inc. | 2
Today’s objectives
1. Overview of trends in value based care that all providers and
support organizations should know
2. Description of available community health improvement data
3. What is needed to illustrate your value
4. Premier’s Value Based Care (VBC) resources and white papers

© 2018. All rights reserved. | Premier Inc. | 3
Introduction / Purpose
“The health of the people is the foundation upon
which all of their happiness and all of their
powers as a community depend.”
~ Benjamin Disraeli

© 2018. All rights reserved. | Premier Inc. | 4
Key Definitions
Population Health Management
• …managing the care for a defined set of individuals with the goal of improving the quality, efficiency and patient satisfaction (the Triple Aim™) and lowering the cost trend for the overall group.
Value-Based care (VBC)
• …health care that is based on the value of a service provided rather than the volume of services.
• Using evidenced-based care while taking into account patient preferences.
Value-Based payment (VBP)
• …a fundamental shift from fee-for-service, which is volume based, to payments related to outcomes, or the value provided.
• It is a strategy used to promote quality and value of health care services with a goal to slow the total cost of care.

© 2018. All rights reserved. | Premier Inc. | 5
The journey to population health management
Care redesign should not outpace reimbursement changes…
new payment mechanisms must be secured to support the care model
• Global or total cost of care
payment
• Bundled payments /
gainsharing
• ACOs/shared savings
• Care management PMPMs
• Reimbursement cuts
• Value-based reimbursement
• Pay for performance contracts
• Tiered networks / payments
1.
Preparatory
2. Transformational
3. Implementation
4. Expansion
• Establish insurance risk
capability
• Measure and monitor
population health efforts
• Narrow the network
• Grow covered lives
• Manage episodes
longitudinally
• Address complex cases
• Initiate care coordination
• Employ data analytics
• Utilize provider alignment
models
• Manage costs to reimbursement
• Maximize performance
• Engage providers
• Develop network
• Capitalize on payment incentives
• Balance the service portfolio/
growth strategies
Necessary capabilities evolve by stage:
Changing reimbursement models:
ACO – accountable care organization; PMPM – per member per month

© 2018. All rights reserved. | Premier Inc. | 6
Value-based payment market segments
Employee Health Plan
Uninsured
Medicare ACO
Medicare Advantage
Medicaid
Commercial Health Plans
Direct to Employer

© 2018. All rights reserved. | Premier Inc. | 7
Value Based Payment Models
• Centers for Medicare and Medicaid (CMS)
− Medicare Value Based Purchasing (VBP) program for hospitals focuses upon
readmissions, Hospital-Acquired Conditions (HACs), and cost
− CMS Bundled Payment (Bundled Payment for Care Improvement (BPCI), Oncology
Care Model (OCM), Comprehensive Care for Joint Replacement Model (CJR), and
BPCI-Advanced)
− CMS Medicare Accountable Care Organization (ACO) Models (Pioneer, Medicare
Shared Savings Program (MSSP), Next Generation ACO Model (NextGen)
− Medicaid Value Based Payment Models (Consumer Driven Health Plan (CDHP),
Delivery System Reform Incentive Payment Program (DSRIP), Medicaid Managed
Care etc.)
− Comprehensive Primary Care Plus (CPC+)
− Medicare Advantage (MA)
• Commercial
− HMO, PPO
− Direct to Employers (e.g. Boeing, Booz Allen Hamilton, Whole Foods, etc.)
− Federal, State Commercial Exchanges
− Bundled Payment

© 2018. All rights reserved. | Premier Inc. | 8
Keys to Success –National Payers’ Perspectives
1. Highly engaged leadership –Clinical partners, financial partners, managed care, at the highest levels.
2. Alignment of incentives with physicians and other providers.
3. Payer/provider trust and collaboration is vital –Developed through transparency around shared information, tools and resources.
4. Payer agnostic programs including, analytics and performance improvement support teams. Some payers are attempting to develop and sell these services to providers.
5. Active joint operating committees with both payer and provider representation.
6. Focused action plans to improve performance in key areas.
7. Clinical performance data sharing at the subgroup and individual provider level.
8. Active management of clinical improvement plans as well as a well defined care management processes.
Source: Premier’s Annual Value Based Commercial Payment Contracting Arrangements Meeting

© 2018. All rights reserved. | Premier Inc. | 9
As risk increases, so does the dependence on information
Higher riskLower risk
Fee for Service
Pay for Reporting
Value-basedPurchasing
Shared Savings
NGACOMSSPBundledPayment
Capitation
Global Payment
Clinical Management
Manage care processCoordinate care
(Patient registries, predictive analytics)
Data Management Manage silos of data Integrate silos of data
(acute, ambulatory, pharmacy)
Manage volumeFinancial
ManagementManage Total Payer Cost of Care
(Per Member Per Month)
MSSP – Medicare Shared Savings Program; NGACO – Next Generation ACO Model
Data Interpretation
Transformation(internal and external reporting, waste and
care variability reporting, prescriptive analytics)
© 2018. All rights reserved. | Premier Inc. | 10
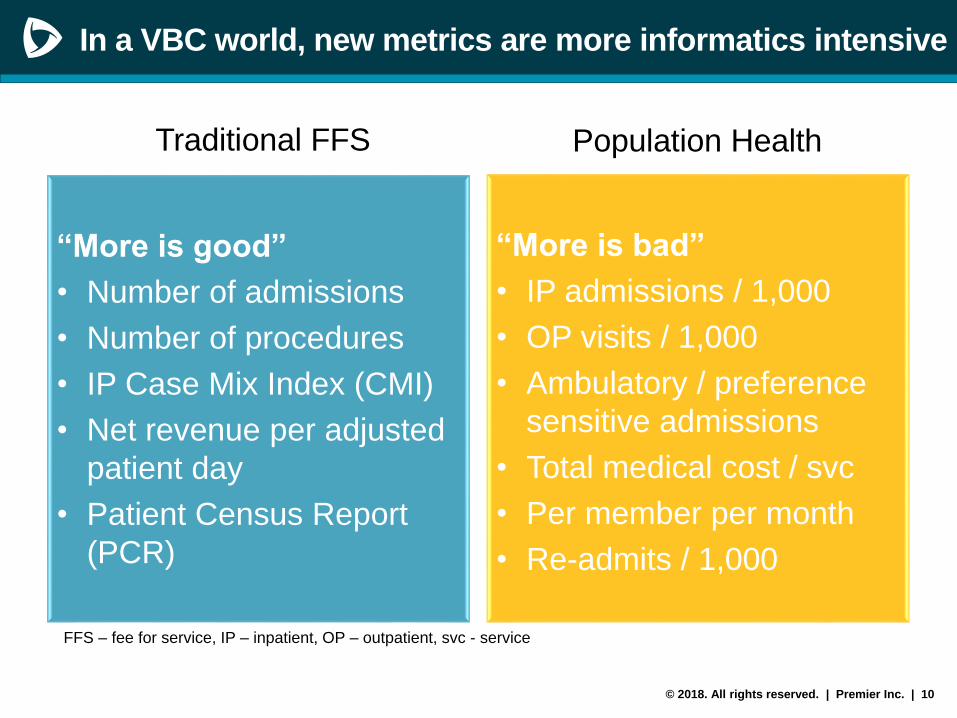
In a VBC world, new metrics are more informatics intensive
Traditional FFS
“More is good”
• Number of admissions
• Number of procedures
• IP Case Mix Index (CMI)
• Net revenue per adjusted
patient day
• Patient Census Report
(PCR)
Population Health
“More is bad”
• IP admissions / 1,000
• OP visits / 1,000
• Ambulatory / preference
sensitive admissions
• Total medical cost / svc
• Per member per month
• Re-admits / 1,000
FFS – fee for service, IP – inpatient, OP – outpatient, svc - service

© 2018. All rights reserved. | Premier Inc. | 11
Category
• Automate data and quality reporting for greater user access and expanded utilities
• Population Health Analytics* - Back End (adjudicated claims, clinical data)
• Care Management Enabling Technology - Front End (clinical data, adjudicated claims)
• Quality / Utilization Reporting Requirements (contractual)
• Electronic Medical Record (administrative and clinical coordination)
• Health Information Exchanges (interoperability)
*Examples of Population Health Analytics:
• Leverage new forms of analytics and reporting, population and provider levels
• Identify gaps in quality, utilization and efficiency across patients and providers real time
and retrospectively segment populations by risk (using adjudicated claims and/or clinical
data)
• Fully understand individuals’ risks through electronic data, social determinants, and
lifestyle risk factors
Population Health Informatics
What do you need to manage the health of populations?

© 2018. All rights reserved. | Premier Inc. | 12
Publicly available resources
• Geographies - nation, state, county, city, census tract
• Example indicators
- Mortality
- Health behaviors (smoking, drinking, obesity, etc.)
- Access (providers, screening, services, etc.)
- Social and economic (population, poverty level, education status, etc.)
- Physical environment (air quality, water quality, housing and transit, etc.)
- Chronic diseases
• Sources
− RWJ County Health Rankings - www.countyhealthrankings.org
− Community Commons - www.communitycommons.org/
− Social Determinants source data - https://www.cdc.gov/socialdeterminants/data/index.htm
− State hospital discharge data (mandated vs voluntary)
− Local Community Health Needs Assessments

© 2018. All rights reserved. | Premier Inc. | 13
Turning data into information
• Compare current performance to historical (internal benchmark)
• Benchmarking against risk-adjustedpeer groups (external benchmark)
− Inpatient utilization
− Post-acute services utilization and cost
− Outpatient services including use of medically unnecessary imaging screenings, rising costs of Part B drugs, overutilization of Emergency Department visits, or underutilization of Primary Care services/Urgent Care
− End-of-life care and hospice utilization
• Benchmarks risk-adjusted to your own population
− Include risk adjustments for age, gender, and demographics
Risk-Adjustment
• Purpose: to enable the accurate comparison of clinician or facility performance, accounting for populations that may be more or less ill/costly than the average
• Example characteristics: may include the patient’s age, past medical history, and other diseases or conditions (comorbidities) the patient had prior to the episode of care that are known to impact the health outcome
• Common metrics: measure outcomes that are commonly risk-adjusted include mortality, readmissions, complications or utilization

© 2018. All rights reserved. | Premier Inc. | 14
What should I pay attention to?
• Quality indicators:
− Healthcare Effectiveness Data and Information Set (HEDIS)
− Medicare Shared Savings Program (MSSP) Measures
− Quality Payment Program (QPP, formerly MACRA) metrics
− Anything specific to the contract
• Utilization indicators:
− Admit or Discharge per 1,000 population
− Length of Stay (LOS)
− Emergency Department (ED) visits/1,000
− Skilled Nursing Facility (SNF) days/1,000
− Out of Network use
− Pre-authorization rate
− Other areas where there is high spend
• Primary care referrals to specialists (rate)

© 2018. All rights reserved. | Premier Inc. | 15
HEDIS Measures
HEDIS® includes more than 90 measures across 6 domains of care:
1. Effectiveness of Care
2. Access/Availability of Care
3. Experience of Care
4. Utilization and Risk Adjusted Utilization
5. Health Plan Descriptive Information
6. Measures Collected Using Electronic Clinical Data Systems
The National Committee for Quality Assurance (NCQA) releases new technical specifications for HEDIS annually.
Source: https://www.ncqa.org/hedis/measures/

© 2018. All rights reserved. | Premier Inc. | 16
ACO PY2018* Quality 31 Measureshttps://www.cms.gov/Medicare/Medicare-Fee-for-Service-
Payment/sharedsavingsprogram/Downloads/2018-and-2019-
quality-benchmarks-guidance.pdf
Patient/ Caregiver Experience Domain
(8 CAHPS measures)
• Eg. CAHPS: How Well Your Providers Communicate
• Eg. CAHPS: Patients’ Rating of Provider
Care Coordination/ Patient Safety Domain
(10 measures)
• Eg. Risk-Standardized, All Condition Readmission
• Eg. Falls: Screening for Future Fall Risk
Preventive Health (8 measures)
• Eg. Preventive Care and Screening: Influenza
Immunization
• Eg. Colorectal Cancer Screening
At-Risk Population (5 measures)
• Eg. Diabetes: Hemoglobin A1c Poor Control
• Eg. Controlling High Blood Pressure
MSSP/QPP Interactionhttps://qpp.cms.gov
Quality (50 percentage points)
• CMS will use 11 of the 31 MSSP quality measures
reported through the CMS Web Interface for the
entire ACO
• P4R in ACO’s first performance year, thereafter P4P
Cost (0%)
• Not assessed for ACO
Improvement Activities (20%)
• MSSP ACOs automatically receive the full credit for
this category.
Promoting Interoperability (formerly Advancing
Care Information) (30%)
• ACI performance assessed as a group through ACO
Participant TINs
MSSP ACO & QPP measures
* Note: In the proposed CY 2019 Medicare Physician Fee Schedule Rule, CMS proposes to reduce the total number of measures in the
MSSP quality measure set from 31 to 24 and focus the measure set on outcome measures including patient experience of care
© 2018. All rights reserved. | Premier Inc. | 17
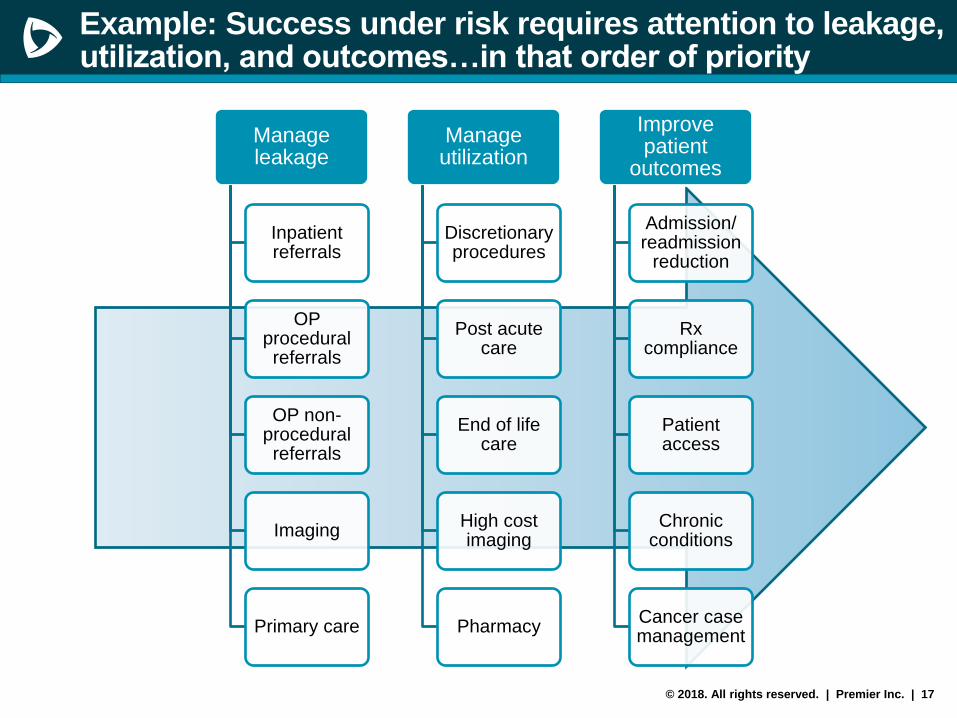
Manage leakage
Inpatient referrals
OP procedural referrals
OP non-procedural referrals
Imaging
Primary care
Manage utilization
Discretionary procedures
Post acute care
End of life care
High cost imaging
Pharmacy
Improve patient
outcomes
Admission/ readmission
reduction
Rx compliance
Patient access
Chronic conditions
Cancer case management
Example: Success under risk requires attention to leakage, utilization, and outcomes…in that order of priority

© 2018. All rights reserved. | Premier Inc. | 18
Example: Successful ACOs identify opportunities and monitor initiative outcomes
• Post-Acute Care Utilization
− Skilled Nursing admission rate, length of stay, and paid per day averages
− Post-acute Rehab utilization
− Home Health services
• Emergency Department Utilization
− Seek balance of ED visits, Urgent Care utilization, and PCP utilization
• Inpatient Utilization
− Avoid unnecessary admissions of Ambulatory Care Sensitive Admissions and
unnecessary surgeries
− Unplanned, all-cause hospital-wide readmissions
• High Cost / Rising Cost of outpatient services
− Measure avoidable high- tech (PET, MRI, CT) imaging
− Part B Drug cost by specialty
• End-of-Life Care and timing of hospice
ACOs are groups of health care providers who voluntarily work with
payers to offer high quality service and care at the right time in the
right setting, and accept accountability for population outcomes

© 2018. All rights reserved. | Premier Inc. | 19
Demonstrating your value: Steps
Identify your core services that
contribute to value to providers
2. CORE SERVICES
Health systems and payers are
both seeking information by
which to elevate certain
providers and exclude others,
ensure they know your areas of
contribution and success
4. DOCUMENT SUCCESS &
COMMUNICATE
Understand the targets towards
which you are working
1. DEFINE VALUE
Measure contribution and
performance improvement; use
process measures or outcomes
measures or both
3. MEASURE
PERFORMANCE

© 2018. All rights reserved. | Premier Inc. | 20
How to illustrate your value: define value
Improve patient experience
of care (including quality and
satisfaction)
Improve the health
of populationsReduce per capita
cost of healthcare
The Institute for Healthcare Improvement Triple Aim®
• Avoidable…
• Acute readmissions per 1,000
• SNF readmissions per 1,000
• ED visits per 1,000
• Clinician Group CAHPS
• Shared Decision Making
• Reduction of wait times
• Preventive Care - Influenza Immunization
• Preventive Screening - Colorectal cancer
• Adult BMI Assessment

© 2018. All rights reserved. | Premier Inc. | 21Kripalani, S., Weinger, M., & Beebe, R. (2014). Patient Safety Learning Laboratories:
Innovative Design and Development to Improve Healthcare Delivery Systems. Vanderbilt
Center for Research and Innovation in Systems Safety (VCRISS), (RFA-HS-14-005), p.30
How to illustrate your value: identify your core services and measure contribution
Community support can
contribute to improved
outcomes!

© 2018. All rights reserved. | Premier Inc. | 22
How to illustrate your value: Example
Which patient is at higher risk?
Patient A
• ESRD
• CHF
• A-fib
• Obesity
• ED Visits year to date: 10
• Admissions year to date: 6
Patient B
• Type II Diabetes
• COPD
• HTN
• ED visits year to date: 5
• Admissions year to date: 5
Example from DMH presentation at Premier’s Fall PHMC Meeting

© 2018. All rights reserved. | Premier Inc. | 23
How to illustrate your value: Example continued
Patient A
• ESRD
• CHF
• A-fib
• Obesity
• ED Visits year to date: 10
• Admissions year to date: 6
• Receiving home health
• Available transportation
• Receiving dialysis
Patient B
• Type II Diabetes
• COPD
• HTN
• ED visits year to date: 5
• Admissions year to date: 5
• Age 60-65 and not eligible for public
program assistance
• No transportation
• Not adhering to medications because
of cost
The impact of Social Determinants of Health…
Which patient is at higher risk?
Example from DMH presentation at Premier’s Fall PHMC Meeting

© 2018. All rights reserved. | Premier Inc. | 24
Checklist: Keys to Value Based Care success
• Become familiar with general concepts and common terminology
• Develop a data analytic roadmap for your Value Based Contract (VBC)
contract that is tightly aligned with the business and clinical roadmaps
• Promote/support sophisticated data analytics capabilities
• Utilize publicly available resources to supplement any gaps in information
• Understand the performance targets upon which you are or will be
measured
• Identify your contributions
• Commit to measuring your own performance
• Document and communicate successes

© 2018. All rights reserved. | Premier Inc. | 25
Examples of Premier’s VBP Advisory Services
VBP Strategy & Roadmap
Contract Review
Performance Assessment
Bench -marking
Contract Design
Metric Selection
Provider Alignment
Care Management
Design
© 2018. All rights reserved. | Premier Inc. | 26
Premier’s white papers
Ready, Risk, Reward
1. Aligning for Success with the Second Generation of CINs
2. Keys to Success in Bundled Payments
3. Building Successful Two-Sided Risk Models
– Support the clinical and administrative aspects of care, with the goal of improving
health outcomes
– Use strategically selected actionable, predictable and comparable health
information technology capabilities
– Integrate measures across contracts to focus efforts; evaluate and benchmark
the effectiveness and return on investment (ROI) of clinical interventions
– Establish interoperability between providers to exchange clinical data and to
manage and prevent leakage
– Integrate electronic health record (EHR) clinical data with payer claims
information
– Negotiate with payers to ensure the payer shares robust adjudicated claims data
for the population attributed in a risk arrangement in a timely manner
Source: https://learn.premierinc.com/white-papers

© 2018. All rights reserved. | Premier Inc. | 27
QUESTIONS
Sonia Greer, MSHP, FACHE
Director, Population Health

© 2018. All rights reserved. | Premier Inc. | 28
Contact Us
http://www.nyhq.org/dsrippps
Amanda Simmons
(713) 859-9683
Sarah Schauman
(505) 231-5591
http://www.nyp.org/pps
Paula N. Richter
(646) 317-2092
Rachel Naiukow
(347) 880-1707

© 2018. All rights reserved. | Premier Inc. | 29
Speakers
Sonia Greer, MSHP, FACHE
Director, Population Health, Premier
Ms. Greer is a Director on the Premier Population Health advisory
services team and leads Premier’s Community Health Needs
Assessment services. She has years of healthcare experience in the
development and implementation of customized strategic and
operational population health management solutions. Her specialty is
strategic planning, financial modeling, physician alignment and clinical
integration with the focus upon community health improvement.