Embed Size (px)
Citation preview
A JOINT INITIATIVE OF THE HARVARD GRADUATE SCHOOL OF EDUCATION AND HARVARD BUSINESS SCHOOL
PEL-047R E V : J U L Y 2 5 , 2 0 0 7
________________________________________________________________________________________________________________ Professor Susan Moore Johnson and Research Associate Tiffany K. Cheng prepared this case. PELP cases are developed solely as the basis for class discussion. Cases are not intended to serve as endorsements, sources of primary data, or illustrations of effective or ineffective management. Copyright © 2007 President and Fellows of Harvard College. To order copies or request permission to reproduce materials, call 1-800-545-7685, write Harvard Business School Publishing, Boston, MA 02163, or go to http://www.hbsp.harvard.edu. No part of this publication may be reproduced, stored in a retrieval system, used in a spreadsheet, or transmitted in any form or by any means—electronic, mechanical, photocopying, recording, or otherwise—without the permission of Harvard Business School.
S U S A N M O O R E J O H N S O N
T I F F A N Y K . C H E N G
Using Data to Improve Instruction at the Mason School
At a principals’ meeting the day before, Janet Palmer Owens had listened as her deputy superintendent announced that Michael Contompasis, the superintendent of the Boston Public Schools (BPS), would arrange to meet individually with a few principals. He was especially interested in talking with those in schools where high proportions of low-income, minority students performed well on the state’s standardized tests. Contompasis hoped to learn about their strategies for success so that the district could help more schools make significant gains in student performance. Owens realized that she might well be asked to meet with Contompasis. Her school—the Samuel Mason Elementary School (“the Mason”)—had once been one of the lowest-performing schools in the district, but now was among the top-performing BPS elementary schools on the state assessment. Meanwhile, schools nearby struggled to educate students of similar backgrounds.
Owens was deeply committed to all students’ academic success. As a school leader, she believed that she had to “instill a sense of urgency in everyone” and insisted that “our focus on results is non-negotiable. You must do it. That’s all I know! Results, results, results. This is about our children and we must get results.” She thought her consistent focus on results had been essential to the Mason’s impressive progress, but she also realized that improving performance across the school had required much more than sheer determination. As she thought about discussing her school’s success with the superintendent, Owens realized that many changes both in her school and in the district had contributed to the Mason’s steady improvement (see Exhibit 1). This was not a simple story with an obvious lesson.
Educating in a Context of Accountability
As the oldest public school system in the nation, BPS served 57,279 students in 145 schools in SY07.1 Its diverse student body was 42% African American, 14% White, 9% Asian American, and 35% Hispanic/Latino. Among these students, 20% were in special education and 11% were enrolled in
1 SY is a PELP convention that denotes “school year.” For example, SY07 refers to the 2006–2007 school year.
047 Using Data to Improve Instruction at the Mason School
2
programs for English language learners. Seventy-three percent of BPS students qualified for free lunch.
District Background
BPS, like other urban districts, faced intense pressure to ensure that all students were learning at high levels. Since the 1970s, the district had utilized a Controlled Choice Plan in order to carry out a desegregation court order. Under the Controlled Choice Plan, BPS divided the city into three geographic zones and asked parents to rank their choices from among the 20–30 elementary schools in their community’s zone. Some parents relied solely on test scores to choose schools, whereas others referred to a combination of measures that would often include test-score rankings. Schools with low enrollments could be closed. A second approach to accountability was introduced in 1993 when Massachusetts passed an education reform law, which provided increased funding for public schools in exchange for more external scrutiny of results. The Massachusetts Comprehensive Assessment System (MCAS) became the state’s tool for measuring educational performance. Developed in conjunction with Massachusetts’ curriculum frameworks, the MCAS was a rigorous set of tests, containing both multiple-choice and open-response questions in reading, math, and science.
When the federal government passed the No Child Left Behind Act (NCLB) in 2002, Massachusetts began using the MCAS to meet federal requirements. Whereas initially it was administered in only three grades, federal law now required that students be tested annually in grades three through eight, and one time in high school. In order to meet “adequate yearly progress” (AYP) standards, schools would have to achieve proficiency performance targets with all subgroups having 40 or more students.2 Schools that failed to meet AYP for two consecutive years were placed in the “needs improvement” category. Those that remained in that category were subject to corrective action, restructuring, or takeover by the state.
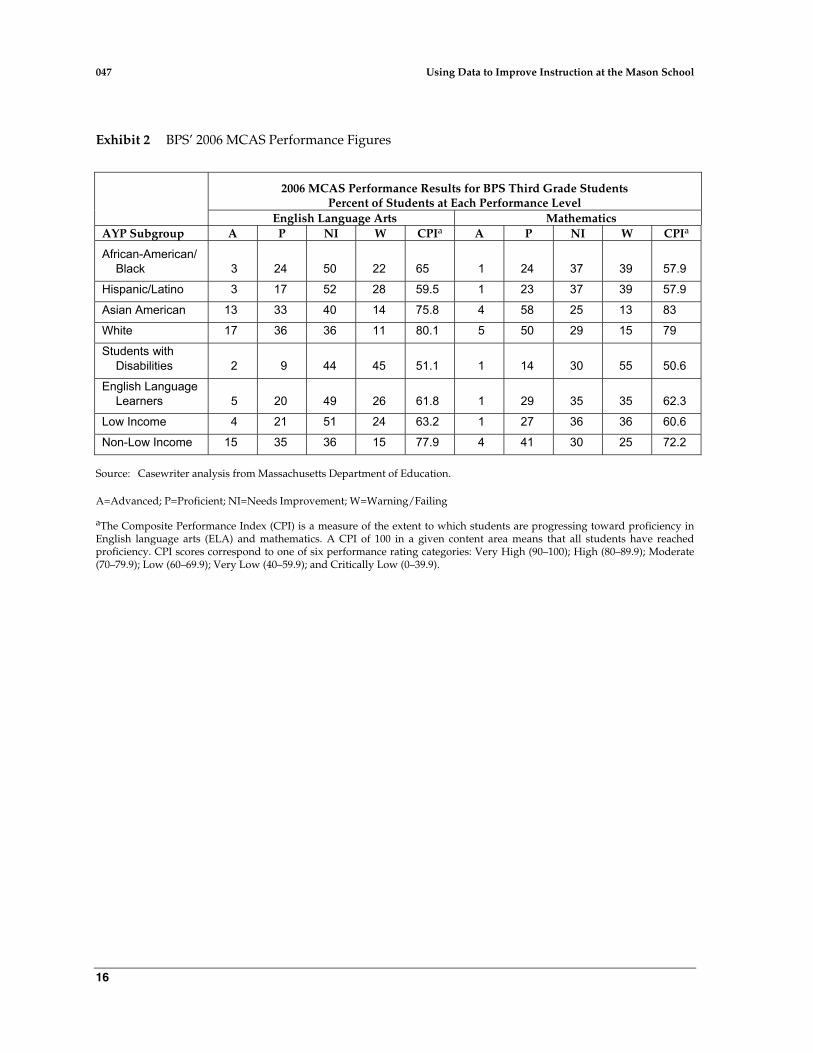
Yet, these approaches had not transformed schools or eliminated inequity districtwide. In fact, publicly released test data revealed substantial and persistent discrepancies in student achievement across the district. Like many school districts, BPS had an achievement gap between subgroups of students from different ethnic and racial groups. For example, third-grade African American and Latino students scored in the “Very Low” and “Low” categories of the 2006 MCAS English Language Arts (ELA) and Math tests. Their Asian and White counterparts scored in the “Moderate” to “High” categories. (See Exhibit 2 for BPS’ 2006 MCAS performance figures.)
Superintendent Thomas Payzant, who headed the district from 1995–2006, was a strong proponent of standards-based accountability and relied on a whole-school approach to promote improvement. When Payzant introduced new curricula in all subjects, coaches and additional instructional resources were deployed to support implementation in the schools. Within BPS district offices, Payzant’s plan for reform created momentum to develop tools that schools and classroom teachers could use to assess and improve student performance.
Sustained Leadership Inside and Outside the District
During Payzant’s tenure, BPS worked closely with the Boston Plan for Excellence (BPE), a local education foundation committed to enhancing professional development and literacy instruction in city schools. As the district’s primary external partner, the BPE used two approaches to improving
2 Students were assigned to AYP subgroups based on their language proficiency, race, socioeconomic status, and disability status.

Using Data to Improve Instruction at the Mason School 047
3
schools:3 1) testing new ideas that hold promise for accelerating improvement in schools and 2) pressing the district to look at its own policies and practices that slow reform.
The BPE provided critical support to the schools and central office, often creating, testing, refining, and implementing initiatives central to Payzant’s reforms. The BPE was both a catalyst and agent for change in school practices through its professional development model of school-based coaching, tools for analyzing student performance data, professional networks for teachers and principals, and other important, research-driven innovations in education. In 2003, the BPE (in partnership with the district and Strategic Grant Partners) instituted and housed the Boston Teacher Residency Program (BTR), the district’s homegrown teacher preparation and licensure program.
Providing Schools with Information, Tools, and Resources
Schools were under immense pressure to collect and analyze student performance data through a wide range of district assessments. Each year, they were expected to provide summary reports that detailed each major subgroup’s performance against the district’s standards. Many of the schools lacked the capacity and resources to manage such a large volume of data. At the request of school change coaches, the BPE began to explore ways to provide assistance.
The BPE created FAST Track, a technology tool that gave schools the ability to depict overall student performance with charts and graphs. However, FAST Track was not a “live” system—it did not keep pace with student mobility within the district. Moreover, teachers were not targeted as the main users and training was focused on principals. The system faced barriers to implementation and, as a result, was not widely adopted.
Responding to MCAS
When the state introduced MCAS in 1998, district officials realized that they needed to provide schools with information and technical tools to assist teachers and principals with data analysis. Maryellen Donahue, BPS Director of Research, Assessment, and Evaluation (RAE), developed the MCAS Toolkit for teachers, which included protocols for examining test results, identifying common student errors, and discussing alternative teaching strategies. Instructional leadership teams, composed of teachers and administrators within schools, used these protocols to analyze data reports provided by the Massachusetts Department of Education (DOE). Donahue recalled, “The focus was to start a conversation of, ‘If kids are responding this way, what does it mean for my instruction? What does this mean for my classroom and for other classrooms across the school?’”
The MCAS Toolkit laid a strong foundation for analyzing student data, but teachers and principals found themselves overwhelmed by the paper-based process. The reports from the DOE were not organized by classes or subgroups. Although a few schools were able to input all the data into an electronic spreadsheet program, most lacked the skills and resources for this work and had to disaggregate the data by hand. Donahue noted, “As I look back on it, it was a big step. But, tedious doesn’t even begin to describe the process.” Without an electronic component to sort and organize the data for meaningful patterns and comparisons, most schools could learn little from their MCAS results.
3 http://bpe.org/, accessed January 15, 2007.
047 Using Data to Improve Instruction at the Mason School
4
Creating MyBPS Assessment: For Oversight or Instructional Improvement?
District personnel agreed that they needed assessment tools that would give teachers timely diagnostic information about their students’ academic skills. During the 2001–2002 school year, Harvard Graduate School of Education Professor Richard Murnane worked with the district to help guide and coordinate a data governance group, which included various administrators in BPS’ district office and the BPE. Each month, they not only met to discuss progress made by each department office but also to promote task accountability among leaders who often felt distracted by what one insider called “the need to put out fires.”
Together, members of the data governance group discussed what teachers and principals had told them about schools’ assessment needs and decided to add assessment tools to an existing data system—MyBPS—which had functioned primarily as an HR portal to inform individual employees about payroll and budgets. Ultimately, the new tool became known as MyBPS Assessment.
MyBPS Assessment provided teachers and data teams with information in response to a series of questions a teacher might ask about MCAS data. For example, a teacher could start with a high-level look at her class’ overall performance in reading. She could then decide to examine her students’ performance on specific multiple choice questions in order to see if certain concepts proved particularly difficult for them as a group. She could also click through additional screens to view information about individual students and their responses to specific questions. (See Exhibit 3 for sample screen shots of MyBPS Assessment.)
By linking test items to state standards, MyBPS Assessment encouraged teachers to consider students’ performance in relation to standards. Donahue said her mental model for MyBPS was an ATM: “It’s almost as easy to use as an ATM. At least, that was my goal.” MyBPS was available to teachers with a personal logon from any computer, including those at home. From the perspective of teachers, who had little time during the school day to study their data, this was especially important. Kristan Singleton, Assistant Director at BPE, stressed the value of making the system user-friendly: “There were too many instances where use of data at a school was entirely dependent on the professional development that teachers got on how to use things like Excel. We said, ‘Let’s level the playing field so that everybody has the benefit of data analyses.’”
The data governance group confronted the important question of who, in addition to classroom teachers, would have access to the data. Some thought that central office administrators should be able to easily compare student performance on different parts of the test across classes and schools. Others disagreed, arguing that a design focusing on the needs of central office administrators to monitor performance would lessen its value for teachers and principals. In the end, they designed a system that did not give central administrators access to classroom-level data. Although these administrators still had access to the raw data of individual students, it would take them an inordinate amount of time to aggregate these data by classroom, school, and cluster groups.
Donahue noted, “In the interest of focusing on teachers’ needs, we’ve moved away—inadvertently, in a way—from the accountability function of the MCAS. The central office wanted to use MyBPS Assessment to see where and who the teachers were, and what they were doing.” However, given the portal they were using, this was not possible. Those involved believed that the district would eventually build “a companion set of tools that would satisfy their oversight needs.”
The data group also had to decide who within schools would have access to student-level and classroom-level data. After much deliberation, they decided to provide access to student-level and classroom-level data to those individuals who were responsible for instruction and data analysis. Each school principal had the ability to then designate access to support staff as appropriate.

Using Data to Improve Instruction at the Mason School 047
5
Singleton commented, “If we started with the teachers, you could say you were at least opening up the MCAS to some sort of disaggregation for teaching and AYP purposes.”
At schools, the use of MyBPS Assessment was self-governed by teachers and principals. Individual teachers could review information about their students and analyze performance by ethnicity, gender, year, and question type. Principals and school data-team members could customize data reports for currently enrolled students by designating codes such as bilingual or after-school program participation; they could also compare whole-class, whole-grade, or whole-school performance to district and state results.
FAST-R: A First Step in Formative Assessments
Although MyBPS Assessment provided teachers with information about their students’ performance on the MCAS, these results were not available until August. Since most teachers began with a new class of students each September, they tended to be less interested in the data from the prior year. Without a mechanism to identify learning needs in a timely manner, teachers could not modify instruction to teach their current students the skills they needed.
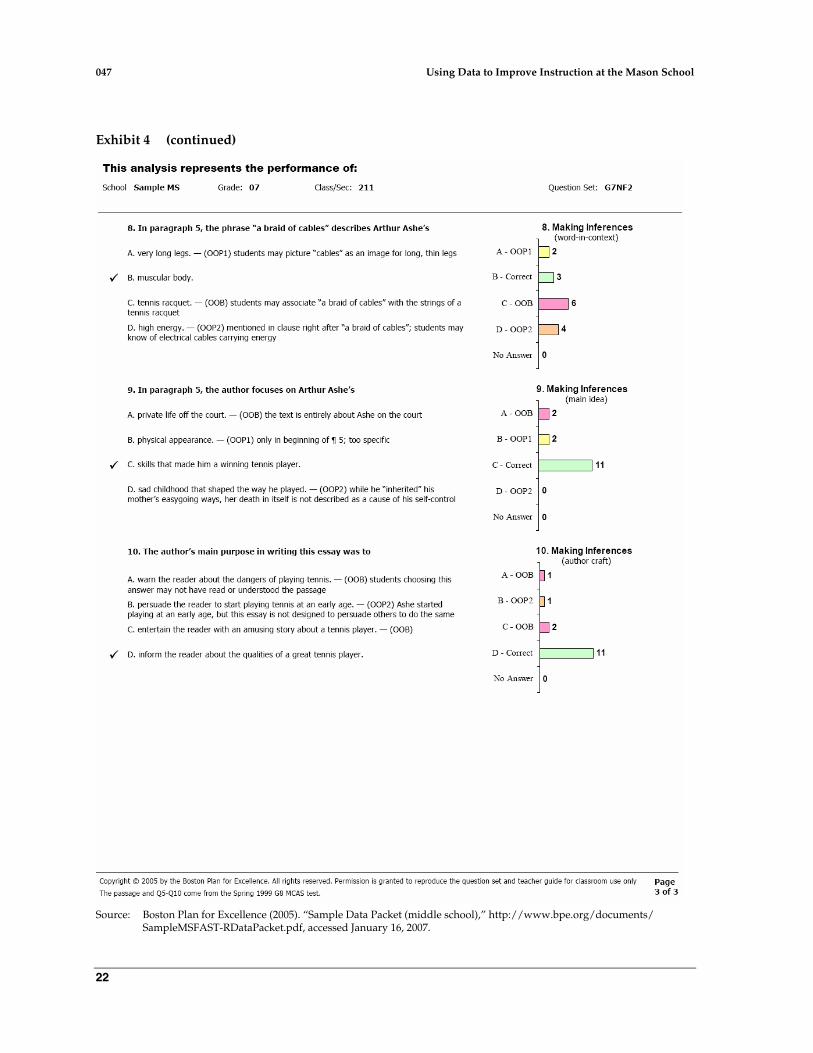
Recognizing that delay, the BPE began to create a new set of interim assessments focusing on a narrow range of reading skills—finding evidence in text and making inferences—which had been shown to greatly affect a student’s overall performance on the MCAS. The system, Formative Assessment of Student Thinking in Reading (FAST-R), was designed for use in third, fourth, seventh, and tenth grades and consisted of ten multiple choice questions. (See Exhibit 4 for more information about FAST-R.) In practice, teachers often gave FAST-R as a pre-test to assess a student’s baseline understanding before teaching a unit. Teachers looked upon FAST-R favorably because it was designed to inform their teaching, rather than report to others about their students’ success or failure. Of great importance was the fact that the BPE and BPS returned the results within a week. Singleton said, “We wanted teachers to have the ability to administer frequently. There are always trade-offs in assessment, and we made that knowingly.” Donahue’s office was working on creating additional formative assessments that would measure students’ understanding of key concepts through multiple measures—open-response and short-answer test items. Donahue hoped these assessments would complement FAST-R’s use in the classroom.
Training and support for schools The BPE was deeply involved in providing training for schools about how to interpret data and use these tools for instructional improvement. Before the FAST-R initiative, BPE staff had served as the primary source for support and implementation of FAST Track. Selected schools that had begun making substantial improvements on MCAS participated in BPE’s training modules on using data for instructional improvement. Other BPS schools could also attend these trainings, as long as they were committed to using data to inform instructional practice.
When MyBPS Assessment was introduced, the BPE and BPS’ department of RAE (Research, Assessment, and Evaluation) trained school principals, coaches, and key members of the schools’ data teams. Teachers who were unfamiliar with the system received on-site support from coaches, who helped them understand how to use the information on MyBPS Assessment to become more effective teachers. The BPE and BPS had learned from previous initiatives that training had to be provided for school-based educators, but not necessarily the principals. The BPE’s Singleton recalled: “When we first started doing work with data, we thought that the principals were the ones you needed to train on how to use systems. The principals were the wrong people, not because they don’t have interest or expertise—they’re too busy. They just can’t do enough to lead a teaching effort that’s responsive to data on their own.”

047 Using Data to Improve Instruction at the Mason School
6
Singleton went on to explain how they discovered the most effective way to ingrain the use of data and technology in schools:
We said to the school, “You tell us what it takes to get this into the lifeblood of your school committee.” That turned out to be the most fruitful route to go. We still think it works best when there’s somebody who knows more about instruction, who plays that role, because the farther the data manager is from [instruction], the less likely they’ll know what they’re missing. There [needs to be] somebody else who can take on the heavy lifting in the building without [the BPE] having to be there every day.
The principal and teachers at the Mason School had taken advantage of all these tools and resources.
The Mason School
The Mason School, located in a traditional, three-story brick building, was built in 1905. Situated in a densely populated area of Roxbury, Massachusetts, the school was relatively small compared with other BPS elementary schools, serving 217 students in 14 classes, pre-kindergarten through fifth grade. The student population, mirroring the surrounding neighborhood, was 62.2% African American, 24% Latino, 9.2% White, and 3.7% Multi-racial. Overall, the proportion of special education students at the Mason reflected districtwide proportions: 21.2% of the students at the school had been diagnosed with one or more disabilities; 77.4% of the students were designated low-income; and 10.2% were classified as English language learners.
A Look Back: 1990–1998
When the Controlled Choice Plan was implemented in 1990, the Mason was the least chosen elementary school in the entire city. Parents were reluctant to send their children to what some thought was a dangerous neighborhood for a sub-par schooling experience. That same year, the new principal, Mary Russo, began to work with teachers and parents to improve the school. With intense effort over the next several years, the Mason raised its performance and reputation. By 1997, the Mason’s scores on the MCAS pilot exam were among the highest in the district. Of all the schools in its Controlled Choice zone, the Mason became one of the most frequently chosen by parents. That same year, President Clinton awarded the Blue Ribbon School Award to the Mason in recognition of its achievements.
Janet Palmer Owens’ Arrival
In early 1998, Russo left the Mason to head a districtwide reform initiative and Janet Palmer Owens, then a guidance counselor at a BPS high school, was appointed principal. She had a long, rich, and varied career in BPS, having worked in numerous roles at elementary, middle, and high schools. “I had a lot of experience,” she acknowledged, “but the challenge that I found was coming into a school that was very, very high performing.”
Taking over a successful school with a first-rate reputation might seem a plum assignment, but Owens immediately faced several obstacles. For years, the Mason had depended on a number of outside grants to augment funds from the district. These extra resources supported some of the personnel and programs that had been instrumental to the school’s successful turnaround. In addition, the Mason housed a bilingual program that increased the school’s baseline budget. Many of

Using Data to Improve Instruction at the Mason School 047
7
these outside grants were due to expire, and the bilingual program was slated to end in June, thus threatening the continuation of key programs.
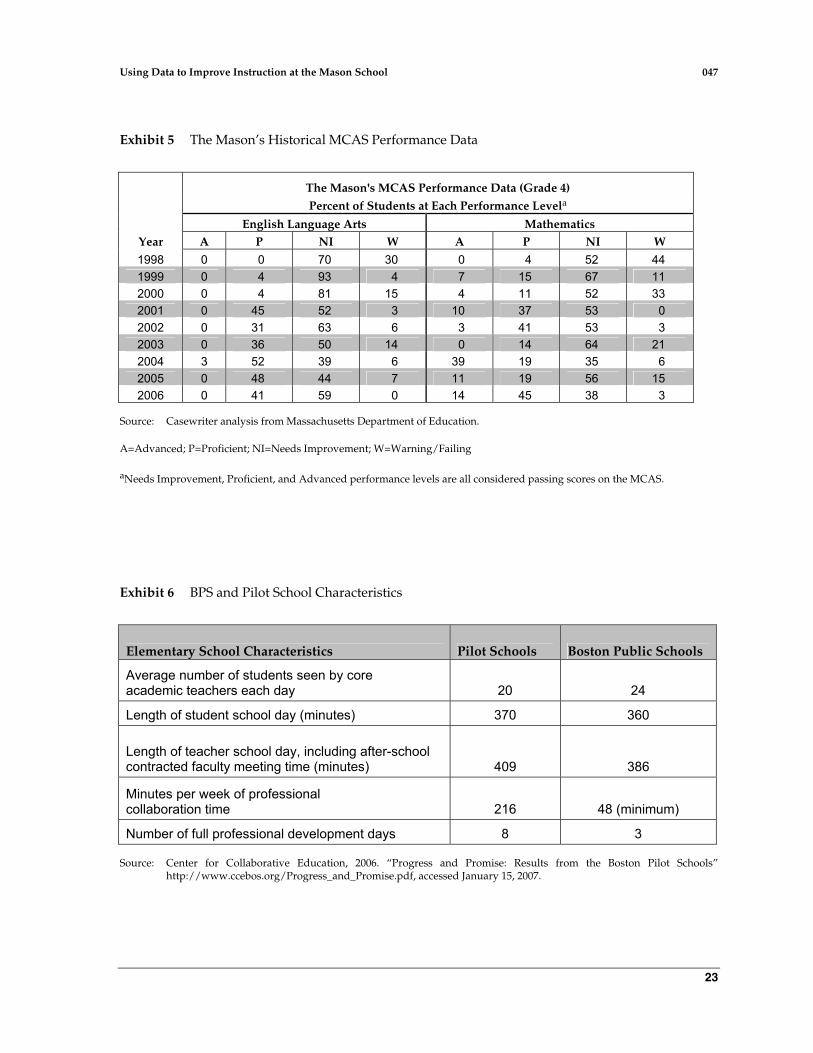
Moreover, Owens realized that there was a possibility some students who had disabilities or were English language learners had not been tested. However, once MCAS testing was expanded to require test participation from all students regardless of English language proficiency or disability status, scores at the Mason dropped dramatically. Owens explained, “As things evolved with MCAS, it became a whole different way of collecting data and making sure that every single subgroup was included. It became the real thing because of MCAS. I made sure that every single person was tested, so I could have a baseline. Scores on everything dropped.” That year, the Mason went from being one of the top-scoring schools on the MCAS to being, once again, a low-performing school in the district. (See Exhibit 5 for historical data on the Mason’s MCAS performance.)
Adding to these challenges were personnel issues that emerged as a result of the school’s relentless pursuit of high performance and the change in leadership. After working tirelessly for seven years, some of the teachers moved on in search of new roles or careers. According to Owens, less than one-fourth of the teachers from the previous year remained at the Mason when she arrived.
Under the previous administration, the Mason had become a full-inclusion school, where students with disabilities were educated in classrooms alongside their peers in regular education. All teachers were required to hold dual-certification in regular and special education, thus making it possible for the Mason to use special education funds to reduce class size throughout the school. The typical class had 17 students. With Owens’ commitment to educating all students, the established inclusion model increased her confidence that every student would be well-served.
Through various partnerships with local universities and strategic use of funding for paraprofessionals, Russo had arranged to have two skilled adults in each classroom (the teacher and a full-time intern or paraprofessional), thus providing more support for students and flexibility in the schedule. This arrangement, Owens knew, would accommodate the professional development needs of the teachers, especially the many new ones she would hire.
Owens also had the benefit of building on the school’s experience with the Literacy Collaborative, a model for professional development aimed at improving literacy instruction schoolwide. Housed at Ohio State University, the Literacy Collaborative had engaged the Mason’s teachers since the mid-1990s in systematic assessments, data collection, and analysis. Through that experience, teachers had come to see the value of reflecting together about their students’ assessments. Such recognition was an essential element of a strong professional culture that valued the analysis of data. One teacher described the school’s involvement with the Literacy Collaborative as a “huge advantage, because it created the push for data even before NCLB.”
Moving Ahead at the Mason
With these varied challenges and opportunities, Owens intended to re-establish the preeminence of the Mason. She believed in the value of analyzing and using data and aimed to expand the school’s capacity in that regard.
In 2003, Hilary Shea, who had several years of experience as a teacher, was considering becoming a principal. She worked for a year as Owens’ assistant to learn more about the principal’s role. Owens recalled, “Hilary accompanied me to all the principal meetings, so I really gave her intense training that year in what it meant to be a principal.” The two also attended the district’s professional

047 Using Data to Improve Instruction at the Mason School
8
development sessions on data use and enrolled in a yearlong graduate course at the Harvard Graduate School of Education. The course, “Data Wise: Using Assessment Data to Improve Instruction,” taught first by Richard Murnane and subsequently by Kathryn Boudett, was designed to help school-based teams of educators analyze student assessment data to improve teaching and learning. Over time, teams from 36 schools in Boston had taken the course. Deputy superintendents recommended schools for participation. Owens recalled that her deputy superintendent “strongly urged us to go to Kathryn’s class. Hilary had been on the data team with me . . . so we took Kathryn’s course together and Hilary really got better and better in it.”
Teacher collaboration and common planning time Although Owens and Shea were developing expertise in analyzing data, both realized that this effort had to involve teachers if it were to really effect change. Given the nonstop schedule in most elementary schools, Owens knew that they would have to find protected time for groups of teachers to work together. Owens and Shea made creative use of interns and specialists to provide groups of teachers with 90-minute blocks of uninterrupted common planning time each week. Owen explained the difficulty of making such arrangements:
To be able to get a group of teachers during the day that can meet uninterrupted for 90 minutes is a challenge. I make it happen by writing many grants to get additional funding. This pays for additional staff, who can then work with children to give teachers that uninterrupted time. The bottom line is that the paraprofessional is still in the classroom—they can cover the curriculum, but the teacher’s out in the hall if there’s any emergency. The system’s in place—and that’s my role as the administrator. It’s very, very expensive, but that’s the secret.
Common planning time was vitally important to the school’s teachers because it allowed them to meet in grade-level teams, discuss student performance, and identify students who needed more support. For example, at one meeting, teachers worked together to create a data reporting form that the teachers would use with students to discuss strengths and concerns based on MCAS standards by subject area. Teachers then spent time in grade-level teams discussing their students’ responses on a recent FAST-R administration. Shea said, “We want to make sure we flag questions that seem to give our students a great deal of trouble and also note whether certain students are performing poorly overall.” Common planning time helped teachers at every grade level recognize common challenges and receive support from their colleagues. One teacher said, “We’re quite thankful for it.”
Although Owens could require that the teachers work together during these 90-minute blocks, she insisted that they decide how best to use the time. Teachers took turns facilitating the meeting, developing a detailed agenda and using protocols to ensure that scarce time would be well used. As they worked intently with their colleagues, their classes were taught by specialists in science, music, and art, full-time interns from the Boston Teacher Residency Program or a local university, or by full-time paraprofessionals who were prepared to continue instruction just as if the teacher were in the room.
Becoming a Pilot School: Risks and Rewards
In 1994, BPS and the Boston Teachers Union (BTU) jointly instituted within-district charter schools, called “pilot” schools, which were granted autonomy over curriculum and assessment, governance, staffing, schedule, and budget decisions in exchange for greater accountability. Importantly for the Mason, pilot schools could use their budget to staff a complicated schedule that allowed for common planning time. (See Exhibit 6 for a comparison of BPS and pilot school

Using Data to Improve Instruction at the Mason School 047
9
characteristics.) They could also decide what curriculum and assessments, in addition to MCAS, they would administer.
The Mason’s teachers voted to become a pilot school in 2003. One teacher recalled, “We were already doing such great work with data before we obtained pilot status—but we really wanted to operate under true shared leadership.” Another remarked, “We didn’t want to ever have a time like we had years ago where there were budget cuts and somebody downtown said, ‘You need to cut teachers.’” To Owens, having pilot status became critical to reallocating the school’s resources in the service of instructional quality. She said: “When we became pilot, we were able to creatively use our additional funding to buy services. We could hire parents and get waivers for hiring BTR interns as paraprofessionals to reduce our class size that other schools wouldn’t have been able to do.” With these flexibilities, the school could focus even more on its use of data during common planning time and put into place processes that enabled stronger collaborations among teachers.
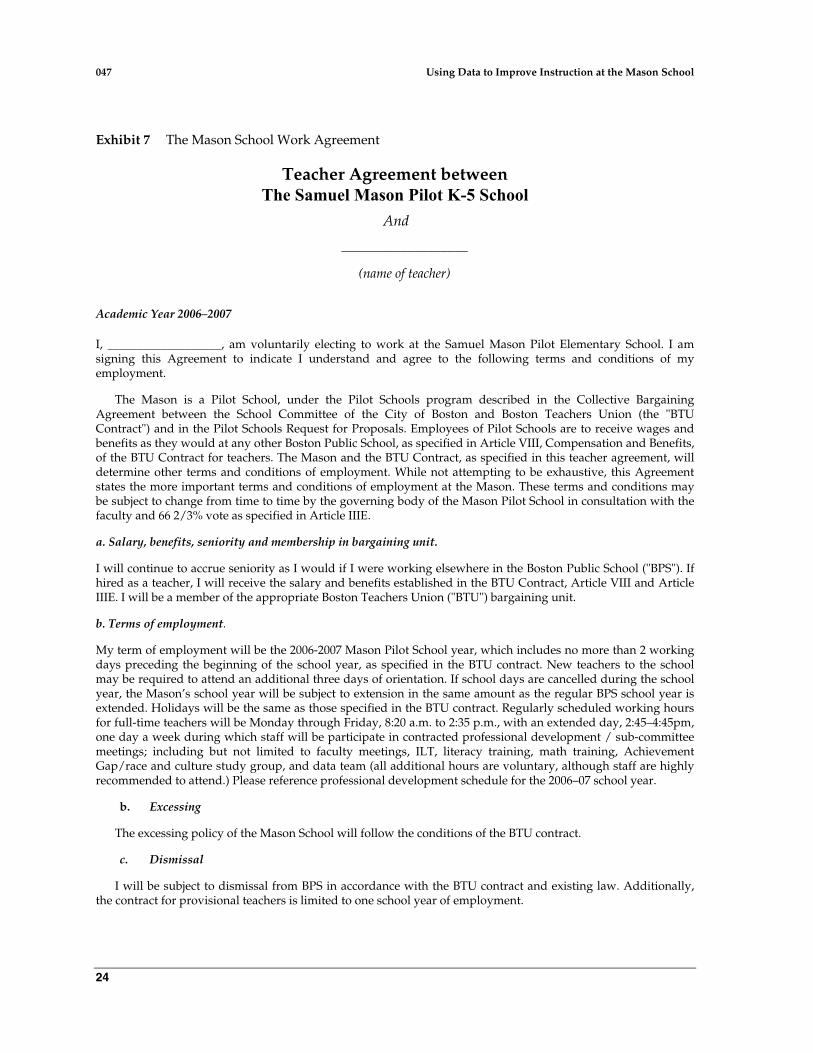
Most pilot schools did not work according to the provisions of the BTU collective bargaining agreement. Teachers at the Mason, however, chose to remain under the BTU contract, thus retaining the same rights and privileges of other teachers at regular district schools. Each pilot school was required to write and approve a “work agreement,” explaining the ground rules for the teachers’ employment. The Mason’s work agreement explained that, while teachers were going to work under the contract, they would commit to additional responsibilities. One teacher said, “The way we wrote our proposal made it safe, that we were still governed under the union. That was the big piece that made a lot of teachers feel safe, and we didn’t want to do it unless the whole staff had buy-in. It’s beyond what the union says, but it’s what we’ve agreed to do.” (See Exhibit 7 for the Mason’s work agreement.) Owens supported this decision: “There was no reason for us to change the BTU contract because we were doing really well. I don’t believe in teachers working so many hours a day, becoming exhausted and never having the chance to lead a balanced life. After 2:30, I want [teachers] to plan for their classrooms.” She realized that creative use of the pilot school autonomies of budget, staffing, and schedule would allow her to provide professional development within the regular school day.
As a pilot school with autonomy over curriculum and assessments, the Mason could decide which tests to use. Mason’s math facilitator and fourth-grade teacher Aadina Balti explained: “Since we became a pilot school, we’ve used data more because we feel like we have more control over what we’re doing with our curriculum. We have a little bit more leeway on how we’re delivering our instruction or what we’re using to assess it. We’ve also been better about creating more formal and informal assessments.”
A School of Teacher Leaders
Often, schools have one or two outstanding teachers who become formal or informal leaders in the school. At the Mason, though, teachers repeatedly said that many of their colleagues assumed responsibility for leadership. Most were compensated with small stipends for their extra work, but extra pay was not why teachers assumed these roles. Owens elaborated, “When I first came, we would talk about teacher leadership but the only teacher leaders in that building in 1998 were the two literacy coordinators and myself. I was running everything. And now every single teacher is a teacher leader.” She described the teachers’ roles in facilitating meetings of the Mason’s Instructional Leadership Team. “It’s just amazing to watch how they’ve grown. They’ll come to me and they’ll have their agendas. We go over the agenda before the meeting. Then I come into the meeting with my notebook like everyone else, and they run it. It’s all about teacher quality, and that’s what translates into success.”

047 Using Data to Improve Instruction at the Mason School
10
In addition to her teaching responsibilities as one of the Mason’s kindergarten/first-grade teachers, Caitlin McArdle worked as the Literacy Coordinator in the primary grades. She described her schoolwide role: “My job is to coach teachers on implementation of the Literacy Collaborative model. I’m also part of the school-based leadership team in terms of looking more globally at the implementation of responsibilities of collecting data, doing an annual school report, and talking about what the data shows.”
In her role as the school’s math facilitator, Balti supported teachers who needed help in math instruction. She said, “I’m not a formal coach—we ended up getting an actual math coach from the math department this year, so I’m working with her. I meet with teachers outside of the classroom time who need support or questions answered.”
Notably, strong leadership among teachers required wise leadership by the principal. Owens was highly respected by her teachers, colleagues, and partners. The BPE’s Singleton praised her for strategically engaging teachers throughout the school in responsibilities that mattered: “Janet is Janet. She’s very strong, encouraging, and direct about what she wants people to be doing. There’s a cascading effect of people in the right place at the right time that help out at the Mason.”
Owens also hired teachers very deliberately. She made sure that candidates understood the Mason’s expectations for commitment and performance. By recruiting interns through local universities and teacher certification programs, Owens was able to subsequently offer full-time teaching positions to the best among them. According to Owens, more than half of the Mason’s teaching force initially came to the school as interns or support staff. By the time they became official faculty members, they were already very familiar with the school’s strong professional culture and thus well-positioned to assume responsibility beyond their classroom. Owens said, “We hire from within—they learned as former interns. They continue to learn, as we all learn as a team.”
To continue that learning, Owens took advantage of training offered by BPS. She reflected, “We’re successful because we’ve accessed all the training and professional development from BPS and BPE.” This development, she said, was instrumental in changing the ways in which the Mason collected, analyzed, and made decisions from data. Owens remarked:
When I first came to the school, the only data I would see would be the Literacy Collaborative data. You’d see the results of all the different components of the literacy model, but that’s all you’d see—there was no other data. Now, you have huge, thick binders around every single possible thing to see results with kids so that teachers are able to articulate and actually do it all on the computer.
She also learned from her deputy superintendents: “My deputies—I’ve been lucky. They are in the buildings, walking through—and they know what to look for. If the school’s not doing it, the deputies are in there talking to principals. Every year, we have our principal’s binder and we sit down with our deputy and talk through the data.” Owens adapted this approach in supervising her own teachers. McArdle described Owens’ data management with teachers: “In the beginning of the year, everyone wrote goals for themselves, and when Mrs. Owens had meetings with people on their goals, she had the data binder in front of her.”
Ultimately, Owens believed in empowering her teachers to become fully engaged with the use of data. “It’s all there so teachers can really and truthfully get the data themselves.” She added, “Teacher leadership is huge. Teachers have to own it. They have to feel respected. They have to feel that they’re a part of the process. They’re professionals and being treated like professionals is critical, too.”

Using Data to Improve Instruction at the Mason School 047
11
The Data Queen
After a year as Owens’ assistant, Shea realized that she wanted to remain a classroom teacher, rather than becoming a principal. “I definitely had my own passions,” she said. “A lot of that has to do with instructional improvement and working with teachers around how to use data to move the school forward. But I love working with kids and wanted to retain that part of my job.” Shea became a fourth/fifth-grade teacher while assuming various responsibilities that provided release time during part of the school day for her to work with teachers.
In her three years at the Mason, Shea worked to help teachers understand how to use data. Her colleague Balti commented, “Having worked with Hilary last year, I was able to see how she was doing it. That helped me figure out better ways to do it in my own classroom. We have opportunities to share our own practices so that people can figure out what works for them. I think it’s just a matter of time before everyone develops a comfort level with how to use data.” McArdle added, “Hilary is infatuated with data. She picks apart the MCAS data and does a lot of presentations for the staff so we’re able to look at the big picture. I do have to say, she is our data queen.”
Culture Change and the Use of Data
Traditionally, most teachers are accustomed to working independently and often know little about their colleagues’ instructional practice or effectiveness. At the Mason, an established norm of teacher collaboration meant identifying and discussing each other’s strengths and shortcomings. Doing this effectively, said Owens, required strong professional standards and a school culture that supported such work.
For the opening faculty meeting in September, Shea prepared a student-by-student summary of MCAS data and the teachers discussed it together, reflecting on how each student was doing over time. Also, they examined their students’ performance in sub-groups (see Exhibit 8 for the Mason’s 2006 MCAS results disaggregated by subgroups.) McArdle described the process: “Every year, we will pick apart how our kids did in all the grades and down to ‘Okay, question number 14; 80% of our kids got it wrong. This percentage answered [it this way] and this percentage answered it that way. Why? Why do we think this?’”
Shea explained how she worked with teachers:
I’ve continued to break down the data in ways that make it very accessible to the staff. I lead the instructional leadership team in discussions about MCAS data to start those difficult conversations of cross-comparison data. For example, if a kid’s scores on the MCAS are low but we have them reading on grade level according to his benchmark assessment, and he has a three on his report card, we ask, “Why is there a discrepancy?”
Throughout the year, teachers at the Mason tracked students’ skill mastery. McArdle insisted, “The kids belong to all of us. Even though a student might be in third grade, he’s everybody’s child. We look globally at our kids and keep track of their reading levels together to see how we can all help them succeed.” Balti added, “We’re all pretty vocal about what we think we need to work on. Everyone wants to move forward and improve instruction so that our kids achieve proficiency. One of our key strengths is that we are trying to better ourselves as teachers.” Shea agreed that everyone was invested in this effort: “There’s a healthy level of competition—we care. We care about our kids, how they do, and their scores. [But also], you want to look good. You want to look like what you’re doing is having an impact.”

047 Using Data to Improve Instruction at the Mason School
12
When children at the Mason were struggling, teachers created what McArdle referred to as the “safety net.” Shea elaborated:
It’s very difficult for kids to get lost here. There’s a lot of ways to flag the kids. Around this time of year, we create a list of what we call high-risk kids and indicate different content areas they need help. Our specialists will use any of their open blocks to pull individual or small groups, and it could be kids who are really high or kids who are really low, depending on the students’ needs. We also have after-school tutoring.
McArdle emphasized that teachers have a common understanding in examining data at the Mason:
The data is part of everything we do. There is always a purpose behind our professional development. It’s data-driven—it’s never arbitrary. When we’re trying to think through something, we take out our data binders and ask, “What is the data telling you about what our kids’ need?” Every classroom has a place where they’re keeping information and data in relation to guided reading. We report every fall, winter, and spring—they’re living binders and not just put in and put away. It’s just embedded in everything that we do.
Shea said this process would never work if it were a top-down mandate. “Janet’s really good about this sort of thing—she’s supportive of us. It has to be organic and led by teachers. Otherwise, this type of work just wouldn’t hold.” She was clear, though, that Owens was no laissez-faire leader: “Holding people accountable is another piece. When the data is due, Janet holds everybody accountable. She will go after people if they don’t hand it in on time.” For her own part, Owens credited the teachers’ resolve and readiness to do the hard work: “Sometimes, you have to change your ways, and this group has always been that way. They want to learn and get to the next level. This is how they’ve grown up.”
Using Data to Revise Curriculum and Instruction
The teachers in the school began to use MCAS data to make curricular changes across classrooms and grade levels. Shea offered one example from science:
We felt that our students—in fact, all students across the city of Boston—were not doing as well on the MCAS as their actual knowledge of science would indicate. So we came to the conclusion that a big part was somewhat the vocabulary, and how the questions were phrased. We started to talk about it in common planning time and decided that the kids would take a pre- and post-test. These are made up of previous MCAS questions. In fourth and fifth grade, they take it as is. In third grade, it’s slightly modified—sometimes it’s read to them because they may not have the reading skills to be able to do some of the questions. In second grade, teachers make their own appropriate determination on how the assessment should go. That forced the kids to show their knowledge in more than one way.
Based on what they learned, the teachers specified topics that the science teacher should cover in certain grades and classes. Such efforts illustrated how the expertise needed for teachers to use data to improve instruction went well beyond technical competence. Although Shea’s work with teachers about data changed instructional practice throughout the Mason, Shea was quick to point out that the technical skills of data analysis were not enough to make a difference:
There are a lot of schools that I’ve worked with in BPS, and they have this data analysis techie. [The techies] make the most gorgeous graphs, but they have no idea about instruction. The person couldn’t go the next level. I talk to principals a lot and tell them that pretty graphs

Using Data to Improve Instruction at the Mason School 047
13
alone mean absolutely nothing if you don’t have someone pushing the envelope on the ground floor. I could not do this job with the school if I did not teach part-time. Part of that has to do with credibility. But the other part is, how would I get the data and figure out what to do if I didn’t have my own class?
Moreover, Shea insisted, using data to improve instruction takes time and requires focus:
You can’t have a million initiatives. Last fall, we started to talk about our kids and their reading response letters. Students write a letter to their teacher (or whoever) about the book they’re reading. The point of it is to teach your kids how to be reflective learners, to develop literary analysis, and summary skills. The letters weren’t very good. They weren’t changing for grades three through five, even though they do these from second grade on. Our kids weren’t doing well in open response on the MCAS even though we put more time than most people into writing about reading. We had a whole professional development cycle around this and came to the conclusion that kids don’t realize that the stakes and expectations are getting higher. It took almost a full year. Now, the quality of the letters is much higher. We have exemplars, rubrics for each grade. A lot of people would say, “One year on one little thing like that?” But that’s actually using data to try to inform instruction.
Although the school initially relied on the BPE and BPS to help them progress, they became more self-reliant over time and counted on one another for feedback and leadership. They attended the district’s professional development sessions selectively, often sending a representative who then reported back to others with new information or skills. While they continued to use MyBPS Assessment, teachers at the Mason often retrieved information about MCAS and state standards directly from the DOE website. They also began creating their own formative assessments based on the FAST-R model. At the central office, Donahue was exploring the possibility of creating a data bank of test items that teachers might draw from in creating their own assessments—a resource the Mason teachers would certainly welcome.
Excellence at Scale
Owens wondered how best to explain these developments to the superintendent. In her view, success resulted from many factors—technical support and training from the BPE and BPS, clear expectations by the deputy superintendent, flexible funding and staffing as a pilot school, having teachers who assumed leadership and took risks with colleagues, and a strong professional culture that supported their day-to-day efforts to change. The Mason and its accomplishments were not typical of other Boston schools. (See Exhibits 9a and 9b for a comparison of demographic and performance data between the Mason and a neighboring school.) Whatever the superintendent’s approach, Owens believed that it was essential he recognize the need of individual schools to define their own approach and work toward their goals relatively unfettered by additional rules and requirements.
However, some in the district worried that there was not enough centralized oversight and control of student performance. Although schools that were already strong could make good use of autonomy, those that were failing might need firm advice about how to improve. One teacher said, “What we’re doing at the Mason is great, but who knows what they’re doing down the street?” Owens reported that several principals were now asking her to explain the Mason’s success. However, most schools did not have teacher leaders with Shea’s expertise, or groups of teachers who could candidly and confidently review student data together.

047 Using Data to Improve Instruction at the Mason School
14
Much like the district’s schools, central office administrators remained relatively isolated, working together intermittently on specific tasks regarding data use. Even then, these efforts were sometimes at cross purposes. Further, several administrators began to express concern that the different departments themselves were not sufficiently aligned with one another to provide consistent answers and support to the schools. Certain offices—curriculum, research, and IT—were critical to these schools’ progress since their decisions and requirements could either advance or block new approaches to instructional improvement. However, this would require big changes in the BPS organizational culture. Noting how slowly the district changes direction—“it’s like turning the Titanic, to be quite honest with you”—Singleton emphasized the benefits of working closely with outside partners such as Murnane (who had integrated the efforts of various departments in order to create MyBPS Assessment). Singleton said, “The ability to have somebody who doesn’t have a dog in the fight is really, really valuable. There’s still a big role for having a third party serving as a broker or a mediator of stalled efforts.”
As superintendent, Contompasis had to move the entire system to much higher levels of performance. One approach would be to encourage innovation and exchange of information among principals and central administrators so that the schools would better serve all students. As she pulled together her data binders and school improvement plans, Owens began to reflect on what she would say if Contompasis asked to meet with her.

Using Data to Improve Instruction at the Mason School 047
15
Exhibit 1 Timeline: Key Events and Decisions at BPS and the Mason
1970s Controlled Choice in BPS
1990 Mason least chosen elementary school
Russo appointed principal of the Mason
1995 Payzant appointed as superintendent
“Focus on Children”
1997 Mason among highest scoring, most chosen elementary schools
National Blue Ribbon School award
1998 MCAS administered in grades 4, 8, and 10
Owens becomes principal of the Mason
Mason MCAS scores drop
2001 Harvard Graduate School of Education—Data Wise course begins
2002 NCLB requires testing in all elementary grades
2003 MyBPS Assessment
Pilot school status for Mason
2006 BPS wins Broad Prize
Mason among top performing elementary schools
Source: Casewriter.
047 Using Data to Improve Instruction at the Mason School
16
Exhibit 2 BPS’ 2006 MCAS Performance Figures
2006 MCAS Performance Results for BPS Third Grade Students Percent of Students at Each Performance Level English Language Arts Mathematics AYP Subgroup A P NI W CPIa A P NI W CPIa
African-American/ Black 3 24 50 22 65 1 24 37 39 57.9
Hispanic/Latino 3 17 52 28 59.5 1 23 37 39 57.9
Asian American 13 33 40 14 75.8 4 58 25 13 83
White 17 36 36 11 80.1 5 50 29 15 79
Students with Disabilities 2 9 44 45 51.1 1 14 30 55 50.6
English Language Learners 5 20 49 26 61.8 1 29 35 35 62.3
Low Income 4 21 51 24 63.2 1 27 36 36 60.6
Non-Low Income 15 35 36 15 77.9 4 41 30 25 72.2
Source: Casewriter analysis from Massachusetts Department of Education.
A=Advanced; P=Proficient; NI=Needs Improvement; W=Warning/Failing
aThe Composite Performance Index (CPI) is a measure of the extent to which students are progressing toward proficiency in English language arts (ELA) and mathematics. A CPI of 100 in a given content area means that all students have reached proficiency. CPI scores correspond to one of six performance rating categories: Very High (90–100); High (80–89.9); Moderate (70–79.9); Low (60–69.9); Very Low (40–59.9); and Critically Low (0–39.9).

Using Data to Improve Instruction at the Mason School 047
17
Exhibit 3 MyBPS Assessment Screen Shots
Source: Focus Newsletter for Boston Teachers, SY2004–2005, Issue #2. Boston Plan for Excellence, http://www.bpe.org/ documents/FocusMyBPS.pdf, accessed January 15, 2007.

047 Using Data to Improve Instruction at the Mason School
18
Exhibit 3 (continued)
Source: Focus Newsletter for Boston Teachers, SY2004–2005, Issue #2. Boston Plan for Excellence, http://www.bpe.org/ documents/FocusMyBPS.pdf, accessed January 15, 2007.

Using Data to Improve Instruction at the Mason School 047
19
Exhibit 4 FAST-R
Source: Chrismer, Sarah S., FAST-R Year II Evaluation, August 2005, p. 2. Boston Plan for Excellence, http://www.bpe.org/ documents/FAST-R_YearIIEvalFINAL.pdf, accessed January 15, 2007.

047 Using Data to Improve Instruction at the Mason School
20
Exhibit 4 (continued)
Source: Boston Plan for Excellence (2005). “Sample Data Packet (middle school),” http://www.bpe.org/documents/
SampleMSFAST-RDataPacket.pdf, accessed January 16, 2007.

Using Data to Improve Instruction at the Mason School 047
21
Exhibit 4 (continued)
Source: Boston Plan for Excellence (2005). “Sample Data Packet (middle school),” http://www.bpe.org/documents/ SampleMSFAST-RDataPacket.pdf, accessed January 16, 2007.
047 Using Data to Improve Instruction at the Mason School
22
Exhibit 4 (continued)
Source: Boston Plan for Excellence (2005). “Sample Data Packet (middle school),” http://www.bpe.org/documents/ SampleMSFAST-RDataPacket.pdf, accessed January 16, 2007.
Using Data to Improve Instruction at the Mason School 047
23
Exhibit 5 The Mason’s Historical MCAS Performance Data
The Mason's MCAS Performance Data (Grade 4)
Percent of Students at Each Performance Levela
English Language Arts Mathematics Year A P NI W A P NI W
1998 0 0 70 30 0 4 52 44 1999 0 4 93 4 7 15 67 11 2000 0 4 81 15 4 11 52 33 2001 0 45 52 3 10 37 53 0 2002 0 31 63 6 3 41 53 3 2003 0 36 50 14 0 14 64 21 2004 3 52 39 6 39 19 35 6 2005 0 48 44 7 11 19 56 15 2006 0 41 59 0 14 45 38 3
Source: Casewriter analysis from Massachusetts Department of Education.
A=Advanced; P=Proficient; NI=Needs Improvement; W=Warning/Failing
aNeeds Improvement, Proficient, and Advanced performance levels are all considered passing scores on the MCAS.
Exhibit 6 BPS and Pilot School Characteristics
Elementary School Characteristics Pilot Schools Boston Public Schools
Average number of students seen by core academic teachers each day 20 24
Length of student school day (minutes) 370 360
Length of teacher school day, including after-school contracted faculty meeting time (minutes) 409 386
Minutes per week of professional collaboration time 216 48 (minimum)
Number of full professional development days 8 3
Source: Center for Collaborative Education, 2006. “Progress and Promise: Results from the Boston Pilot Schools” http://www.ccebos.org/Progress_and_Promise.pdf, accessed January 15, 2007.
047 Using Data to Improve Instruction at the Mason School
24
Exhibit 7 The Mason School Work Agreement
Teacher Agreement between The Samuel Mason Pilot K-5 School
And
___________________
(name of teacher)
Academic Year 2006–2007
I, ___________________, am voluntarily electing to work at the Samuel Mason Pilot Elementary School. I am signing this Agreement to indicate I understand and agree to the following terms and conditions of my employment.
The Mason is a Pilot School, under the Pilot Schools program described in the Collective Bargaining Agreement between the School Committee of the City of Boston and Boston Teachers Union (the "BTU Contract") and in the Pilot Schools Request for Proposals. Employees of Pilot Schools are to receive wages and benefits as they would at any other Boston Public School, as specified in Article VIII, Compensation and Benefits, of the BTU Contract for teachers. The Mason and the BTU Contract, as specified in this teacher agreement, will determine other terms and conditions of employment. While not attempting to be exhaustive, this Agreement states the more important terms and conditions of employment at the Mason. These terms and conditions may be subject to change from time to time by the governing body of the Mason Pilot School in consultation with the faculty and 66 2/3% vote as specified in Article IIIE.
a. Salary, benefits, seniority and membership in bargaining unit.
I will continue to accrue seniority as I would if I were working elsewhere in the Boston Public School ("BPS"). If hired as a teacher, I will receive the salary and benefits established in the BTU Contract, Article VIII and Article IIIE. I will be a member of the appropriate Boston Teachers Union ("BTU") bargaining unit.
b. Terms of employment.
My term of employment will be the 2006-2007 Mason Pilot School year, which includes no more than 2 working days preceding the beginning of the school year, as specified in the BTU contract. New teachers to the school may be required to attend an additional three days of orientation. If school days are cancelled during the school year, the Mason’s school year will be subject to extension in the same amount as the regular BPS school year is extended. Holidays will be the same as those specified in the BTU contract. Regularly scheduled working hours for full-time teachers will be Monday through Friday, 8:20 a.m. to 2:35 p.m., with an extended day, 2:45–4:45pm, one day a week during which staff will be participate in contracted professional development / sub-committee meetings; including but not limited to faculty meetings, ILT, literacy training, math training, Achievement Gap/race and culture study group, and data team (all additional hours are voluntary, although staff are highly recommended to attend.) Please reference professional development schedule for the 2006–07 school year.
b. Excessing
The excessing policy of the Mason School will follow the conditions of the BTU contract.
c. Dismissal
I will be subject to dismissal from BPS in accordance with the BTU contract and existing law. Additionally, the contract for provisional teachers is limited to one school year of employment.
Using Data to Improve Instruction at the Mason School 047
25
d. Responsibilities
All Mason Pilot School Teachers agree to put Mason children in the forefront of planning, teaching and professional development. Teachers will provide multiple educational experiences for every learner to develop his or her best academically, socially, emotionally, and physically. Teachers will support and believe in the importance of an inclusive education by providing challenging curricula and instruction, which meets the individual needs of each child in reading, writing, mathematics, social studies, science and technology. Teachers will hold high expectations for achievement, behavior, and positive social interactions for everyone and will create a positive and respectful school culture that is nurturing, supportive, honors diversity; that celebrates one another’s achievements and accomplishments.
• All teachers at the Mason Pilot School agree to be, or actively pursuing, dual certification in elementary and special education.
• All teachers at the Mason Pilot School must be a member of at least one subcommittee (ILT, SST, MLT, etc) to take place during our extended day.
• Each year all teachers at the Mason Pilot School will be working towards their own personal goals for PDP’s towards recertification.
• All teachers at the Mason Pilot School agree to participate in CCL. • All teachers at the Mason Pilot School will implement Literacy Collaborative model in grades K-5
and the CLI model in early childhood. • All teachers at the Mason Pilot School will implement the TERC mathematics curriculum and Ten
Minute Math. • All teachers at the Mason Pilot School agree to open up their classrooms to learning site visits. • All teachers will administer internal and district/state assessments according to proper test
administration guidelines. Teachers will also turn in assessment results in accordance with pre-determined deadlines. Teachers will use data to inform their instruction as well as keep accurate and up-to-date information, including cumulative records, on students in an easy to find location.
• All Mason Pilot School Teachers will create opportunities for parents and families to be active partners in their children’s education and in our educational community, including monthly communication, parent conference during the day, and curriculum-related activities that are open to families such as: publishing parties, performances, etc. (Parent conferences will occur during the day and teachers will be provided with coverage.)
e. Dispute Resolution. (Follows the BTU Contract, p.27-29)
f. Performance Evaluation
The Mason Pilot School will use the performance evaluation system, described in Part V. G of the BTU contract. The teacher will maintain a copy of the Performance Evaluation Portfolio and the school will maintain another copy.
By signing this Agreement, I acknowledge that I have read all of the provisions of this Agreement and agree to all of its terms.
Date:
Name: _________________________________________
Accepted:
The Samuel Mason Pilot Elementary School
By: _____________________________________________________
Source: School files.

047
-2
6-
Exh
ibit
8T
he M
ason
’s 2
006
MC
AS
Res
ults
Dis
aggr
egat
ed b
y Su
bgro
ups
Th
e M
ason
's M
CA
S P
erfo
rman
ce R
esu
lts
By
Su
bgr
oup
a
20
06 A
dm
inis
trat
ion
(Gra
de
4)
Perc
ent o
f Stu
den
ts a
t Eac
h Pe
rfor
man
ce L
evel
b
En
glis
h L
angu
age
Art
s M
ath
emat
ics
AY
P S
ub
grou
p
# of
St
uden
ts
A
P
NI
W
CP
Ic A
P
N
I W
C
PI*
**
Afri
can
Am
eric
an/B
lack
17
0
53
47
0 80
.9
18
29
47
6 82
.4
His
pani
c/La
tino
8 N
A
NA
N
A
NA
N
A
NA
N
A
NA
N
A
NA
A
sian
Am
eric
an
0 N
A
NA
N
A
NA
N
A
NA
N
A
NA
N
A
NA
W
hite
4
NA
N
A
NA
N
A
NA
N
A
NA
N
A
NA
N
A
Stu
dent
s w
ith D
isab
ilitie
s 10
0
20
80
0 72
.5
0 17
25
50
87
.5
Eng
lish
Lang
uage
Lea
rner
s 12
0
42
58
0 77
.1
17
25
50
8 79
.2
Low
Inco
me
22
0 41
59
0
79.5
14
32
50
5
83.0
N
on-L
ow In
com
e 7
NA
N
A
NA
N
A
NA
N
A
NA
N
A
NA
N
A
Sour
ce:
Cas
ewri
ter
anal
ysis
from
Mas
sach
use
tts
Dep
artm
ent o
f Ed
ucat
ion.
A=
Ad
vanc
ed; P
=P
rofi
cien
t; N
I=N
eed
s Im
prov
emen
t; W
=W
arni
ng/
Faili
ng
a Perf
orm
ance
res
ult
s fo
r su
bgro
ups
wit
h te
n or
few
er s
tud
ents
are
not
con
sid
ered
sta
tist
ical
ly s
igni
fica
nt.
b Nee
ds
Impr
ovem
ent,
Pro
fici
ent,
and
Ad
vanc
ed p
erfo
rman
ce le
vels
are
all
cons
ider
ed p
assi
ng s
core
s on
the
MC
AS.
c The
Com
posi
te P
erfo
rman
ce I
ndex
(CP
I) is
a m
easu
re o
f the
ext
ent t
o w
hich
stu
den
ts a
re p
rogr
essi
ng to
war
d p
rofi
cien
cy in
Eng
lish
lang
uag
e ar
ts (E
LA
) and
mat
hem
atic
s. A
CPI
of 1
00 in
a g
iven
con
tent
ar
ea m
eans
that
all
stu
den
ts h
ave
reac
hed
pro
fici
ency
. CPI
sco
res
corr
espo
nd to
one
of s
ix p
erfo
rman
ce r
atin
g ca
tego
ries
: Ver
y H
igh
(90–
100)
; Hig
h (8
0–89
.9);
Mod
erat
e (7
0–79
.9);
Low
(60–
69.9
); V
ery
Low
(4
0–59
.9);
and
Cri
tica
lly L
ow (0
–39.
9).
Using Data to Improve Instruction at the Mason School 047
27
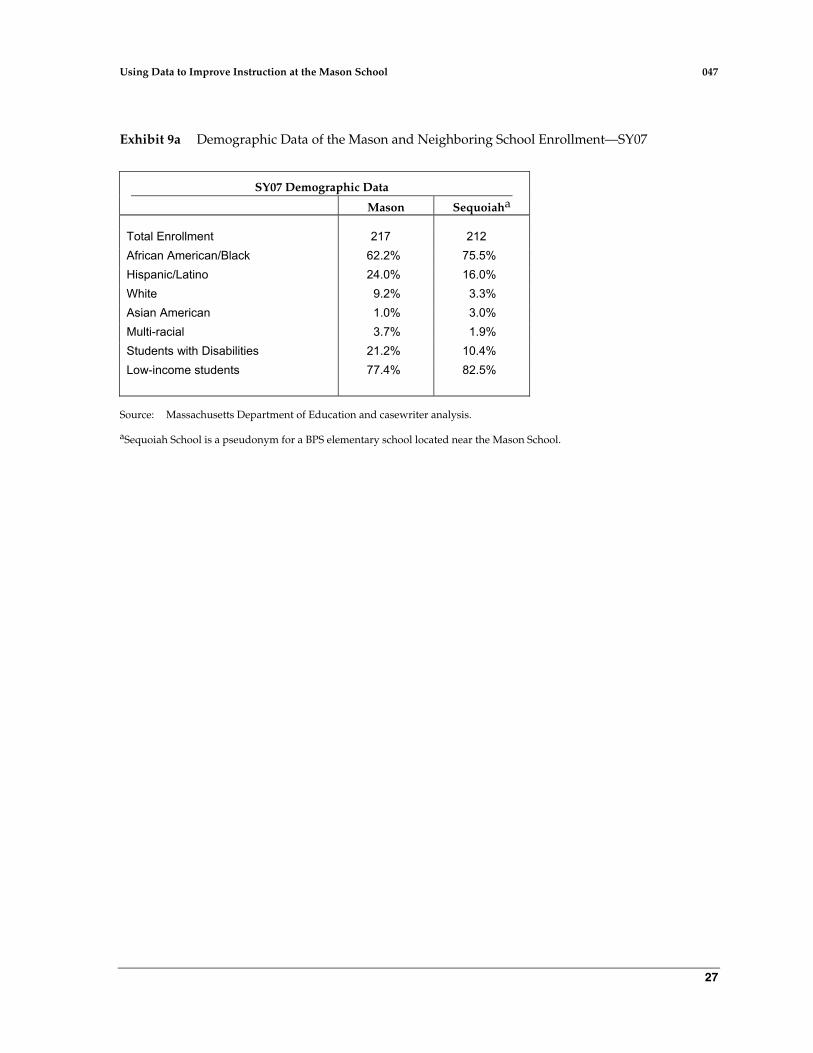
Exhibit 9a Demographic Data of the Mason and Neighboring School Enrollment—SY07
SY07 Demographic Data
Mason Sequoiaha Total Enrollment 217 212 African American/Black 62.2% 75.5% Hispanic/Latino 24.0% 16.0% White 9.2% 3.3% Asian American 1.0% 3.0% Multi-racial 3.7% 1.9% Students with Disabilities 21.2% 10.4% Low-income students 77.4% 82.5%
Source: Massachusetts Department of Education and casewriter analysis.
aSequoiah School is a pseudonym for a BPS elementary school located near the Mason School.
047 Using Data to Improve Instruction at the Mason School
28
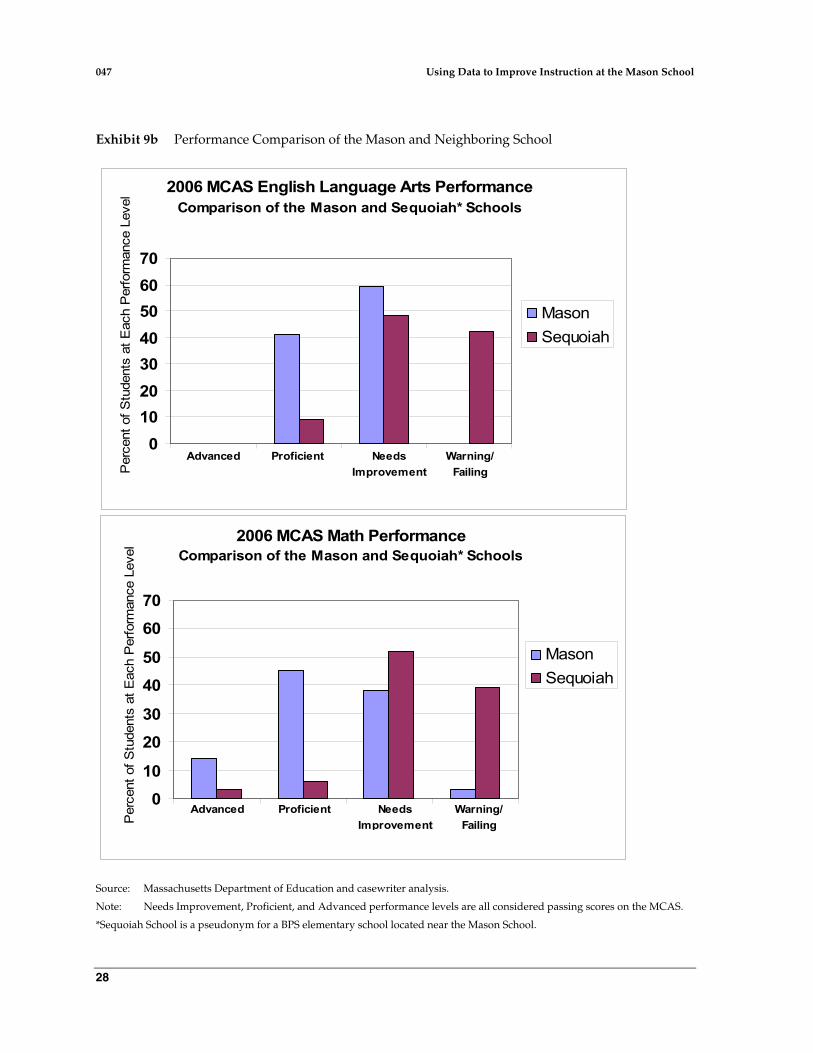
Exhibit 9b Performance Comparison of the Mason and Neighboring School
Source: Massachusetts Department of Education and casewriter analysis.
Note: Needs Improvement, Proficient, and Advanced performance levels are all considered passing scores on the MCAS.
*Sequoiah School is a pseudonym for a BPS elementary school located near the Mason School.
2006 MCAS English Language Arts PerformanceComparison of the Mason and Sequoiah* Schools
010203040506070
MasonSequoiah
Per
cent
of S
tude
nts
at E
ach
Per
form
ance
Lev
el
Advanced Proficient Needs Improvement
Warning/Failing
2006 MCAS Math PerformanceComparison of the Mason and Sequoiah* Schools
0
10
20
30
40
50
60
70
MasonSequoiah
Per
cent
of S
tude
nts
at E
ach
Per
form
ance
Lev
el
Advanced Proficient Needs Improvement
Warning/Failing