Embed Size (px)
Citation preview

WE ARE SOCIALCOPS.ORG
We are India’s largest open Data exchange. We work with corporates, Non-Profit Organizations and Govts. to help them make better decisions.
§ Our work has won accolades from the United Nations, Microsoft and IBM. § The Economic Times, Fast Company and
Times of India think our work is cool. § We reach millions of people in the remotest
parts of the country through our partner non profit and government networks.
§ We work with organizations to create strategies for Growth leading to high sales, Customer retention, drive brand loyalty, recall, value & higher sales.

70% OF THE GROWTH IN RETAIL IS EXPECTED TO COME FROM EMERGING MARKETS
SOCIALCOPS
More than 50% of India lies in the Working Population. And forms a major segment of the buying population. Source: Census 2011
E-commerce Sales to quadruple in the coming couple of years The only way ahead for traditional companies is to focus on targeted population segments to fight the e-commerce boom. Source: ET Retail report
India’s retail market is expected to double to $1 trillion by 2020 from $600 billion in 2015 Despite of high increase in the market economy, Big retail giants need to worry about the revenue spread among the home-run stores. Source: BCG Report

RURAL MARKETS ONLY CONTRIBUTE 40% OF THE TOTAL CONSUMPTION IN INDIA
Although Rural India constitutes 67% of India’s Population, but due to lack of Penetration of Brands and services in this region results in depleted sales results.
90% of the market is run by tiny family-run stores. Stiff competition faced from un-organised retail sector is a Major threat to the Retail chains. Source: BCG Report
100% FDI now allowed in the wholesale Market. International Retail giants like Tesco, Carrefour and Walmart are eyeing for partners to launch in India. Source: IBEF
SOCIALCOPS

Retail companies spend valuable money, time & resources reaching people who don’t need
or want their products.
What if we could ensure that every $ spent went on reaching a person who needed & wanted their products?
SOCIALCOPS

I’m sure you’ve asked yourself these questions
multiple times
How do I increase sales?
Am I targeting the right retailers and wholesalers?
Which new markets to expand to?
Which markets to launch a new product in?
Am I spending my money on the right growth markets?
SOCIALCOPS

Corporates, Governments and Nonprofits use our data to make better decisions everyday. We are India’s largest data exchange. Use our granular, household level information about emerging markets to make better decisions everyday.
MOBILE FIELD STAFF 3000+ mobile workers giving us data from remote areas.
PUBLIC DATA SOURCES We have access to approximately 1000+ government data sources.
DATA BANK We now have over 100 million data points by organizing public data from past 10 years.
NONPROFIT PARTNERS
120+ nonprofit partners reaching 2.5 million people pledge their internal data to us
SOCIALCOPS

GEO- INTELLIGENCE
What Data Do You Need?
1. DEMOGRAPHY
2.
3. 4.
• Population, Birth Rate, Death Rate• Household level breakdown (Gender, Age,
Address)• Occupation and Education• Deposits, Savings and Credits
• Post Offices, ATMs, Banks, Schools, Chemists, Doctors
• Subzi Mandis, Branded Showrooms, Village Industries
• Petrol Pumps, Fire Stations, LPG Filling Stations• Tourist Spots, Cinema Halls, Stadiums
INCOME & EXPENDITURE • Household Assets & Amenities• Item wise Consumer Expenditure • Deposits & Credits• Purchasing Power & Aspirations• CIBIL Scores• DDP, Poverty Status
ADVERTISING • Readership data for Periodicals, Newspapers,
other National as well as Vernacular publications• Monthly viewership data for Television Channels• Targeted campaigns case studies
SOCIALCOPS

THE DATA YOU NEED WILL DIFFER BASED ON YOUR ISSUE.
For instance, lets say you want to understand where you want to
open new stores to maximize the outreach effectiveness to increase sales.
SOCIALCOPS

Use our simple drag & drop interface to find the solution to your data problem.
SOCIALCOPS

Search a district…
Sort by: None Literacy Rate Population Sex Ratio Literacy Rate Area
DELHI- SOUTH 2.734 Million 1000:921 251 Sq. KM
Pick the cities, towns & states that you want to target
Which localities do your target consumers live in?
Search a district…
Sort by: Income Level Education Proximity to Services Amenities Credit Scores
DELHI- SOUTH; SAKET 2.734 Million 1000:921 251 Sq. KM
Search a district…
Sort by: Income Level Education Proximity to Services Sex Ratio Credit Scores
DELHI- SOUTH; SAKET 2.734 Million 1000:921 251 Sq. KM
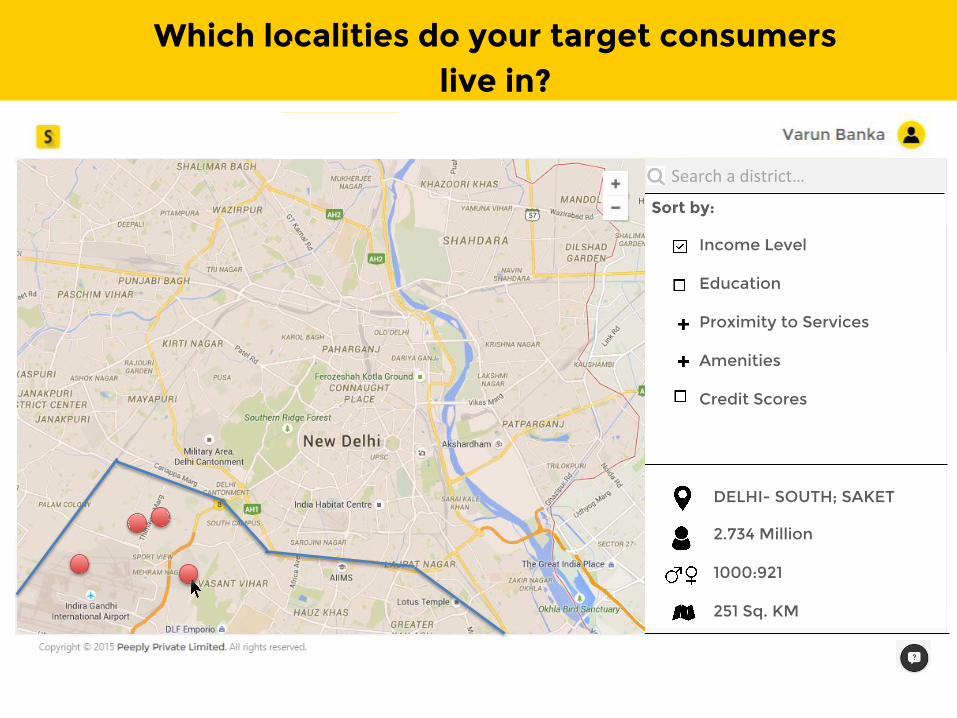
Where do the people who can afford your products live?
Dashboard
Select a Layer…
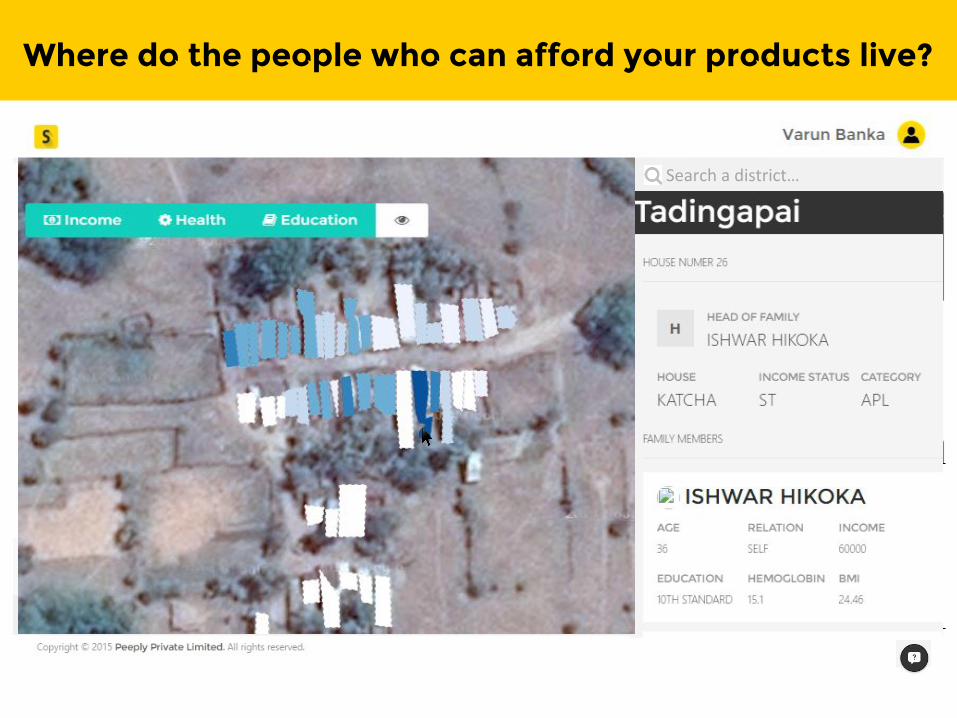
Proximity to Services Doctors Chemists ATMs Banks Police Stations Shopping Complex
DELHI- SOUTH; SAKET 2.734 Million 1000:921 251 Sq. KM
If you had to target these localities, where would you open a new Store?

Dashboard
Select a Layer…
Advertising Hotzones Hoarding SItes Periodicals Television Media National Daily
Layer Geography
DELHI- SOUTH; SAKET 2.734 Million 1000:921 251 Sq. KM
Where, How and When to advertise so as to get Maximum traction?

And answers to many more questions..
Where to advertise to gain most traction? What do Users think about your Products?
Where to offer Discounts and Offers?
We not only provide data – our product allows you to Search, Query & Visualize the data you
need to make a reliable decisions.

1 CLICK EXPORT
HOW TO SEARCH THROUGH THIS DATA? Search through millions of data points on our fast and powerful platform.
FAST & RELEVANT
ANY TYPE OF QUERY
DATA SECURITY
EASY DATA FILTERING
Lightning fast & relevant results for every search
Full text, location, numeric queries – you search inside datasets.
OVERVIEW OF FEATURES
POWERFUL INDEXING Using our superior ontology, filter by topics, tags & source.
Sort, refine & mathematically manipulate datasets.
Export data into excel, STATA or SPSS in one click of a button.
Maintain high standards of data security with firewall deployment.

HOW TO MAKE SENSE FROM THIS DATA? Create all types of data visualizations on our platform on the go.
DYNAMIC DASHBOARD
ON THE FLY ANALYTICS
Dynamic State, District Maps
Treemap Circular Dendogram
Clustered Force Layout Steam Graph
Dynamic Bar Chart
Use multi stakeholder views (divided geographically & issue based) to make sense of data at granular levels.
OVERVIEW OF FEATURES
Map relationships between columns, rank frequencies & create visualizations – all in one click.
SAMPLE VISUALIZATIONS

120+ partners 1.5 million people
We are a team of passionate engineers, economists & data scientists who believe that the solution to our world’s biggest problems lies in technology. Team draws from Goldman Sachs, Barclays Capital, Microsoft, IBM, Teach for India, Deloitte, Young India Fellowship Nanyang Technological University (Singapore), London School of Economics & IIT

The work we’ve done at the intersection of technology, data and people to have a positive influence on society have won us awards at the global level.
Including: NASSCOM Innovative Startup of the Year Forbes ‘30 under 30’ ; Fortune ‘40 under 40’ IBM Smarter Planet Challenge


LETS CHANGE THE WORLD TOGETHER!
Prukalpa Sankar [email protected]
+91 9910966512
@Social_Cops
www.socialcops.org
Reach out to us!