Embed Size (px)
Citation preview
Active Decision-making:Transforming Data into Useful Information
Rob Horner, Anne Todd, Steve Newton, Bob Algozzine, Kate Algozzinewww.pbis.orgwww.swis.orgwww.pbssurveys.org

Goals Logic for school-wide Positive Behavior
Support Design of “decision-systems” for schools Collection and use of data for decision-
making Whole school Targeted groups Individual student

Main Messages Supporting social behavior is central to achieving
academic gains.
School-wide PBS is an evidence-based practice for building a positive social culture that will promote both social and academic success.
Implementation of any evidence-based practice requires a more coordinated focus than typically expected.
What is School-wide Positive Behavior Support? School-wide PBS is:
A systems approach for establishing the social culture and individualized behavioral supports needed for schools to achieve both social and academic success for all students.
Evidence-based features of SW-PBS Prevention Define and teach positive social expectations Acknowledge positive behavior Arrange consistent consequences for problem behavior On-going collection and use of data for decision-making Continuum of intensive, individual interventions. Administrative leadership – Team-based implementation (Systems that
support effective practices)
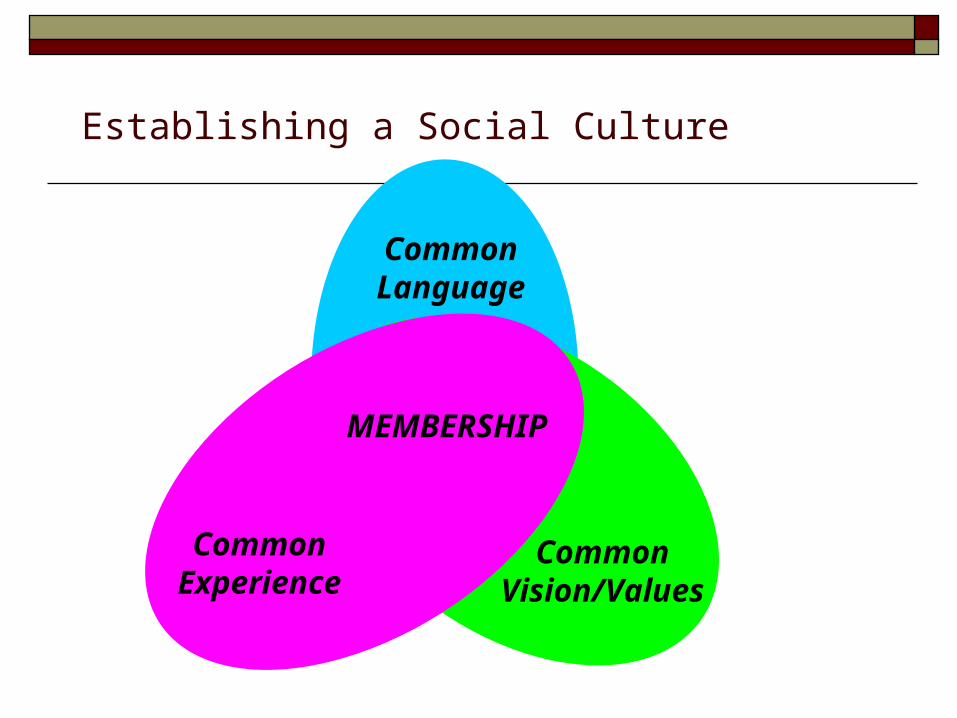
Establishing a Social Culture
Common Vision/Values
Common Language
Common Experience
MEMBERSHIP

7500 Schools across 44 states implementing school-wide positive behavior support

Six Basic Recommendations for Implementing PBIS Never stop doing what is already working
Always look for the smallest change that will produce the largest effect
Avoid defining a large number of goals Do a small number of things well
Do not add something new without also defining what you will stop doing to make the addition possible.

Six Basic Recommendations for Implementing PBIS Collect and use data for decision-making
Adapt any initiative to make it “fit” your school community, culture, context.
Families Students Faculty Fiscal-political structure
Establish policy clarity before investing in implementation LAUSD.pptx

Primary Prevention:School-/Classroom-Wide Systems for
All Students,Staff, & Settings
Secondary Prevention:Specialized Group
Systems for Students with At-Risk Behavior
Tertiary Prevention:Specialized
IndividualizedSystems for Students
with High-Risk Behavior
~80% of Students
~15%
~5%
SCHOOL-WIDE POSITIVE BEHAVIOR
SUPPORT
Nation
Nebraska

(n = 201)
Michigan: Distribution of Elementary Reading Intervention Level
0%
10%
20%
30%
40%
50%
60%
70%
80%
90%
100%
All Students Students with 6+ ODRs
Benchmark Strategic Intensive
Reading Intervention Level (based on DIBELS)
24%
33%
43%
56%
24%
20%
(n = 4074)
Dr. Steve Goodman
Kent
Miora
Amanda
Jorge
Steve

Using Data within PBIS Use data to assess current status
EBS Self-assessment Survey
Use data to assess implementation fidelity Team Implementation Checklist (TIC) School-wide Evaluation Tool (SET) Benchmarks of Quality (BoQ)
Use data to assess impact on students Office Discipline referrals
pbssurveys.org

Use Data for Decision-making
“We are all continually faced with a series of great opportunities, brilliantly disguised as insoluble problems.”
John Gardner
Main Ideas Decisions are more likely to be effective and
efficient when they are based on data.
The quality of decision-making depends most on the first step (defining the problem to be solved)
Define problems with precision and clarity

Main Ideas Data help us ask the right questions…they do
not provide the answers: Use data to Identify problems Refine problems Define the questions that lead to solutions
Data help place the “problem” in the context rather than in the students.

Main Ideas The process a team uses to “problem solve”
is important: Roles:
Facilitator; Recorder; Data analyst; Active member
Organization Agenda; Old business (did we do what we said we would
do); New business; Action plan for decisions. What happens BEFORE a meeting What happens DURING a meeting What happen AFTER a meeting
Agenda, data summary, positive nagUpdates, identify problem, problem solve
Minutes posted, tasks completed
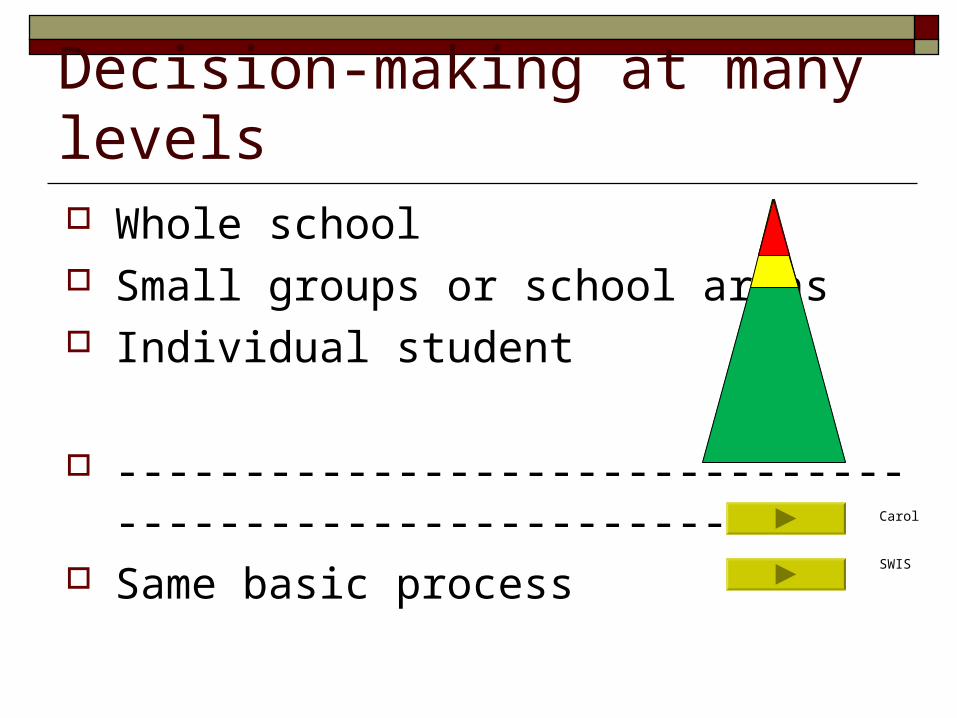
Decision-making at many levels Whole school Small groups or school areas Individual student
------------------------------------------------------- Same basic process Carol
SWIS

CollectCollect and Useand Use
DataData
Review Status and
Identify Problems
Develop andRefine
Hypotheses
Discuss andSelect
Solutions
Develop andImplementAction Plan
Evaluate andRevise
Action Plan
Problem Solving Foundations
Team Initiated Problem Solving (TIPS) Model

Using Data Use data to identify a possible problem?
Use data to build a precise “problem statement?
Use data to select a solution (intervention)
Use data to assess if a solution is (a) being implemented, and (b) being effective.

Use data within “decision systems” not “data systems”
Question Decision Data SourceIs there a problem?Primary/Precise problem statement.
Should we allocate resources to this problem?
Compare “observed” with “expected” (ODRs, ORF)
Is there a reasonable solution?
Do we have a reasonable intervention, and should it be implemented?
Technical adequacyContextual Fit
Is the intervention being implemented as planned?
Do we need more resources to implement the intervention?
On-going data related to fidelity of implementation
Is the intervention proving effective?
Should we continue the intervention, modify it, or terminate it?
On-going data related to impact of the intervention on student behavior

Using Data
Use data in “decision layers”
Don’t drown in the data
It’s “OK” to be doing well

? Problem ?
Beh Location Time Studentof
Day
Setting A B C D E F G H I J K
Locations 1 2 3 4 5 6 7 8 9 10
Times A B C D E F G H I J K
Students 1 2 3 4 5 6 7 8 9 10 11

Problem ?
Systems ?
Local/Individual ?

Problem ?
Systems ?
Local/Individual ?

Problem ?
Systems ?
Local/Individual ?

Problem ?
Systems ?
Local/Individua l ?

Six things to avoid Define a solution before defining the problem
Build solutions from broadly defined, or fuzzy problem statements
Failure to use data to confirm/define problem
Agree on a solution without building a plan for how to implement or evaluate the solution
Agree on a solution but never assess if the solution was implemented
Serial problem solving without decisions

Using Data for Decision-making at the Whole School Level Identifying “problems” with “precision”
Well defined problems prompt functional solutions
Poorly defined problems prompt discussions in which the problem is admired, but not addressed.
“Well begun is half done” Aristotle, quoting a proverb

Precise Problem Statements(What are the data we need for a decision?) Solvable problem statements include
information about the five core “W” questions. What is problem, and how often is it happening Where is it happening Who is engaged in the behavior When the problem is most likely Why the problem is sustaining

“Everything is vague to a degree you do not realize till you have tried to make it precise.”
Bertrand Russell
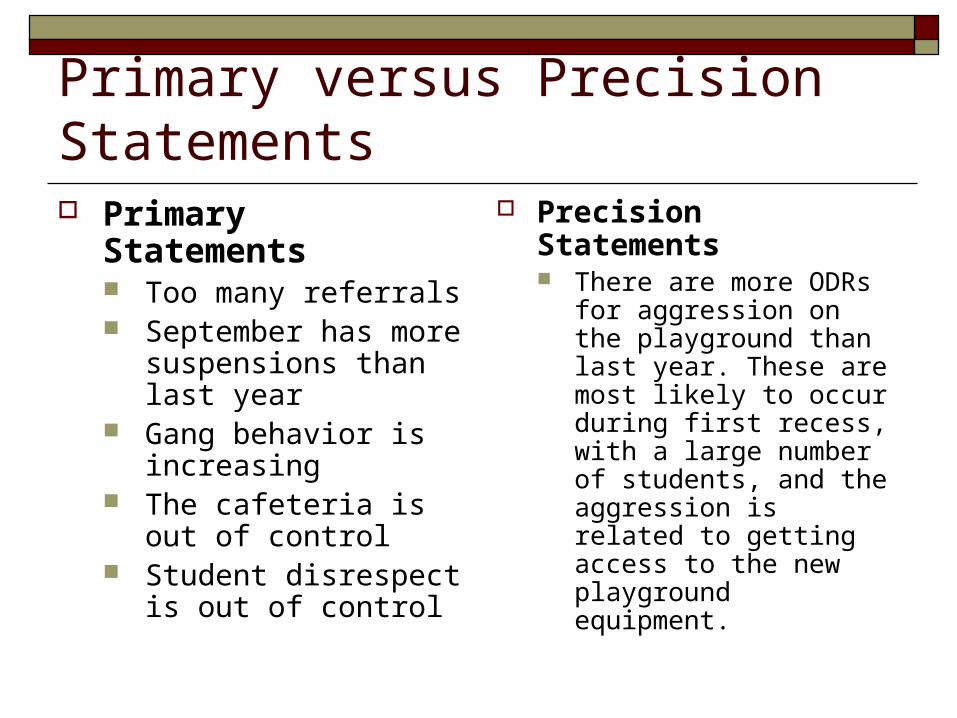
Primary versus Precision Statements Primary Statements
Too many referrals September has more
suspensions than last year
Gang behavior is increasing
The cafeteria is out of control
Student disrespect is out of control
Precision Statements There are more ODRs
for aggression on the playground than last year. These are most likely to occur during first recess, with a large number of students, and the aggression is related to getting access to the new playground equipment.

Precise or Primary Statement? Children are using inappropriate language
with a high frequency in the presence of both adults and other children. This is creating a sense of disrespect and incivility in the school
James D. is hitting others in the cafeteria during lunch, and his hitting is maintained by peer attention.

Precise or Primary Statement? ODRs during December are higher than in any other
month.
Minor disrespect and disruption are increasing over time, and are most likely during the last 15 minutes of our block periods when students are engaged in independent seat work. This pattern is most common in 7th and 8th grades, involves many students, and appears to be maintained by escape from work (but may also be maintained by peer attention… we are not sure).

Precise or Primary Statement? Three 5th grade boys are name calling and
touching girls inappropriately during recess in an apparent attempt to obtain attention and possibly unsophisticated sexual expression.
Boys are engaging in sexual harassment

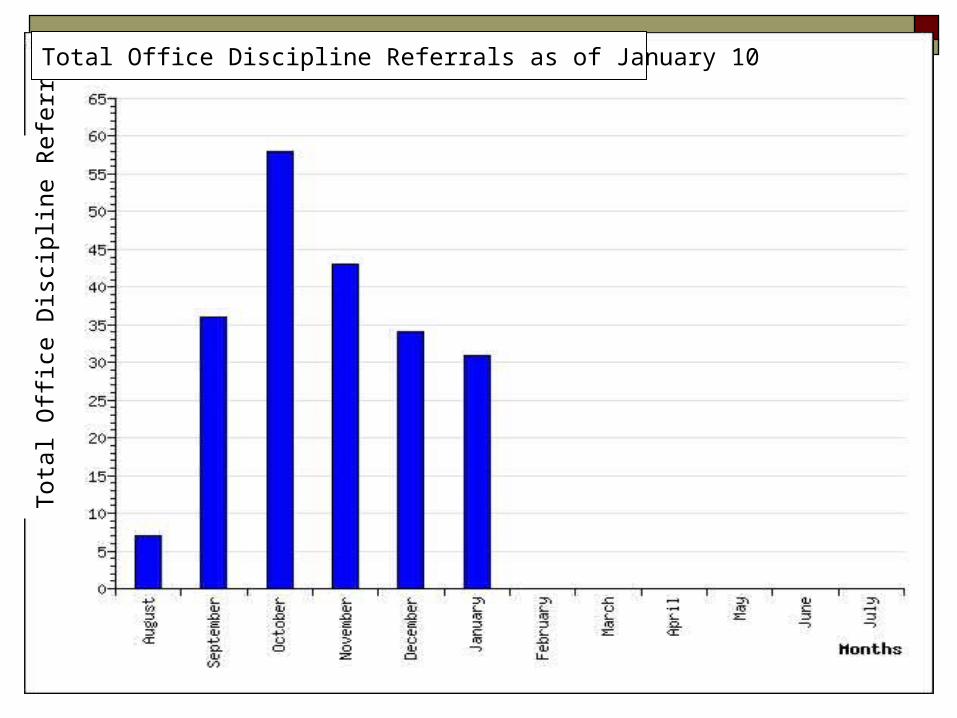
Organizing Data for Decision-making Compare data across time Moving from counts to count/month

Using Data Identifying a possible problem: A difference
between what you want and what you have. What data to review?
Office discipline referrals per day per month Avoid simple counts Avoid one data point (look at trends)
How to use data Compare with national standards Compare with local standards Compare with prior experience
Tota
l Offi
ce D
isci
plin
e R
efer
rals
Total Office Discipline Referrals as of January 10

Average Office Discipline Referrals per day per month as of January 10
Change Report OptionsChange Report Options1.41.82.72.52.753.4900.000

SWIS summary 07-08 (Majors Only)2,532 schools; 1,300,140 students; 1,139,119 ODRs
Grade Range Number of Schools
Mean Enrollment per school
Mean ODRs per 100 per school day
K-6 1762 444 .35 (sd=.46)(1 /300 / day)
6-9 482 653 .92 (sd=1.42)(1/ 110 / day)
9-12 176 914 1.06 (sd=.1.57)(1/105 / day)
K-(8-12) 312 401 1.00 (sd=.1.86)(1/ 155 / day

Interpreting Office Referral Data:Is there a problem? Absolute level (depending on size of school)
Middle, High Schools (> 1 per day per 100) Elementary Schools (>1 per day per 300)
Trends Peaks before breaks? Gradual increasing trend across year?
Compare levels to last year Improvement?

Office Discipline Referrals per Day per Month per 100 Students
0
2
4
6
8
10
12
14
16
Sept Oct Nov Dec Jan Feb March April May June
# pe
r day
per
100
stu
dent
s
Series1
Application Activity: Absolute ValueIs there a Problem?
Middle School of 625 students?Compare with national average: 625/100 = 6.25 6.25 X .92 = 5.75
Off
ice
Dis
cipl
ine
Ref
erra
ls p
er S
choo
l Day

0
0.5
1
1.5
2
Ave
Ref
erra
ls p
er D
ay
Sept Oct Nov Dec Jan Feb Mar Apr May Jun
School Months
Office Referrals per Day per MonthLast year
Elementary School with 150 StudentsCompare with National Average 150 / 100 = 1.50 1.50 X .35 = .53

0
5
10
15
20
Ave
Ref
erra
ls p
er D
ay
Sept Oct Nov Dec Jan Feb Mar Apr May Jun
School Months
Office Referrals per Day per MonthLast year
High School of 1800 students
Compare with National Average 1800 / 100 = 18 18 X 1.06 = 19.08

0
5
10
15
20
Ave
Ref
erra
ls p
er D
ay
Sept Oct Nov Dec Jan Feb Mar Apr May Jun
School Months
Office Referrals per Day per MonthThis Year
Middle School of 700 students

0
5
10
15
20
Ave
Ref
erra
ls p
er D
ay
Sept Oct Nov Dec Jan Feb Mar Apr May Jun
School Months
Office Referrals per Day per MonthLast Year and This Year

0
5
10
15
20
Ave
Ref
erra
ls p
er D
ay
Sept Oct Nov Dec Jan Feb Mar Apr May Jun
School Months
Office Referrals per Day per MonthLast Year and This Year

0
5
10
15
20
Ave
Ref
erra
ls p
er D
ay
Sept Oct Nov Dec Jan Feb Mar Apr May
School Months
Office Referrals per Day per MonthThis Year
Middle School
N= 495
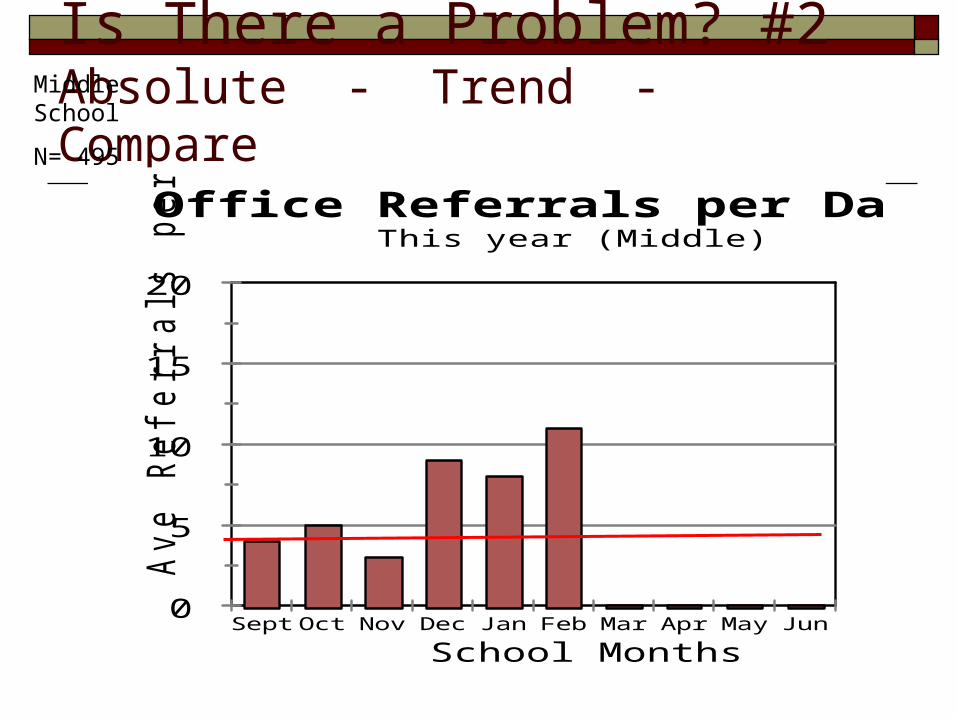
Is There a Problem? #2Absolute - Trend - Compare
0
5
10
15
20
Ave
Ref
erra
ls p
er D
ay
Sept Oct Nov Dec Jan Feb Mar Apr May Jun
School Months
Office Referrals per Day per MonthThis year (Middle)
Middle School
N= 495

0
5
10
15
20
Ave
Ref
erra
ls p
er D
ay
Sept Oct Nov Dec Jan Feb Mar Apr May Jun
School Months
Office Referrals per Day per MonthLast Year and This Year
Middle School
N= 495

0
5
10
15
20
Ave
Ref
erra
ls p
er D
ay
Sept Oct Nov Dec Jan Feb Mar Apr May Jun
School Months
Office Referrals per Day per MonthLast Year and This Year
Middle School
N= 495

What are the data you are most likely to need to move from a Primary to a Precise statement? What problem behaviors are most common?
ODR per Problem Behavior Where are problem behaviors most likely?
ODR per Location When are problem behaviors most likely?
ODR per time of day Who is engaged in problem behavior?
ODR per student Why are problem behaviors sustaining?
No graph

What other data may you want? ODR by staff ODR by IEP ODR by grade ODR by gender by grade

Test precision problem statement Use precision problem statement to build and
test hypotheses. Problems are most common in D-Hall wing Problems are more likely during second recess Problems are most common during assembly schedule Problems are more likely during state testing periods

What behaviors are problematic?
0
10
20
30
40
50
Num
ber o
f Ref
erra
ls
Lang Achol ArsonBombCombsDefianDisruptDressAgg/fgtTheftHarassProp D Skip Tardy Tobac Vand Weap
Types of Problem Behavior
Referrals per Prob Behavior

What behaviors are problematic?
0
10
20
30
40
50
Num
ber o
f Ref
erra
ls
Lang Achol ArsonBombCombsDefianDisruptDressAgg/fgtTheftHarassProp D Skip Tardy Tobac Vand Weap
Types of Problem Behavior
Referrals per Prob Behavior

What behaviors are problematic?
0
5
10
15
Num
ber o
f Ref
erra
ls
Lang Achol ArsonBombCombsDefianDisruptDressAgg/fgtTheftHarassProp D Skip Tardy Tobac Vand Weap
Types of Problem Behavior
Referrals per Prob Behavior

Where are the problems occurring?
0
10
20
30
40
50
Num
ber o
f Offi
ce R
efer
rals
Bath RBus A Bus Caf ClassComm Gym Hall Libr Play G Spec Other
School Locations
Referrals by Location

0
10
20
30
40
50
Num
ber o
f Offi
ce R
efer
rals
Bath RBus A Bus Caf ClassComm Gym Hall Libr Play G Spec Other
School Locations
Referrals by LocationWhere are the problems occurring?

Who is contributing to the problem?Referrals per Student
0
10
20
Num
ber o
f Ref
erra
ls p
er S
tude
nt
Students

Who is contributing to the problem?
0
10
20
Num
ber o
f Ref
erra
ls p
er S
tude
nt
Students
Students per Number of Referrals

When are the problems occurring?
0
5
10
15
20
25
30
Num
ber o
f Ref
erra
ls
7:00 7:30 8:00 8:30 9:00 9:30 10:0010:30 11:00 11:3012:0012:30 1:00 1:30 2:00 2:30 3:00 3:30
Time of Day
Referrals by Time of Day

When are the problems occurring?
0
5
10
15
20
25
30
Num
ber o
f Ref
erra
ls
7:00 7:30 8:00 8:30 9:00 9:30 10:0010:3011:00 11:30 12:0012:30 1:00 1:30 2:00 2:30 3:00 3:30
Time of Day
Referrals by Time of Day
Moving to fine-grained analysis SWIS Custom Reports
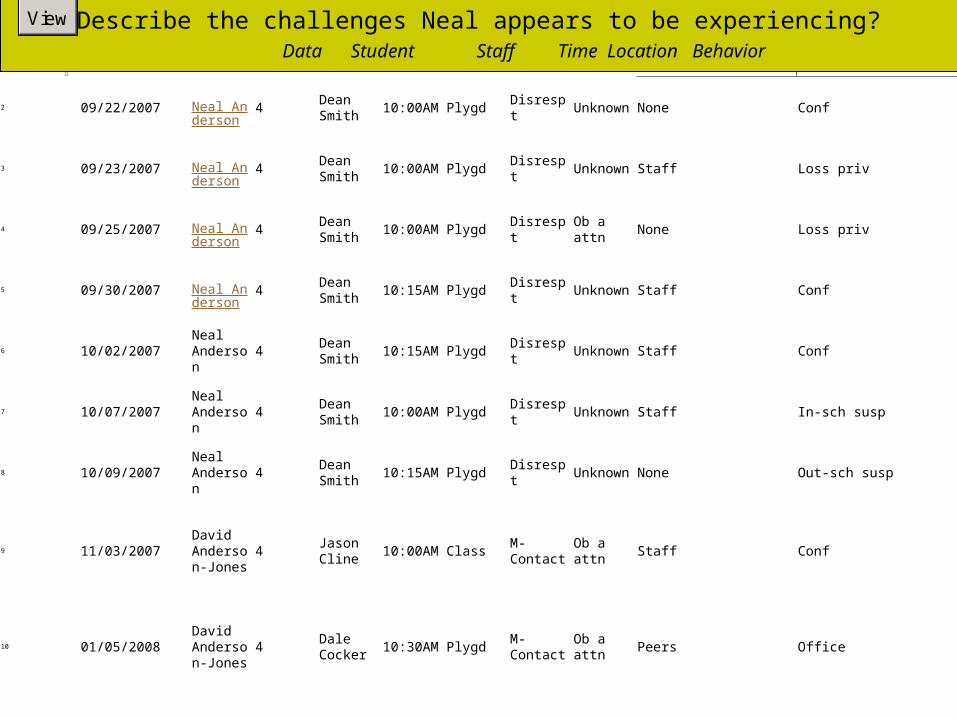
09/20/2007 Neal Anderson
4 Dean Smith 10:15AM Plygd Disrespt Unknown None Conf
2 09/22/2007 Neal Anderson
4 Dean Smith 10:00AM Plygd Disrespt Unknown None Conf
3 09/23/2007 Neal Anderson
4 Dean Smith 10:00AM Plygd Disrespt Unknown Staff Loss priv
4 09/25/2007 Neal Anderson
4 Dean Smith 10:00AM Plygd Disrespt Ob a attn None Loss priv
5 09/30/2007 Neal Anderson
4 Dean Smith 10:15AM Plygd Disrespt Unknown Staff Conf
6 10/02/2007 Neal Anderson 4 Dean
Smith 10:15AM Plygd Disrespt Unknown Staff Conf
7 10/07/2007 Neal Anderson 4 Dean
Smith 10:00AM Plygd Disrespt Unknown Staff In-sch susp
8 10/09/2007 Neal Anderson 4 Dean
Smith 10:15AM Plygd Disrespt Unknown None Out-sch susp
9 11/03/2007David Anderson-Jones
4 Jason Cline 10:00AM Class M-Contact Ob a attn Staff Conf
10 01/05/2008David Anderson-Jones
4 Dale Cocker 10:30AM Plygd M-Contact Ob a attn Peers Office
Describe the challenges Neal appears to be experiencing? Data Student Staff Time Location Behavior
ViewViewViewViewViewViewViewViewView
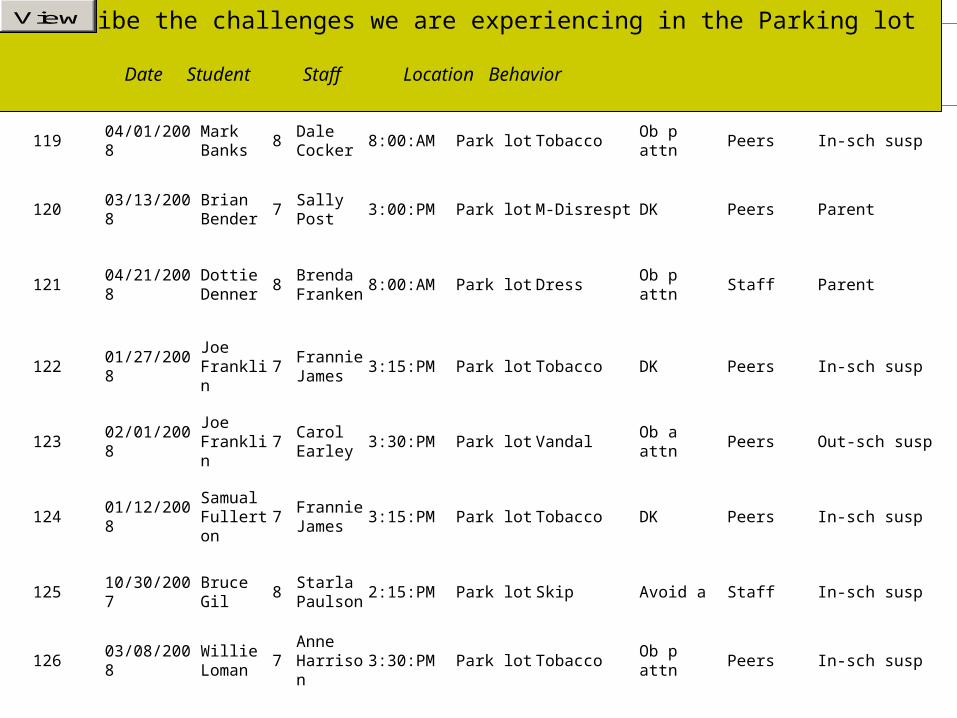
8 Debbie Calhoun 3:15:PM
Park lot
Agg/Fight Ob p attn Peers Out-sch susp
119 04/01/2008 Mark Banks 8 Dale
Cocker 8:00:AM Park lot Tobacco Ob p attn Peers In-sch susp
120 03/13/2008 Brian Bender 7 Sally Post 3:00:PM Park lot M-Disrespt DK Peers Parent
121 04/21/2008 Dottie Denner 8 Brenda
Franken 8:00:AM Park lot Dress Ob p attn Staff Parent
122 01/27/2008 Joe Franklin 7 Frannie
James 3:15:PM Park lot Tobacco DK Peers In-sch susp
123 02/01/2008 Joe Franklin 7 Carol
Earley 3:30:PM Park lot Vandal Ob a attn Peers Out-sch susp
124 01/12/2008 Samual Fullerton 7 Frannie
James 3:15:PM Park lot Tobacco DK Peers In-sch susp
125 10/30/2007 Bruce Gil 8 Starla Paulson 2:15:PM Park lot Skip Avoid a Staff In-sch susp
126 03/08/2008 Willie Loman 7 Anne
Harrison 3:30:PM Park lot Tobacco Ob p attn Peers In-sch susp
Describe the challenges we are experiencing in the Parking lot
Date Student Staff Location Behavior
ViewViewViewViewViewViewViewView

A Context for Designing Solutions Behavior support is the redesign of
environments, not the redesign of individuals Attend as much, or more, to what happens between
problem behavior bouts as what happens during instances of problem behavior.
(Edward Carr)
Positive Behavior Support plans define changes in the behavior of those who will implement the plan.

Building Solutions Packages versus Practices
Many good ideas, packages and procedures exist Most are expensive to implement, and not a perfect fit
with your problem Be efficient as well as effective
Most good interventions will be multi-component
Be wary of the one-trick strategy.

Using Data to Build Solutions:Four Elements to Consider Prevention: How can we avoid the problem context?
Who, When, Where Schedule change, curriculum change, etc
Teaching: How can we define, teach, and monitor what we want? Teach appropriate behavior Use problem behavior as negative example
Recognition: How can we build in systematic reward for desired behavior?
Extinction: How can we prevent problem behavior from being rewarded?
Consequences: What are efficient, consistent consequences for problem behavior?
Monitoring: How will we collect and use data to evaluate (a) implementation fidelity, and (b) impact on student outcomes?

Solution DevelopmentPrevention
Teaching
Reward
Extinction
Corrective Consequence
Data Collection

Problem solving Mantra Do we have a problem?
(Identify the primary problem)
What is the precise nature of the problem? (Define, clarify, confirm/disconfirm inferences)
Why does the problem exist, & what should we do about it? (Hypothesis & solution)
What are the actual elements of our plan? (Action Plan… what will we do, who will do it, when it get done)
Is our plan being implemented? (Evaluate & revise plan)
Is the plan having the desired effect? (Maintain, modify or terminate the plan)

Quick example of the five step process with East Elementary
500 students K-5

Rose Elementary
Enrollment: 500 studentsGrades: K – 5
National Mean Level of ODRs for Elementary Schools is .35 per 100 students per day, or 1.75 for a school of 500 (downloaded from www.swis.org Aug 30, 2007)
Step one: review status and identify problems

Rose Elementary Problem Identified1. For all but one month during last year (2004-2005), the rate of
ODRs per day exceeded the national average reported by elementary schools across the United States
2. The data show a minimal trend across months, but there are noticeable increases in the ODR level in December and March.
3. For each month of the last school year, the level of ODRs per day exceeded the level from the corresponding month during the prior school year (2003-2004)
4. Teachers, families, and students themselves have reported that student problem behavior is unacceptable and presents a barrier to effective instruction.

Step two: develop and clarify hypothesis


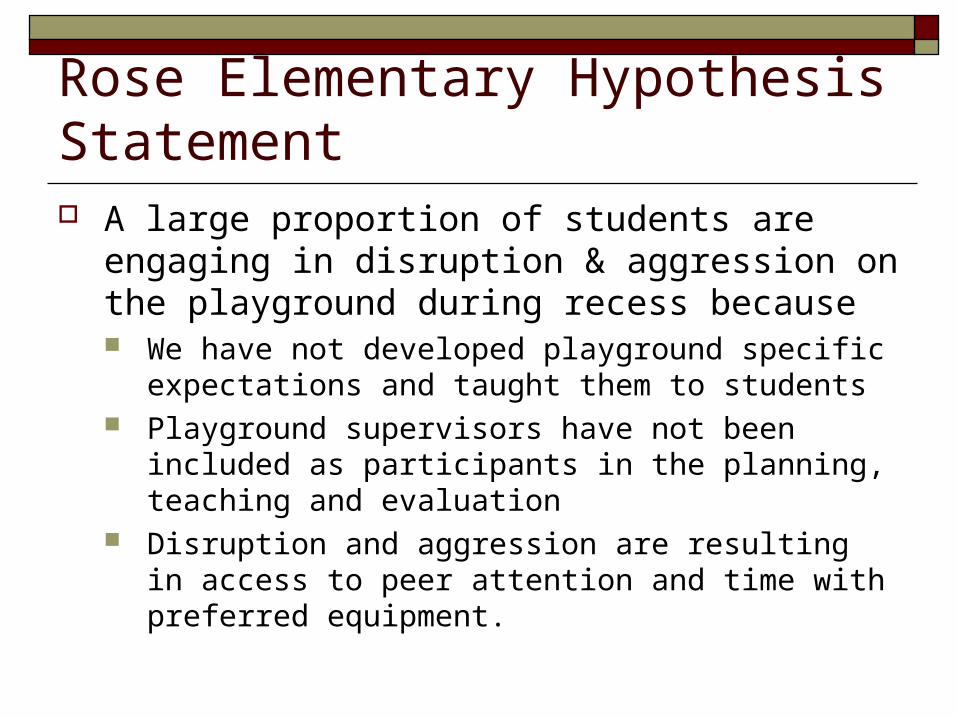
Rose Elementary Hypothesis Statement A large proportion of students are engaging in
disruption & aggression on the playground during recess because We have not developed playground specific expectations
and taught them to students Playground supervisors have not been included as
participants in the planning, teaching and evaluation Disruption and aggression are resulting in access to peer
attention and time with preferred equipment.

Prevent problem behavior situation Ensure that supervisors are on the playground and are engaged in active supervision .
Teach appropriate behavior Teach the school-wide behavior expectations of being safe, respectful, and responsible, and do the teaching on the playground where problem behaviors are most likely.
Reward appropriate behavior Provide a formal system for playground supervisors to recognize appropriate play on the playground.
Reduce reward for problem behavior Teach all students to signal “stop” when they are treated disrespectfully.Teach playground supervisors to ensure that aggression and disruption are not allowed to gain access to preferred activities or materials.
Deliver corrective consequences for problem behavior Review continuum of consequences for problem behavior on playground with students and supervisors and make sure continuum is in effect.
Collect data to assess if the intervention (a) is implemented with fidelity and (b) produces desired impact on student behavior.
Collect, summarize and report data.
Step 3: Discuss and Select Solutions Rose Elementary Example

Designing Solutions If many students are making the same mistake
it typically is the system that needs to change not the students.
Teach, monitor and reward before relying on punishment.
An example (hallways)
Examples

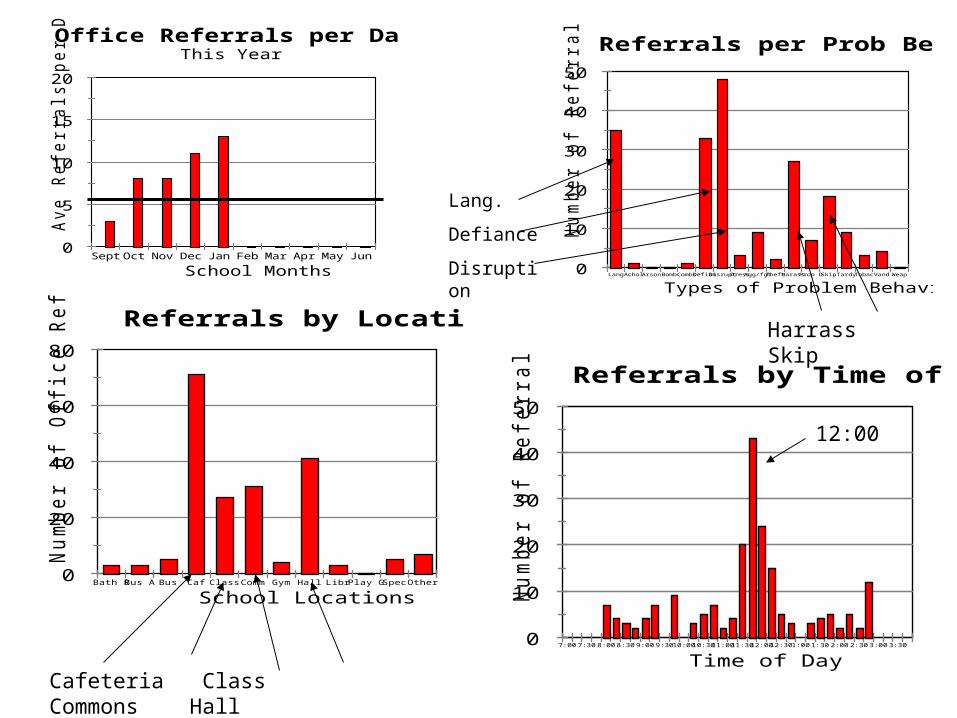
Trevor Test Middle School
565 studentsGrades 6,7,8
0
5
10
15
20 Av
e R
efer
rals
per
Day
Sept Oct Nov Dec Jan Feb Mar Apr May Jun
School Months
Office Referrals per Day per MonthThis Year
0
10
20
30
40
50
Num
ber o
f Ref
erra
ls
Lang Achol ArsonBombCombsDefianDisruptDressAgg/fgtTheftHarassProp D Skip Tardy Tobac Vand Weap
Types of Problem Behavior
Referrals per Prob Behavior
0
20
40
60
80
Num
ber o
f Offi
ce R
efer
rals
Bath RBus A Bus Caf ClassComm Gym Hall Libr Play G Spec Other
School Locations
Referrals by Location
0
10
20
30
40
50
Num
ber o
f Ref
erra
ls
7:00 7:30 8:00 8:30 9:00 9:30 10:0010:3011:00 11:30 12:0012:30 1:00 1:30 2:00 2:30 3:00 3:30
Time of Day
Referrals by Time of Day
Cafeteria Class Commons Hall
12:00
Lang.
Defiance
Disruption
Harrass Skip

75 students with 1 ODR; 28 students with 2 ODRsThis report is for 3 or more ODRs

/2007 Samual Fullerton 7 Ann Patterson 12:30PM Café Disruption Ob a attn Staff Detent
14 Chris Black 6 Brenda Franken 12:00PM Café M-Disrespt Ob a attn Teacher Loss priv
15 John Candy 8 Joy Songbird 12:00PM Café Disruption Ob p attn Peers Loss priv
16 Samual Fullerton 7 Cathy Petterson 12:30PM Café Harass Ob p attn Peers Conf
17 Issac Spillman 5 Tanya Stewart 11:45AM Café Harass Ob p attn Peers Office
18 Chris Black 6 Mary Smith 12:00PM Café Forge/Theft Ob itm Peers In-sch susp
Custom ReportODRs for This Week from Cafeteria
ViewViewViewViewView
Precision Statement/Hypothesis What Where When Who Why What other info needed?
Possible Solutions?

Precise Problem Statement &Hypothesis Development Many students from all grade levels are engaging in
disruption, inappropriate language and harassment in cafeteria and hallway during lunch, and the behavior is maintained by peer attention
A smaller number of students engage in skipping and noncompliance/defiance in classes, (mostly in rooms 13, 14 and 18), and these behaviors appear to be maintained by escape.

Solution DevelopmentPrevention
Teaching
Reward
Extinction
Corrective Consequence
Data Collection

Solution Development:For disruption in hall and cafeteriaPrevention *Teach behavioral expectations in
cafeteria*Maintain current lunch schedule, but shift classes to balance numbers.
Teaching
Reward Establish “Friday Five”: Extra 5 min of lunch on Friday for five good days.
Extinction Encourage all students to work for “Friday Five”… make reward for problem behavior less likely
Corrective Consequence Active supervision, and continued early consequence (ODR)
Data Collection Maintain ODR record and supervisor weekly report

Langley Elementary School478 StudentsK-5


Precision Statement/Hypothesis What Where When Who Why What other info needed?
Possible Solutions?

Solution DevelopmentPrevention
Teaching
Reward
Extinction
Corrective Consequence
Data Collection

Next Steps High School Example Your School Individual Student Supports Planning for implementation
Sandhill High school354 students

Sandhill High School: 354 students

Sandhill High School

Sandhill High School
Custom Report: Classroom Many students in many contexts… primarily
disrespect, and skipping.

Precision Statement/Hypothesis What Where When Who Why What other info needed?

Grade Level Example Mark Twain Elementary
Elliot Middle
Gorman High School

Your School Use the Office Discipline Referral Summary
Build from your SWIS data, or your best guess from 07-08
Compute the national average for your school Elementary .35 per 100 per day Middle .92 per 100 per day High 1.06 per 100 per day K- (8 or 12) 1.00 per 100 per day Enrollment / 100 X (rate for your grade level)
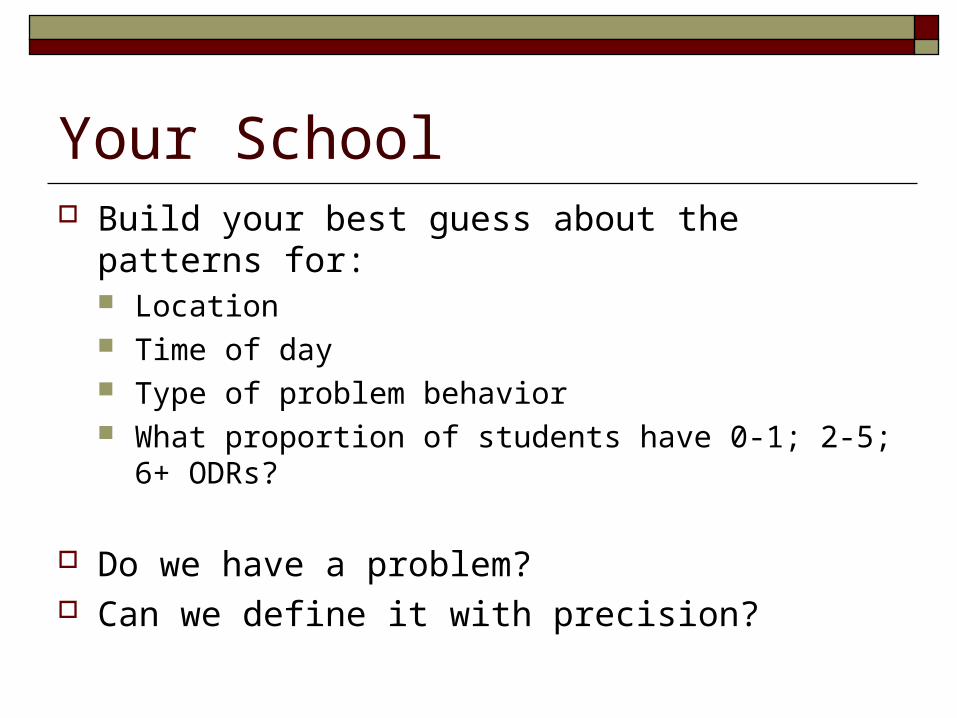
Your School Build your best guess about the patterns for:
Location Time of day Type of problem behavior What proportion of students have 0-1; 2-5; 6+ ODRs?
Do we have a problem? Can we define it with precision?

Your School Review Data Do we have a problem? Define problem with precision (or plan party) Develop solution options Define Action plan needed to implement
solution

Solution DevelopmentPrevention
Teaching
Reward
Extinction
Corrective Consequence
Data Collection

Your School Use the solution model to build “possible
elements of a solution” Remember that you may have many that are
appropriate Identify many, then select the option(s) that are most
likely to be both effective and “doable” in your school
Action Plan Who will do what when?