Embed Size (px)
Citation preview
Standards
Certification
Education & Training
Publishing
Conferences & Exhibits
Using Data Analytics to
Monitor and Reduce Energy
Consumption
WWTP Case Study
2016 ISA Water / Wastewater and Automatic Controls Symposium
August 2-4, 2016 – Orlando, Florida, USA
Steve Wortendyke
2016 ISA WWAC Symposium
Aug 2-4, 2016 – Orlando, Florida, USA 2
Presenter
• Steve Wortendyke
480-842-1195
• Business Development, Smart
Integrated Infrastructure, Water
Solutions
• 17 years in Water/Wastewater Business
• 6 years in Semiconductor Business
• 6 years USAF, Captain, B-52s
• BS, Chemistry; MBA
Headshot
photo
2016 ISA WWAC Symposium
Aug 2-4, 2016 – Orlando, Florida, USA 3
Presentation Outline
• Rise of the Smart City
• The Path from Big Data to Analytics
• Developing the Smart Utility
• WWTP Energy Optimization Case Study
2016 ISA WWAC Symposium
Aug 2-4, 2016 – Orlando, Florida, USA 4
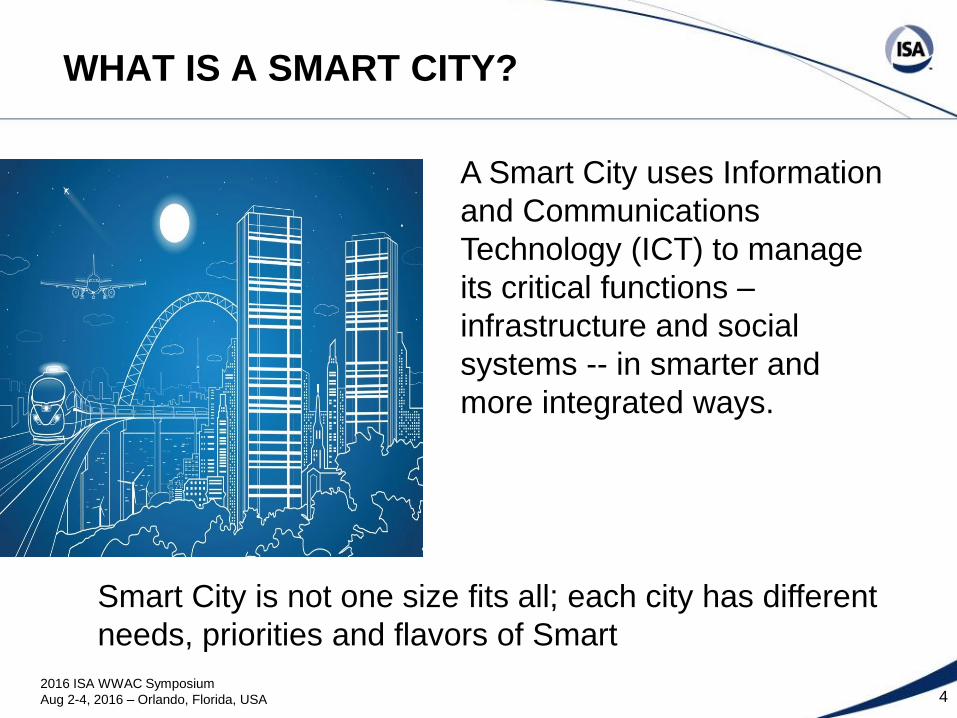
WHAT IS A SMART CITY?
A Smart City uses Information
and Communications
Technology (ICT) to manage
its critical functions –
infrastructure and social
systems -- in smarter and
more integrated ways.
Smart City is not one size fits all; each city has different
needs, priorities and flavors of Smart
2016 ISA WWAC Symposium
Aug 2-4, 2016 – Orlando, Florida, USA 5
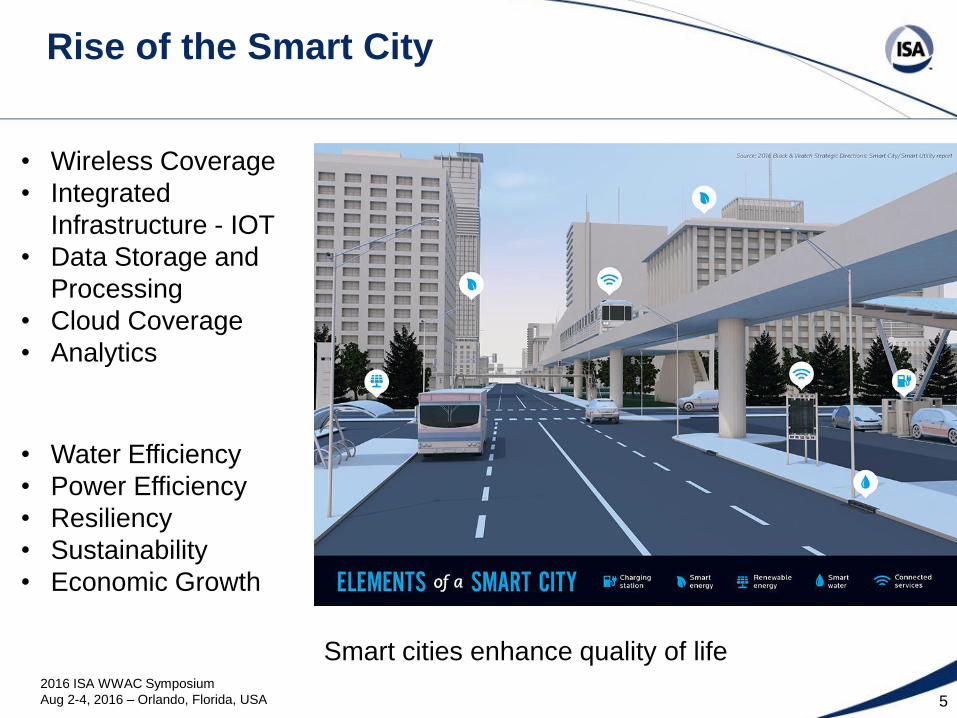
Rise of the Smart City
• Wireless Coverage
• Integrated
Infrastructure - IOT
• Data Storage and
Processing
• Cloud Coverage
• Analytics
• Water Efficiency
• Power Efficiency
• Resiliency
• Sustainability
• Economic Growth
Smart cities enhance quality of life
2016 ISA WWAC Symposium
Aug 2-4, 2016 – Orlando, Florida, USA 6
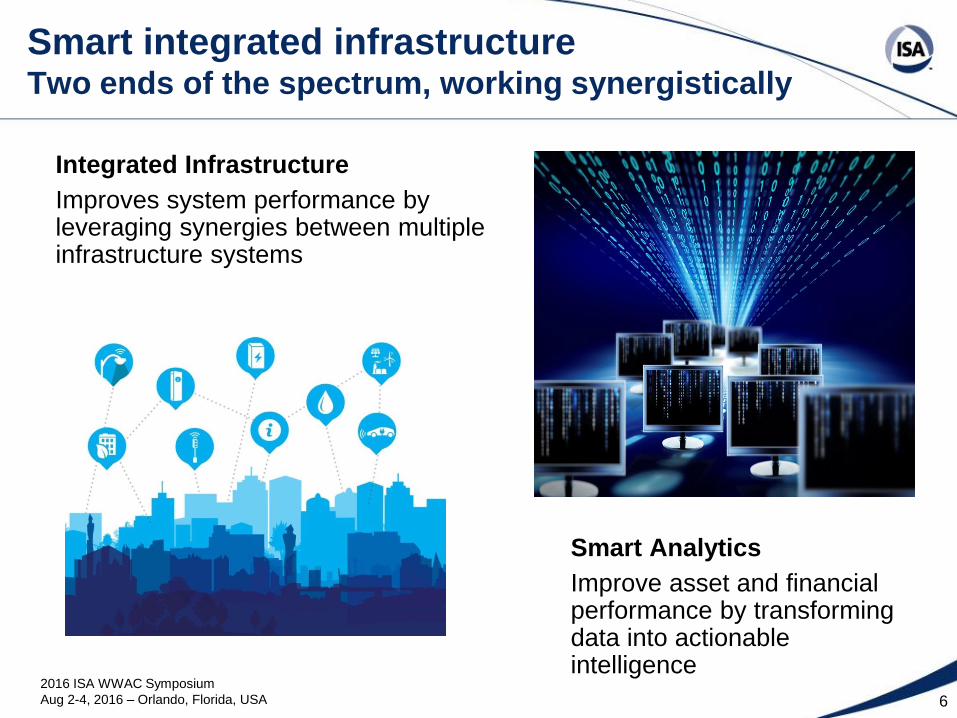
Smart integrated infrastructure Two ends of the spectrum, working synergistically
Integrated Infrastructure
Improves system performance by leveraging synergies between multiple infrastructure systems
Smart Analytics
Improve asset and financial performance by transforming data into actionable intelligence
2016 ISA WWAC Symposium
Aug 2-4, 2016 – Orlando, Florida, USA 7
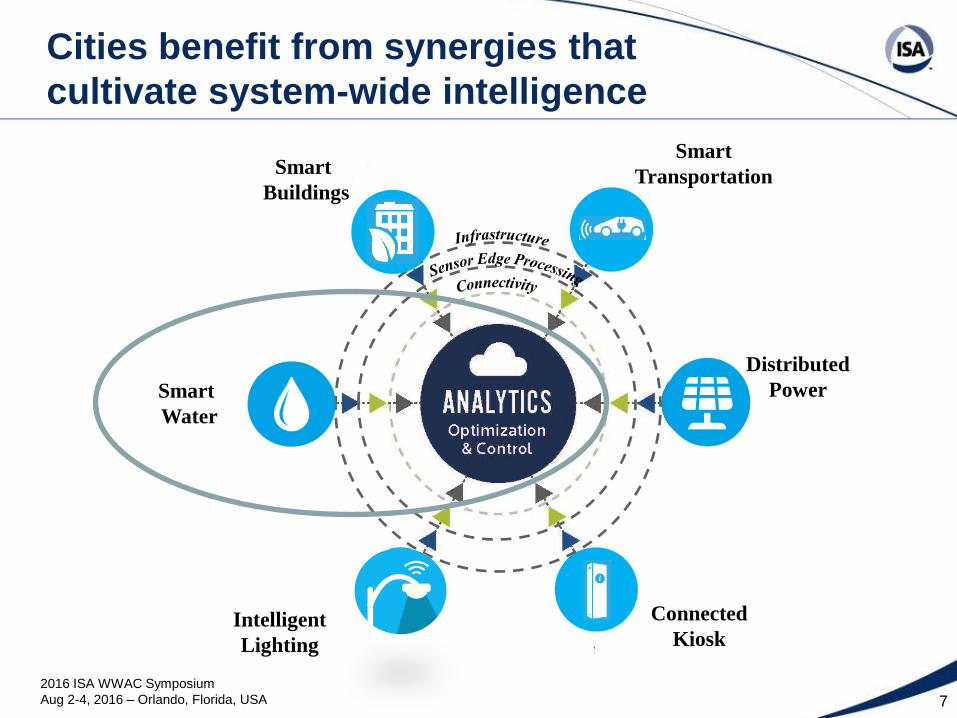
Cities benefit from synergies that
cultivate system-wide intelligence
Smart
Buildings
Intelligent
Lighting
Distributed
Power
Smart
Transportation
Connected
Kiosk
Smart
Water
2016 ISA WWAC Symposium
Aug 2-4, 2016 – Orlando, Florida, USA 8
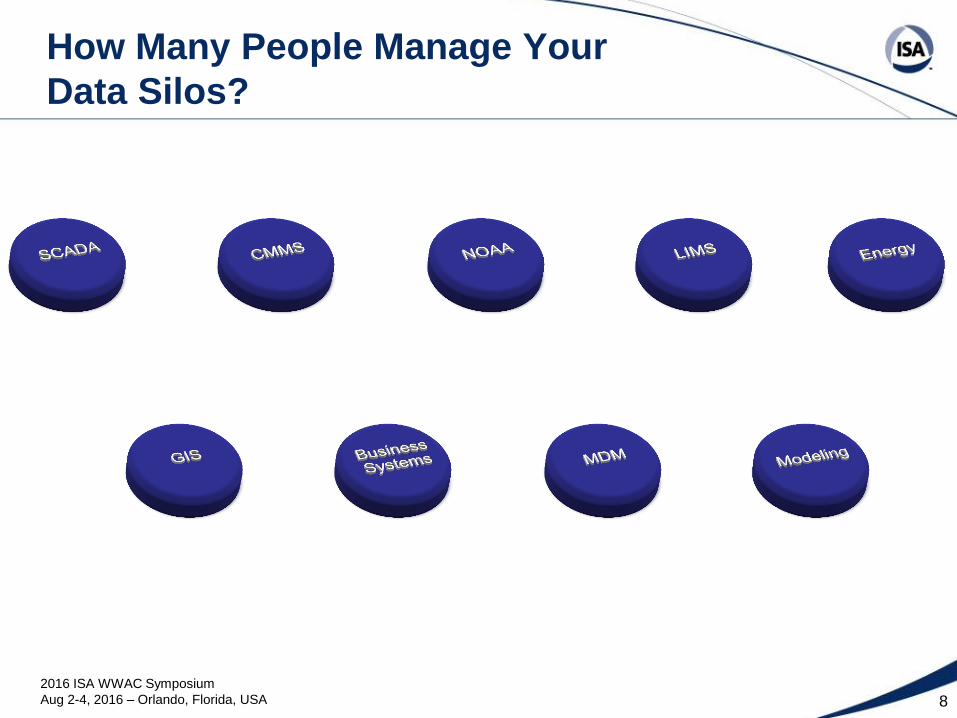
How Many People Manage Your
Data Silos?
2016 ISA WWAC Symposium
Aug 2-4, 2016 – Orlando, Florida, USA 9
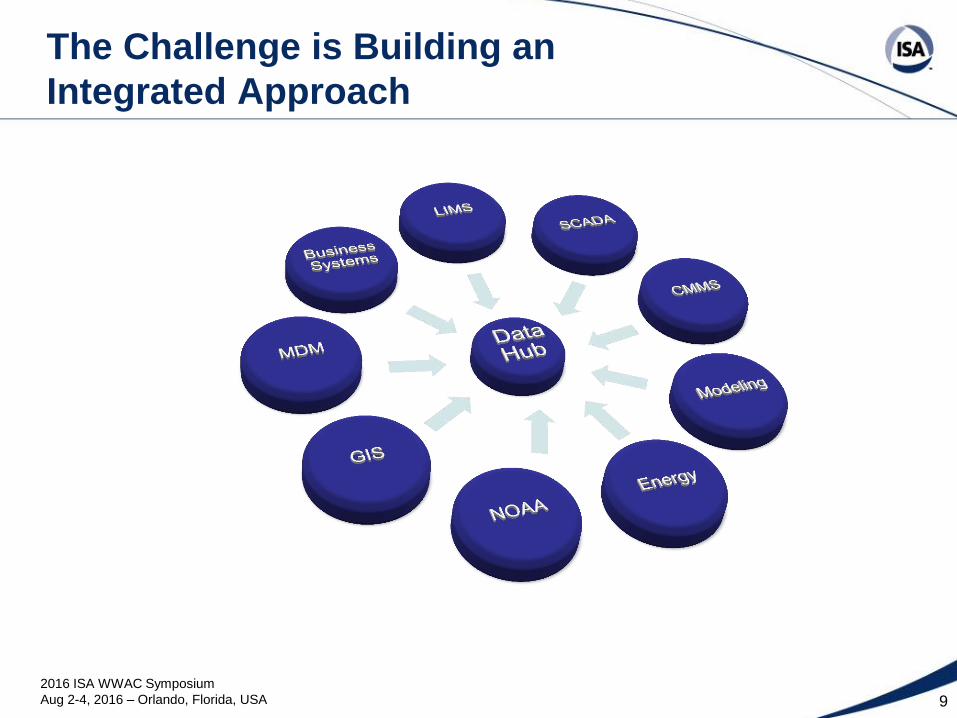
The Challenge is Building an
Integrated Approach
2016 ISA WWAC Symposium
Aug 2-4, 2016 – Orlando, Florida, USA 10
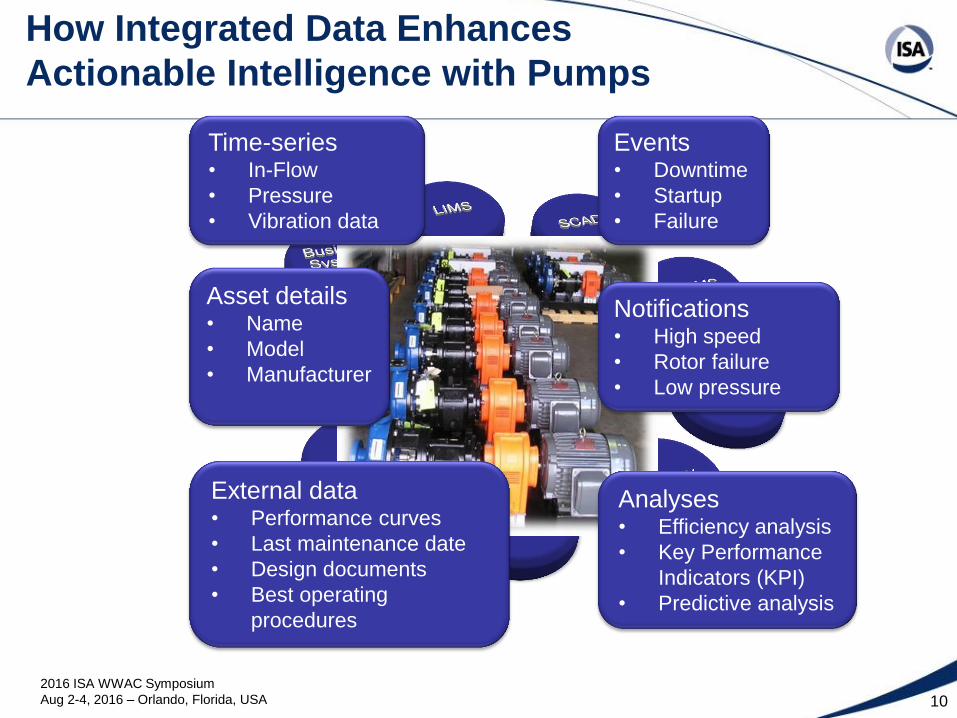
How Integrated Data Enhances
Actionable Intelligence with Pumps
Time-series • In-Flow
• Pressure
• Vibration data
Asset details • Name
• Model
• Manufacturer
External data • Performance curves
• Last maintenance date
• Design documents
• Best operating
procedures
Events • Downtime
• Startup
• Failure
Notifications • High speed
• Rotor failure
• Low pressure
Analyses • Efficiency analysis
• Key Performance
Indicators (KPI)
• Predictive analysis
2016 ISA WWAC Symposium
Aug 2-4, 2016 – Orlando, Florida, USA 11
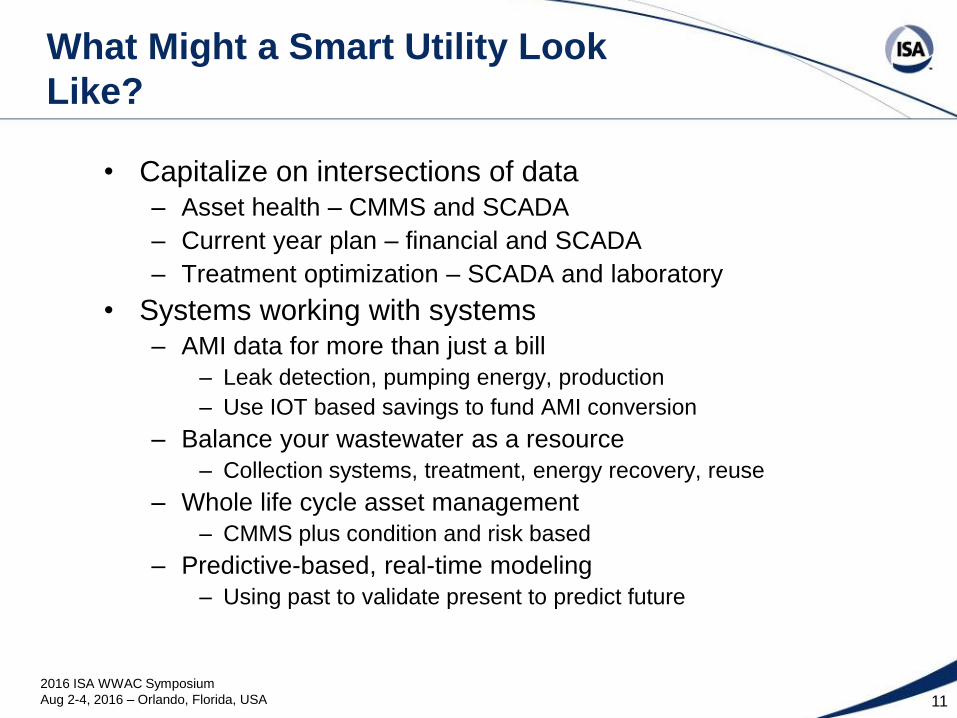
What Might a Smart Utility Look
Like?
• Capitalize on intersections of data
– Asset health – CMMS and SCADA
– Current year plan – financial and SCADA
– Treatment optimization – SCADA and laboratory
• Systems working with systems
– AMI data for more than just a bill
– Leak detection, pumping energy, production
– Use IOT based savings to fund AMI conversion
– Balance your wastewater as a resource
– Collection systems, treatment, energy recovery, reuse
– Whole life cycle asset management
– CMMS plus condition and risk based
– Predictive-based, real-time modeling
– Using past to validate present to predict future
2016 ISA WWAC Symposium
Aug 2-4, 2016 – Orlando, Florida, USA 12
The Energy Use Dilemma –
Energy Use Case Study
• City of Lawrence, Kansas provides water and
wastewater services to its community
• Utility wanted to understand how is energy used
throughout its WWTP and major and sub systems
• Utility wanted to use this information to optimize energy
use throughout its plant by making evidence based
decisions
2016 ISA WWAC Symposium
Aug 2-4, 2016 – Orlando, Florida, USA 13
Goals
• Bring data together in a single point of truth
• Perform analytics
– See real-time efficiency
– Track financial metrics
– Understand true costs to run and start processes
– Ad Hoc visualization tools provide access to data to make
decisions
2016 ISA WWAC Symposium
Aug 2-4, 2016 – Orlando, Florida, USA 14
Challenges – Data Dilemmas
• The City of Lawrence faces several not so unique
challenges that prevented them from fully utilizing data
for decision making processes
• Institutional Assumptions and Biases
• Data in, Data inertial
• Data: Use vs Analysis
2016 ISA WWAC Symposium
Aug 2-4, 2016 – Orlando, Florida, USA 15
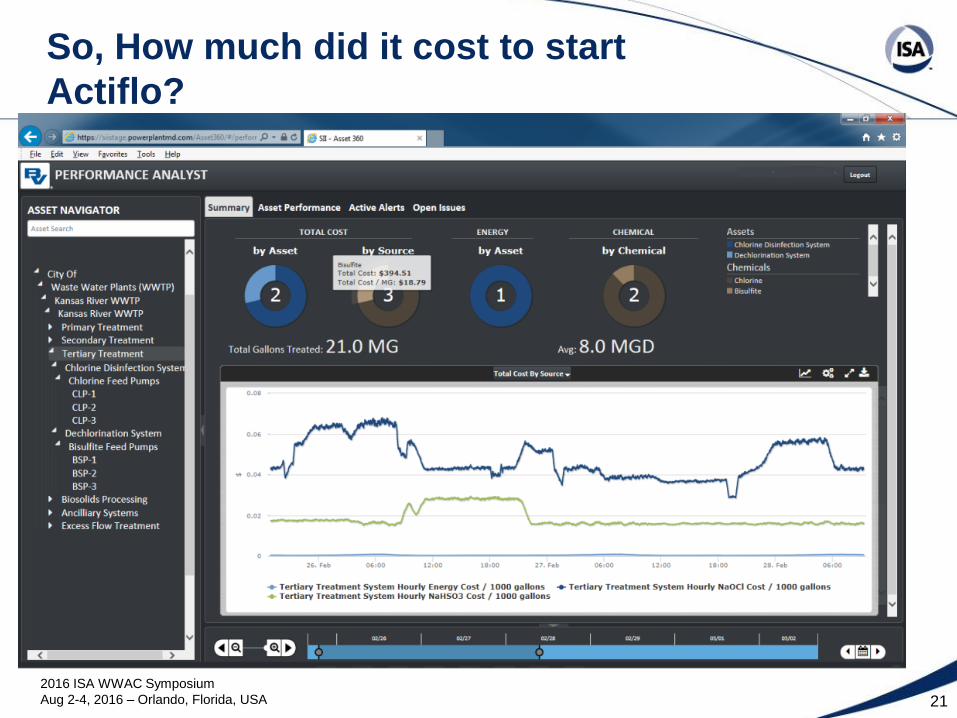
Institutional Assumptions and Biases
• Often utilities seem to “just know” certain things and
Lawrence recognized this as a problem data
management and visualization tools could solve
• How much does it cost to start Actiflow? $10,000?
• When should routine evening/morning Cl2 changes
occur? How large of a change?
• Still use trial and error plus institutional assumptions too
often and struggle to put wealth of data to answer these
questions
2016 ISA WWAC Symposium
Aug 2-4, 2016 – Orlando, Florida, USA 16
Data in, Data Inertial
• The City recognized that they were great at collecting
and storing data but the challenge was getting the data
out
• Death by excel – Volume
• Death by excel – Difficult to update so typically out of
date
• Processes to get the data out was slow and required
technical people to make it happen
• Need a more robust data tool
– For integration of data sources
– Easily visualize large quantities of data
2016 ISA WWAC Symposium
Aug 2-4, 2016 – Orlando, Florida, USA 17
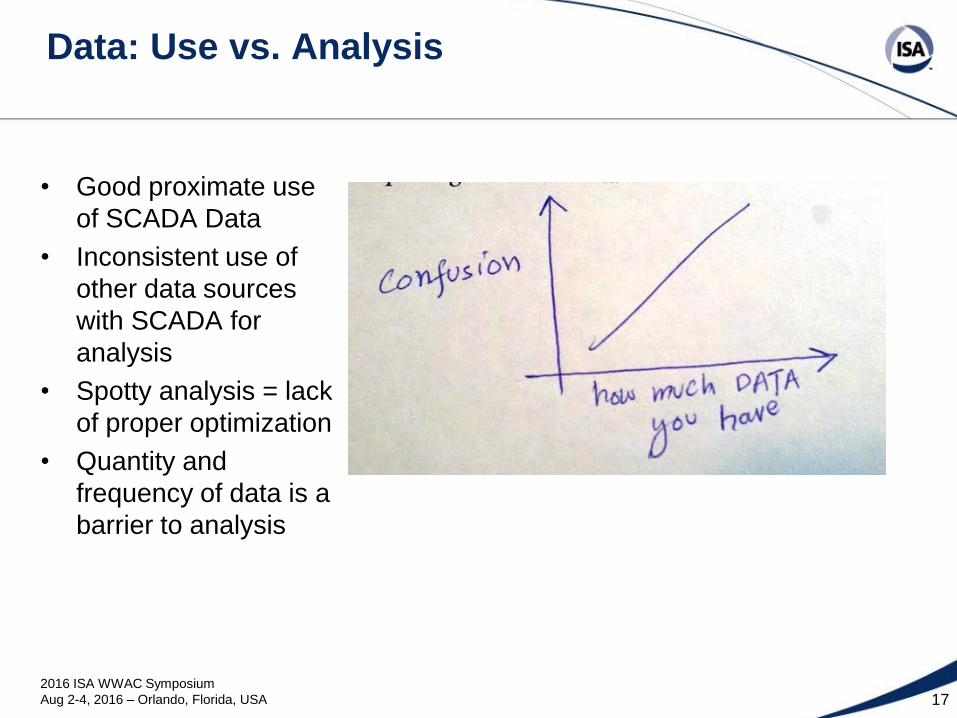
Data: Use vs. Analysis
• Good proximate use
of SCADA Data
• Inconsistent use of
other data sources
with SCADA for
analysis
• Spotty analysis = lack
of proper optimization
• Quantity and
frequency of data is a
barrier to analysis
2016 ISA WWAC Symposium
Aug 2-4, 2016 – Orlando, Florida, USA 18
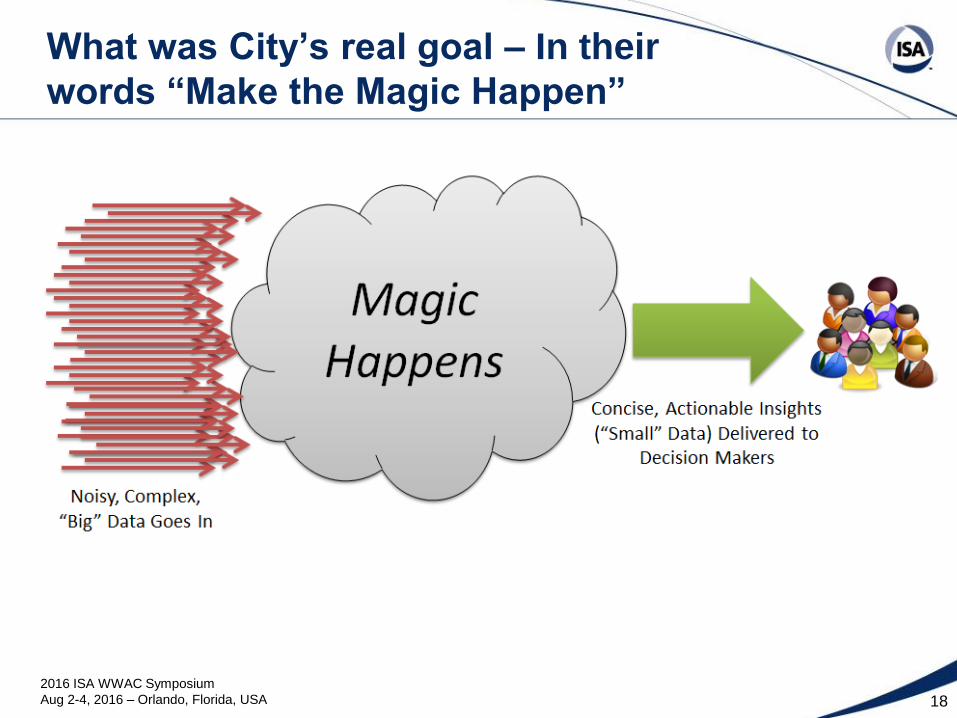
What was City’s real goal – In their
words “Make the Magic Happen”
2016 ISA WWAC Symposium
Aug 2-4, 2016 – Orlando, Florida, USA
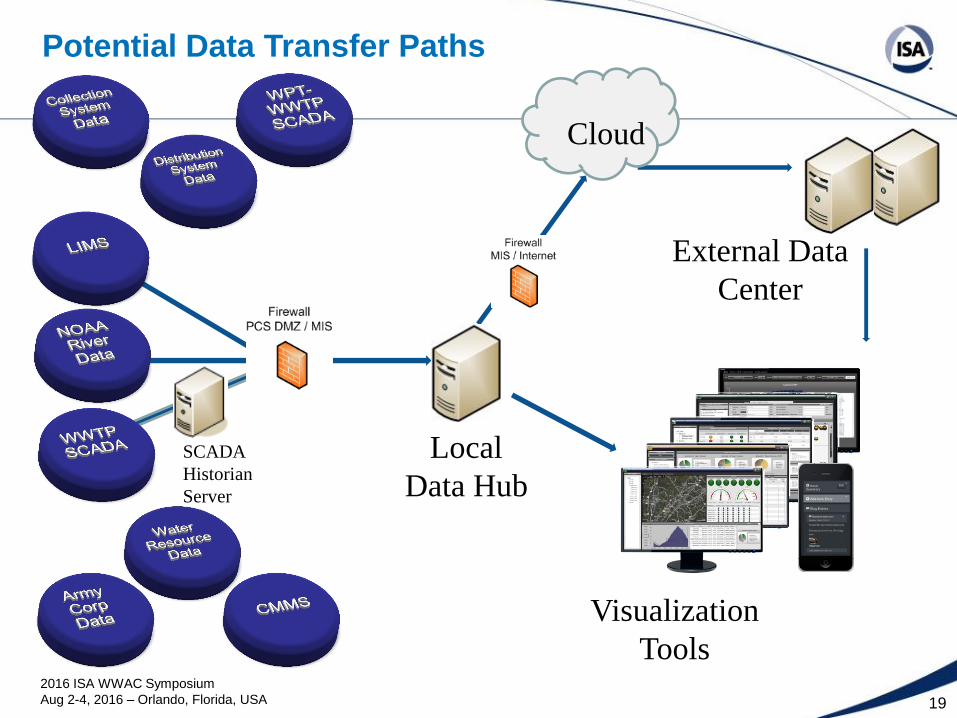
Potential Data Transfer Paths
19
Local
Data Hub
Visualization
Tools
Cloud
SCADA
Historian
Server
External Data
Center
2016 ISA WWAC Symposium
Aug 2-4, 2016 – Orlando, Florida, USA 20
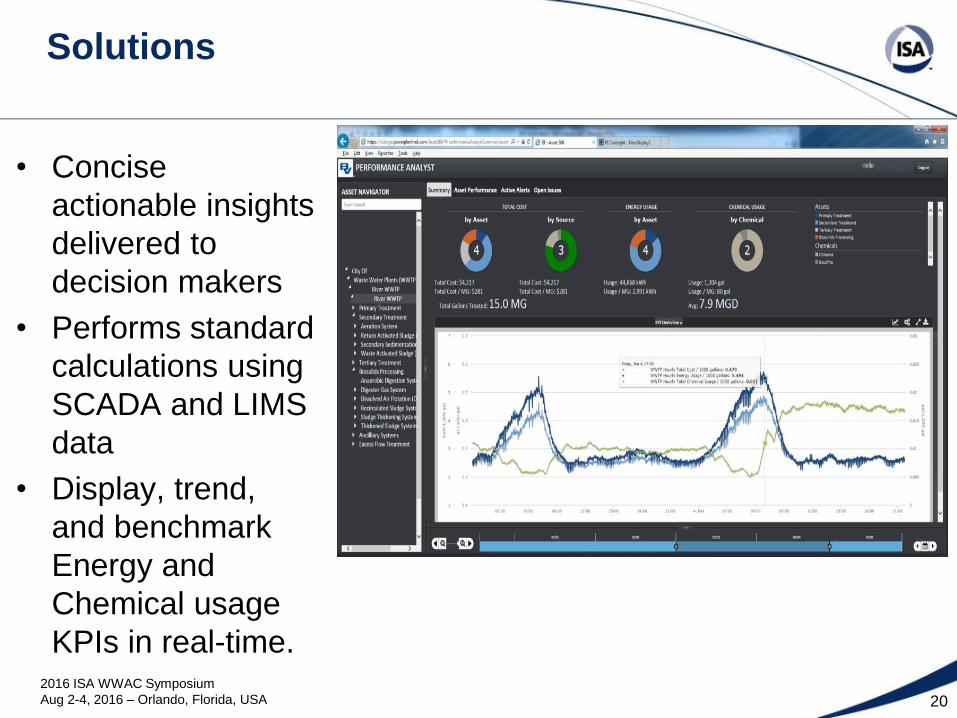
Solutions
• Concise
actionable insights
delivered to
decision makers
• Performs standard
calculations using
SCADA and LIMS
data
• Display, trend,
and benchmark
Energy and
Chemical usage
KPIs in real-time.
2016 ISA WWAC Symposium
Aug 2-4, 2016 – Orlando, Florida, USA 21
So, How much did it cost to start
Actiflo?
2016 ISA WWAC Symposium
Aug 2-4, 2016 – Orlando, Florida, USA 22
Summary
• Ultimately the move to smart cities and big data
management is starting to impact how we manage data
in the water/wastewater space – but in a more practical
way
• The questions we ask:
– How can I view all my data quickly and easily?
– How can I use my data to help me optimize processes?
– How can I know what I don’t know?
• The Path from Big Data to Analytics is a journey that
starts with the question…I wish my data would tell me
________.