Embed Size (px)
Citation preview
ORIGINAL ARTICLE
Using Corn Husk Powder as a Novel Substrate to Produce aSurface Active Compound from Labrenzia aggregate KP-5
Atipan Saimmai1,2 · Suppasil Maneerat3 · Chanika S. Chooklin4
Received: 25 September 2017 / Revised: 6 March 2018 / Accepted: 6 March 2018© 2018 AOCS
Abstract In this study, surface active compound (SAC)-producing bacterial isolates were evaluated for SAC pro-duction using corn husk powder (CHP) as a sole carbonsource. From the 51 isolates screened, Labrenzia aggregateKP-5 produced the highest SAC activity. The highest SACproduction (3.51 g L−1) was obtained when the strain wascultivated in a minimal salt medium containing 40 g L−1
CHP and 1 g L−1 commercial monosodium glutamate at 30�C and 150 rpm after 51 h of cultivation. The producedSAC had the ability to decrease the surface tension of waterfrom 72.0 to 25.5 mN m−1, with the critical micelle con-centration of 9 mg L−1 (11.07 mM) and exhibited the high-est emulsification activity (EA) of 81% against motor oil.The SAC showed stability at 4–121 �C and pH 4–10against the surface and EA of vegetable oils and hydrocar-bons, and showed tolerance at high salt concentrations(1–10% NaCl). The chemical structure of the SAC wasconfirmed as a rhamnolipid using Fourier transform infra-red spectroscopy, nuclear magnetic resonance spectros-copy, and mass spectrometric analysis. The SAC did notexhibit inhibitory effects on various vegetables tested;
however, strong inhibitory activity against Gram-positiveand Gram-negative bacteria was observed. The applicationof SAC for microbial enhanced oil recovery by sand satu-rated with used lubricating oil resulted in above 89% of oilremoval. The properties of the SAC we obtained fromCHP have potential applications especially for microbialenhanced oil recovery and/or reducing the intensity of envi-ronmental contamination. In addition, the obtained SAC isa suitable alternative to antimicrobial agents.
Keywords Surface active compound � Labrenziaaggregate � Corn husks powder � Novel substrate �Biosurfactant
J Surfact Deterg (2018) 21: 523–539.
Introduction
Surface active compounds (SAC) are amphiphilic moleculesproduced from a variety of microorganisms that containhydrophobic and hydrophilic parts. These compounds aredivided into low molecular weight, also termed biosurfac-tants, and high molecular weight or bioemulsifiers (Satpute,Banat, Dhakephalkar, Banpurkar, & Chopade, 2010;Sharma, Oberoi, Sharma, & Oberoi, 2017; Varjani &Upasani, 2017). The former generally consist of glycolipidsand lipopeptides, which decrease the interfacial tensions ofthe liquid into which they are added. The latter includeemulsan, alasan, biodispersan, and extracellular or cellmembrane-bound bioemulsifiers (such as exopolysacchar-ides [EPS] usually more efficient in stabilizing oil-in-wateremulsions; Santos, Rufino, Luna, Santos, & Sarubbo, 2016;Sharma, Oberoi, et al., 2017; Varjani & Upasani, 2017).
* Chanika S. [email protected]
1 Faculty of Agricultural Technology, Phuket Rajabhat University,Muang, Phuket 83000, Thailand
2 Halal Science Center, Phuket Rajabhat University, Muang,Phuket 83000, Thailand
3 Biotechnology for Bioresource Utilization Laboratory,Department of Industrial Biotechnology, Faculty of Agro-Industry, Prince of Songkla University, Hat Yai, Songkhla 90110,Thailand
4 Faculty of Science and Fisheries Technology, RajamangalaUniversity of Technology Srivijaya, Trang Campus, Sikao,Trang, Thailand
Published online: 10 May 2018J Surfact Deterg (2018) 21: 523–539
J Surfact Deterg (2018) 21: 523–539DOI 10.1002/jsde.12047
A variety of microorganisms produce low-molecular-weightSAC (Ron & Rosenberg, 2001); the best investigatedamong them are surfactin from Bacillus sp. and rhamnolipidfrom Pseudomonas sp. (Liu et al., 2017; Santos et al., 2016;Varjani & Upasani, 2017). In the past few decades, SAChave been widely studied due to their practically functionalproperties such as low toxicity, environmentally friendly,wetting, foaming, solubilization, biodegradability, and abil-ity to be produced from renewable, by-product, or low-costsubstrates (Kourmentza, Freitas, Alves, & Reis, 2017;Santos et al., 2016; Satpute et al., 2016). Presently, SAC areapplied in several industries including food, cosmetics,pharmaceutical formulations, agriculture, petroleum indus-try, special chemical substances, cleansers, and bioremedia-tion of pollutants (Liu et al., 2017; Santos et al., 2016;Sharma, Oberoi, et al., 2017; Varjani & Upasani, 2017).It is estimated that about 30–40% of the production cost
of many industrial biologically SAC was caused by the costof the growth substrate (Vijayaraghavan, Lazarus, &Vincent, 2014). Low-cost growth substrates used for theproduction of SAC are expected to greatly reduce the pro-duction costs. Exploration of locally available, inexpensive,substrates was important for production of valuable prod-ucts by selecting novel microorganisms. Thailand is amajor sweet-corn-growing country in the world having 4.8million tons in year 2014 (Office of Agricultural Econom-ics, 2015). Corn husks are the large-volume solid wastesthat result from sweet-corn processing. The high cellulosecontent (382 g kg−1) of corn husks enables them to be usedin making paper and developing cellulose-rich fibers, or assubstrates for antibiotics (Mahalaxmi, Sathish, Rao, & Pra-kasham, 2010), cellulase (Prakash, Jayalaksmi, Prakash,Rubul, & Sreeramulu, 2012), and citric acid production(Mahalaxmi et al., 2010). Corn husks are normally used foranimal feed and fertilization. In this investigation, we reportfor the first time the utilization of corn husks as potentialsubstrates for production of SAC. Because of their advan-tages such as vast availability, renewable nature, and easyrelease of carbon sources, the role of corn husks as the sub-strates for SAC production from isolated Labrenzia aggre-gata KP-5 was investigated in the present study.
Experimental
Materials and Methods
Substrates, Samples, and Isolation of Microorganisms
Corn husks obtained from a local farm in Songkhla Prov-ince, Thailand, were used as substrates. Corn husks werewashed with tap water and cut into small pieces, dried at 60
�C for 24 h, and ground to 24 mesh size. Chemical compo-sition of corn husk powder (CHP) was (g 100 g−1 dryweight): moisture 6.76, cellulose 42.58, hemicellulose38.79, ash 1.50, lignin 9.25, crude protein 0.75, and fat 0.15.SAC-producing bacteria were isolated from soils or
water contaminated with palm oil from a palm oil refineryfactory in southern Thailand. Samples were transported insterile plastics bags and stored at 4 �C when not usedimmediately. For bacterial isolation, 1 g of the sediment or1 mL of water was cultivated in a screening mineral saltmedium (MSM): (g L−1) K2HPO4, 0.8; KH2PO4, 0.2;CaCl2, 0.05; MgCl2, 0.5; FeCl2, 0.01; and NaCl, 5.0(Chooklin, Maneerat, & Saimmai, 2014; Chooklin, Pet-meaun, Maneerat, & Saimmai, 2014) using CHP (2%, w/v)as a carbon source and then plates were incubated at 30 �Cfor 2–3 days. Morphologically distinct colonies on theplates were purified by transferring them onto new MSMplates and subsequently Gram-stained. Pure cultures werestored at −20 �C in the MSM mixed with sterile glycerol ata final concentration of 30%.
Screening of Potential SAC-Producing Strains
One hundred and seventy-five isolates were streaked onMSM agar containing 1% (w/v) of CHP for 24 h at 30 �C.Subsequently, one loop full of each isolate was transferredto test tubes containing 5 mL of nutrient broth (Hi-Media,Mumbai, India) and shaken (150 rpm) at 30 �C overnight.Two hundred microliters of the cell culture were transferredto 5 mL of the MSM medium supplemented with 1% (w/v)of CHP in a rotary shaker (Vision Scientific Co., Daejon,Korea) at 30 �C and 150 rpm for 2 days. The screening ofSAC-producing isolates was performed using the drop-collapse test (DCT) and the emulsification activity (EA) ofthe culture supernatant was measured after centrifugation at9000g at 4 �C for 10 min.
Identification and Characterization of the Isolate KP-5
The procedures outlined in Bergey’s manual of systematicbacteriology were considered as standard to determinephysiological characteristics (Sneath, 1986). The methoddescribed by Weisburg, Barns, Pelletier, and Lane (1991)was used as standard to amplify and sequence the 16SrRNA gene. The BlastN program was used to compare the16S rRNA gene sequences with the public database. TheBasic Local Alignment Search Tool (BLAST) searchingprogram was used to obtain related sequences from theGenbank database (National Center for BiotechnologyInformation [NCBI], National Library of Medicine). Thetwo-parameter and neighbor-joining method using BioEditv7.0.0 (Hall, 1999; Ibis Therapeutics Carlsbad, CA) waschosen as standard to carry out phylogenetic analysis.
524 J Surfact Deterg
J Surfact Deterg (2018) 21: 523–539
Medium Optimization
To study the effects of carbon concentration on the produc-tion of the SAC, Labrenzia aggregata KP-5 was cultivatedon MSM supplemented with 4–20% (w/v) of CHP using0.1% (w/v) of NH4Cl as the N source. In the study of theeffects of nitrogen sources, 4% (w/v) of CHP was used asthe sole carbon source, and NH4Cl in MSM was substitutedwith ammonium chloride, ammonium sulfate, ammoniummolybdate, ammonium citrate, potassium nitrate, sodiumnitrate, or urea, separately, at the same nitrogen concentra-tion (0.1%, w/v). The ratio of carbon and nitrogen was var-ied (5–45) by keeping constant the nitrogen source(concentration, 1 g L−1).
SAC Recovery
Centrifugation was used to remove bacterial cells from theculture broth (10,000g at 4 �C for 15 min) for SAC recov-ery as described by Chooklin et al. (2014). Briefly, weexamined four solvent systems, namely, a mixture of chlo-roform:methanol (2:1), cold acetone, dichloromethane, andethyl acetate, 150 mL of the cell-free culture supernatantwas placed in a 500 mL separating funnel, and 150 mL ofthe solvent was added. The mixture of the cell-free culturesupernatant and the solvent formed two phases, the upperphase was collected in a clean vial and the solvent wasremoved using a vacuum rotary evaporator. The solventsystem showing the highest SAC activity was used torecover SAC from strain KP-5.
Chemical Analysis of the SAC
The protein content of the SAC was estimated using themethod of Lowry, Rosebrough, Farr, and Randall (1951),using bovine serum albumin as standard. The carbohydratewas determined using the phenol–sulfuric acid methoddescribed by Chaplin and Kennedy (1986), with glucose asstandard and the lipid content was estimated for free fattyacid using the method of Folch, Lees, and Stanly (1956)with cholesterol as standard. The chemical nature of theSAC obtained was determined using thin-layer chromatog-raphy as previously described by Saimmai, Onlamool, Sob-hon, and Maneerat (2013).
Fourier Transform Infrared Spectroscopy
The chemical structure of SAC was elucidated using Fou-rier transform infrared spectroscopy (FT-IR) and its type offunctional groups was identified. Translucent pellets wereobtained by grinding 1 mg of purified SAC with 100 mg ofKBr and pressing with 7500 kg for 30 s. A GX-FT-IR sys-tem (Perkin-Elmer, Norwalk, CT, USA) was used to record
the infrared absorption spectra with a spectral resolutionand a wave number accuracy of 4 and 0.01 cm−1, respec-tively. All measurements consisted of 500 scans, and a KBrpellet was used as the background reference.
Nuclear Magnetic Resonance Spectroscopy
The nuclear magnetic resonance (NMR) spectrum wasrecorded on a BrukerAvance-II spectrometer, Switzerland,at 500 MHz. The SAC was subjected to further analysiswith NMR. All 1H and 13C NMR spectra were recorded ona BrukerAvance-II spectrometer at 500 MHz, managedwith an Aspect 3000 computer (Bruker, Mumbai, India) setto the deuterium resonance of the solvent, CDCl3, withoutspinning. Data were recorded at 32 K (the number of datapoints per ppm of the plot) (Saimmai, Onlamool,et al., 2013).
Mass Spectrometric Analysis of SAC
The chemical structure of the purified SAC was determinedby electrospray ionization-mass spectrometric analysis(ESI-MS) in a LCQ™, a mass spectrometer systemdesigned by Finnigan MAT, quadrupole ion trap massspectrometer (Finnigan MAT, San Jose, CA, USA). TheSAC was dissolved in MeOH/water (0.1% formic acid) andinfused in the ESI source with a flow rate of 100 μL min−1.In the ESI, nitrogen and auxiliary gas flows were main-tained at 50 and 5 mL min−1, respectively, and refer toarbitrary values set by the software. ESI-MS spectra in neg-ative mode were acquired from m/z 50–1200 for 2.5 min.Performance conditions were as follows: accumulationtime, 300 ms; temperature 325 �C; capillary voltage,3500 V; nebulizer, 30 psi; and dry gas, dry gas flow rate6 min L−1. The trap drive values were close to 50, indicat-ing an intermediate stability for our compound (Saimmai,Onlamool, et al., 2013).
Polycyclic Aromatic Hydrocarbon Solubilization Test
Procedures for sample equilibration and solubility testswere essentially the same as reported earlier (Saimmai,Onlamool, et al., 2013). Ten milliliter of SAC solutionswere prepared at concentrations of 0.5 × critical micelleconcentration (CMC), CMC, and 2 × CMC and placed into25 mL Corex centrifuge tubes with Teflon cap liners. Tenmilligrams of polycyclic aromatic hydrocarbons (PAH)including anthracene, fluoranthene, fluorine, naphthalene,phenanthrene, or pyrene was separately added to each tube.The sample solutions were then equilibrated on a rotaryshaker at a speed of 250 rpm for 48 h at 25 �C. The sam-ples were subsequently centrifuged for 30 min at a speed of10,000g to separate the undissolved PAH. The supernatant
525J Surfact Deterg
J Surfact Deterg (2018) 21: 523–539
was filtered through 1.2 μm filters (Whatman, SpringfieldMill, UK), and 2.0 mL of this filtrate was extracted with anequal volume of hexane. The aqueous and hexane phaseswere separated when the emulsion was centrifuged at9693g for 10 min. The concentration of PAH was mea-sured spectrophotometrically (Libra S22; Biochrom, Cam-bridge, UK) at the specific wavelength of each compound(Saimmai, Onlamool, et al., 2013). The calibration curve ofindividual PAH (in hexane) was used to determine the con-centration of each PAH. Assay buffer with SAC but with-out PAH was used as a blank after being extractedidentically with hexane.
Evaluation of the SAC in Oil Removal
The studies of submerged washing of oil removal using theSAC solution were performed according to Chooklin, Man-eerat, et al. (2014). Briefly, used motor lubricating oil wasadded (20%, w/v) to the sand (50/80-mesh) and left at roomtemperature (30 � 3 �C) for 7 days. Then, 20 g of the sandsamples was added to 60 mL SAC solutions and put in arotary shaker at 250 rpm over night at 30 �C and centri-fuged at 9693g for 20 min for separation of the cleaningsolution and the sand. The remaining oil was determinedgravimetrically as the amount of material extracted fromthe sand by hexane.
Antimicrobial Activity of the SAC
SAC solution at concentrations of 0.5 × CMC, CMC, and2 × CMC (50 μL) was tested for antimicrobial activityusing the ager well diffusion method (Candan et al., 2003).The tested microorganisms were obtained from Songklana-karin Hospital, Prince of Songkla University, Thailand, andthe cultures were collected from the Faculty of AgricultureTechnology, Phuket Rajabhat University, including Bacil-lus cereus, Botrytis cinerea, Candida albicans, Colletotri-chum truncatum, Enterococcus faecium, Escherichia coli,Fusarium moniliforme, Gibberella zeae, Listeria monocyto-genes, Penicillium candidum, Pseudomonas aeruginosa,Salmonella sp., Salmonella typhimurium, Staphylococcusaureus, Vibrio cholerae, and Vibrio vulnificus. The mediaused were Mueller-Hint on agar (Difco, Detroit, MI, USA)for bacteria and potato dextrose agar (Difco, Detroit, MI,USA) for fungi. The plates (triplicates) were incubated at37 �C for 24 h in the case of bacteria and at 28 �C for 72 hin the case of fungi. The antimicrobial activities of the SACwere then determined by measuring the respective zones ofinhibition in millimeter. The positive controls for antimi-crobial activity were standard antibiotics including penicil-lin (Hi-Media, Mumbai, India), streptomycin (Hi-Media,Mumbai, India), and rhamnolipids (Sigma-Aldrich, StLouis, MO, USA).
Phytotoxicity Assessment of the SAC
The phytotoxicity of the SAC was evaluated in a static testbased on the root growth and seed germination using theTiquia, Tam, and Hodgkiss (1996) method with slight mod-ifications. Six vegetable seeds namely Brassica oleraceaL., Lactuca sativa L., Raphanus sativus, Solanum gilo, Tri-ticum aestivum, and Vigna radiate were selected for ourstudies. Solutions of the isolated SAC were prepared withdistilled water at concentrations of 0.5 × CMC, CMC, and2 × CMC. Sterilized Petri dishes (1 cm × 10 cm) in whichthe toxicity was determined contained a WhatmanNo. 1 filter paper. Each Petri dish containing the pretreatedseeds with sodium hypochlorite and 10 inoculated seedswas added and inoculated with 5 mL of the tested solutionat 27 �C. Distilled water was used as the control. After5 days of incubation in the dark, relative seed germination,relative root elongation, and the germination index(GI) were determined as follows:
Relative seed germination %ð Þ
=Number of seeds germinated in the extractNumber of seeds germinated in the control
� �× 100
Relative root length %ð Þ
=Mean root length in the extractMean root length in the control
� �× 100
GI %ð Þ
=Relative seed germinationð Þ× Relative root elongationð Þ
100
Analytical Methods
Biomass determination was carried out in terms of dry cellweight. Samples were mixed and centrifuged at 9693g for30 min in preweighed tubes with chilled distilled water atdifferent times of fermentation. Biomass obtained wasdried overnight at 105 �C and weighed.
Drop-Collapse Test
The DCT was performed as described by Youssef etal. (2004). Briefly, each well of a 96-well microtiter platelid was added with 2 μL of the used lubricating oil (ULO)(Biolog, Inc., Hayward, CA, USA) and these were left toequilibrate for 1 h at room temperature (30 � 3 �C). Fivemicroliters of the culture supernatant was added to the sur-face of oil. The shape of the drop on the oil surface wasinspected after 1 min with the aid of a magnifying glass.Bioemulsifier-producing cultures giving flat drops werescored as positive “+.” Those cultures that gave rounded
526 J Surfact Deterg
J Surfact Deterg (2018) 21: 523–539
drops were scored as negative “−,” indicating no SAC pro-duction (Youssef et al., 2004).
EA Assay
The EA was measured as described by Plaza, Zjawiony, andBanat (2006). Briefly, equal volume of the cell-free superna-tant (4 mL) was mixed with hydrocarbon or oil in a screwcap tube and vortexed at a high speed for 2 min. The emul-sion stability was determined after 24 h. E24 was calculatedby dividing the measured height of the emulsion layer bythe total height of mixtures and multiplying by 100.
Surface Tension Measurement
Surface tension measurement was carried out as describedby Saimmai, Udomsilp, and Maneerat (2013) using aModel 20 Tensiometer (Fisher Science Instrument Co.,Pittsburgh, PA, USA) at 25 �C. CMC was determined byplotting the surface tension versus concentration of SAC inthe solution.
Statistical Analysis
All experiments were carried out at least in triplicates. Sta-tistical analysis was performed using the Statistical Packagefor Social Science (SPSS 10.0, for Windows Inc., Chicago,IL, USA).
Results and Discussion
Screening of SAC-Producing Bacterial Isolates
SAC-producing bacterial strains from a palm oil refineryfactory sample were isolated by a selective culture mediumwith CHP as a sole carbon source. The DCT and EA wereused for the rapid detection of SAC-producing bacteria.From 22 soil and 14 water samples, 51 bacterial isolateswere positive for the DCT and EA (7 Gram-positive bacilli,9 Gram-positive cocci, 16 Gram-negative bacilli, and19 Gram-negative cocci) (Table 1). Table 1 shows theGram staining results, growth, EA, and surface activity ofthe selected bacterial isolates. The majority of the selectedbacterial isolates were Gram-negative (35 from 51 isolates).This result was in accordance with the previously reportedresult that most bacteria isolated from sample sources werecontaminated by oil or hydrocarbon are Gram-negative(Saimmai, Rukadee, Onlamool, Sobhon, & Maneerat,2012; Saimmai, Tani, Sobhon, & Maneerat, 2012; Saisa-ard, Saimmai, & Maneerat, 2014). The explanation of thesephenomena comes from the presence of outer membranes
in Gram-negative bacteria composed of lipopolysaccha-rides, phospholipids, and lipoproteins, which act as SAC(Jan, 2017; Saisa-ard et al., 2014). In the present study, thehighest SAC activity was identified for a Gram-negativebacterium (KP-5) isolated from a soil contaminated by apalm oil refinery in Krabi Province, with DCT and EAresults of 3.5 mm 40.41%, respectively. Interestingly, thisstrain did not show the highest activity of EA, but it couldproduce SAC, which exhibited the highest surface tensionactivity by DCT. The nonproportionality between emulsifi-cation and surface tension activity of SAC maybe comesfrom the type of carbon source used for growth of SAC-producing bacteria. When a water-soluble carbon sourcewas used, the system does not require SAC to make emul-sion for an insoluble substrate (Saisa-ard et al., 2014).
Identification of Selected Bacterial Strain
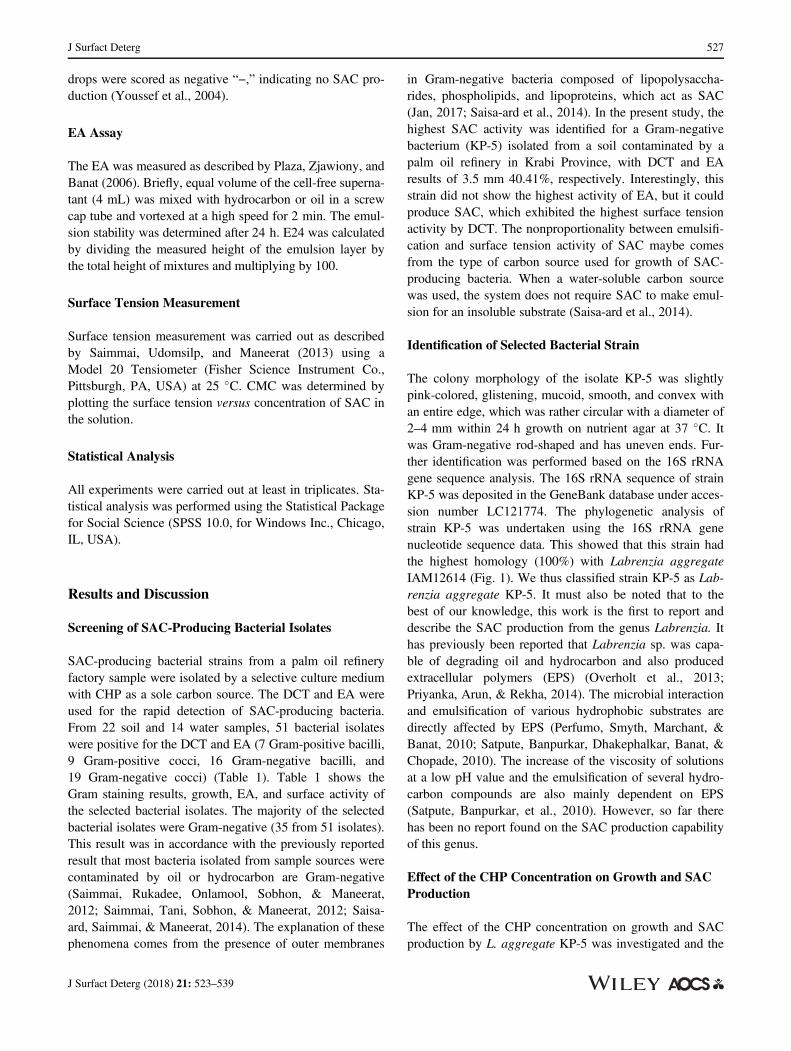
The colony morphology of the isolate KP-5 was slightlypink-colored, glistening, mucoid, smooth, and convex withan entire edge, which was rather circular with a diameter of2–4 mm within 24 h growth on nutrient agar at 37 �C. Itwas Gram-negative rod-shaped and has uneven ends. Fur-ther identification was performed based on the 16S rRNAgene sequence analysis. The 16S rRNA sequence of strainKP-5 was deposited in the GeneBank database under acces-sion number LC121774. The phylogenetic analysis ofstrain KP-5 was undertaken using the 16S rRNA genenucleotide sequence data. This showed that this strain hadthe highest homology (100%) with Labrenzia aggregateIAM12614 (Fig. 1). We thus classified strain KP-5 as Lab-renzia aggregate KP-5. It must also be noted that to thebest of our knowledge, this work is the first to report anddescribe the SAC production from the genus Labrenzia. Ithas previously been reported that Labrenzia sp. was capa-ble of degrading oil and hydrocarbon and also producedextracellular polymers (EPS) (Overholt et al., 2013;Priyanka, Arun, & Rekha, 2014). The microbial interactionand emulsification of various hydrophobic substrates aredirectly affected by EPS (Perfumo, Smyth, Marchant, &Banat, 2010; Satpute, Banpurkar, Dhakephalkar, Banat, &Chopade, 2010). The increase of the viscosity of solutionsat a low pH value and the emulsification of several hydro-carbon compounds are also mainly dependent on EPS(Satpute, Banpurkar, et al., 2010). However, so far therehas been no report found on the SAC production capabilityof this genus.
Effect of the CHP Concentration on Growth and SACProduction
The effect of the CHP concentration on growth and SACproduction by L. aggregate KP-5 was investigated and the
527J Surfact Deterg
J Surfact Deterg (2018) 21: 523–539
results are shown in Table 2. As shown in Table 2, thehighest activities toward SAC production were foundwhen 8% (w/v) CHP was used in the cultivation ofL. aggregate KP-5. Although the CHP concentration of6% could not give the highest value of dry cell weight,the excreted SAC showed good surface activities in termsof surface tension and EA. Inconsistencies of cell growthand SAC activity observed in this study had beenreported elsewhere (Pornsunthorntawee et al., 2008).Therefore, the culture medium supplemented with 8%CHP was chosen as the appropriate culture medium forthe next experiments of SAC production by L. aggregateKP-5.
Effect of Nitrogen Sources on Growth and SACProduction
To determine the optimal conditions that yield the highestSAC production by L. aggregate KP-5, the effect of vari-ous nitrogen sources was evaluated (Table 2). L. aggre-gate KP-5 was able to grow and show SAC activity inall nitrogen sources tested with different activities andyields depending on the nitrogen source used. The high-est biomass production of L. aggregate KP-5 wasobtained using peptone as the sole nitrogen source(3.14 g L−1). However, the lowest surface tension values(34.5), which corresponded to the highest EA (55.54%)and SAC yield (1.05 g L−1), were obtained with commer-cial monosodium glutamate. This result was in accor-dance with Chooklin, Maneerat, et al. (2014), whoreported that the highest biomass of Halobacteriaceaearchaeon AS65 was obtained with peptone. However, thehighest SAC production was obtained when using com-mercial monosodium glutamate as a nitrogen source.Other authors also reported the highest SAC productionusing commercial monosodium glutamate as a nitrogensource (Chooklin, Petmeaun, et al., 2014; Noparat, Man-eerat, & Saimmai, 2014; Saimmai, Onlamool, et al.,2013; Saimmai, Udomsilp, et al., 2013).
Table 1 Source, Gram’s staining, growth, and biosurfactant activityof the bacterial isolates
Sources Isolate Gramstain
Dry cellweight(g L−1)a
DCT(cm)a
EA (%)a
KrabiProvince
KP-1 Negative 1.3 � 0.5 2.5 � 0.2b 35.15 � 4.20
KP-2 Negative 1.8 � 0.3 2.1 � 0.5 32.25 � 3.54
KP-3 Positive 2.2 � 0.2 2.2 � 0.7 36.54 � 2.78
KP-4 Negative 1.5 � 0.2 2.0 � 0.5 35.21 � 3.25
KP-5 Negative 1.6 � 0.3 3.5 � 0.5 40.41 � 5.20
KP-6 Positive 2.1 � 0.3 2.6 � 0.4 25.20 � 4.02
KP-7 Negative 1.8 � 0.8 2.3 � 0.3 14.32 � 2.45
KP-8 Positive 2.0 � 1.0 1.5 � 0.2 30.13 � 5.25
KP-9 Negative 1.5 � 0.2 1.8 � 0.5 25.18 � 5.58
KP-10 Negative 1.8 � 0.7 2.0 � 1.0 22.50 � 4.71
SatunProvince
SP-1 Negative 1.7 � 0.3 2.2 � 0.6 27.19 � 5.51
SP-2 Negative 1.8 � 0.3 2.5 � 1.1 33.21 � 5.85
SP-3 Positive 2.0 � 0.4 2.8 � 0.5 18.25 � 6.40
SP-4 Negative 2.4 � 0.8 2.0 � 0.2 15.78 � 2.75
SP-5 Negative 2.5 � 0.5 1.5 � 0.6 28.70 � 5.56
SP-6 Positive 1.9 � 0.2 1.3 � 0.2 16.80 � 3.57
SP-7 Negative 2.0 � 0.6 1.8 � 0.0 28.78 � 4.54
SP-8 Negative 2.6 � 0.2 2.7 � 0.8 25.42 � 3.05
SP-9 Negative 2.1 � 0.7 2.5 � 0.3 29.50 � 6.65
SP-10 Positive 2.0 � 0.2 1.7 � 0.4 42.82 � 2.50
SP-11 Negative 1.8 � 0.7 2.2 � 0.6 25.50 � 5.89
SP-12 Positive 2.5 � 0.5 1.5 � 0.4 16.24 � 4.18
SP-13 Negative 2.0 � 0.7 2.0 � 0.1 18.55 � 4.48
SP-14 Negative 1.8 � 0.4 2.7 � 0.2 37.81 � 3.05
SP-15 Positive 2.7 � 0.3 2.6 � 0.4 36.79 � 4.61
SP-16 Negative 2.5 � 0.2 3.0 � 0.2 35.08 � 3.74
SP-17 Negative 1.5 � 0.1 3.2 � 0.2 35.12 � 4.09
SP-18 Positive 1.6 � 0.2 2.5 � 0.3 25.88 � 3.54
Surat ThaniProvince
ST-1 Negative 1.7 � 0.5 2.7 � 0.4 41.70 � 5.27
ST-2 Negative 2.0 � 0.1 1.7 � 0.6 36.20 � 6.05
ST-3 Positive 1.5 � 0.5 2.8 � 0.5 18.15 � 4.78
ST-4 Negative 1.9 � 0.3 1.7 � 0.9 37.21 � 2.62
ST-5 Positive 1.7 � 0.6 2.2 � 0.7 29.62 � 3.81
ST-6 Negative 2.2 � 0.3 2.0 � 0.4 25.15 � 4.25
ST-7 Positive 2.0 � 0.2 2.4 � 0.3 33.58 � 4.98
ST-8 Negative 1.7 � 0.5 2.2 � 0.1 35.70 � 3.91
ST-9 Negative 2.2 � 0.4 3.0 � 0.5 38.08 � 4.05
ST-10 Negative 2.5 � 0.7 2.8 � 0.4 32.81 � 5.51
TrangProvince
TP-1 Positive 1.5 � 0.1 2.8 � 0.3 30.81 � 5.18
TP-2 Negative 2.0 � 0.2 2.1 � 0.3 31.47 � 3.24
TP-3 Negative 1.5 � 0.4 2.8 � 0.5 38.18 � 6.81
TP-4 Positive 1.7 � 0.2 2.7 � 0.9 30.28 � 5.15
TP-5 Negative 2.1 � 0.2 3.0 � 0.4 29.20 � 7.50
TP-6 Negative 1.6 � 0.3 3.0 � 0.4 25.25 � 4.40
TP-7 Negative 2.0 � 0.5 2.7 � 0.7 39.17 � 3.18
TP-8 Negative 2.6 � 0.2 2.2 � 0.1 35.71 � 5.24
(Continues)
Table 1 Continued
Sources Isolate Gramstain
Dry cellweight(g L−1)a
DCT(cm)a
EA (%)a
TP-9 Positive 2.2 � 0.1 2.7 � 0.5 28.04 � 5.10
TP-10 Negative 1.2 � 0.3 2.9 � 0.3 32.18 � 6.41
TP-11 Positive 1.4 � 0.2 2.0 � 0.3 34.80 � 3.48
TP-12 Negative 1.6 � 0.3 3.1 � 0.6 31.18 � 4.05
TP-13 Negative 2.1 � 0.5 2.3 � 0.4 24.84 � 3.47
a All values are mean � SD from triplicate determinations.b Diameter of negative control for the DCT was 1.0 cm.
528 J Surfact Deterg
J Surfact Deterg (2018) 21: 523–539
Effect of the Carbon:Nitrogen (C:N) Ratio on Growthand SAC Production
The results showed that the C:N ratio was fundamental toimprove SAC productivity by L. aggregate KP-5 (Table 2).Among nine different C:N ratios examined, with CHP andcommercial monosodium glutamate as carbon and nitrogensources, respectively, the maximum SAC activity in surfacetension and EA of 25 mN m−1 and 65%, respectively, wasachieved using the 30:1 ratio of C:N (Table 2). However,the highest SAC yield (3.50 g L−1) was obtained when theC:N ratio of 40:1 was used. Increasing the C:N ratio tomore than 40:1 does not significantly increase either bacte-rial cell growth or SAC yield. SAC is often produced undergrowth-limiting conditions of nitrogen (Franzetti et al.,2009; Santos et al., 2016). Nitrogen limitation caused anincrease in lipopeptides from H. archaeon AS65(Chooklin, Maneerat, et al., 2014), glycolipid productionfrom Ochrobactrum anthropi 2/3 (Noparat et al., 2014) andCandida sp. SY16 (Kim et al., 2006), and rhamnolipidsfrom P. aeruginosa LBI (Benincasa & Accorsini, 2008).
Kinetics of SAC Production
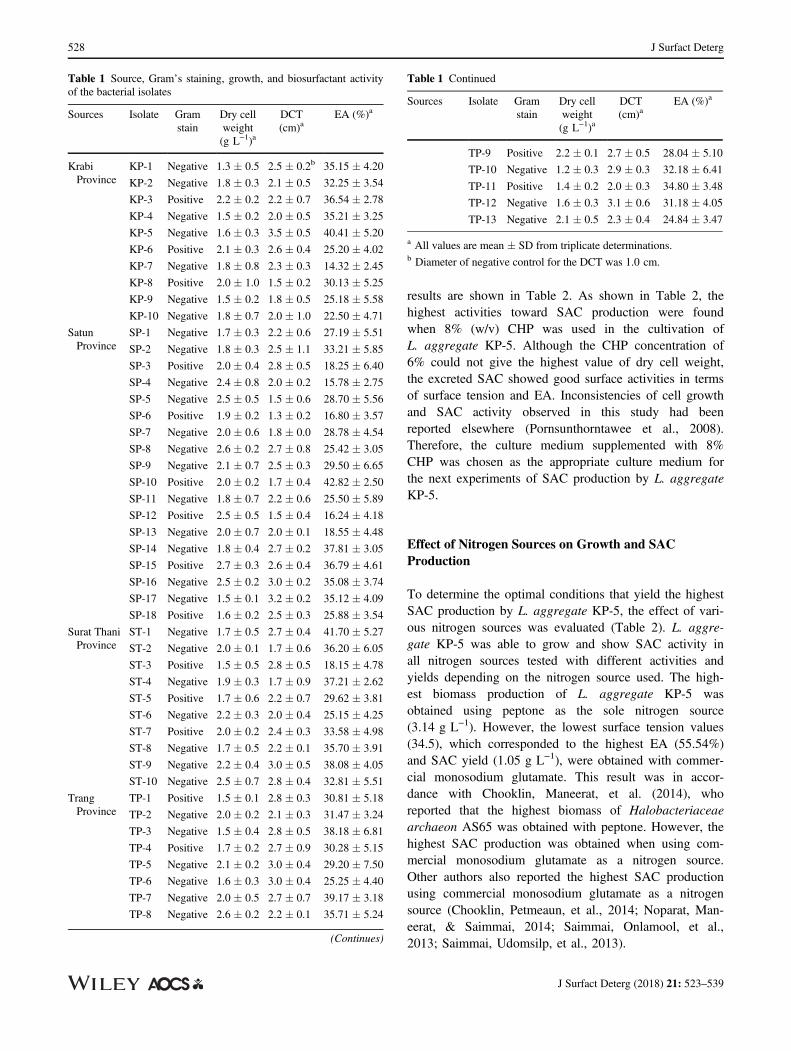
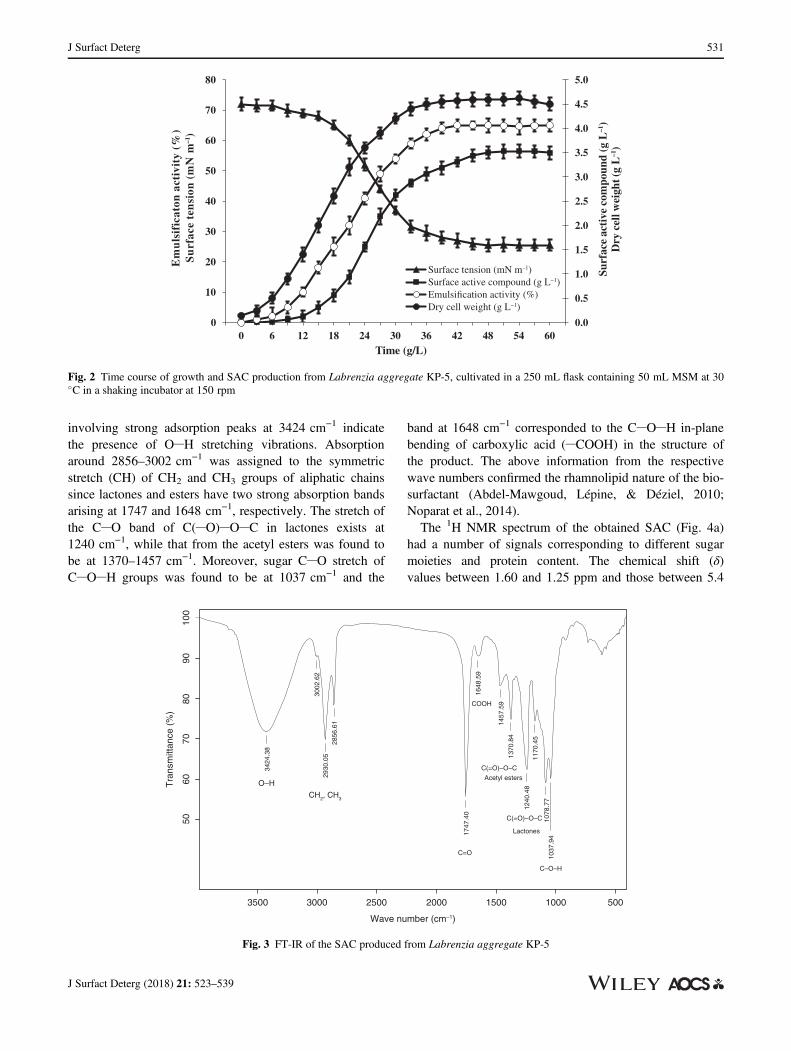
A time course study of SAC production by L. aggregateKP-5 was carried out using a production medium with40 g L−1 CHP and 1 g L−1 commercial monosodium gluta-mate as a carbon and nitrogen source, respectively, at 30 �C,150 rpm. SAC yields, surface tension, EA, and pH of theculture broth were dependent on the growth of the culture inthe fermentation medium (Fig. 2). The kinetic growth curveof L. aggregate KP-5 and the SAC production curve with
upward trends indicated a parallel relationship between bac-terial growth and SAC production. As shown in Fig. 2, thehighest dry cell weight of 4.62 g L−1 was observed after thecultivation time of 54 h, which is the exponential phase,before gradually entering the dead phase. The highest valuesof surface activity and EA were obtained after about 48 h ofcultivation with 25.5 mN m−1 and 65%, respectively. How-ever, the highest SAC yield (3.51 g L−1) was obtained asthe cultivation time approached 51 h, which also corre-sponded to the stationary phase of microbial growth. Theresults from the present study reveal that SAC productionfrom L. aggregate KP-5 was growth associated. In the caseof a growth-associated SAC production, there is a parallelrelationship between the substrate consumption, growth, andSAC production (Rodrigues, Teixeira, Oliveira, & Mei,2006; Uzoigwe, Burgess, Ennis, & Rahman, 2015).Growth-associated SAC production has been described forthe production of lipopeptides from H. archaeon AS65(Chooklin, Maneerat, et al., 2014), glycolipid fromO. anthropi 2/3 (Noparat et al., 2014), and rhamnolipid fromP. aeruginosa RS29 (Saikia, Deka, Deka, & Banat, 2012).
Recovery of the SAC
The ability of various solvent systems to harvest the SACfrom the 51 h culture supernatant of L. aggregate KP-5was investigated. Among the five solvent systems tested,the highest SAC yield, CMC, surface tension, and EA wereobtained when using ethyl acetate as a solvent system (datanot shown). The SAC obtained from ethyl acetate extrac-tion can dissolve completely in distilled water. Recently,ethyl acetate has been successfully used as a solvent for
Labrenzia alexandrii M3B124 (LN812989)
Labrenzia alexandrii DFL-11 (NR_042201)
Labrenzia marina mano18 (NR_043040)
Labrenzia alba 5OM6 (NR_042378)
Labrenzia alba M2B125 (LN812985)
Labrenzia aggregata 5-Sj-4-7-2-M (KJ009548)
Labrenzia aggregata 2-Sj-4-1-4-M (KJ009501)
Labrenzia aggregate (JQ738393)
Labrenzia aggregata NBRC 16684 (AB681109)
KP-5
Labrenzia suaedae YC6927 (GU322907)
Labrenzia aggregata IAM12614 (NR_115659)
0.002
Fig. 1 Phylogenetic tree of isolate KP-5 and closest NCBI (BLASTn) strains based on 16S rRNA gene sequences (neighbor joining tree method).Scale bar 0.01 nucleotide substitutions per nucleotide position. Numbers at node. Bootstrap values obtained with 1000 resampling analyses. TheGenBank accession numbers are reported in parentheses
529J Surfact Deterg
J Surfact Deterg (2018) 21: 523–539
extraction of biosurfactants from H. archaeon AS65(Chooklin, Maneerat, et al., 2014), Inquilinus limosus KB3(Saimmai, Onlamool, et al., 2013), and O. anthropi 2/3(Noparat et al., 2014). In general, the extraction has a draw-back of using highly toxic chloro-organic compounds orthe loss of biosurfactant activity and its expensive naturemakes it practically less attractive (Chen, Chen, & Juang,2008; Santos et al., 2016; Varjani & Upasani, 2017).Accordingly, it is desired to use ethyl acetate, a more eco-nomic and environmentally friendly, to improve the recov-ery yield and purity of the SAC.
Chemical Characterization of the SAC
Compositional analysis of the obtained SAC revealed thatthe SAC produced from L. aggregate KP-5 was a
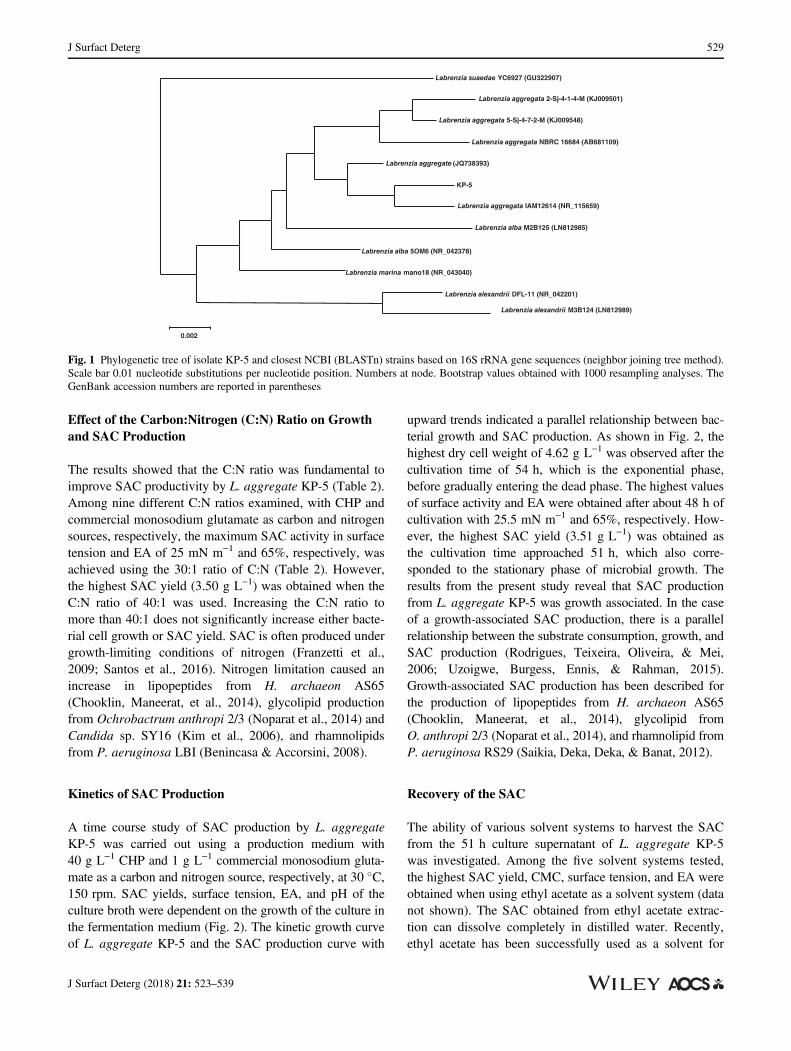
glycolipid, consisting of 68% lipids and 30% carbohy-drates. A minor fraction of protein (1–2%) was found fromthe obtained SAC possibly arising from the existence of theresidual cell debris in broth coprecipitated with SAC duringits extraction process (Lotfabad et al., 2009). The agar dou-ble diffusion test revealed the appearance of precipitationlines between the SAC produced from L. aggregate KP-5and the cationic compound used (barium chloride). How-ever, no lines were formed between the SAC and theanionic compound (sodium dodecyl sulfate [SDS]). Underthe experimental conditions of the present study, this sim-ple test demonstrated the anionic character of the SACproduced.The molecular composition of the SAC produced from
L. aggregate KP-5 was evaluated using FT-IR and theresult is shown in Fig. 3. The important adsorption bands
Table 2 Effects of the carbon concentration, nitrogen source, and carbon:nitrogen ratio on growth and biosurfactant production from Labrenziaaggregate KP-5, cultivated in a 250 mL flask containing 50 mL MSM at 30 �C in a shaking incubator at 150 rpm for 48 h
Parameters Dry cell weight(g L−1)a
Surface tension(mN m−1)a
Biosurfactant(g L−1)a
EA (%)a
Corn husks powder (g L−1) (nitrogen sources, 1 g L−1 (NH4)2SO4)
2 1.60�0.30e 50.5�1.4c 0.10�0.01c 40.41�5.20d
4 1.82�0.13d 45.7�1.4b 0.12�0.02b 42.68�4.13cd
6 1.98�0.25c 43.2�1.4b 0.13�0.01b 44.24�3.95bc
8 2.03�0.15b 39.6�1.3a 0.25�0.03a 48.33�5.14a
10 2.14�0.04a* 39.0�2.2a 0.25�0.02a 48.40�6.20a
Nitrogen sources, 1 g L−1 (carbon source, 8 g L−1 CHP)
Beef extract 2.95�0.12b 41.0�1.5de 0.15�0.01h 38.51�5.67f
commercial name of monosodiumglutamate (CMSG)
2.71�0.35c 34.5�2.4g 1.05�0.12a 55.54�3.68e
Meat extract 2.91�0.14b 40.0�3.2de 0.14�0.14f 44.93�1.73d
C6H17N3O7 2.13�0.20e 45.5�0.9b 0.12�0.03e 45.53�2.83c
(NH4)2SO4 2.03�0.15f 39.6�1.3e 0.25�0.03a 48.33�5.14a
NaNO3 2.09�0.50f 36.0�3.1f 0.59�0.01b 51.51�1.47b
NH4Cl 2.27�0.32d 37.5�1.8f 0.52�0.04b 50.54�3.38a
NH4NO3 2.39�0.13d 45.0�2.3b 0.13�0.05a 35.93�1.63a
Peptone 3.14�0.27a 42.5�1.5cd 0.15�0.06a 41.82�2.15a
Urea 3.05�0.23b 52.3�2.8a 0.11�0.15a 30.51�8.47a
Yeast extract 3.07�0.14b 47.5�3.5b 0.13�0.06a 35.54�6.08a
Carbon:nitrogen ratio5:1 2.56�0.87h 42.0�3.3a 0.95�0.04h 52.31�4.03e
8:1 2.71�0.35g 34.5�2.4b 1.05�0.12g 55.54�3.68de
15:1 3.05�0.56f 30.2�3.3c 1.38�0.15f 58.25�4.35cd
20:1 3.34�0.24e 27.0�2.4d 1.87�0.11e 60.37�5.27bc
25:1 3.56�0.57d 26.3�1.5e 2.14�0.08d 62.59�6.15ab
30:1 3.98�0.42c 25.0�2.0e 2.90�0.24c 65.41�3.03a
35:1 4.28�0.28b 25.2�1.4e 3.27�0.31b 65.28�4.31a
40:1 4.59�0.35a 25.5�2.7e 3.50�0.25a 65.63�5.04a
45:1 4.58�0.12a 25.3�4.0e 3.50�0.10a 65.87�4.13a
a All values are mean � SD from triplicate determinations.
*Different superscript letters in the same column indicate significant differences (P < 0.05).
530 J Surfact Deterg
J Surfact Deterg (2018) 21: 523–539
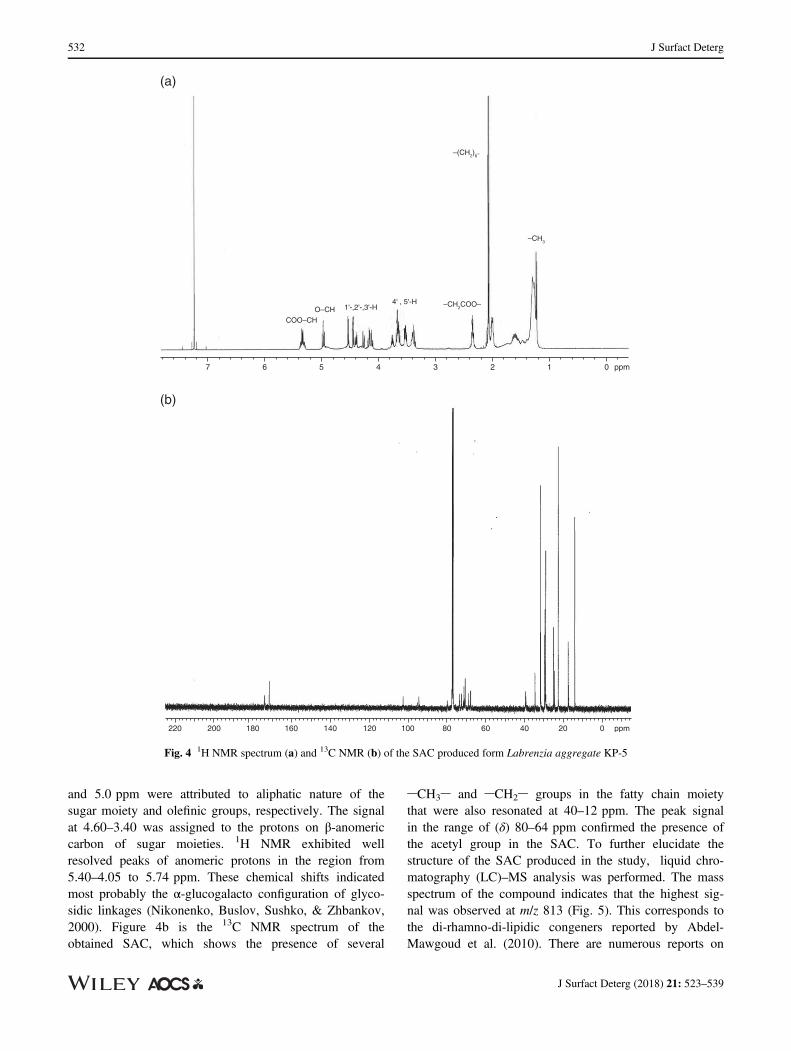
involving strong adsorption peaks at 3424 cm−1 indicatethe presence of O H stretching vibrations. Absorptionaround 2856–3002 cm−1 was assigned to the symmetricstretch (CH) of CH2 and CH3 groups of aliphatic chainssince lactones and esters have two strong absorption bandsarising at 1747 and 1648 cm−1, respectively. The stretch ofthe C O band of C( O) O C in lactones exists at1240 cm−1, while that from the acetyl esters was found tobe at 1370–1457 cm−1. Moreover, sugar C O stretch ofC O H groups was found to be at 1037 cm−1 and the
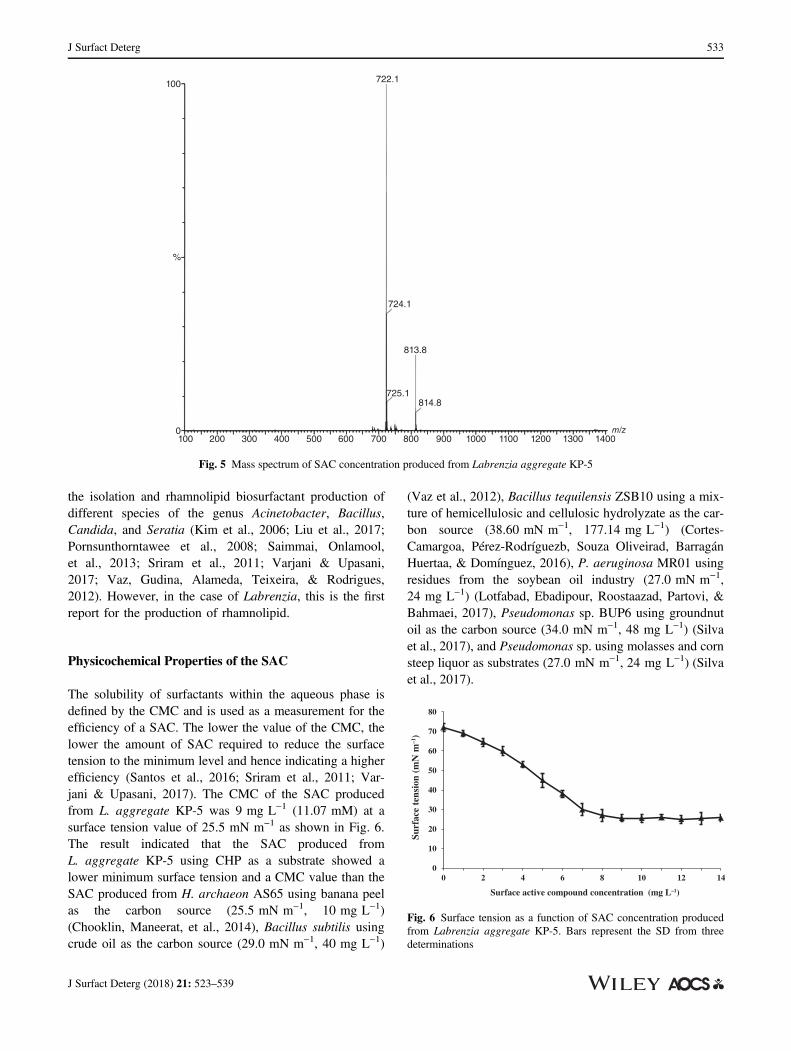
band at 1648 cm−1 corresponded to the C O H in-planebending of carboxylic acid ( COOH) in the structure ofthe product. The above information from the respectivewave numbers confirmed the rhamnolipid nature of the bio-surfactant (Abdel-Mawgoud, Lépine, & Déziel, 2010;Noparat et al., 2014).The 1H NMR spectrum of the obtained SAC (Fig. 4a)
had a number of signals corresponding to different sugarmoieties and protein content. The chemical shift (δ)values between 1.60 and 1.25 ppm and those between 5.4
0.0
0.5
1.0
1.5
2.0
2.5
3.0
3.5
4.0
4.5
5.0
0
10
20
30
40
50
60
70
80
0 6 12 18 24 30 36 42 48 54 60
Surf
ace
acti
ve c
ompo
und
(g L
–1)
Dry
cel
l wei
ght (
g L
–1)
)%( ytivitca
notac ifislu
mE
m–1
)N
m( nois
net ecafru
S
Time (g/L)
Surface tension (mN m–1)Surface active compound (g L−1)Emulsification activity (%)Dry cell weight (g L−1)
Fig. 2 Time course of growth and SAC production from Labrenzia aggregate KP-5, cultivated in a 250 mL flask containing 50 mL MSM at 30�C in a shaking incubator at 150 rpm
100
9080
7060
50
3500 3000 2500 2000 1500 1000 500
Wave number (cm–1)
Tra
nsm
ittan
ce (
%)
O–H
CH2, CH3
3424
.38
2930
.05
2856
.61
3002
.62
1648
.59
1457
.59
1370
.84
1170
.45
1240
.48
1747
.40
1037
.94
1078
.77
C(=O)–O–C
C(=O)–O–C
C–O–H
C=O
COOH
Lactones
Acetyl esters
Fig. 3 FT-IR of the SAC produced from Labrenzia aggregate KP-5
531J Surfact Deterg
J Surfact Deterg (2018) 21: 523–539
and 5.0 ppm were attributed to aliphatic nature of thesugar moiety and olefinic groups, respectively. The signalat 4.60–3.40 was assigned to the protons on β-anomericcarbon of sugar moieties. 1H NMR exhibited wellresolved peaks of anomeric protons in the region from5.40–4.05 to 5.74 ppm. These chemical shifts indicatedmost probably the α-glucogalacto configuration of glyco-sidic linkages (Nikonenko, Buslov, Sushko, & Zhbankov,2000). Figure 4b is the 13C NMR spectrum of theobtained SAC, which shows the presence of several
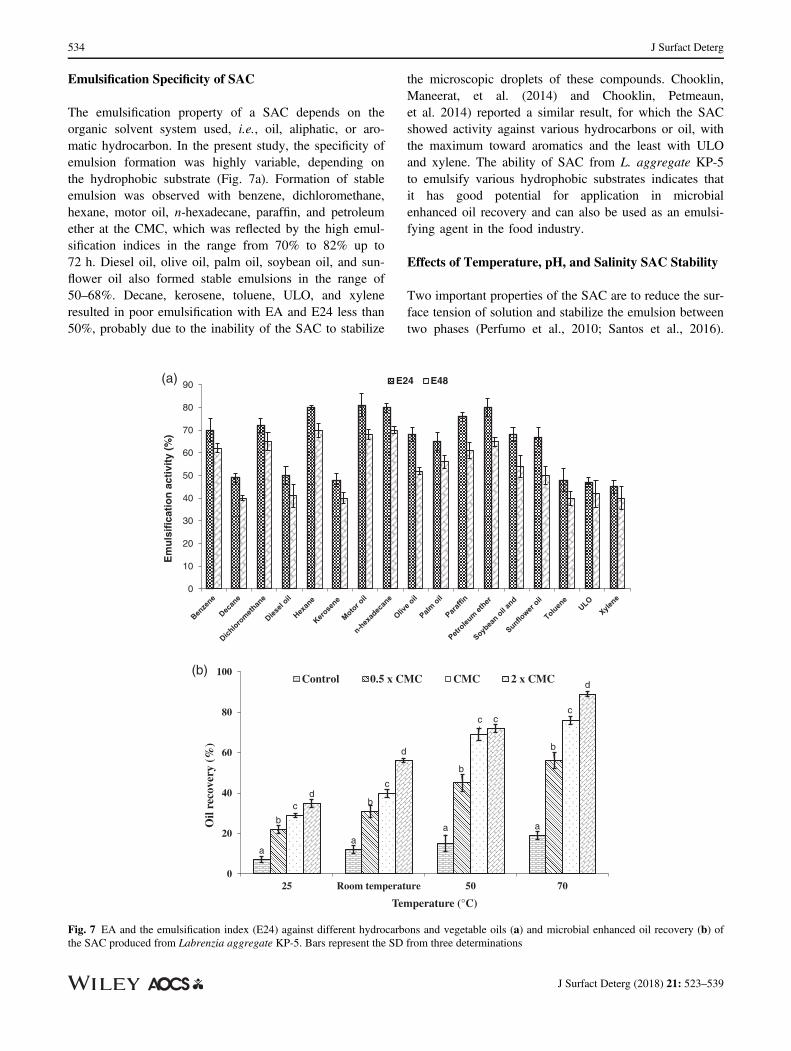
CH3 and CH2 groups in the fatty chain moietythat were also resonated at 40–12 ppm. The peak signalin the range of (δ) 80–64 ppm confirmed the presence ofthe acetyl group in the SAC. To further elucidate thestructure of the SAC produced in the study, liquid chro-matography (LC)–MS analysis was performed. The massspectrum of the compound indicates that the highest sig-nal was observed at m/z 813 (Fig. 5). This corresponds tothe di-rhamno-di-lipidic congeners reported by Abdel-Mawgoud et al. (2010). There are numerous reports on
7 6 5 4 3 2 1 0 ppm
ppm220 200 180 160 140 120 100 80 60 40 20 0
COO–CH
O–CH 1'-,2'-,3'-H4' , 5'-H –CH2COO–
–(CH2)6–
–CH3
(a)
(b)
Fig. 4 1H NMR spectrum (a) and 13C NMR (b) of the SAC produced form Labrenzia aggregate KP-5
532 J Surfact Deterg
J Surfact Deterg (2018) 21: 523–539
the isolation and rhamnolipid biosurfactant production ofdifferent species of the genus Acinetobacter, Bacillus,Candida, and Seratia (Kim et al., 2006; Liu et al., 2017;Pornsunthorntawee et al., 2008; Saimmai, Onlamool,et al., 2013; Sriram et al., 2011; Varjani & Upasani,2017; Vaz, Gudina, Alameda, Teixeira, & Rodrigues,2012). However, in the case of Labrenzia, this is the firstreport for the production of rhamnolipid.
Physicochemical Properties of the SAC
The solubility of surfactants within the aqueous phase isdefined by the CMC and is used as a measurement for theefficiency of a SAC. The lower the value of the CMC, thelower the amount of SAC required to reduce the surfacetension to the minimum level and hence indicating a higherefficiency (Santos et al., 2016; Sriram et al., 2011; Var-jani & Upasani, 2017). The CMC of the SAC producedfrom L. aggregate KP-5 was 9 mg L−1 (11.07 mM) at asurface tension value of 25.5 mN m−1 as shown in Fig. 6.The result indicated that the SAC produced fromL. aggregate KP-5 using CHP as a substrate showed alower minimum surface tension and a CMC value than theSAC produced from H. archaeon AS65 using banana peelas the carbon source (25.5 mN m−1, 10 mg L−1)(Chooklin, Maneerat, et al., 2014), Bacillus subtilis usingcrude oil as the carbon source (29.0 mN m−1, 40 mg L−1)
(Vaz et al., 2012), Bacillus tequilensis ZSB10 using a mix-ture of hemicellulosic and cellulosic hydrolyzate as the car-bon source (38.60 mN m−1, 177.14 mg L−1) (Cortes-Camargoa, Pérez-Rodríguezb, Souza Oliveirad, BarragánHuertaa, & Domínguez, 2016), P. aeruginosa MR01 usingresidues from the soybean oil industry (27.0 mN m−1,24 mg L−1) (Lotfabad, Ebadipour, Roostaazad, Partovi, &Bahmaei, 2017), Pseudomonas sp. BUP6 using groundnutoil as the carbon source (34.0 mN m−1, 48 mg L−1) (Silvaet al., 2017), and Pseudomonas sp. using molasses and cornsteep liquor as substrates (27.0 mN m−1, 24 mg L−1) (Silvaet al., 2017).
100
%
0100 200 300 400 500 600 700 800 900 1000 1100 1200 1300 1400
813.8
724.1
722.1
725.1814.8
m/z
Fig. 5 Mass spectrum of SAC concentration produced from Labrenzia aggregate KP-5
0
10
20
30
40
50
60
70
80
0 2 4 6 8 10 12 14
m–1
)N
m( noisnet eca fruS
Surface active compound concentration (mg L–1)
Fig. 6 Surface tension as a function of SAC concentration producedfrom Labrenzia aggregate KP-5. Bars represent the SD from threedeterminations
533J Surfact Deterg
J Surfact Deterg (2018) 21: 523–539
Emulsification Specificity of SAC
The emulsification property of a SAC depends on theorganic solvent system used, i.e., oil, aliphatic, or aro-matic hydrocarbon. In the present study, the specificity ofemulsion formation was highly variable, depending onthe hydrophobic substrate (Fig. 7a). Formation of stableemulsion was observed with benzene, dichloromethane,hexane, motor oil, n-hexadecane, paraffin, and petroleumether at the CMC, which was reflected by the high emul-sification indices in the range from 70% to 82% up to72 h. Diesel oil, olive oil, palm oil, soybean oil, and sun-flower oil also formed stable emulsions in the range of50–68%. Decane, kerosene, toluene, ULO, and xyleneresulted in poor emulsification with EA and E24 less than50%, probably due to the inability of the SAC to stabilize
the microscopic droplets of these compounds. Chooklin,Maneerat, et al. (2014) and Chooklin, Petmeaun,et al. 2014) reported a similar result, for which the SACshowed activity against various hydrocarbons or oil, withthe maximum toward aromatics and the least with ULOand xylene. The ability of SAC from L. aggregate KP-5to emulsify various hydrophobic substrates indicates thatit has good potential for application in microbialenhanced oil recovery and can also be used as an emulsi-fying agent in the food industry.
Effects of Temperature, pH, and Salinity SAC Stability
Two important properties of the SAC are to reduce the sur-face tension of solution and stabilize the emulsion betweentwo phases (Perfumo et al., 2010; Santos et al., 2016).
(a)
(b)
0
10
20
30
40
50
60
70
80
90
)%(
ytivitc an
oitacifislu
mE
E24 E48
aa
a ab
b
b
b
c
c
cc
d
d
c
d
0
20
40
60
80
100
25 Room temperature 50 70
Oil
reco
very
(%
)
Temperature (°C)
Control 0.5 x CMC CMC 2 x CMC
Fig. 7 EA and the emulsification index (E24) against different hydrocarbons and vegetable oils (a) and microbial enhanced oil recovery (b) ofthe SAC produced from Labrenzia aggregate KP-5. Bars represent the SD from three determinations
534 J Surfact Deterg
J Surfact Deterg (2018) 21: 523–539
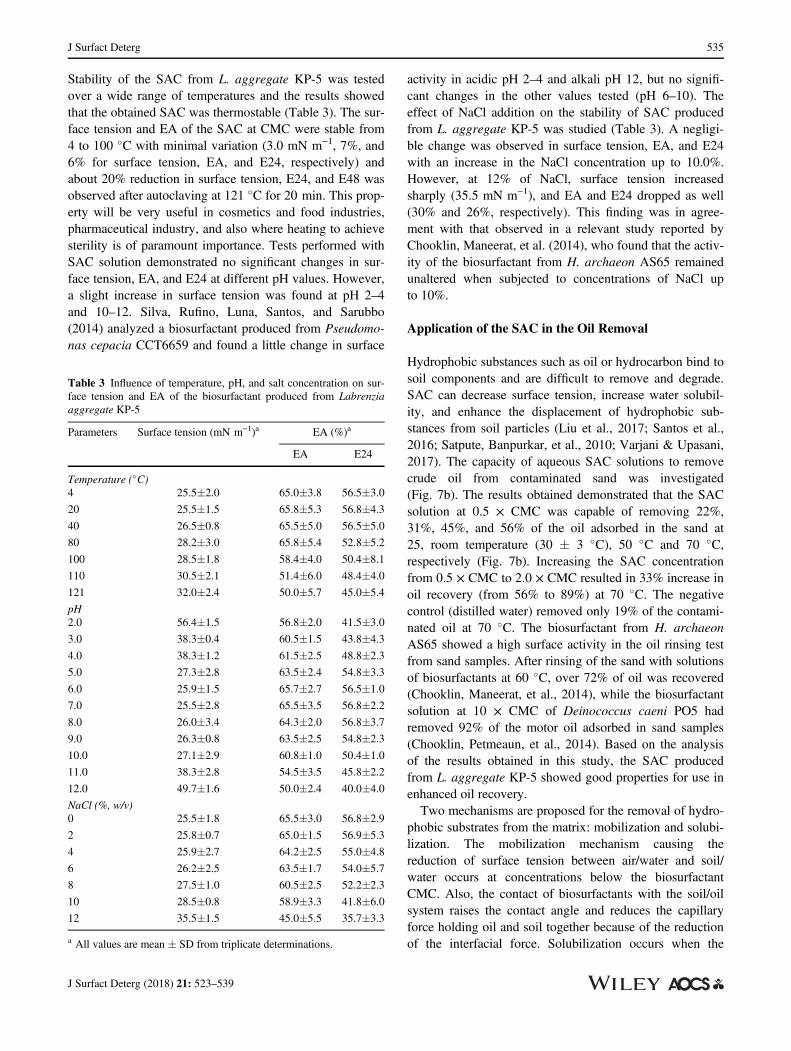
Stability of the SAC from L. aggregate KP-5 was testedover a wide range of temperatures and the results showedthat the obtained SAC was thermostable (Table 3). The sur-face tension and EA of the SAC at CMC were stable from4 to 100 �C with minimal variation (3.0 mN m−1, 7%, and6% for surface tension, EA, and E24, respectively) andabout 20% reduction in surface tension, E24, and E48 wasobserved after autoclaving at 121 �C for 20 min. This prop-erty will be very useful in cosmetics and food industries,pharmaceutical industry, and also where heating to achievesterility is of paramount importance. Tests performed withSAC solution demonstrated no significant changes in sur-face tension, EA, and E24 at different pH values. However,a slight increase in surface tension was found at pH 2–4and 10–12. Silva, Rufino, Luna, Santos, and Sarubbo(2014) analyzed a biosurfactant produced from Pseudomo-nas cepacia CCT6659 and found a little change in surface
activity in acidic pH 2–4 and alkali pH 12, but no signifi-cant changes in the other values tested (pH 6–10). Theeffect of NaCl addition on the stability of SAC producedfrom L. aggregate KP-5 was studied (Table 3). A negligi-ble change was observed in surface tension, EA, and E24with an increase in the NaCl concentration up to 10.0%.However, at 12% of NaCl, surface tension increasedsharply (35.5 mN m−1), and EA and E24 dropped as well(30% and 26%, respectively). This finding was in agree-ment with that observed in a relevant study reported byChooklin, Maneerat, et al. (2014), who found that the activ-ity of the biosurfactant from H. archaeon AS65 remainedunaltered when subjected to concentrations of NaCl upto 10%.
Application of the SAC in the Oil Removal
Hydrophobic substances such as oil or hydrocarbon bind tosoil components and are difficult to remove and degrade.SAC can decrease surface tension, increase water solubil-ity, and enhance the displacement of hydrophobic sub-stances from soil particles (Liu et al., 2017; Santos et al.,2016; Satpute, Banpurkar, et al., 2010; Varjani & Upasani,2017). The capacity of aqueous SAC solutions to removecrude oil from contaminated sand was investigated(Fig. 7b). The results obtained demonstrated that the SACsolution at 0.5 × CMC was capable of removing 22%,31%, 45%, and 56% of the oil adsorbed in the sand at25, room temperature (30 � 3 �C), 50 �C and 70 �C,respectively (Fig. 7b). Increasing the SAC concentrationfrom 0.5 × CMC to 2.0 × CMC resulted in 33% increase inoil recovery (from 56% to 89%) at 70 �C. The negativecontrol (distilled water) removed only 19% of the contami-nated oil at 70 �C. The biosurfactant from H. archaeonAS65 showed a high surface activity in the oil rinsing testfrom sand samples. After rinsing of the sand with solutionsof biosurfactants at 60 �C, over 72% of oil was recovered(Chooklin, Maneerat, et al., 2014), while the biosurfactantsolution at 10 × CMC of Deinococcus caeni PO5 hadremoved 92% of the motor oil adsorbed in sand samples(Chooklin, Petmeaun, et al., 2014). Based on the analysisof the results obtained in this study, the SAC producedfrom L. aggregate KP-5 showed good properties for use inenhanced oil recovery.Two mechanisms are proposed for the removal of hydro-
phobic substrates from the matrix: mobilization and solubi-lization. The mobilization mechanism causing thereduction of surface tension between air/water and soil/water occurs at concentrations below the biosurfactantCMC. Also, the contact of biosurfactants with the soil/oilsystem raises the contact angle and reduces the capillaryforce holding oil and soil together because of the reductionof the interfacial force. Solubilization occurs when the
Table 3 Influence of temperature, pH, and salt concentration on sur-face tension and EA of the biosurfactant produced from Labrenziaaggregate KP-5
Parameters Surface tension (mN m−1)a EA (%)a
EA E24
Temperature (�C)4 25.5�2.0 65.0�3.8 56.5�3.0
20 25.5�1.5 65.8�5.3 56.8�4.3
40 26.5�0.8 65.5�5.0 56.5�5.0
80 28.2�3.0 65.8�5.4 52.8�5.2
100 28.5�1.8 58.4�4.0 50.4�8.1
110 30.5�2.1 51.4�6.0 48.4�4.0
121 32.0�2.4 50.0�5.7 45.0�5.4
pH2.0 56.4�1.5 56.8�2.0 41.5�3.0
3.0 38.3�0.4 60.5�1.5 43.8�4.3
4.0 38.3�1.2 61.5�2.5 48.8�2.3
5.0 27.3�2.8 63.5�2.4 54.8�3.3
6.0 25.9�1.5 65.7�2.7 56.5�1.0
7.0 25.5�2.8 65.5�3.5 56.8�2.2
8.0 26.0�3.4 64.3�2.0 56.8�3.7
9.0 26.3�0.8 63.5�2.5 54.8�2.3
10.0 27.1�2.9 60.8�1.0 50.4�1.0
11.0 38.3�2.8 54.5�3.5 45.8�2.2
12.0 49.7�1.6 50.0�2.4 40.0�4.0
NaCl (%, w/v)0 25.5�1.8 65.5�3.0 56.8�2.9
2 25.8�0.7 65.0�1.5 56.9�5.3
4 25.9�2.7 64.2�2.5 55.0�4.8
6 26.2�2.5 63.5�1.7 54.0�5.7
8 27.5�1.0 60.5�2.5 52.2�2.3
10 28.5�0.8 58.9�3.3 41.8�6.0
12 35.5�1.5 45.0�5.5 35.7�3.3
a All values are mean � SD from triplicate determinations.
535J Surfact Deterg
J Surfact Deterg (2018) 21: 523–539
SAC concentration exceeds the CMC, as the apparent solu-bility of hydrophobic increases significantly because of theaggregation of SAC micelles. The tail or hydrophobic moi-eties of SAC cluster together inside the micellar structurewith the head or the hydrophilic part exposed to exteriorleaving the whole structure to remain in solution (Liu et al.,2017; Santos et al., 2016; Urum & Pekdemir, 2004).According to the observed data, solubilization is the mainmechanism associated with the oil removal by the SACobtained from L. aggregate KP-5, because increasing theSAC concentration enhanced the removal of oil signifi-cantly, because of the mixing of these molecules intomicelles. The results herein obtained are in accordance withthe previous report (Saimmai, Onlamool, et al., 2013)describing the solubilization mechanism of rhamnolipidfrom Selenomonas ruminantium CT2 in the removalof ULO.
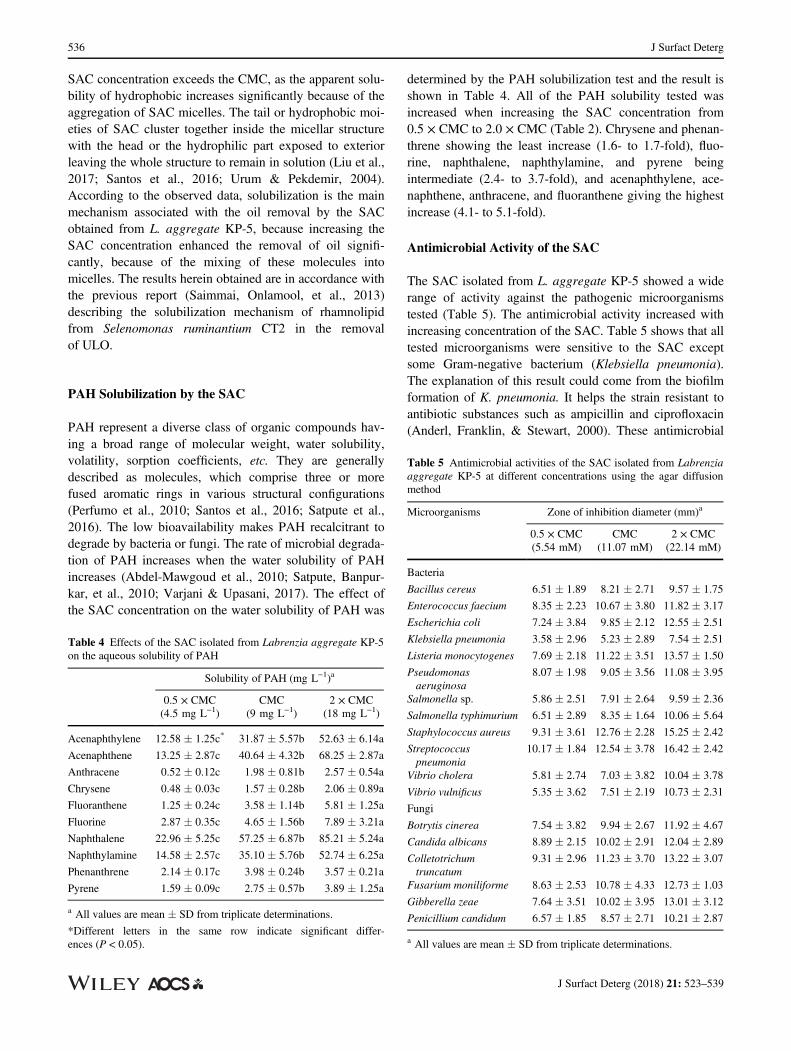
PAH Solubilization by the SAC
PAH represent a diverse class of organic compounds hav-ing a broad range of molecular weight, water solubility,volatility, sorption coefficients, etc. They are generallydescribed as molecules, which comprise three or morefused aromatic rings in various structural configurations(Perfumo et al., 2010; Santos et al., 2016; Satpute et al.,2016). The low bioavailability makes PAH recalcitrant todegrade by bacteria or fungi. The rate of microbial degrada-tion of PAH increases when the water solubility of PAHincreases (Abdel-Mawgoud et al., 2010; Satpute, Banpur-kar, et al., 2010; Varjani & Upasani, 2017). The effect ofthe SAC concentration on the water solubility of PAH was
determined by the PAH solubilization test and the result isshown in Table 4. All of the PAH solubility tested wasincreased when increasing the SAC concentration from0.5 × CMC to 2.0 × CMC (Table 2). Chrysene and phenan-threne showing the least increase (1.6- to 1.7-fold), fluo-rine, naphthalene, naphthylamine, and pyrene beingintermediate (2.4- to 3.7-fold), and acenaphthylene, ace-naphthene, anthracene, and fluoranthene giving the highestincrease (4.1- to 5.1-fold).
Antimicrobial Activity of the SAC
The SAC isolated from L. aggregate KP-5 showed a widerange of activity against the pathogenic microorganismstested (Table 5). The antimicrobial activity increased withincreasing concentration of the SAC. Table 5 shows that alltested microorganisms were sensitive to the SAC exceptsome Gram-negative bacterium (Klebsiella pneumonia).The explanation of this result could come from the biofilmformation of K. pneumonia. It helps the strain resistant toantibiotic substances such as ampicillin and ciprofloxacin(Anderl, Franklin, & Stewart, 2000). These antimicrobial
Table 4 Effects of the SAC isolated from Labrenzia aggregate KP-5on the aqueous solubility of PAH
Solubility of PAH (mg L−1)a
0.5 × CMC(4.5 mg L−1)
CMC(9 mg L−1)
2 × CMC(18 mg L−1)
Acenaphthylene 12.58 � 1.25c* 31.87 � 5.57b 52.63 � 6.14a
Acenaphthene 13.25 � 2.87c 40.64 � 4.32b 68.25 � 2.87a
Anthracene 0.52 � 0.12c 1.98 � 0.81b 2.57 � 0.54a
Chrysene 0.48 � 0.03c 1.57 � 0.28b 2.06 � 0.89a
Fluoranthene 1.25 � 0.24c 3.58 � 1.14b 5.81 � 1.25a
Fluorine 2.87 � 0.35c 4.65 � 1.56b 7.89 � 3.21a
Naphthalene 22.96 � 5.25c 57.25 � 6.87b 85.21 � 5.24a
Naphthylamine 14.58 � 2.57c 35.10 � 5.76b 52.74 � 6.25a
Phenanthrene 2.14 � 0.17c 3.98 � 0.24b 3.57 � 0.21a
Pyrene 1.59 � 0.09c 2.75 � 0.57b 3.89 � 1.25a
a All values are mean � SD from triplicate determinations.
*Different letters in the same row indicate significant differ-ences (P < 0.05).
Table 5 Antimicrobial activities of the SAC isolated from Labrenziaaggregate KP-5 at different concentrations using the agar diffusionmethod
Microorganisms Zone of inhibition diameter (mm)a
0.5 × CMC(5.54 mM)
CMC(11.07 mM)
2 × CMC(22.14 mM)
Bacteria
Bacillus cereus 6.51 � 1.89 8.21 � 2.71 9.57 � 1.75
Enterococcus faecium 8.35 � 2.23 10.67 � 3.80 11.82 � 3.17
Escherichia coli 7.24 � 3.84 9.85 � 2.12 12.55 � 2.51
Klebsiella pneumonia 3.58 � 2.96 5.23 � 2.89 7.54 � 2.51
Listeria monocytogenes 7.69 � 2.18 11.22 � 3.51 13.57 � 1.50
Pseudomonasaeruginosa
8.07 � 1.98 9.05 � 3.56 11.08 � 3.95
Salmonella sp. 5.86 � 2.51 7.91 � 2.64 9.59 � 2.36
Salmonella typhimurium 6.51 � 2.89 8.35 � 1.64 10.06 � 5.64
Staphylococcus aureus 9.31 � 3.61 12.76 � 2.28 15.25 � 2.42
Streptococcuspneumonia
10.17 � 1.84 12.54 � 3.78 16.42 � 2.42
Vibrio cholera 5.81 � 2.74 7.03 � 3.82 10.04 � 3.78
Vibrio vulnificus 5.35 � 3.62 7.51 � 2.19 10.73 � 2.31
Fungi
Botrytis cinerea 7.54 � 3.82 9.94 � 2.67 11.92 � 4.67
Candida albicans 8.89 � 2.15 10.02 � 2.91 12.04 � 2.89
Colletotrichumtruncatum
9.31 � 2.96 11.23 � 3.70 13.22 � 3.07
Fusarium moniliforme 8.63 � 2.53 10.78 � 4.33 12.73 � 1.03
Gibberella zeae 7.64 � 3.51 10.02 � 3.95 13.01 � 3.12
Penicillium candidum 6.57 � 1.85 8.57 � 2.71 10.21 � 2.87
a All values are mean � SD from triplicate determinations.
536 J Surfact Deterg
J Surfact Deterg (2018) 21: 523–539
results were similar to the results obtained from Gomaa(Gomaa, 2013) where the biosurfactant produced fromBacillus licheniformis M104 grown on whey had a goodsurface activity and antimicrobial activity against severaltested pathogenic microorganisms except K. pneumonia.The antimicrobial properties of rhamnolipid have oftenbeen reported (Gomaa, 2013; Liu et al., 2017; Santos et al.,2016; Varjani & Upasani, 2017). Very recently, definedrhamnolipids have shown good inhibition behavior againsteither photogenic bacteria (e.g., K. pneumonia,L. monocytogenes, P. aeruginosa, and S. aureus)(de Araujo et al., 2016; Haba et al., 2014) or phytopatho-genic fungal species (e.g., C. albicans, Mucor miehei, Neu-rospora crassa, and Yarrowia lipolytica) (Sharma,Kalita, & Duarah, 2017; Silva et al., 2017).
Phytotoxicity Determination of the SAC
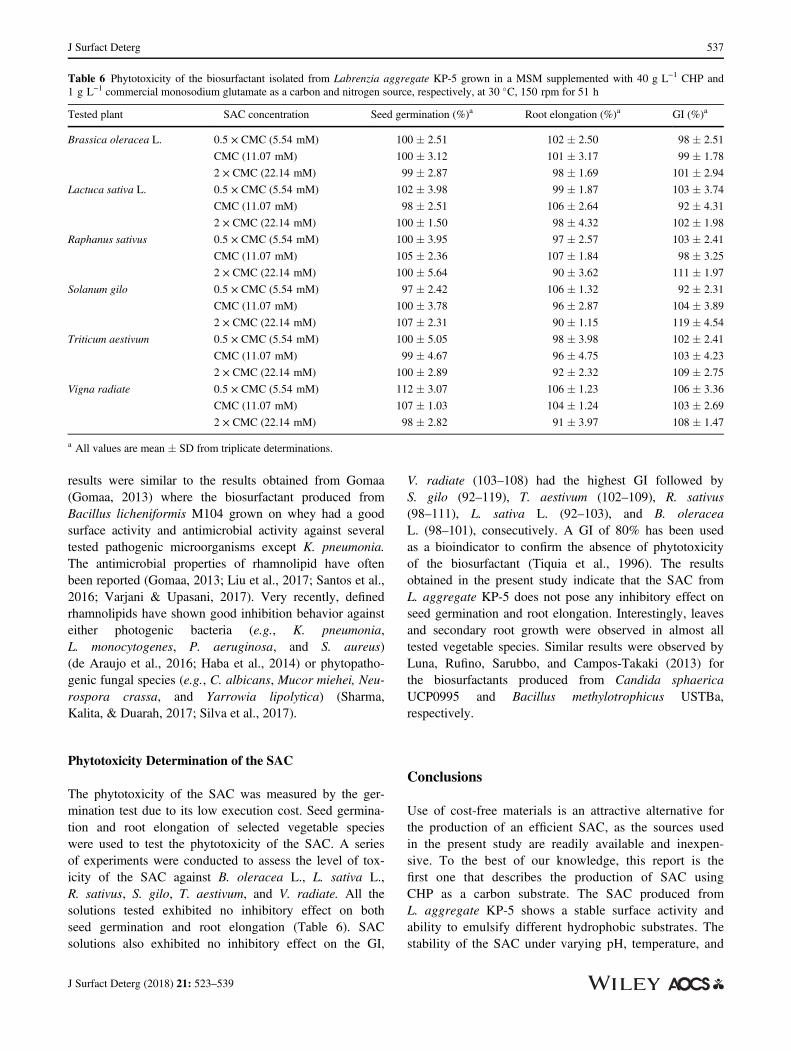
The phytotoxicity of the SAC was measured by the ger-mination test due to its low execution cost. Seed germina-tion and root elongation of selected vegetable specieswere used to test the phytotoxicity of the SAC. A seriesof experiments were conducted to assess the level of tox-icity of the SAC against B. oleracea L., L. sativa L.,R. sativus, S. gilo, T. aestivum, and V. radiate. All thesolutions tested exhibited no inhibitory effect on bothseed germination and root elongation (Table 6). SACsolutions also exhibited no inhibitory effect on the GI,
V. radiate (103–108) had the highest GI followed byS. gilo (92–119), T. aestivum (102–109), R. sativus(98–111), L. sativa L. (92–103), and B. oleraceaL. (98–101), consecutively. A GI of 80% has been usedas a bioindicator to confirm the absence of phytotoxicityof the biosurfactant (Tiquia et al., 1996). The resultsobtained in the present study indicate that the SAC fromL. aggregate KP-5 does not pose any inhibitory effect onseed germination and root elongation. Interestingly, leavesand secondary root growth were observed in almost alltested vegetable species. Similar results were observed byLuna, Rufino, Sarubbo, and Campos-Takaki (2013) forthe biosurfactants produced from Candida sphaericaUCP0995 and Bacillus methylotrophicus USTBa,respectively.
Conclusions
Use of cost-free materials is an attractive alternative forthe production of an efficient SAC, as the sources usedin the present study are readily available and inexpen-sive. To the best of our knowledge, this report is thefirst one that describes the production of SAC usingCHP as a carbon substrate. The SAC produced fromL. aggregate KP-5 shows a stable surface activity andability to emulsify different hydrophobic substrates. Thestability of the SAC under varying pH, temperature, and
Table 6 Phytotoxicity of the biosurfactant isolated from Labrenzia aggregate KP-5 grown in a MSM supplemented with 40 g L−1 CHP and1 g L−1 commercial monosodium glutamate as a carbon and nitrogen source, respectively, at 30 �C, 150 rpm for 51 h
Tested plant SAC concentration Seed germination (%)a Root elongation (%)a GI (%)a
Brassica oleracea L. 0.5 × CMC (5.54 mM) 100 � 2.51 102 � 2.50 98 � 2.51
CMC (11.07 mM) 100 � 3.12 101 � 3.17 99 � 1.78
2 × CMC (22.14 mM) 99 � 2.87 98 � 1.69 101 � 2.94
Lactuca sativa L. 0.5 × CMC (5.54 mM) 102 � 3.98 99 � 1.87 103 � 3.74
CMC (11.07 mM) 98 � 2.51 106 � 2.64 92 � 4.31
2 × CMC (22.14 mM) 100 � 1.50 98 � 4.32 102 � 1.98
Raphanus sativus 0.5 × CMC (5.54 mM) 100 � 3.95 97 � 2.57 103 � 2.41
CMC (11.07 mM) 105 � 2.36 107 � 1.84 98 � 3.25
2 × CMC (22.14 mM) 100 � 5.64 90 � 3.62 111 � 1.97
Solanum gilo 0.5 × CMC (5.54 mM) 97 � 2.42 106 � 1.32 92 � 2.31
CMC (11.07 mM) 100 � 3.78 96 � 2.87 104 � 3.89
2 × CMC (22.14 mM) 107 � 2.31 90 � 1.15 119 � 4.54
Triticum aestivum 0.5 × CMC (5.54 mM) 100 � 5.05 98 � 3.98 102 � 2.41
CMC (11.07 mM) 99 � 4.67 96 � 4.75 103 � 4.23
2 × CMC (22.14 mM) 100 � 2.89 92 � 2.32 109 � 2.75
Vigna radiate 0.5 × CMC (5.54 mM) 112 � 3.07 106 � 1.23 106 � 3.36
CMC (11.07 mM) 107 � 1.03 104 � 1.24 103 � 2.69
2 × CMC (22.14 mM) 98 � 2.82 91 � 3.97 108 � 1.47
a All values are mean � SD from triplicate determinations.
537J Surfact Deterg
J Surfact Deterg (2018) 21: 523–539
salinity is also another attractive characteristic for itsapplications in a diversity of environments. This com-plies with the recent need for the use of SAC in theircrude form for the purpose of cost reduction. Moreimportantly, the excellent biological activity, capacity toremove hydrophobic contaminants, and no toxicity ofthe SAC indicated its potential application in agriculturaland environmental fields.
Acknowledgements We are grateful to the Rajamangala Universityof Technology Srivijaya for providing a scholarship to C.S.C. andPhuket Rajabhat University for providing a scholarship to A.S.
References
Abdel-Mawgoud, A. M., Lépine, F., & Déziel, E. (2010) Rhamnoli-pids: Diversity of structures, microbial origins and roles. AppliedMicrobiology and Biotechnology, 86:1323–1336.
Anderl, J. N., Franklin, M. J., & Stewart, P. S. (2000) Role of antibi-otic penetration limitation in Klebsiella pneumoniae biofilm resis-tance to ampicillin and ciprofloxacin. Antimicrobial Agents andChemotherapy, 44:1818–1824.
Benincasa, M., & Accorsini, F. R. (2008) Pseudomonas aeruginosaLBI production as an integrated process using the wastes fromsunflower-oil refining as a substrate. Bioresource Technology, 99:3843–3849.
Candan, F., Unlu, M., Tepe, B., Daferera, D., Polissiou, M.,Sokmen, A., & Akpulat, H. A. (2003) Antioxidant and antimicro-bial activity of the essential oil and methanol extracts of Achilleamillefolium subsp. millefolium Afan. (Asteraceae). Journal of Eth-nopharmacology, 87:215–220.
Chaplin, M. F., & Kennedy, J. F. (1986) Uronic acid (carbazole)assay. In M. F. Chaplin and J. F. Kennedy (Eds.) Carbohydrateanalysis—A practical approach (pp. 129–130). Oxford, England:IRL Press.
Chen, L. H., Chen, Y. S., & Juang, R. S. (2008) Recovery of surfactinfrom fermentation broths by a hybrid salting-out and membrane fil-tration process. Separation and Purification Technology, 59:244–252.
Chooklin, C. C., Maneerat, S., & Saimmai, A. (2014) Utilization ofbanana peel as a novel substrate for biosurfactant production byHalobacteriace aearchaeon AS65. Applied Biochemistry and Bio-technology, 173:624–645.
Chooklin, C. C., Petmeaun, S., Maneerat, S., & Saimmai, A. (2014)Isolation and characterization of a biosurfactant from Deinococcuscaeni PO5 by using jackfruit seed powder as a substrate. Annals ofMicrobiology, 64:1007–1020.
Cortes-Camargoa, S., Pérez-Rodríguezb, N., de SouzaOliveirad, R. P., Barragán Huertaa, B. E., & Domínguez, J. M.(2016) Production of biosurfactants from vine-trimming shootsusing the halotolerant strain Bacillus tequilensis ZSB10. IndustrialCrops and Products, 79:258–266.
de Araujo, L. V., Guimaraes, C. R., da Silva Marquita, R. L.,Santiago, V. M. J., de Souza, M. P., Nitschke, M., &Freire, D. M. G. (2016) Rhamnolipid and surfactin:Anti-adhesion/antibiofilm and antimicrobial effects. Food Control,63:171–178.
Folch, J. M., Lees, M., & Stanly, H. S. (1956) A simple method forthe isolation and quantification of total lipids from animal tissues.The Journal of Biological Chemistry, 226:497–509.
Franzetti, A., Caredda, P., Colla, P. L., Pintus, M., Tamburini, E.,Papacchini, M., & Bestetti, G. (2009) Cultural factors affecting
biosurfactant production by Gordonia sp. BS29. International Bio-deterioration & Biodegradation, 63:943–947.
Gomaa, E. Z. (2013) Antimicrobial activity of a biosurfactant pro-duced by Bacillus licheniformis strain M104 grown on whey. Bra-zilian Archives of Biology and Technology, 56:259–268.
Haba, E., Bouhdid, S., Torrego-Solana, N., Marques, A. M.,Espuny, M. J., Garcia-Celma, M. J., & Manresa, A. (2014) Rham-nolipids as emulsifying agents for essential oil formulations: Anti-microbial effect against Candida albicans and methicillin-resistantStaphylococcus aureus. International Journal of Pharmaceutics,476:134–141.
Hall, T. A. (1999) Bioedit: A user-friendly biological sequence align-ment editor and analysis program for Windows 95/98/NT. NucleicAcids Symposium Series, 41:95–98.
Jan, A. T. (2017) Outer membrane vesicles (OMVs) ofGram-negative bacteria: A perspective update. Frontiers in Micro-biology, 8:1053.
Kim, H. S., Jeon, J. W., Kim, B. H., Yong, A. C., Mock, O. H., &Yoon, B. D. (2006) Extracellular production of a glycolipid biosur-factant, mannosylerythritol lipid, by Candida sp. SY16 using fedbatch fermentation. Applied Microbiology and Biotechnology, 70:391–396.
Kourmentza, C., Freitas, F., Alves, V., & Reis, M. A. M. (2017)Microbial conversion of waste and surplus materials intohigh-value added products: The case of biosurfactants. InV. C. Kalia & P. Kumar (Eds.), Microbial applications (Vol. 1,pp. 29–77). Cham: Springer.
Liu, G., Zhong, H., Yang, X., Liu, Y., Shao, B., & Liu, Z. (2017)Advances in applications of rhamnolipids biosurfactant in environ-mental remediation: A review. Biotechnology and Bioengineering,115:796–814. https://doi.org/10.1002/bit.26517
Lotfabad, T. B., Ebadipour, N., Roostaazad, R., Partovi, M., &Bahmaei, M. (2017) Two schemes for production of biosurfactantfrom Pseudomonas aeruginosa MR01: Applying residues fromsoybean oil industry and silica sol–gel immobilized cells. Colloidsand Surfaces B, 152:159–168.
Lotfabad, T. B., Shourian, M., Roostaazad, R., Najafabadi, A. R.,Adelzadeh, M. R., & Noghabi, K. A. (2009) An efficientbiosurfactant-producing bacterium Pseudomonas aeruginosaMR01, isolated from oil excavation areas in south of Iran. Colloidsand Surfaces B, 69:183–193.
Lowry, O. H., Rosebrough, N. J., Farr, A. L., & Randall, R. J. (1951)Protein measurement with the Folin phenol reagent. The Journal ofBiological Chemistry, 193:265–275.
Luna, J. M., Rufino, R. D., Sarubbo, L. A., & Campos-Takiaki, G. M.(2013) Characterization, surface properties and biological activityof a biosurfactant produced from industrial waste by Candidasphaerica UCP0995 for application in the petroleum industry. Col-loids and Surfaces B, 102:202–209.
Mahalaxmi, Y., Sathish, T., Rao, C. S., & Prakasham, R. S. (2010)Corn husk as a novel substrate for the production of rifamycin B byisolated Amycolatopsis sp. RSP 3 under SSF. Process Biochemis-try, 45:47–53.
Nikonenko, N. A., Buslov, D. K., Sushko, N. I., & Zhbankov, R. G.(2000) Investigation of stretching vibrations of glycosidic linkagesin disaccharides and polysaccharides with use of IR spectra decon-volution. Biopolymers, 57:257–262.
Noparat, P., Maneerat, S., & Saimmai, A. (2014) Utilization of palmoil decanter cake as a novel substrate for biosurfactant productionfrom a new and promising strain of Ochrobactrum anthropi 2/3.World Journal of Microbiology and Biotechnology, 30:865–877.
Office of Agricultural Economics (2015) The major agriculturalproducts and trends. Department of Agriculture, Bangkok,Thailand, 226 pp.
Overholt, W. A., Green, S. J., Marks, K. P., Venkatraman, R.,Prakash, O., & Kostka, J. E. (2013) Draft genome sequences for
538 J Surfact Deterg
J Surfact Deterg (2018) 21: 523–539
oil-degrading bacterial strains from beach sands impacted by thedeep water horizon oil spill. Genome Announcements, 19:1.
Perfumo, A., Smyth, T. J. P., Marchant, R., & Banat, I. M. (2010)Production and roles of biosurfactants and bioemulsifiers in acces-sing hydrophobic substrates. In K. N. Timmis (Ed.), Handbook ofhydrocarbon and lipid microbiology (pp. 1501–1512). Berlin:Springer-Verlag.
Plaza, G. A., Zjawiony, I., & Banat, I. M. (2006) Use of differentmethods for detection of thermophilic biosurfactant-producing bac-teria from hydrocarbon contaminated and bioremediated soils.Journal of Petroleum Science and Engineering, 50:71–77.
Pornsunthorntawee, O., Arttaweeporn, N., Paisanjit, S.,Somboonthanate, P., Abe, M., Rujiravanit, R., & Chavadej, S.(2008) Isolation and comparison of biosurfactants produced byBacillus subtilis PT2 and Pseudomonas aeruginosa SP4 for micro-bial surfactant-enhanced oil recovery. Biochemical EngineeringJournal, 42:172–179.
Prakash, P., Jayalakshmi, S. K., Prakash, B., Rubul, M., &Sreeramulu, K. (2012) Production of alkaliphilic, halotolerent, ther-mostable cellulase free xylanase by Bacillus halodurans PPKS-2using agro waste: Single step purification and characterization.World Journal of Microbiology and Biotechnology, 28:183–192.
Priyanka, P., Arun, A. B., & Rekha, P. D. (2014) Sulfated exopoly-saccharide produced by Labrenzia sp. PRIM-30, characterizationand prospective applications. International Journal of BiologicalMacromolecules, 69:290–295.
Rodrigues, L., Teixeira, J., Oliveira, R., & Mei, H. C. V. (2006)Response surface optimization of the medium components for theproduction of biosurfactants by probiotic bacteria. Process Bio-chemistry, 41:1–10.
Ron, E. Z., & Rosenberg, E. (2001) Natural roles of biosurfactants.Environmental Microbiology, 3:229–236.
Saikia, R. R., Deka, S., Deka, M., & Banat, I. M. (2012) Isolation ofbiosurfactant-producing Pseudomonas aeruginosa RS29 fromoil-contaminated soil and evaluation of different nitrogen sources inbiosurfactant production. Annals of Microbiology, 62:753–763.
Saimmai, A., Onlamool, T., Sobhon, V., & Maneerat, S. (2013) Anefficient biosurfactant-producing bacterium Selenomonas ruminan-tium CT2, isolated from mangrove sediment in south of Thailand.World Journal of Microbiology and Biotechnology, 29:87–102.
Saimmai, A., Rukadee, O., Onlamool, T., Sobhon, V., & Maneerat, S.(2012) Characterization and phylogenetic analysis of microbial sur-face active compounds-producing bacteria. Applied Biochemistryand Biotechnology, 168:1003–1018.
Saimmai, A., Tani, A., Sobhon, V., & Maneerat, S. (2012) Mangrovesediment, a new source of potential biosurfactant producing bacte-ria. Annals of Microbiology, 62:1669–1679.
Saimmai, A., Udomsilp, S., & Maneerat, S. (2013) Production andcharacterization of biosurfactant from marine bacterium of Inquili-nus limosus KB3 grown on low-cost raw materials. Annals ofMicrobiology, 63:1327–1339.
Saisa-ard, K., Saimmai, A., & Maneerat, S. (2014) Characterizationand phylogenetic analysis of biosurfactant-producing bacteria iso-lated from palm oil contaminated soils. Songklanakarin Journal ofScience and Technology, 36:163–175.
Santos, D. K., Rufino, R. D., Luna, J. M., Santos, V. A., &Sarubbo, L. A. (2016) Biosurfactants: Multifunctional biomoleculesof the 21st century. International Journal of Molecular Sciences,17:401.
Satpute, S. K., Banat, I. M., Dhakephalkar, P. K.,Banpurkar, A. G., & Chopade, B. A. (2010) Biosurfactants, bioe-mulsifiers and exopolysaccharides from marine microorganisms.Biotechnology Advances, 28:436–450.
Satpute, S. K., Banpurkar, A. G., Dhakephalkar, P. K.,Banat, I. M., & Chopade, B. A. (2010) Methods for investigatingbiosurfactants and bioemulsifiers: A review. Critical Reviews inBiotechnology, 30:127–144.
Satpute, S. K., Kulkarni, G. R., Banpurkar, A. G., Banat, I. M.,Mone, N. S., Patil, R. H., & Cameotra, S. S. (2016) Biosurfactant/sfrom Lactobacilli species: Properties, challenges and potential bio-medical applications. Journal of Basic Microbiology, 56:1140–1158.
Sharma, D., Kalita, S., & Duarah, K. (2017) Isolation and characteri-zation of biosurfactant producing micro organisms and to determineit’s in vitro antagonistic activity against phytopathogenic fungi.International Journal of Current Trends in Science and Technol-ogy, 7:20355–20368.
Sharma, R., Oberoi, H. S., Sharma, R., & Oberoi, H. S. (2017)Biosurfactant-aided bioprocessing: Industrial applications and envi-ronmental impact. In P. Shukla (Ed.), Recent advances in appliedmicrobiology (pp. 55–88). Singapore: Springer.
Silva, M. A., Silva, A. F., Rufino, R. D., Luna, J. M.,Santos, V. A., & Sarubbo, L. A. (2017) Production of biosurfac-tants by Pseudomonas species for application in the petroleumindustry. Water Environmental Research, 89:117–126.
Silva, N. M. P. R., Rufino, R. D., Luna, J. M., Santos, V. A., &Sarubbo, L. A. (2014) Screening of Pseudomonas species for bio-surfactant production using low-cost substrates. Biocatalysis andAgricultural Biotechnology, 3:132–139.
Sneath, P. H. A. (1986) Endospore-forming gram-positive rods andcocci. In S. PHA (Ed.), Bergey’s manual of systelnatic bacteriology(Vol. 2, pp. 1104–1105). Baltimore, MD: Williams and Wilkins.
Sriram, M. I., Kalishwaralal, K., Deepak, V., Gracerosepat, R.,Srisakthi, K., & Gurunathan, S. (2011) Biofilm inhibition and anti-microbial action of lipopeptide biosurfactant produced by heavymetal tolerant strain Bacillus cereus NK1. Colloids and Surfaces B,85:174–181.
Tiquia, S. M., Tam, N. F. Y., & Hodgkiss, I. J. (1996) Effects of com-posting on phytotoxicity of spent pig-manure sawdust litter. Envi-ronmental Pollution, 93:249–256.
Urum, K., & Pekdemir, T. (2004) Evaluation of biosurfactants forcrude oil contaminated soil washing. Chemosphere, 57:1139–1150.
Uzoigwe, C., Burgess, J. G., Ennis, C. J., & Rahman, P. K. (2015)Bioemulsifiers are not biosurfactants and require different screeningapproaches. Frontiers in Microbiology, 6:245.
Varjani, S. J., & Upasani, V. N. (2017) Critical review on biosurfac-tant analysis, purification and characterization using rhamnolipid asa model biosurfactant. Bioresource Technology, 232:389–397.
Vaz, D. A., Gudina, E. J., Alameda, E. J., Teixeira, J. A., &Rodrigues, L. R. (2012) Performance of a biosurfactant producedby a Bacillus subtilis strain isolated from crude oil samples as com-pared to commercial chemical surfactants. Colloids and Surfaces B,89:167–174.
Vijayaraghavan, P., Lazarus, S., & Vincent, S. G. P. (2014)De-hairing protease production by an isolated Bacillus cereus strainAT under solid-state fermentation using cow dung: Biosynthesisand properties. Saudi Journal of Biological Sciences, 21:27–34.
Weisburg, W. G., Barns, S. M., Pelletier, D. A., & Lane, D. J. (1991)16S ribosomal DNA amplification for phylogenetic study. Journalof Bacteriology, 173:697–703.
Youssef, N. H., Dunacn, K. E., Nagle, D. P., Savage, K. N.,Knapp, R. M., & McInerney, M. J. (2004) Comparison of methodsto detect biosurfactant production by diverse microorganism. Jour-nal of Microbiological Methods, 56:339–347.
539J Surfact Deterg
J Surfact Deterg (2018) 21: 523–539
![McCook Weekly Tribune. (McCook, NE) 1884-11-27 [p ].of corn, husks and smut. ... Orleans exposition 20 barrels of apples, 15 bushels of potatoes, assorted, 13 bushels of wheat, 35](https://img.pdfslide.us/doc/110x75/5ea85b88a15a6e7d03428ae6/mccook-weekly-tribune-mccook-ne-1884-11-27-p-of-corn-husks-and-smut-.jpg)