Embed Size (px)
Citation preview

VIEW POINT
USING COMPUTER VISION TO DETECT AND CLASSIFY CORROSION
Identifying corrosion is labor-intensive and expensive. Not identifying it can ultimately cost even more in lost lives and environmental damage. Computer vision can help by replacing expensive, yearly certified inspections with affordable, fast and on-demand corrosion checks.
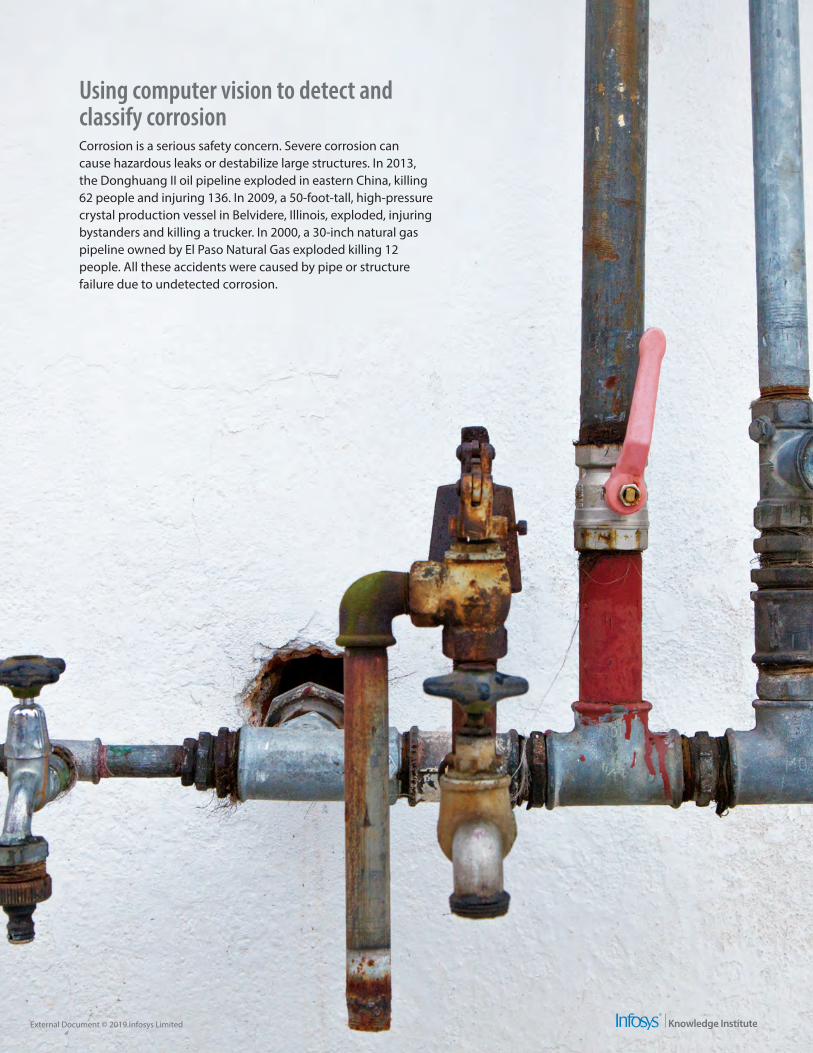
Using computer vision to detect and classify corrosionCorrosion is a serious safety concern. Severe corrosion can cause hazardous leaks or destabilize large structures. In 2013, the Donghuang II oil pipeline exploded in eastern China, killing 62 people and injuring 136. In 2009, a 50-foot-tall, high-pressure crystal production vessel in Belvidere, Illinois, exploded, injuring bystanders and killing a trucker. In 2000, a 30-inch natural gas pipeline owned by El Paso Natural Gas exploded killing 12 people. All these accidents were caused by pipe or structure failure due to undetected corrosion.
External Document © 2019 Infosys Limited

External Document © 2019 Infosys Limited
Standardizing the resultsCurrently, certified inspectors do corrosion detection. It is human-driven, which means the results are inconsistent and subjective. What one certified inspector might classify as severe corrosion, another may call moderate. This basic human difference makes it difficult to standardize the results and decide where to spend money on repairs or recoating. Technology can solve this problem by unifying the way companies identify and classify corrosion. It’s unrealistic to have the same inspector look at every plant owned by a large corporation. Using computer vision, the results are based on the same data and easily standardized. This approach can create standard results at all company facilities.
Applying artificial intelligence and machine learning
In 2018, Infosys embarked on a proof of concept (PoC) with a mining industry client. The goal was to build
an artificial intelligence and machine learning (AI-ML) system to improve the quality, consistency and predictability of corrosion detection. Infosys engineers used dense neural networks, hyper parameters, binary classification problems and convolution to come up with an AI prototype.
Currently, the preventive maintenance process involves only certified inspectors, who walk around the facility to evaluate corroded surfaces. Mining companies, electric and utilities, oil and gas, and chemical companies all have large steel structure that must be checked for corrosion. Depending on the size of the facility, this corrosion check could take weeks. The PoC set out to prove that machine learning computer vision techniques will deliver consistent, faster and cheaper corrosion detection on demand all year long.
The different levels of corrosion
The first step is to understand how corrosion occurs (Figure 1). There’s a protective coating on top of most external steel surfaces to prevent corrosion. Corrosion is called ‘coating
loss’ because that is literally when it starts. Granules of dust and stains on the surface gradually break down the coating. As cracks develop, the coating will flake off, exposing the underlying surface. Coating loss is considered severe when that surface is exposed.
The proof of concept solves two classification problems1. How can a machine see the
corrosion in an image? This is an issue of rust versus no rust. It’s done using a binary classification problem. The goal is to identify whether an image shows coating loss or coating normal. Annotated images marked as P1, P2 and P3 are classified as coating loss. Images classified as good are marked as coating normal.
2. Can a machine tell how severe the corrosion is? This is a multiclass severity classification. The machine must not only identify corrosion, but also classify how severe it is.
Figure 1: Coating loss classification grades
GOOD LOW MODERATE SEVERE
Source: Infosys PoC 2018

External Document © 2019 Infosys Limited
Techniques applied to prove computer vision can identify and grade corrosion:
Machine learning engine
The machine learning engine is the foundation of the corrosion detection solution. There are various steps in a machine learning workflow, from data collection and preparation to data interpretation. Machine learning (both DNNs and convolutional neural networks) is widely used in deep learning, natural language processing and cognitive computing. In effect, this engine just keeps getting smarter and continuously learns to make better decisions on corrosion levels.
Image Annotations
Machine learning starts with the input dataset. It’s one of the most important parts of the process. Dataset preparation is especially complex when you have unstructured data, such as pictures. Images come in various sizes and resolutions. How do we use pictures to create a dataset?
In this case, Infosys used a free tool called Labellmg to create 3,000 image annotations with a 70% percent test/train split.
Labellmg gives the user the ability to mark down portions of images and label them.
This tool is easy to setup on a local or cloud-based machine, the dataset doesn’t need to be taken out of the secure perimeter and it supports both Yolo and PascalVOC formats.
Feature Engineering
Feature engineering is the ability to select key aspects of the data to produce a structured result. The process puts data through several transformations to generate meaningful, uniform data to feed a machine learning engine. For this project, we’re using annotated image portions from a large image. Each annotated image will be classified as P1, P2, P3 or good. The classification label and annotated images are used to create the input vector. Technically,
machine learning can begin working with a minimal dataset. But, the results from the machine learning model may not be accurate. The more inputs used, the better the results, and there is no limit to the number of inputs.
Figure 2 is an example of an annotated image. It’s composed of three color pixels encoded to represent the true image. When you’re looking at an input vector in a machine learning dataset, every line item represents an annotated image. The final step is data engineering (Figure 3). That’s when each annotated image goes through several transformation steps:
1. Resize the image
2. Extract the color channels
3. Scale color codes
4. Flatten the data
5. Add them to the machine learning dataset
Figure 2. Example of an annotated image using Labellmg tool
Source: Infosys PoC 2018
Original image on Labellmg Tool
Annotated image
External Document © 2019 Infosys Limited
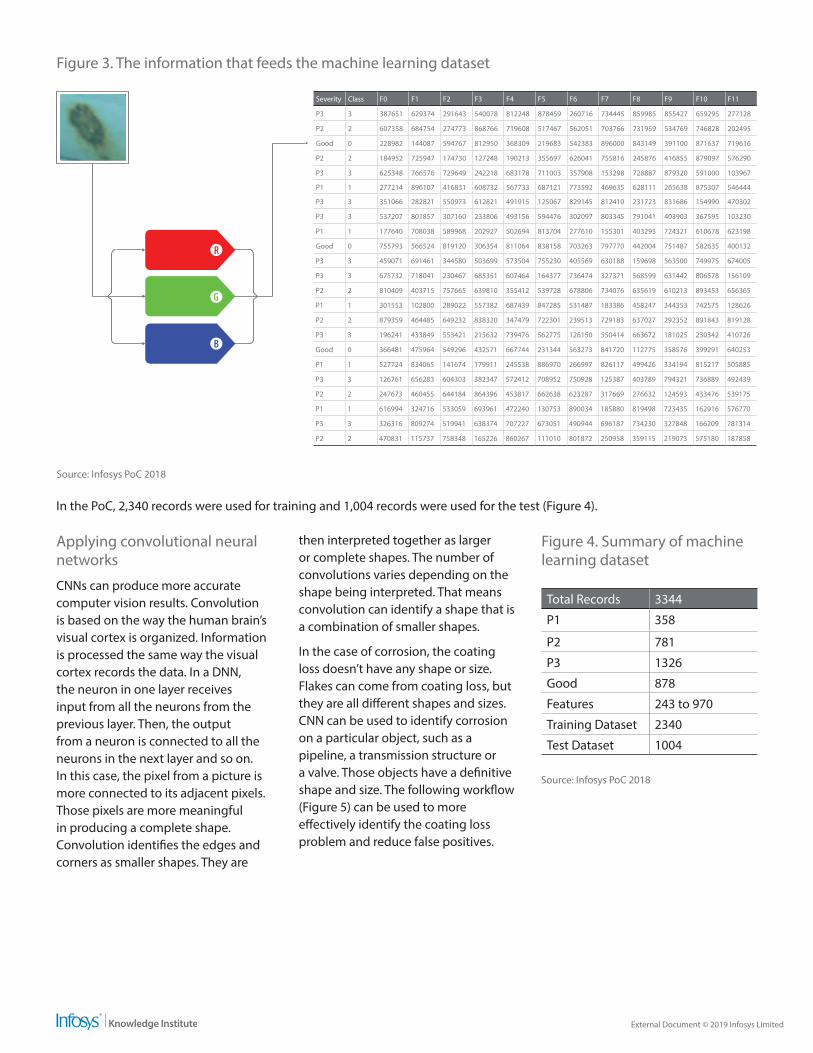
Figure 3. The information that feeds the machine learning dataset
Source: Infosys PoC 2018
In the PoC, 2,340 records were used for training and 1,004 records were used for the test (Figure 4).
Total Records 3344
P1 358
P2 781
P3 1326
Good 878
Features 243 to 970
Training Dataset 2340
Test Dataset 1004
Source: Infosys PoC 2018
Applying convolutional neural networks
CNNs can produce more accurate computer vision results. Convolution is based on the way the human brain’s visual cortex is organized. Information is processed the same way the visual cortex records the data. In a DNN, the neuron in one layer receives input from all the neurons from the previous layer. Then, the output from a neuron is connected to all the neurons in the next layer and so on. In this case, the pixel from a picture is more connected to its adjacent pixels. Those pixels are more meaningful in producing a complete shape. Convolution identifies the edges and corners as smaller shapes. They are
Severity Class F0 F1 F2 F3 F4 F5 F6 F7 F8 F9 F10 F11
P3 3 387651 629374 291643 540078 812248 878459 260716 734445 859985 855427 659295 277128
P2 2 607358 684754 274773 868766 719608 517467 562051 703766 731959 534769 746828 202495
Good 0 228982 144087 594767 812950 368309 219683 542383 896000 843149 391100 871637 719616
P2 2 184952 725947 174730 127248 190213 355697 626041 755816 245876 416855 879097 576290
P3 3 625348 766576 729649 242218 683178 711003 357908 153298 728887 879320 591000 103967
P1 1 277214 896107 416831 608732 567733 687121 773592 469635 628111 265638 875307 546444
P3 3 351066 282821 550973 612821 491915 125067 829145 812410 231723 831686 154990 470302
P3 3 537207 801857 307160 233806 493156 594476 302097 803345 791041 403903 367595 103230
P1 1 177640 708038 589968 202927 502694 813704 277610 155301 403293 724321 610678 623198
Good 0 755793 566524 819120 306354 811064 838158 703263 797770 442004 751487 582635 400132
P3 3 459071 691461 344580 503699 573504 755230 405569 630188 159698 563500 749975 674005
P3 3 675732 718041 230467 685351 607464 164377 736474 327371 568599 631442 806578 156109
P2 2 810409 403715 757665 639810 355412 539728 678806 734076 635619 610213 893453 656365
P1 1 301553 102800 289022 557382 687439 847285 531487 183386 458247 344353 742575 128626
P2 2 879359 464485 649232 838320 347479 722301 239513 729183 637027 292352 891843 819128
P3 3 196241 433849 553421 215632 739476 562775 126150 550414 663672 181025 230342 410726
Good 0 366481 475964 549296 432571 667744 231344 563273 841720 112775 358576 399291 640253
P1 1 527724 834065 141674 179911 245538 886970 266997 826117 499426 334194 815217 505885
P3 3 126761 656283 604303 382347 572412 708952 750928 125387 403789 794321 736889 492439
P2 2 247673 460455 644184 864396 453817 662638 623287 317669 276632 124593 433476 539175
P1 1 616994 324716 533059 693961 472240 130753 890034 185880 819498 723435 162916 576770
P3 3 326316 809274 519941 638374 707227 673051 490944 696187 734230 327848 166209 781314
P2 2 470831 115737 758348 165226 860267 111010 801872 250958 359115 219073 575180 187858
then interpreted together as larger or complete shapes. The number of convolutions varies depending on the shape being interpreted. That means convolution can identify a shape that is a combination of smaller shapes.
In the case of corrosion, the coating loss doesn’t have any shape or size. Flakes can come from coating loss, but they are all different shapes and sizes. CNN can be used to identify corrosion on a particular object, such as a pipeline, a transmission structure or a valve. Those objects have a definitive shape and size. The following workflow (Figure 5) can be used to more effectively identify the coating loss problem and reduce false positives.
Figure 4. Summary of machine learning dataset

External Document © 2019 Infosys Limited
Why are false positives so significant?
Facilities exposed to harsh environments and shaded areas can have several tones of red. Those red backgrounds can be mistaken for corrosion. False positives can result in wasted man hours attempting to repair equipment that is not corroded and can lead to mistrust of the system and a return to the status quo for maintenance and repair. The solution is to classify images through color segmentation.
Coating loss or rust exposure is generally a reddish color. The more the red matte tone is present on the rust, the more severe the coating loss. CNN can help avoid that problem by extracting and analyzing only the significant objects in the image.
The CNN to DNN workflow model can potentially reduce false positives. This technique has produced impressive results, the model identified 90% of coating loss and graded with 70% accuracy. The models were trained using DNNs with varying hyper
parameters. There were some false positives, which can be reduced by using a combined CNN and DNN workflow approach. The models were developed based on 3,500 base annotations. Accuracy will improve over time as more annotations are added.
Figure 5. Convolutional Neural Network
Conventionalneural
networkengine
Dense neuralnetworkengine
Classi�cationaccuracy oncoating loss
Data feed
Source: Infosys PoC 2018
Figure 6. How computer vision sees corrosion
Source: Infosys PoC 2018

External Document © 2019 Infosys Limited
The next step
By combining all the techniques described here, Infosys proved that computer vision could effectively identify corrosion in a standardized manner (Figure 6). The model will need to be trained with additional images every few months, but the people using it won’t need much training at all. Users just have to be able to use a digital camera. There’s a simple user
interface to upload pictures. After that, the system will automatically do the rest.
A drone can also be programmed to fly over the facility following a specific flight path and taking pictures along the way. In addition to detecting corrosion, this AI could be used to track other things such as algae on
top of a water reservoir or inspect pipelines that are hundreds or even thousands of miles long. This PoC is just a glimpse at the future of computer vision and the many ways it can improve safety at companies and protect the environment around the world.
Author
Rajesh RajendranPrincipal Consultant – [email protected]
Christine CalhounSenior Consultant – Infosys Knowledge [email protected]

About Infosys Knowledge InstituteThe Infosys Knowledge Institute helps industry leaders develop a deeper understanding of business and technology trends through compelling thought leadership. Our researchers and subject matter experts provide a fact base that aids decision making on critical business and technology issues.To view our research, visit Infosys Knowledge Institute at infosys.com/IKI
© 2019 Infosys Limited, Bengaluru, India. All Rights Reserved. Infosys believes the information in this document is accurate as of its publication date; such information is subject to change without notice. Infosys acknowledges the proprietary rights of other companies to the trademarks, product names and such other intellectual property rights mentioned in this document. Except as expressly permitted, neither this documentation nor any part of it may be reproduced, stored in a retrieval system, or transmitted in any form or by any means, electronic, mechanical, printing, photocopying, recording or otherwise, without the prior permission of Infosys Limited and/or any named intellectual property rights holders under this document.
Stay ConnectedInfosys.com | NYSE : INFY
For more information, contact [email protected]