Embed Size (px)
Citation preview
Using clusters in Sunyaev-Zel’dovich effect plus x-ray surveys as an ensembleof rulers to constrain cosmology
Satej Khedekar* and Subhabrata Majumdar†
Tata Institute of Fundamental Research, Homi Bhabha Road, Colaba, Mumbai – 400076, India(Received 28 April 2010; published 15 October 2010)
Ongoing and upcoming surveys in x rays and SZE are expected to jointly detect many clusters due to
the large overlap in sky coverage. We show that these clusters can be used as an ensemble of rulers to
estimate the angular diameter distance, dAðzÞ. This comes at no extra observational cost, as these clusters
form a subset of a much larger sample, assembled to build cluster number counts, dNdz . On using this dAðzÞthe dark energy constraints can be improved by factors of 1.5–4, over those from just dN
dz . Even in the
presence of a mass follow-up of 100 clusters (done for mass calibration), the dark energy constraints can
be further tightened by factors of 2–3 . Adding dAðzÞ from clusters is similar to adding dLðzÞ, from the
SNe observations; for eg., dNdz (from ACT/SPT) plus dAðzÞ is comparable to dNdz plus dLðzÞ in constraining
m and 8.
DOI: 10.1103/PhysRevD.82.081301 PACS numbers: 95.36.+x, 98.62.Py, 98.65.Cw, 98.80.k
I. INTRODUCTION
Large cluster surveys like the SPT, ACT, Planck, andeROSITA promise to detect from a thousand to a fewhundred thousand clusters in the coming decade. Theabundance and redshift distribution dN
dz of these clusters
are important probes to understanding the nature of darkenergy as well as to constrain other cosmological pa-rameters like m and 8 [1–5]. To deduce a cosmologyfrom these dN
dz observations, one requires a precise knowl-
edge of the limiting mass of the survey as a function ofredshift. One frequently uses proxy observables such asx-ray surface brightness and temperature [6], Sunyaev-Zel’dovich effect (SZE) decrement [7,8], cluster richness[9,10], and lensing [11,12] for the masses of clusters,related through simple power-law scaling relations.These scaling parameters are highly degenerate withthe cosmological parameters, and breaking this degener-acy is crucial to obtaining tight constraints on cosmol-ogy. This may be realized, for example, through theso-called ‘‘self-calibration’’ techniques [2,13,14]. Otherapproaches include an ‘‘unbiased’’ mass follow-up of asubsample of the survey clusters [14,15] or better theo-retical modeling of clusters to predict the form of mass-observable scaling relation [16–18]. One can also try tooptimize the cluster surveys so as to get the best possiblesurvey yield [19,20].
Measurements of the angular diameter distance, dA, atthe redshift of the cluster using a combination of SZE andx-ray observations have been routinely made over the last30 years. The results have suffered, in the past, fromvarious systematics, and reliable estimates have onlybeen achieved recently with analysis of statisticallysignificant samples of galaxy clusters [21,22]. These new
observations have demonstrated the power of usingclusters to measure ‘‘dA vs z’’ and use it to study theexpansion history of our Universe [23]. However, theserecent progresses have been done with targeted observa-tions. Because targeted observations are costly, this ap-proach limits the size of the sample of& 100. In this paper,we show that one can build up an ‘‘ensemble’’ of dAðzÞ bypicking a subsample of clusters discovered in both x-rayand SZE surveys with overlapping areas and redshift cov-erage. Because the surveys are already geared towardsgetting clusters for dN
dz , we get the dAðzÞ without any extra
targeted observations. The addition of dAðzÞ to dNdz helps in
tightening cosmological constraints, especially on the darkenergy equation of state. This is not surprising, since usingdAðzÞ from clusters is akin to adding dLðzÞ informationfrom supernovae (SNe) observations.The rest of this paper is organized as follows. In
Sec. II, we briefly discuss cluster number counts andthe procedure to estimate dAðzÞ from SZEþ x-ray ob-servations; in Sec. III we describe the surveys, the choiceof cosmological and cluster models, and also summarizeour methodology; in Sec. IV, we forecast constraints oncosmological parameters; and finally, we conclude inSec. V.
II. PRELIMINARIES
The redshift distribution of detectable clusters isgiven by
dN
dzðzÞ ¼
dV
dzdðzÞ
Z 1
0
dnðM; zÞdM
fðM; zÞdM; (1)
where dV=dzd is the comoving volume element, fðM; zÞis the cluster selection function incorporating a logarithmicscatter in the luminosity to mass conversion, and dn
dM is the
halo mass function taken from simulations [24]. For an*[email protected]†[email protected]
PHYSICAL REVIEW D 82, 081301(R) (2010)
RAPID COMMUNICATIONS
1550-7998=2010=82(8)=081301(5) 081301-1 2010 The American Physical Society
x-ray/SZE survey the limiting mass MlimðzÞ is found fromthe flux limit, flim, of the survey. For x-ray survey, weadopt luminosity-mass relations from Vikhlinin et al. [25]
given by LX ¼ AXðM500
1015ÞXE1:85ðzÞð h
0:72Þ0:39ð1þ zÞX . For
an SZE survey, our SZE flux-mass relation is Yd2A ¼ASZEð M200
3:141018ÞszE2=3ðzÞð1þ zÞsz , where Y is the inte-
grated SZE distortion and dAðzÞ is in Mpc. The parametersX=SZE mimic any ‘‘nonstandard’’ evolution of clusterscaling relations [15]. For the x-ray survey, our fiducialparameter values are logðAXÞ ¼ 4:25, X ¼ 1:61,and X ¼ 0 with a log-normal scatter of 0.246; whilethe corresponding values for the SZE scaling relation arelogðASZEÞ ¼ 1:75, SZE ¼ 1:61, SZE ¼ 0 with a log-normal scatter of 0.2.
The distance dAðzÞ, of a cluster observed at a redshift zdepends on the expansion history of the Universe as
dAðzÞ ¼ cð1þzÞ
Rz0
dz0Hðz0Þ where HðzÞ is the Hubble expansion.
The seminal paper by [26] defines the procedure to mea-sure dAðzÞ from observations of clusters in SZEþ x-ray.This depends on ‘‘assuming’’ a profile for the Intraclustermedium, ICM, typically taken to be an isothermal
-profile [27] with neðrÞ ¼ ne0ð1þ ðr=rcÞ2Þ3=2, where
ne is the electron number density, r is the radius from thecluster’s center, rc is the core radius, and is a power-lawindex. Note, that one can always use a more realistic ICMmodel with better data. For example, one can fit a tem-perature profile to improve upon the errors. The x-raybrightness, SX / R
n2eeedl, whereee is the x-ray coolingfunction of the gas; while for SZE, T / R
neTedl, whereTe is the ICM temperature. Eliminating ne gives the angu-
lar diameter distance dA / T2CMBee
SX0T2ec
; see Birkinshaw [28]
for more details.
III. ESTIMATING CONSTRAINTSFROM FUTURE SURVEYS
A. Fiducial cosmology, priors, and survey descriptions
We adopt our fiducial cosmology from the WMAP7-year results (Table 6 of [29]) along with the followingpriors: ðns;b;hÞ ¼ ð0:015; 0:0037; 0:028Þ. For sim-plicity, we choose a flat universe since for an open wCDMmodel, WMAP7þ BAOþ H0 tightly constrains tot 0:007. With a small number of clusters, as suggested byrecent SZ observations [30], just dN
dz data would not be
sufficient to break the cosmology-cluster physics degener-acies. We therefore put priors on the scaling parametersA ¼ 0:003 and ¼ 0:015 motivated by recent obser-vations [31]. In addition, we put a weak prior of ¼ 0:2in all the cases.
We consider the following surveys with overlapping skycoverage-
(1) ACT/SPT: We model the ongoing ACT/SPT surveyas a 4000 deg2 with a flim of 75 mJy (at 150 GHz),so as to give & 1000 clusters.
(2) Planck: Ongoing all sky SZE survey. We take flim tobe 300 mJy (at 353 GHz) which returns & 2000clusters in 32 000 deg2. The higher flux limitmeans that Planck would detect only massive lowz clusters.
(3) eROSITA: Upcoming full sky x-ray survey.We assume a [0.5–2.0 keV] band flim ¼4 1014 erg cm2 s1 which gives us & 1 105
clusters for 32 000 deg2. All clusters detected byboth Planck as well as ACT/SPT are expected to bedetected by eROSITA as it has a much smallerMlim
[see Fig. 1(a)].
B. Methodology
The redshift distribution of clusters is obtained byusing the cluster scaling relations to convert flux to thecorresponding lowest observable cluster mass MlimðzÞ.Figure 1(a) shows the Mlim for some of the surveys thatwe have considered. We further place a lower cutoff of1:3 1014h1MðM500Þ on Mlim and a redshift cutoff of0.1 [32]. The dN
dz (z ¼ 0:1) likelihoods are computed
using Cash C statistics.We generate the mock dA catalog as follows. For a
cluster to be visible in both x-ray and SZE surveys, itsmass must lie above the highest of the MlimðzÞ fromeither of the surveys. To estimate dA, one also needsat least a single isothermal temperature measurement ofthe ICM, which is possible for 10 times the detectableflux; for this we calculate the corresponding higher Mlim.Next, to fit a model, we also require that the clustersbe well resolved; i.e. be larger than a certain minimumangular size, so as to estimate its core radius c. This isfulfilled by the condition that c be at least Nbeam timesthe minimum resolution of the survey (16’’ foreROSITA) [33]. We convert this to isophotal size RI ¼IdA and use the scaling relation between cluster massand its size [34] to enforce this constraint. Figure 1(a)shows all the limiting masses described above as afunction of redshift. The redshift dA catalog is con-structed from [31] by integrating over the highest ofthese MlimðzÞ’s in the plot. The dAðzÞ from these clustersare distributed randomly with a Gaussian scatterof 25% about the dAðzÞ from fiducial cosmology [seeFig. 1(b)]. Such catalogs are created for overlaps of SZEand x-ray surveys like ACT=SPTþ eROSITA andPlanckþ eROSITA for Nbeam’s of 2, 3, and 4. A highervalue of Nbeam implies a selection of only the largerclusters; see Fig. 1(a). The dA catalog is analyzed usinga chi-square statistic for the likelihoods.Finally, we do a joint analysis of the likelihoods from
dAðzÞ and those from number counts. To forecast theconstraints from cluster surveys we use MCMCsimulations in the parameter space of 6 cosmologicalparameters—m, w0, wa, h, ns, and b and 3 scalingparameters—A, , and .
SATEJ KHEDEKAR AND SUBHABRATA MAJUMDAR PHYSICAL REVIEW D 82, 081301(R) (2010)
RAPID COMMUNICATIONS
081301-2
IV. RESULTS AND DISCUSSIONS
Our main results are summarized in Tables I and II,which list the 1- uncertainties on the cosmologicalparameters. The numbers in bold highlight the improve-ment in the dark energy constraints on adding dAðzÞ to dN
dz .
The benefits of having additional information from dAðzÞare also illustrated in Figs. 2 and 3. In all cases, we considereROSITA as the x-ray survey and either Planck or ACT/SPT as the SZE survey.
A. Constraints from dAðzÞ added to ACT/SPT dNdz
In Fig. 2, we see a significant improvement in cosmo-logical constraints from ACT/SPT, when dA for Nbeam ¼ 2is added to dN
dz . As seen in Table I the 1- region in the dark
energy plane w0-wa shrinks by factors of 3.8, 1.7 and 1.6
when the dAðzÞ data sets with Nbeam ¼ 2, 3, and 4 areadded to dN
dz ; while in the m-w0 plane it decreases by
factors of 4.1, 1.8, and 1.1. The corresponding marginal-ized constraints on a single equation of state w improvesfrom 0.20 to 0.15 and 0.18 for Nbeam ¼ 2 and 3, respec-tively, when dAðzÞ is added to dN
dz . There is not much
improvement with the smallest data set ofNbeam ¼ 4, sincethe dAðzÞ sample has only 25 clusters now.Since SNe Ia are also used to measure distances [dLðzÞ],
we compare our results with the benefits of adding theUnion 2 compilation of the Supernova Cosmology Project(SCP) data set in column 6. As expected, with the SNe dataof a similar size but with much smaller errors (7%–10%),we get tighter constraints on dark energy with w0 ¼ 0:15and wa ¼ 1:0. Column 7 of the same table lists the effectof using CMB constraints from the WMAP7 results on
TABLE I. Comparison of 1- parameter constraints from ACT/SPT dNdz and its overlap with eROSITA. Ncl is the number of clusters
for which dAðzÞ is measured and NSNe is the number of SNe. Columns 3–5 list improvements in the constraints obtained from ACT/SPT dN
dz when dAðzÞ from various data sets are added. Column 6 shows the constraints when CMB priors are imposed on m and 8
from the WMAP7 results. The last two columns show the constraints when there are no priors on the scaling parameters A and , but amass follow-up of 97 clusters is added with (randomly distributed) errors on the masses of 15%–50% and 30%–100% for the follow-ups 1 and 2, respectively.
Parameter only dNdz
dNdz þ dA
dNdz þ dA
dNdz þ dA
dNdz þ SNe dN
dz þ CMB priors dNdz þ follow 1 dN
dz þ follow 2Ncl=NSNe 995 578 118 25 557 – 97 97
(Nbeam ¼ 2) (Nbeam ¼ 3) (Nbeam ¼ 4) on m and 8 M 15–50% M 30–100%
m 0.067 0.036 0.053 0.052 0.029 0.018 0.073 0.090
w0 0:79 0:36 0:57 0:63 0.15 0.40 0.81 0.80
wa 3:5 2:0 2:8 2:7 1.0 2.0 3.4 3.3
8 0.12 0.10 0.10 0.11 0.10 0.05 0.06 0.07
0.2 0.4 0.6 0.8 1 1.210
13
1014
1015
1016
z
M20
0 [Mso
l]
eROSITA detection
Planck
SPT
eROSITA temp.
Nbeam
=2
Nbeam
=3
Nbeam
=4
(a)
.1 .2 .3 .4 .5 .6 .7 .80
500
1000
1500
2000
2500
z
d A [M
pc]
(b)
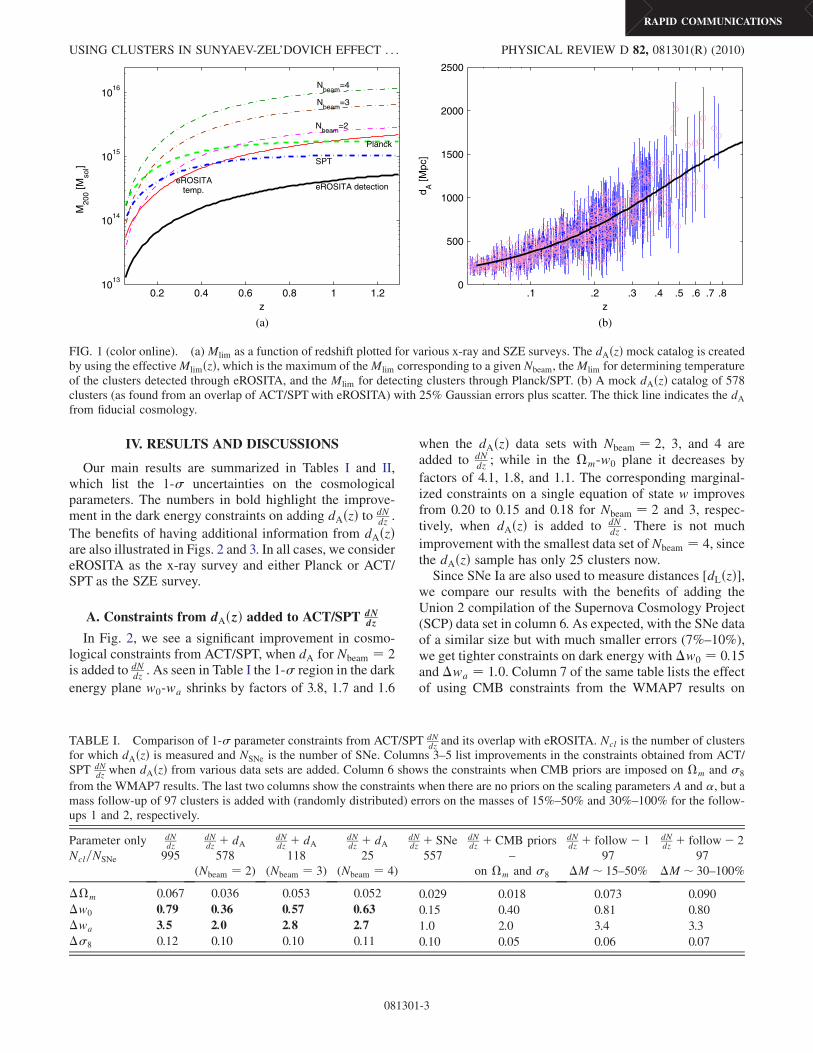
FIG. 1 (color online). (a)Mlim as a function of redshift plotted for various x-ray and SZE surveys. The dAðzÞ mock catalog is createdby using the effectiveMlimðzÞ, which is the maximum of theMlim corresponding to a givenNbeam, theMlim for determining temperatureof the clusters detected through eROSITA, and the Mlim for detecting clusters through Planck/SPT. (b) A mock dAðzÞ catalog of 578clusters (as found from an overlap of ACT/SPTwith eROSITA) with 25% Gaussian errors plus scatter. The thick line indicates the dAfrom fiducial cosmology.
USING CLUSTERS IN SUNYAEV-ZEL’DOVICH EFFECT . . . PHYSICAL REVIEW D 82, 081301(R) (2010)
RAPID COMMUNICATIONS
081301-3
mð¼ 0:019Þ and8ð¼ 0:059Þwith the dNdz data from ACT/
SPT to further improve the constraints on dark energy withw0 ¼ 0:4 and wa ¼ 2:0. These constraints are verysimilar to the ones through dAðzÞ for Nbeam ¼ 2; comparecolumns 3 and 7 in Table I.
Next, we compare our constraints with those that wouldbe obtained from dedicated follow-up observations ofcluster masses requiring detailed x-ray, SZE, or galaxyspectroscopic observations [15]. Adding a mass follow-up to dN
dz constrains the cluster scaling relation and is similar
to putting priors on the scaling parameters. We build twomock catalogs of 97 clusters each, one with errors between
15%–50% and the other with 30%–100% errors. We findthat the constraints from both the mass follow-ups (nowwithout priors on the scaling parameters A and ) are verysimilar to those obtained using priors of the scaling rela-tions; compare column 2 with 8 and 9 in Table I. This alsoimplies that the addition of dAðzÞ can further improveconstraints even when a mass follow-up is done.Compare columns 3–5 with 8 and 9.
B. Constraints from dAðzÞ added to Planck dNdz
The eROSITA survey will detect all the clusters seen byPlanck and hence, together, these surveys will yield a largenumber of candidates for estimating dAðzÞ. In our mockcatalog the number of cluster data sets for which dA can bemeasured, for this combination, are found to contain 1829,951, and 202 halos for Nbeam ¼ 2, 3, and 4, respectively.However, in contrast with ACT/SPT, Planck would be ableto detect only the most massive clusters due to a lowerresolution and mostly the ones occurring at lower redshifts.There would be very few clusters at higher redshifts (0:6), and hence we consider the constraints only on aconstant equation of state w. Table II lists the results forthe improvement in the constraints from dN
dz when dAðzÞfrom an overlap of Planck and eROSITA are added. We seehere that w decreases by factors of 1.7, 1.3, and 1.1 withthe addition of dAðzÞ data sets with Nbeam ¼ 2, 3, and 4,respectively.
V. CONCLUSIONS
We show that just using number count observations fromthe ongoing SZE galaxy cluster surveys like ACT/SPT
0.22 0.24 0.26 0.28 0.3 0.32
−1.3
−1.2
−1.1
−1
−0.9
−0.8
−0.7
Ωm
w
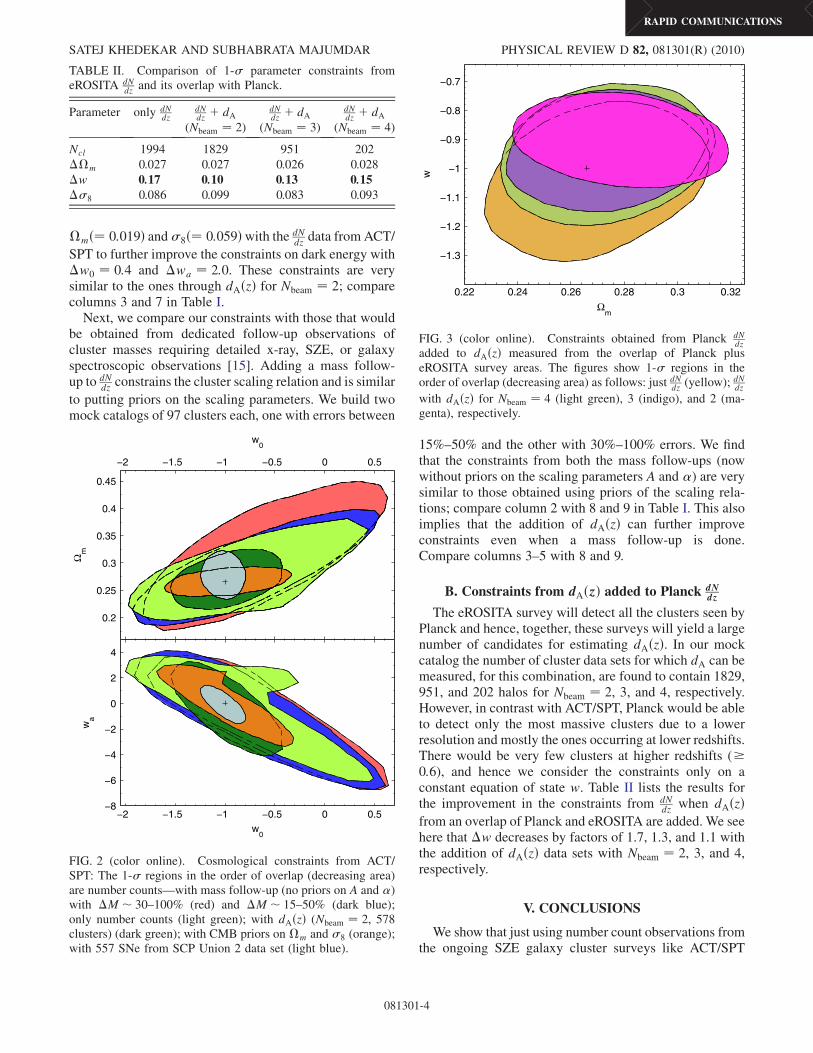
FIG. 3 (color online). Constraints obtained from Planck dNdz
added to dAðzÞ measured from the overlap of Planck pluseROSITA survey areas. The figures show 1- regions in theorder of overlap (decreasing area) as follows: just dNdz (yellow);
dNdz
with dAðzÞ for Nbeam ¼ 4 (light green), 3 (indigo), and 2 (ma-genta), respectively.
TABLE II. Comparison of 1- parameter constraints fromeROSITA dN
dz and its overlap with Planck.
Parameter only dNdz
dNdz þ dA
dNdz þ dA
dNdz þ dA
(Nbeam ¼ 2) (Nbeam ¼ 3) (Nbeam ¼ 4)
Ncl 1994 1829 951 202
m 0.027 0.027 0.026 0.028
w 0:17 0:10 0:13 0:158 0.086 0.099 0.083 0.093
−2 −1.5 −1 −0.5 0 0.5
0.2
0.25
0.3
0.35
0.4
0.45
Ωm
w0
−2 −1.5 −1 −0.5 0 0.5−8
−6
−4
−2
0
2
4
w0
wa
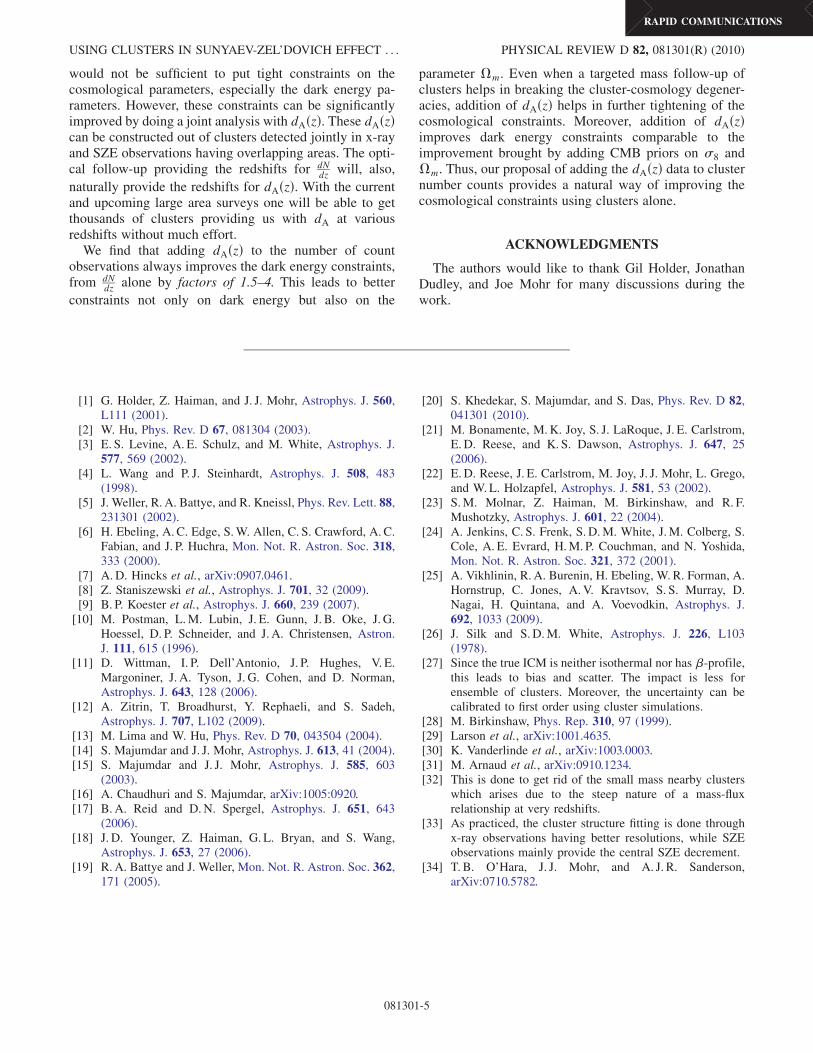
FIG. 2 (color online). Cosmological constraints from ACT/SPT: The 1- regions in the order of overlap (decreasing area)are number counts—with mass follow-up (no priors on A and )with M 30–100% (red) and M 15–50% (dark blue);only number counts (light green); with dAðzÞ (Nbeam ¼ 2, 578clusters) (dark green); with CMB priors on m and 8 (orange);with 557 SNe from SCP Union 2 data set (light blue).
SATEJ KHEDEKAR AND SUBHABRATA MAJUMDAR PHYSICAL REVIEW D 82, 081301(R) (2010)
RAPID COMMUNICATIONS
081301-4
would not be sufficient to put tight constraints on thecosmological parameters, especially the dark energy pa-rameters. However, these constraints can be significantlyimproved by doing a joint analysis with dAðzÞ. These dAðzÞcan be constructed out of clusters detected jointly in x-rayand SZE observations having overlapping areas. The opti-cal follow-up providing the redshifts for dN
dz will, also,
naturally provide the redshifts for dAðzÞ. With the currentand upcoming large area surveys one will be able to getthousands of clusters providing us with dA at variousredshifts without much effort.
We find that adding dAðzÞ to the number of countobservations always improves the dark energy constraints,from dN
dz alone by factors of 1.5–4. This leads to better
constraints not only on dark energy but also on the
parameter m. Even when a targeted mass follow-up ofclusters helps in breaking the cluster-cosmology degener-acies, addition of dAðzÞ helps in further tightening of thecosmological constraints. Moreover, addition of dAðzÞimproves dark energy constraints comparable to theimprovement brought by adding CMB priors on 8 andm. Thus, our proposal of adding the dAðzÞ data to clusternumber counts provides a natural way of improving thecosmological constraints using clusters alone.
ACKNOWLEDGMENTS
The authors would like to thank Gil Holder, JonathanDudley, and Joe Mohr for many discussions during thework.
[1] G. Holder, Z. Haiman, and J. J. Mohr, Astrophys. J. 560,L111 (2001).
[2] W. Hu, Phys. Rev. D 67, 081304 (2003).[3] E. S. Levine, A. E. Schulz, and M. White, Astrophys. J.
577, 569 (2002).[4] L. Wang and P. J. Steinhardt, Astrophys. J. 508, 483
(1998).[5] J. Weller, R. A. Battye, and R. Kneissl, Phys. Rev. Lett. 88,
231301 (2002).[6] H. Ebeling, A. C. Edge, S.W. Allen, C. S. Crawford, A. C.
Fabian, and J. P. Huchra, Mon. Not. R. Astron. Soc. 318,333 (2000).
[7] A. D. Hincks et al., arXiv:0907.0461.[8] Z. Staniszewski et al., Astrophys. J. 701, 32 (2009).[9] B. P. Koester et al., Astrophys. J. 660, 239 (2007).[10] M. Postman, L.M. Lubin, J. E. Gunn, J. B. Oke, J. G.
Hoessel, D. P. Schneider, and J. A. Christensen, Astron.J. 111, 615 (1996).
[11] D. Wittman, I. P. Dell’Antonio, J. P. Hughes, V. E.Margoniner, J. A. Tyson, J. G. Cohen, and D. Norman,Astrophys. J. 643, 128 (2006).
[12] A. Zitrin, T. Broadhurst, Y. Rephaeli, and S. Sadeh,Astrophys. J. 707, L102 (2009).
[13] M. Lima and W. Hu, Phys. Rev. D 70, 043504 (2004).[14] S. Majumdar and J. J. Mohr, Astrophys. J. 613, 41 (2004).[15] S. Majumdar and J. J. Mohr, Astrophys. J. 585, 603
(2003).[16] A. Chaudhuri and S. Majumdar, arXiv:1005:0920.[17] B. A. Reid and D.N. Spergel, Astrophys. J. 651, 643
(2006).[18] J. D. Younger, Z. Haiman, G. L. Bryan, and S. Wang,
Astrophys. J. 653, 27 (2006).[19] R. A. Battye and J. Weller, Mon. Not. R. Astron. Soc. 362,
171 (2005).
[20] S. Khedekar, S. Majumdar, and S. Das, Phys. Rev. D 82,041301 (2010).
[21] M. Bonamente, M.K. Joy, S. J. LaRoque, J. E. Carlstrom,E. D. Reese, and K. S. Dawson, Astrophys. J. 647, 25(2006).
[22] E. D. Reese, J. E. Carlstrom, M. Joy, J. J. Mohr, L. Grego,and W.L. Holzapfel, Astrophys. J. 581, 53 (2002).
[23] S.M. Molnar, Z. Haiman, M. Birkinshaw, and R. F.Mushotzky, Astrophys. J. 601, 22 (2004).
[24] A. Jenkins, C. S. Frenk, S. D.M. White, J.M. Colberg, S.Cole, A. E. Evrard, H.M. P. Couchman, and N. Yoshida,Mon. Not. R. Astron. Soc. 321, 372 (2001).
[25] A. Vikhlinin, R. A. Burenin, H. Ebeling, W. R. Forman, A.Hornstrup, C. Jones, A.V. Kravtsov, S. S. Murray, D.Nagai, H. Quintana, and A. Voevodkin, Astrophys. J.692, 1033 (2009).
[26] J. Silk and S.D.M. White, Astrophys. J. 226, L103(1978).
[27] Since the true ICM is neither isothermal nor has -profile,this leads to bias and scatter. The impact is less forensemble of clusters. Moreover, the uncertainty can becalibrated to first order using cluster simulations.
[28] M. Birkinshaw, Phys. Rep. 310, 97 (1999).[29] Larson et al., arXiv:1001.4635.[30] K. Vanderlinde et al., arXiv:1003.0003.[31] M. Arnaud et al., arXiv:0910.1234.[32] This is done to get rid of the small mass nearby clusters
which arises due to the steep nature of a mass-fluxrelationship at very redshifts.
[33] As practiced, the cluster structure fitting is done throughx-ray observations having better resolutions, while SZEobservations mainly provide the central SZE decrement.
[34] T. B. O’Hara, J. J. Mohr, and A. J. R. Sanderson,arXiv:0710.5782.
USING CLUSTERS IN SUNYAEV-ZEL’DOVICH EFFECT . . . PHYSICAL REVIEW D 82, 081301(R) (2010)
RAPID COMMUNICATIONS
081301-5


![arXiv:0801.1039v1 [astro-ph] 7 Jan 2008 fileThe idea of gravitational heating of the intergalactic gas was first suggested by Sunyaev & Zel’dovich (1972) and subsequentlydeveloped](https://img.pdfslide.us/doc/110x75/5cdf0c6288c993d22e8b5947/arxiv08011039v1-astro-ph-7-jan-2008-idea-of-gravitational-heating-of-the-intergalactic.jpg)