Embed Size (px)
Citation preview

The Qualitative Report The Qualitative Report
Volume 20 Number 7 How To Article 9
7-20-2015
Using Clustering as a Tool: Mixed Methods in Qualitative Data Using Clustering as a Tool: Mixed Methods in Qualitative Data
Analysis Analysis
Laura Macia University of Pittsburgh, [email protected]
Follow this and additional works at: https://nsuworks.nova.edu/tqr
Part of the Quantitative, Qualitative, Comparative, and Historical Methodologies Commons, and the
Social Statistics Commons
Recommended APA Citation Recommended APA Citation Macia, L. (2015). Using Clustering as a Tool: Mixed Methods in Qualitative Data Analysis. The Qualitative Report, 20(7), 1083-1094. https://doi.org/10.46743/2160-3715/2015.2201
This How To Article is brought to you for free and open access by the The Qualitative Report at NSUWorks. It has been accepted for inclusion in The Qualitative Report by an authorized administrator of NSUWorks. For more information, please contact [email protected].

Using Clustering as a Tool: Mixed Methods in Qualitative Data Analysis Using Clustering as a Tool: Mixed Methods in Qualitative Data Analysis
Abstract Abstract In this article I discuss cluster analysis as an exploratory tool to support the identification of associations within qualitative data. While not appropriate for all qualitative projects, cluster analysis can be particularly helpful in identifying patterns where numerous cases are studied. I use as illustration a research project on Latino grievances to offer a detailed explanation of the main steps in cluster analysis, providing specific considerations for its use with qualitative data. I specifically describe the issues of data transformation, the choice of clustering methods and similarity measures, the identification of a cluster solution, and the interpretation of the data in a qualitative context.
Keywords Keywords Cluster Analysis, Qualitative Analysis, Data Exploration, Mixed Methods
Creative Commons License Creative Commons License
This work is licensed under a Creative Commons Attribution-Noncommercial-Share Alike 4.0 License.
This how to article is available in The Qualitative Report: https://nsuworks.nova.edu/tqr/vol20/iss7/9

The Qualitative Report 2015 Volume 20, Number 7, How To Article 3, 1083-1094 http://www.nova.edu/ssss/QR/QR20/7/macia3.pdf
Using Clustering as a Tool: Mixed Methods in Qualitative Data Analysis
Laura Macia
University of Pittsburgh, Pittsburgh, Pennsylvania, USA In this article I discuss cluster analysis as an exploratory tool to support the identification of associations within qualitative data. While not appropriate for all qualitative projects, cluster analysis can be particularly helpful in identifying patterns where numerous cases are studied. I use as illustration a research project on Latino grievances to offer a detailed explanation of the main steps in cluster analysis, providing specific considerations for its use with qualitative data. I specifically describe the issues of data transformation, the choice of clustering methods and similarity measures, the identification of a cluster solution, and the interpretation of the data in a qualitative context. Keywords: Cluster Analysis, Qualitative Analysis, Data Exploration, Mixed Methods
Tools and Techniques for the Analysis of Qualitative Data Qualitative research produces a great volume of data that can be challenging, and at times overwhelming, to analyze. While literature on qualitative data collection methods and theoretical approaches for their analysis is increasingly rich, a gap still remains on works that offer detailed accounts on data analysis techniques (Attride-Stirling, 2001; Fielding, 2005). This gap is maintained in part by the recognition that different theoretical approaches demand different analytic approaches to qualitative research, and also by the still existent guarded acceptance (and in some cases rejection) of tools, particularly computer-based ones or those traditionally used in quantitative approaches, that although providing an appearance of clarity can misconstrue qualitative research findings (Gilbert, Jackson, & di Gregorio, 2014; James, 2013). However, quantitative analytical tools can be helpful in qualitative analysis, as long as there is clarity on what can and cannot be done with them. Literature that details the use of specific mixed techniques in qualitative analysis is important to avoid misusing them, or misrepresenting their findings. Additionally, clear explanations provide transparency to qualitative data analysis processes, which are sometimes regarded as obscure and lacking trustworthiness by scholars and practitioners not fully familiar with qualitative methodologies (Barusch, Gringeri, & George, 2011; Miller & Crabtree, 1994). Cluster Analysis in Qualitative Research In this article I discuss cluster analysis as an exploratory tool to support the identification of associations within qualitative data. While not appropriate for all qualitative projects, cluster analysis can be helpful in identifying patterns where numerous cases are studied. As the number of elements and facets considered for each case increase, so does the complexity of finding associations between them. When this happens, even the analytic tools provided for this purpose by commonly used software tools for qualitative analysis (e.g., coding co-occurrences, matrixes or Boolean searches) can fall short, with the related risk of reaching conclusions that overly reflect the researcher’s preconceptions. Some qualitative analysis software (NVivo, QDA Miner, ANTRHOPAC) have included cluster analysis tools,

1084 The Qualitative Report 2015
mainly as text-mining tools (Silver & Lewins, 2014). However, its use remains limited or underreported, perhaps due to their limitations in the number of items allowed (ANTHROPAC), the techniques and measures available (NVivo), or the array of data used to determine the formation of clusters. The use of cluster analysis with qualitative data has already been discussed and documented (Guest & McLellan, 2003; MacQueen et al., 2001), but remains underused. It is possible that this is partially due to an obscurity regarding how to apply this tool to qualitative data, and a need for detailed but accessible explanations of the basic considerations and steps required from qualitative researchers interested in clustering as a tool. Through the detailed presentation of a case study using content cluster analysis in a qualitative project, I explain in this article the main elements of this technique as it applies to qualitative data, including the steps and considerations required to perform clustering and interpret its results. Because cluster analysis is an exploratory tool meant to support the analysis of qualitative data, I also discuss when and how to return to the full qualitative data. The Case Study: The Latino Grievances Project The case study discussed through this article comes from a research project on grievance management among Latino immigrants to southwestern Pennsylvania, approved by the University of Pittsburgh IRB. Between 2007 and 2009 I collected qualitative data from twenty-one in-depth interviews with Latino immigrants. I was exploring how these immigrants dealt with perceived grievances, including how and when they felt aggrieved, what options they recognized as available, and how they decided what to do. I recruited fourteen participants into two strata by occupation, and purposely sampled six participants according to their status as spouses of American citizens. In the interviews I asked broadly about “problems” that participants might have experienced. I then asked guided questions on four main types of grievances: domestic problems, debts, discrimination, and “problems with the law.” Whenever participants stated having experienced a grievance, I asked them to provide a detailed narrative about it, probing to ensure they provided information on the actors, context, events and actions taken, and the beliefs and attitudes that supported these actions. I accompanied the interview data with participant-observation conducted in spaces where Latinos commonly participated (e.g., Spanish speaking mass, organized Latino community events, organizations catering Latinos). I digitally recorded the audio of all interviews and used Atlas.ti to code all source files thematically. I built a codebook from predefined codes on the types of grievances and procedural modes to deal with them already identified in the literature, along with data-driven codes I identified following a grounded theory approach. I identified a total of 199 grievance cases, 195 of which had occurred locally and thus included complete details on parties, support, and resolution. After initial coding, my first step was to perform a basic review of the cases based on specific characteristics (e.g., review together all domestic cases, all debt cases, etc.). However, the amount of data made it difficult to draw comparisons this way. I then explored coding frequencies and co-occurrences, coupled with select case reviews based on these. Once again the breadth of data collected made it extremely difficult to identify trends within the data while feeling confident that I was not unintentionally giving undesired weight to my own preconceptions. This is when I considered cluster analysis as an exploratory tool to guide my review of the wealth of qualitative data available. Clustering tools in qualitative analysis software available overly focused on text-mining, which was not appropriate to my content driven requirement. I thus opted for the combined use of qualitative and quantitative software, obtaining full control over the process. I thus identified overarching categories and variables I
Laura Macia 1085
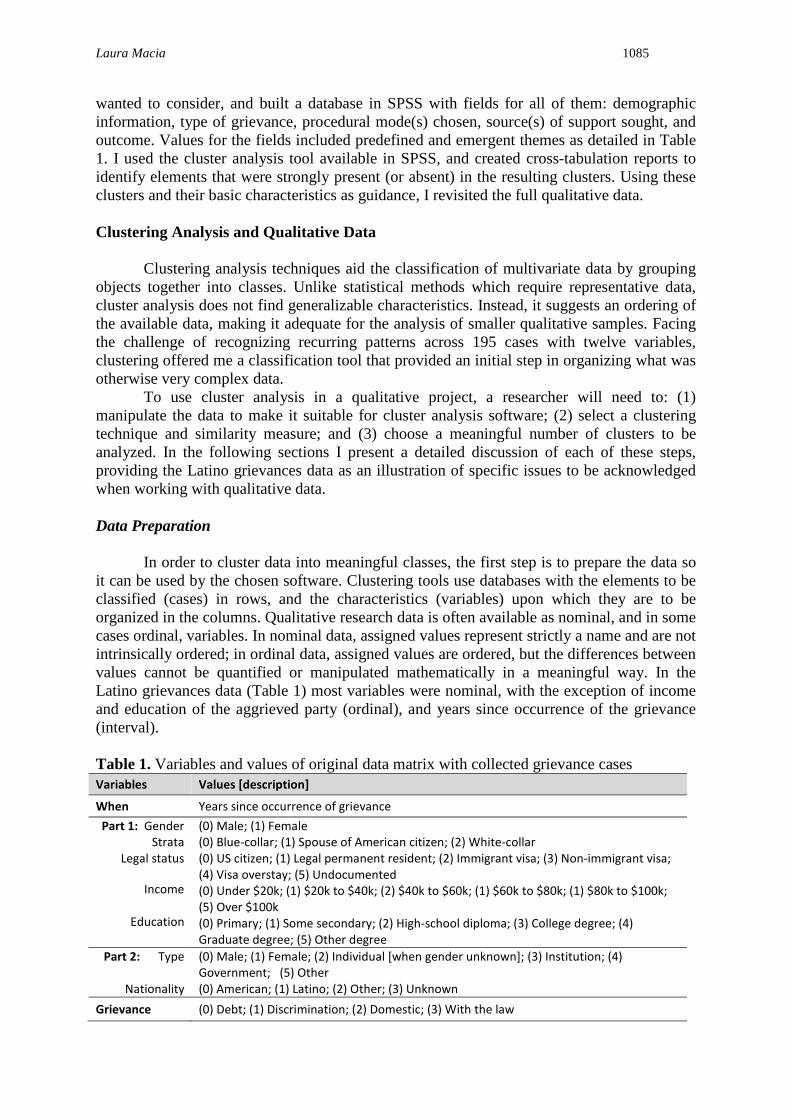
wanted to consider, and built a database in SPSS with fields for all of them: demographic information, type of grievance, procedural mode(s) chosen, source(s) of support sought, and outcome. Values for the fields included predefined and emergent themes as detailed in Table 1. I used the cluster analysis tool available in SPSS, and created cross-tabulation reports to identify elements that were strongly present (or absent) in the resulting clusters. Using these clusters and their basic characteristics as guidance, I revisited the full qualitative data. Clustering Analysis and Qualitative Data Clustering analysis techniques aid the classification of multivariate data by grouping objects together into classes. Unlike statistical methods which require representative data, cluster analysis does not find generalizable characteristics. Instead, it suggests an ordering of the available data, making it adequate for the analysis of smaller qualitative samples. Facing the challenge of recognizing recurring patterns across 195 cases with twelve variables, clustering offered me a classification tool that provided an initial step in organizing what was otherwise very complex data. To use cluster analysis in a qualitative project, a researcher will need to: (1) manipulate the data to make it suitable for cluster analysis software; (2) select a clustering technique and similarity measure; and (3) choose a meaningful number of clusters to be analyzed. In the following sections I present a detailed discussion of each of these steps, providing the Latino grievances data as an illustration of specific issues to be acknowledged when working with qualitative data. Data Preparation In order to cluster data into meaningful classes, the first step is to prepare the data so it can be used by the chosen software. Clustering tools use databases with the elements to be classified (cases) in rows, and the characteristics (variables) upon which they are to be organized in the columns. Qualitative research data is often available as nominal, and in some cases ordinal, variables. In nominal data, assigned values represent strictly a name and are not intrinsically ordered; in ordinal data, assigned values are ordered, but the differences between values cannot be quantified or manipulated mathematically in a meaningful way. In the Latino grievances data (Table 1) most variables were nominal, with the exception of income and education of the aggrieved party (ordinal), and years since occurrence of the grievance (interval). Table 1. Variables and values of original data matrix with collected grievance cases Variables Values [description]
When Years since occurrence of grievance Part 1: Gender
Strata Legal status
Income
Education
(0) Male; (1) Female (0) Blue-collar; (1) Spouse of American citizen; (2) White-collar (0) US citizen; (1) Legal permanent resident; (2) Immigrant visa; (3) Non-immigrant visa; (4) Visa overstay; (5) Undocumented (0) Under $20k; (1) $20k to $40k; (2) $40k to $60k; (1) $60k to $80k; (1) $80k to $100k; (5) Over $100k (0) Primary; (1) Some secondary; (2) High-school diploma; (3) College degree; (4) Graduate degree; (5) Other degree
Part 2: Type
Nationality
(0) Male; (1) Female; (2) Individual [when gender unknown]; (3) Institution; (4) Government; (5) Other (0) American; (1) Latino; (2) Other; (3) Unknown
Grievance (0) Debt; (1) Discrimination; (2) Domestic; (3) With the law

1086 The Qualitative Report 2015
Procedural mode
(0) None (1) Adjudication [third party with authority to intervene, i.e. courts] (2) Arbitration [third party agreed to by principals] (3) Mediation [third party aiding principals reach an agreement] (4) Negotiation [two principals decide on settlement] (5) Coercion [imposition of outcome by unilateral threat or use of force] (6) Avoidance [terminate relationship / withdraw from situation] (7) Lumping it [“letting go” as of grievance] (8) Assumed fault* [structure grievance as occurring due to own situation/fault] (9) Talk back* [letting know of grievance without necessarily making a claim or
expecting further action] (10) Other
Support (0) None; (1) Family; (2) Friend; (3) Service Provider; (4) Church*; (5) Other Resolution (0) None [no resolution occurred]
(1) Part1 [the aggrieved’s interests were fully met] (2) Part2 [the other principal’s interests were fully met] (3) Mixed [each principal had some interests met, some not] (4) Other
* Data-driven codes, not included in predefined coding scheme
Clustering techniques organize data by comparing the values assigned for variables across cases, determining their level of similarity. Unfortunately, common distance measures (the most common of which is subtracting values to determine distance) are inappropriate with nominal or ordinal data. With nominal data in particular, which are not ordered, values are by definition not comparable to other values. For example, the support variable in the database is coded as (0) none, (1) family, (2) friend, (3) service provider, (4) church, (5) other. If a distance measure were to be used on these numbers as values, then someone asking for support to a friend would be “more similar” to someone asking support from a service provider than to someone asking for help at church, an unsubstantiated conclusion even when organizing the values in their most meaningful order. In order to overcome this limitation, qualitative data is transformed into binary data in which values are either 1 or 0 representing the presence or absence of a given attribute. For the Latino grievances project I generated a column for each possible value for all the nominal and ordinal variables (in the source of support example this single variable transformed into six columns), and in each case (row) assigning a 1 if that value was present/true, and 0 if it was not. The resulting data matrix had fifty-nine binary variables and one scale variable (the time of occurrence). Because each value becomes an independent variable, this organization has the added benefit of allowing multiple attributes of the same original variable to co-exist (e.g., a person could have a 1 in both “friend” and “service provider,” as support can have multiple sources). Because most clustering techniques are sensitive to order, it is advisable to randomize the cases as a final data preparation step. Selecting a Clustering Method and Distance Measure Clustering requires selecting a method to be used in constructing the clusters. For binary data hierarchical clustering is appropriate (Everitt, Landau, & Leese, 2001). In the agglomerative version of the method, in a first step each element is its own cluster. All clusters are compared, with those most similar merging and creating a new cluster; this process repeats until a single cluster is formed. Results present all the steps (Kaufman & Rousseeuw, 2009). This technique is not corrective: once an element is placed in a cluster that selection cannot be reversed, which can potentially affect the adequacy of the end result (Everitt, 1980).

Laura Macia 1087
A fundamental element in hierarchical clustering is choosing an appropriate distance measure for comparing the clusters and determining their similarity/dissimilarity in each step of the process. Multiple distance measures are adequate for binary data, all of which are computed from contingency tables for each pair of cases (Everitt et al., 2001). Contingency tables (see Table 2) present tallies of all instances in which both cases share an attribute (a), those where one but not the other has the attribute (b and c), and those where none of them have a given attribute (d). Table 2. Contingency table for cases i and j
Case i Present (1) Absent (0)
Case j Present (1) a b Absent (0) c d
Different similarity measures are more or less appropriate to different types of data. For this reason, qualitative researchers need to be familiar with their own data before choosing a measure. For symmetric data, the presence of a nominal data attribute is equally important as its absence (e.g., it is equally relevant to be female or male). In asymmetric data, presences are of more significance than absences (e.g., the use of a specific form of support) (Everitt et al., 2001). In the grievances project, all but the demographic data was asymmetric, and the presence of these attributes was rare (often no source of support was sought, or only one procedural mode was chosen). As a result, most values computed to zero in the binary database. With asymmetric data, appropriate measures underplay the importance of shared absences and stress that of shared presences. An example is the Dice measure (Equation 1), which ignores shared absences and heightens the importance of shared positives (Kaufman & Rousseeuw, 2009). Equation 1: Dice similarity measure for cases i and j with binary variables
𝐷𝐷𝐷𝐷𝐷𝐷𝐷𝐷(𝑖𝑖,𝑗𝑗) =2𝑎𝑎
2𝑎𝑎 + 𝑏𝑏 + 𝑐𝑐
Clustering and Selecting a Cluster Solution A next step is to determine which variables will be considered to construct the cluster solution. Because samples in qualitative data can be relatively small, it is important to use variables that are not overly determined by the research structure. For example, in the Latino grievances project I omitted the demographic characteristics of the aggrieved party, which by design were shared by all cases from the same interviewee. This could inflate shared presences, with the undesired outcome of clustering by aggrieved party. I opted for choosing grievance elements that were independent from the research design: characteristics of the aggrieving party, the procedural modes elected, and the sources of support sought, most of them decisions in response to the aggrieving situation. Once hierarchical clustering is performed, the next fundamental task is to determine the cluster solution to be retained (i.e., the number of clusters considered for analysis). Some algorithms look at the amount of change that is reflected by each new cluster solution and the error that it allows (Salvador & Chan, 2004). Unfortunately, in the series of solutions produced in my project there was not a clearly defined breaking point between clusters. In order to determine the best number of clusters to analyze I saved cluster solutions for scenarios with 3 through 8 clusters. Using Excel I created separate datasheets for each cluster solution, including data on the total number of cases in each cluster and basic descriptive

1088 The Qualitative Report 2015
measures, as well as which clusters had been merged from the previous solution. This allowed me to understand the key variables determining the merging clusters, and the level of detail that each new partition allowed. Using this information I identified the seven cluster partition as best. The Latino Grievance Project: A Case Study in Using Cluster Results in Qualitative Analysis The seven resulting clusters divided ranged in size from three cases to 85. The descriptive statistics of the clustering variables for all the clusters are presented in Table 3. As expected, most of the presences in each variable are significantly agglomerated in one or more clusters. Table 3. Cases in each cluster by nature of the part recognized as causing the grievance, sources of support sought and procedural mode chosen
Select attributes 1 (n=85)
2 (n=38)
3 (n=18)
4 (n=10)
5 (n=25)
6 (n=16)
7 (n=3)
Total (n=195)
Part causing the grievance
Individual 85 0 0 0 22 16 0 123 Female 25 0 0 0 3 11 0 39
Male 44 0 0 0 15 0 0 59 Institution 0 38 0 0 2 0 0 40 Government 0 0 18 0 1 0 0 19 Other 0 0 0 10 0 0 3 13
Procedural mode
Adjudication 3 0 9 0 1 0 1 14 Mediation 0 0 0 0 4 0 0 4 Negotiation 29 19 0 2 20 3 1 74 Coercion 4 0 0 0 0 3 1 8 Avoidance 7 10 1 2 6 9 1 36 Lumping it 36 6 1 5 4 5 0 57 Assumed fault 16 4 6 1 5 0 1 33 Talk back 14 4 0 0 4 8 0 30 Other 28 10 7 4 16 3 1 69
Sources of support sought
Family 0 2 0 0 17 4 2 25 Friend 0 4 3 0 9 10 3 29 Service Provider 5 0 1 0 7 1 3 17 Church 1 1 0 0 0 1 0 3 Other 3 3 3 0 3 4 0 16 None 79 30 13 10 0 0 0 132
A more interesting question is whether the variables not used for clustering are also markedly present in one or more of the resulting clusters. To analyze this I cross-tabulated cluster membership with these variables, a first step in trying to understand what, if anything, had been captured and agglomerated in each cluster. I specifically cross-tabulated cluster membership with: type of grievance; outcome of the grievance process; and gender, legal status, level of education and income of the aggrieved party. Cross-tabulation is commonly used to identify interactions between variables and assess whether or not these are the product of chance. In this case, cross-tabulations facilitated the understanding of the cluster solution, indicating elements that could be of particular interest within each cluster and that would warrant focusing on in the qualitative data. A significance level of 0.1 was used. The results of some of the cross-tabulations are presented in Table 4, (type of grievance), Table 5 (outcome) and Table 6 (gender of the aggrieved party), layered by the sampling strata used at recruitment. A chi-square test of independence was performed to examine the relation between cluster memberships and these variables. Cluster membership

Laura Macia 1089
was strongly related with the type of grievance (χ2df=24, N=195 = 211.551, p=.000). Problems
with the law were almost in their entirety in cluster 3; debts were mostly in cluster 2, presenting a different configuration for blue-collar aggrieved parties; domestic grievances were most strongly represented in cluster 5, but were also a majority in clusters 1 and 4 with differences across strata; discrimination was present in almost all clusters, with a stronger presence in clusters 4 and 6. In terms of outcome (χ2
df=24, N=195 = 42.626, p=.011), white-collar participants were the least likely to have a beneficial result in cluster 1. Cases in cluster 2 had considerable favorable outcomes for the aggrieved party, except for blue-collar individuals. Table 4. Clustering by type of grievance, layered by strata
1 (n=85)
2 (n=38)
3 (n=18)
4 (n=10)
5 (n=25)
6 (n=16)
7 (n=3)
Total (n=195)
White Collar
Debt 7 11 0 1 2 1 1 23 Discrimination 8 2 0 0 0 3 0 13 Domestic 10 0 0 0 5 1 0 16 Law 0 0 8 0 1 0 0 9 Other 1 4 0 0 0 0 0 5 Total 26 17 8 1 8 5 1 66
Spouse of American Citizen
Debt 2 6 0 0 1 0 0 9 Discrimination 5 2 0 0 0 1 0 8 Domestic 14 0 0 1 4 3 1 23 Law 0 0 3 0 0 0 0 3 Other 0 0 1 0 1 2 0 4 Total 21 8 4 1 6 6 1 47
Blue Collar
Debt 11 10 0 1 3 1 0 26 Discrimination 6 3 1 3 1 2 0 16 Domestic 18 0 0 3 6 2 0 29 Law 0 0 5 0 0 0 1 6 Other 3 0 0 1 1 0 0 5 Total 38 13 6 8 11 5 1 82
Total 85 38 18 10 25 16 3 195 Table 5. Grievance outcome, layered by strata
1 (n=85)
2 (n=38)
3 (n=18)
4 (n=10)
5 (n=25)
6 (n=16)
7 (n=3)
Total (n=195)
White Collar
Part 1 2 8 2 1 1 0 0 14 Part 2 9 3 5 0 1 0 0 18 Mixed 3 4 1 0 2 2 1 13 Other 2 2 0 0 3 1 0 8 None 10 0 0 0 1 2 0 13 Total 26 17 8 1 8 5 1 66
Spouse of American Citizen
Part 1 4 6 2 0 2 1 0 15 Part 2 2 0 0 0 1 2 0 5 Mixed 4 0 1 0 1 1 0 7 Other 4 0 1 1 0 0 1 7 None 7 2 0 0 2 2 0 13 Total 21 8 4 1 6 6 1 47
Blue Collar
Part 1 6 3 2 1 0 1 0 13 Part 2 11 6 2 3 2 2 0 26 Mixed 7 1 1 0 4 1 0 14 Other 6 0 1 2 1 0 1 11 None 8 3 0 2 4 1 0 18 Total 38 13 6 8 11 5 1 82
Total 85 38 18 10 25 16 3 195 Regarding cluster membership and characteristics of the aggrieved individual, cluster 4 is mostly composed of cases reported by blue-collar participants (χ2
df=6, N=195=11.571, p=.072), an exception in an otherwise evenly distributed membership across clusters by strata. As for

1090 The Qualitative Report 2015
gender of the aggrieved party (χ2df=6, N=195=11.459, p=.075), cluster 3 attracted mostly males,
particularly among cases with a blue-collar or spouse of American citizen aggrieved party. The distribution of gender of the aggrieved party across clusters was particularly unique among blue-collar participants. In this stratum all aggrieved parties in cluster 6 were females, and most were so in cluster 5. In cross-tabulation, legal status, level of education and income did not present any interesting distributions across clusters. Table 6. Clustering by gender of aggrieved party, layered by strata
1 2 3 4 5 6 7 Total
White Collar
Female 19 7 3 1 5 3 1 39 Male 7 10 5 0 3 2 0 27 Total 26 17 8 1 8 5 1 66
Spouse of American
Female 11 3 0 1 3 2 1 21 Male 10 5 4 0 3 4 0 26 Total 21 8 4 1 6 6 1 47
Blue Collar
Female 22 8 1 3 8 5 0 47 Male 16 5 5 5 3 0 1 35 Total 38 13 6 8 11 5 1 82
Total 85 38 18 10 25 16 3 195 Returning to Qualitative Data: Interpreting the Results As used in this article, clustering is an exploratory simplification tool for qualitative analysis: it helps simplify qualitative analysis, but is not a replacement for it. Therefore, a fundamental phase in the analytic process is to return to the full qualitative data through the structured framework provided by clustering. In the Latino grievances project I developed a table summarizing all the potentially important relationships identified through clustering and cross-tabulation (Table 7). Using this structure, I proceeded to analyze the data for all the cases in each cluster identifying common themes, utilizing cluster membership as a code. I present a cursory discussion of the different clusters in the Latino grievances project and some of the analysis after returning to the qualitative data as an illustration of this important final step. Table 7. Cluster membership – broad characteristics
1 (n=85) 2 (n=38) 3 (n=18) 4 (n=10) 5 (n=25)
6 (n=16) 7 (n=3)
Type of Grievance
Domestic (and others)
Debt Law Domestic Discrimination
Domestic Discrimination
Part 1 (aggrieved)
(different distribution for blue-collar)
Male Blue-collar Female (particularly blue-collar)
No blue-collar males
All females
Part 2 All Individual
All Institution
All Government
All Other Individual Female All Other
Procedural Mode
Lumping it; Low avoidance
Negotiation; Avoidance; No coercion
Adjudication; Assume Fault; No coercion; No negotiation; No talk back
Lumping it; Other; No coercion; No talk back;
Negotiation; All Mediation; Other; No coercion
Avoidance; Talk back; Coercion; No assume fault
Support sought
None All None Family; Friend; Service Provider (blue-collar); No None
Friend; Family; Other; No None
Friend; Service Provider; Family; No None
Resolution Against (white-collar)
Part 1 (except blue-collar)
Part 1; No None
No None

Laura Macia 1091
In cluster 2, which gathered most of the debt cases and particularly those against institutions, the preferred procedural modes were negotiation and avoidance. Negotiation in these cases tended to produce a resolution in favor of the aggrieved party; however, the cross-tabulation showed a stronger benefit among white-collar participants. In analyzing the qualitative data, these individuals seemed to have a better understanding of the American culture (which supports “claiming” as an adequate way of reaching a desired outcome), and tended to have the necessary language and communication skills needed to engage in a negotiation process, thus supporting and explaining the discrepancy. Cluster 3 agglomerated the vast majority of grievance situations with the law, most of them traffic violations. The qualitative analysis of the data suggested that this explained the strong presence of males as parts in this cluster, as they were more likely to drive than Latinas. Because of this, they were more likely to have traffic violations and consequently have more problems with the law. Cluster 5 was strongly populated with domestic cases, and was the cluster in which the broadest array of procedural modes was found: negotiation, mediation, assuming fault, avoidance, and other were all strongly present in the cluster. This was also the cluster in which more support was sought, with all the aggrieved parties reaching out to at least one source of support. The cases that were bundled in this group were qualitatively identified by those aggrieved as of particular importance to them, which explains why they tended to make use of a broad range of resources both in terms of support sought and actual actions taken to address the grievance. At the same time, in most of the cases in this cluster the involved individuals had a strong interest in minimizing any possible negative interpretation of their actions. However, the reasons for this desire were not homogeneous across the cluster, and actually hid dramatic differences. In some cases, the preoccupation with how the other party interpreted actions stemmed from a shared and strong devotion to a relationship that both parties wanted to protect, for instance in quarrels among spouses who mutually wanted to overcome a disagreement. In the other extreme were cases in which the aggrieved expressed concern for the possible adverse consequences of a strong breakdown, mainly for fear of violence and an explosive development of the grievance, as a reason for their actions. This interest in a resolution that was protective of the relationship became important when comparing this clusters and cluster 6, which also includes a significant number of domestic issues but is more dominated by discrimination grievances. Similar to cluster 5, the qualitative review of the data indicated that these were also cases that those aggrieved felt were important, and because of that they again tended to make use of a broad range of resources. However, when comparing the procedural modes chosen, the selected actions in cluster 6 were more confrontational than those in cluster 5. Procedural modes in cluster 6 were mainly avoidance, talking back and coercion; no aggrieved individual assumed fault in this cluster. With more cases in this cluster occurring among strangers, particularly discrimination ones, these were grievances where the aggrieved party was less concerned with saving an existing relationship. Most domestic cases in this cluster involved relationships already heavily damaged, where the aggrieved parties had already taken steps to end the relationship, or limit it significantly. Interpersonal violence was present in four of the six domestic cases in cluster 6, and in three of them the victim had already sought the help of external services such as shelters. With a similar composition to cluster 6 in terms of the types of grievances it agglomerated, cluster 4 presented a dramatically different picture in terms of the response: most of the grievances were lumped, some avoided and in only two cases out of ten there was a claim that resulted in negotiation. Coercion or talking back was not used in this cluster, which made it the least confrontational of all. When analyzing the qualitative data available on the cases in this cluster, I identified two main reasons for this lack of action: for some

1092 The Qualitative Report 2015
people, the grievances represented in this cluster were of little intrinsic value, so they perceived that it was not worth their effort to do anything to counteract them. For others, however, the lack of action characterized impotence. While these were issues of great importance to them, such as discrimination or alcoholism, they reported feeling that their actions would be futile, and thus none were taken. Cluster 7 was very small, but very stable in the clustering process (it remained a cluster without merging with bigger ones even when considering only three clusters). However, when I returned to the qualitative data, the cases seemed very dissimilar. What they did share was a complexity in determining their nature. In all of them I had developed detailed memos as to whether these should be classified as “domestic,” “debt,” “discrimination,” or simply “other.” However, the nature of the problems was varied: one was the case of a female abandoned by her spouse at the hospital with a huge bill to pay and with no papers; another was a male who had a traffic incident in which various public goods were damaged (light posts, a mail box) and charged to him; the third was a woman who was unable to buy a house due to a variety of incidents with the potential seller, the bank, the real estate agent and the inspectors in charge of looking at the property, without it being clear if the motivation was discrimination or the expectation of a high profit. All of these cases required the aggrieved party to search for support and find multiple alternatives to deal with the situation. Each grievance was also approached using a very broad variety of procedures and sources of support, which was uncommon. In the other end of the spectrum was cluster 1, the most numerous of all the clusters but also the weakest. Lumping and negotiation were the strongest procedural modes in this cluster, but beyond this it was difficult to identify any strong typology given its diversity. The one thing it did suggest was that when faced with grievances against individuals, Latinos preferred to ignore the grievance or deal with it one-on-one. While personal networks were important in many grievances, they weren’t used often in this large cluster. This suggests networks were approached mostly in cases of great personal importance for the aggrieved party, and were clustered somewhere else. Conclusions In this study, analysis was aided and framed through the use of clustering techniques. Starting with a grounded theory approach that allowed me to identify procedural modes, forms of support, and types of resolution that occurred in grievances among Latinos in this community, cluster analysis provided a framework that helped reduce the data to a more manageable size. Supported by this new analytical structure provided by clustering, I was then able to revisit the qualitative data and once again identify overarching concerns or considerations that Latinos facing different types of grievances and different types of parties might have had. This framework facilitated the identification of themes that would be meaningful within and across cases. All research endeavors, in one way or another, present simplified versions of reality. In qualitative work, researchers identify patterns, underscore significant moments or quotes. Even as we try to include the phenomena we study in their full complexity, we are required to pick and choose, select what will be presented, and how. Cluster analysis is a quantitative tool that has the potential to help researchers working with the breadth and wealth of data that qualitative inquiry produces. Clustering is a process that lies at the core of many qualitative questions: How can reality be approached and presented while respecting its complexity? Which circumstances, situations or conditions are similar enough to each other that deserve a focused understanding of what brings them together? What typologies can be identified in a given context?

Laura Macia 1093
By using a mixed approach to analysis that allows processing qualitative data through clustering, it is possible to manage the complexity of qualitative data while maintaining its richness. However, it is paramount that qualitative researchers not only understand the potential of this tool, but also the requisites for using it with the data available and how to appropriately interpret its results. Clustering techniques do not need a generalizable set of data to be performed, and offer a very broad array of alternatives in terms of how to compare the cases to be ordered. As such, they are ideal for most qualitative data, and are particularly useful when the unit of analysis requires the collection of a number of cases such that it encumbers within and across case analysis. What is necessary is an adequate manipulation of the data, determining measures that are appropriate for comparing the cases to be ordered and, avoiding using elements strongly determined by the research design to determine clustering. If these basic steps are followed, cluster analysis can provide an invaluable tool to qualitative researchers. Clustering delivers a framework that allows a focused and guided approach to the rich and multifaceted data of qualitative projects. For cluster analysis to be adequately used and interpreted it remains fundamental that researchers understand the processes at work in this method.
References Attride-Stirling, J. (2001). Thematic networks: An analytic tool for qualitative research.
Qualitative Research, 1(3), 385-405. doi: 10.1177/146879410100100307 Barusch, A., Gringeri, C., & George, M. (2011). Rigor in qualitative social work research: A
review of strategies used in published articles. Social Work Research, 35(1), 11-19. Everitt, B. (1980). Cluster analysis (2d ed.). New York, NY: Halsted Press. Everitt, B., Landau, S., & Leese, M. (2001). Cluster analysis (4th ed.). New York, NY:
Oxford University Press. Fielding, N. (2005). The resurgence, legitimation and institutionalization of qualitative
methods. Forum: Qualitative Social Research, 6(2), Art. 32. Gilbert, L., Jackson, K., & di Gregorio, S. (2014). Tools for analyzing qualitative data: The
history and relevance of qualitative data analysis software. In J. M. Spector, M. D. Merrill, J. Elen & M. J. Bishop (Eds.), Handbook of research on educational communications and technology (pp. 221-236). New York, NY: Springer.
Guest, G., & McLellan, E. (2003). Distinguishing the trees from the forest: Applying cluster analysis to thematic qualitative data. Field Methods, 15(2), 186-201.
James, A. (2013). Seeking the analytic imagination: reflections on the process of interpreting qualitative data. Qualitative Research, 13(5), 562-577. doi: 10.1177/1468794112446108
Kaufman, L., & Rousseeuw, P. J. (2009). Finding groups in data: an introduction to cluster analysis (Vol. 344). New York, NY: John Wiley & Sons.
MacQueen, K. M., McLellan, E., Metzger, D. S., Kegeles, S., Strauss, R. P., Scotti, R.,...Trotter, R. T. (2001). What is community? An evidence-based definition for participatory public health. American journal of public health, 91(12), 1929-1938.
Miller, W. L., & Crabtree, B. F. (1994). Qualitative analysis: How to begin making sense. Family Practice Research Journal, 14(3), 289-297.
Salvador, S., & Chan, P. (2004). Determining the number of clusters/segments in hierarchical clustering/segmentation algorithms. Paper presented at the Tools with Artificial Intelligence, 2004. ICTAI 2004. 16th IEEE International Conference on.
Silver, C., & Lewins, A. (2014). Using software in qualitative research: A step-by-step guide. Thousand Oaks, CA: SAGE.

1094 The Qualitative Report 2015
Author Note I earned my PhD in Anthropology with a dissertation on the resources available to
Latino immigrants in Southwestern Pennsylvania for managing conflicts and disputes. I am currently a Postdoctoral Associate at the Graduate School of Public Health, Behavioral and Community Health Sciences at the University of Pittsburgh. I have worked on research on Latino health in Southwestern Pennsylvania, an emerging immigrant community, for some years. My current research interest is intimate partner violence among Latinos in this area, and its relation to alcohol drinking. Correspondence regarding this article can be addressed directly to: Laura Macia at, 224C Parran Hall, 130 DeSoto Street, Pittsburgh, PA 15261; Phone: 412-383-8982; E-mail: [email protected].
Copyright 2015: Laura Macia and Nova Southeastern University.
Article Citation Macia, L. (2015). Using clustering as a tool: Mixed methods in qualitative data analysis. The
Qualitative Report, 20(7), 1083-1094. Retrieved from http://www.nova.edu/ssss/QR/QR20/7/macia3.pdf