Embed Size (px)
Citation preview
Using CBM for
Progress Monitoring
Lynn S. Fuchs and Douglas Fuchs
Introduction to Curriculum-Based Measurement (CBM) What is Progress Monitoring? Progress monitoring focuses on individualized decision making in general and special education with respect to academic skill development at the elementary grades. Progress monitoring is conducted frequently (at least monthly) and is designed to
(a) estimate rates of improvement, (b) identify students who are not demonstrating adequate progress and therefore
require additional or alternative forms of instruction; and/or (c) compare the efficacy of different forms of instruction and thereby design more
effective, individualized instructional programs for problem learners. In this manual, we discuss one form of progress monitoring: Curriculum-Based Measurement (CBM). What is the Difference Between Traditional Assessments and Progress Monitoring? Traditional assessments used in schools are generally lengthy tests that are not administered on a regular basis. Many times, traditional assessments are administered to students once per year, and teachers do not receive their students’ scores until weeks or months later, sometimes after the school year is complete. Because teachers do not receive immediate feedback, they cannot use these assessments to adapt their teaching methods or instructional programs in response to the needs of their students. One type of progress monitoring, CBM, is an alternative to commercially prepared traditional assessments that are administered at one point in time. CBM provides teachers with an easy and quick method of obtaining empirical information on the progress of their students. With frequently obtained student data, teachers can analyze student scores to adjust student goals and revise their instructional programs. That way, instruction can be tailored to best fit the needs of each student. Another problem with traditional assessments is that student scores are based on national scores and averages. In fact, the students in a teacher’s classroom may differ tremendously from a national sample of students. CBM allows teachers to compare an individual student’s data to data on other students in their classroom. Schools or school districts may also collect normative data on the students within their own school or district to provide teachers with a local normative framework for interpreting scores. What is Curriculum-Based Assessment? Curriculum-based assessment is a broader term than CBM. As defined by Tucker (1987), CBM meets the three curriculum-based assessment requirements:
(a) measurement materials are aligned with the school’s curriculum; (b) measurement is frequent; and (c) assessment information is used to formulate instructional decisions.
CBM is just one type of curriculum-based assessment.
2
What is the Difference Between Curriculum-Based Assessment and CBM? CBM is a distinctive form of curriculum-based assessment because of two additional properties. First, each CBM test is an alternate form of equivalent difficulty. Each test samples the year-long curriculum in exactly the same way using prescriptive methods for constructing the tests. In fact, CBM is usually conducted with “generic” tests, designed to mirror popular curricula. By contrast, other forms of curriculum-based assessment (CBA) require teachers to design their own assessment procedures. The creation of those CBA tests can be time-consuming for teachers because the measurement procedures (a) change each time a student masters an objective and (b) can differ across pupils in the same classroom. The second distinctive feature of CBM is that it is highly prescriptive and standardized. This guarantees reliable and valid scores. CBM provides teachers with a standardized set of materials that has been researched to produce meaningful and accurate information. By contrast, the adequacy of teacher-developed CBA tests and commercial CBA tests is largely unknown. It is uncertain whether scores on those CBA tests represent performance on meaningful, important skills and whether the student would achieve a similar score if the test were re-administered. The Basics of CBM CBM is used to monitor student progress across the entire school year. Students are given standardized reading probes at regular intervals (weekly, bi-weekly, monthly) to produce accurate and meaningful results that teachers can use to quantify short- and long-term student gains toward end-of-year goals. With CBM, teachers establish long-term (i.e., end-of-year) goals indicating the level of proficiency students will demonstrate by the end of the school year. CBM tests (also called “probes”) are relatively brief and easy to administer. The probes are administered the same way every time. Each probe is a different test, but the probes assess the same skills at the same difficulty level. The reading probes have been prepared by researchers or test developers to represent curriculum passages and to be of equivalent difficulty from passage to passage within each grade level. Probes are scored for reading accuracy and speed, and student scores are graphed for teachers to consider when making decisions about the instructional programs and teaching methods for each student in the class. CBM provides a doable and technically strong approach for quantifying student progress. Using CBM, teachers determine quickly whether an educational intervention is helping a student. What CBM Probes are Available? Currently, CBM probes are available in reading, math, writing, and spelling. This manual focuses on reading CBM. Appendix A contains a list of CBM resources and how to obtain CBM reading probes and computer software.
3
CBM Research Research has demonstrated that when teachers use CBM to inform their instructional decision making, students learn more, teacher decision making improves, and students are more aware of their own performance (e.g., Fuchs, Deno, & Mirkin, 1984). CBM research, conducted over the past 30 years, has also shown CBM to be reliable and valid (e.g., Deno, 1985; Germann & Tindal, 1985; Marston, 1988; Shinn, 1989). The following is an annotated bibliography of selected CBM articles. Appendix B contains another list of CBM research articles. Deno, S.L., Fuchs, L.S., Marston, D., & Shin, J. (2001). Using curriculum-based measurement to establish growth standards for students with learning disabilities. School Psychology Review, 30, 507-526.
• Examined the effects of curriculum-based measurement on academic growth standards for students with learning disabilities (LDs) in the area of reading. The reading abilities of 638 learning disabled 1st-6th grade students were evaluated. Results show that rate-of-growth differences existed at 1st grade concerning LD Ss and general education controls Ss, but by 5th-6th grade, a sharp drop in the learning slopes for general education control Ss resulted in virtually identical growth rates for the 2 groups. The observed reading progress was similar to results reported in several previous studies. Findings suggest that it is possible to set growth standards for both general and special education students using CBM.
Fuchs, D., Roberts, P.H., Fuchs, L.S., & Bowers, J. (1996). Reintegrating students with learning disabilities into the mainstream: A two-year study. Learning Disabilities Research and Practice, 11, 214-229.
• Reports a study that evaluated the short- and long-term effects of 3 variants of a case-by-case process for readying students to move successfully from resource rooms to regular classrooms for math instruction. Preparation for this transition included use of curriculum-based measurement and transenvironmental programming, each alone and in combination. Teachers using the more complex variants of the case-by-case process were more successful at moving students across settings and fostering greater math achievement and positive attitude change, especially while the students were still in special education. At 1-year follow-up, about half of the students either never were reintegrated or were moved to the mainstream temporarily, only to be returned to special education.
Fuchs, L.S., & Deno, S.L. (1991). Paradigmatic distinctions between instructionally relevant measurement models. Exceptional Children, 57, 488-501.
• Explains how CBM differs from most other forms of classroom-based assessment.
Fuchs, L.S., & Deno, S.L. (1994). Must instructionally useful performance assessment be based in the curriculum? Exceptional Children, 61, 15-24.
4
• Examines the importance of sampling testing material from the students’ instructional curricula; concludes that sampling from the curriculum is not essential; and proposes three features critical to insure the instructional utility of measurement.
Fuchs, L.S., & Fuchs, D. (1992). Identifying a measure for monitoring student reading progress. School Psychology Review, 58, 45-58.
• Summarizes the program of research conducted to explore CBM reading measures other than reading aloud.
Fuchs, L.S., & Fuchs, D. (1996). Combining performance assessment and curriculum-based measurement to strengthen instructional planning. Learning Disabilities Research and Practice, 11, 183-192.
• Explores the coordinated use of performance assessment (PA) and curriculum-based measurement (CBM) to help teachers plan effective instruction.
Fuchs, L.S., & Fuchs, D. (1998). Treatment validity: A unifying concept for reconceptualizing the identification of learning disabilities. Learning Disabilities Research and Practice, 13, 204-219.
• Summarizes a substantial portion of the research base on the technical features and instructional utility of CBM; provides a framework for using CBM within a treatment validity approach to LD identification, within which students are identified for special education when their level of achievement and rate of improvement is substantially below that of classroom peers and when, despite intervention efforts, they remain resistant to treatment.
Fuchs, L.S., & Fuchs, D. (1999). Monitoring student progress toward the development of reading competence: A review of three forms of classroom-based assessment. School Psychology Review, 28, 659-671.
• Describes and critiques 3 classroom-based assessment models for monitoring student progress toward becoming competent readers.
Fuchs, L.S., & Fuchs, D. (2000). Curriculum-based measurement and performance assessment. In E.S. Shapiro & T.R. Kratochwill (Eds.), Behavioral assessment in schools: Theory, research, and clinical foundations (2nd ed., pp. 168-201). New York: Guilford.
• Summarized research on curriculum-based measurement of math computation, math concepts and applications, and math problem solving.
Fuchs, L.S., & Fuchs, D. (2002). Curriculum-based measurement: Describing competence, enhancing outcomes, evaluating treatment effects, and identifying treatment nonresponders. Peabody Journal of Education, 77, 64-84.
• Summarizes research on curriculum-based measurement (CBM) within four strands: studies demonstrating the psychometric tenability of CBM; work showing how teachers can use CBM to inform instructional planning; research examining CBM’s potential use in evaluating treatment effects; and work
5
summarizing CBM’s contribution to identifying children who fail to profit from otherwise effective instruction.
Fuchs, L.S., Fuchs, D., & Hamlett, C.L. (1993). Technological advances linking the assessment of students’ academic proficiency to instructional planning. Journal of Special Education Technology, 12, 49-62.
• Summarizes the program of research conducted on computer applications to CBM.
Fuchs, L.S., Fuchs, D., & Hamlett, C.L. (1994). Strengthening the connection between assessment and instructional planning with expert systems. Exceptional Children, 61, 138-146.
• Summarizes the program of research conducted on expert systems used in conjunction with CBM to enhance teachers’ capacity to use classroom-based assessment to improve planning and increase student learning.
Fuchs, L.S., Fuchs, D., & Hamlett, C.L. (in press). Using technology to facilitate and enhance curriculum-based measurement. In K. Higgins, R. Boone, & D. Edyburn (Eds.), The Handbook of Special Education Technology Research and Practice. Knowledge by Design, Inc.: Whitefish Bay, WI.
• Describes a research program conducted over the past 18 years to examine how CBM technology can be used to enhance implementation.
Fuchs, L.S., Fuchs, D., Hamlett, C.L., Phillips, N.B., & Karns, K. (1995). General educators’ specialized adaptation for students with learning disabilities. Exceptional Children, 61, 440-459.
• Reports a study that examined general educators’ specialized adaptation for students with learning disabilities, in conjunction with peer-assisted learning strategies and curriculum-based measurement; findings revealed that (a) teachers who were provided with support to implement adaptations engaged differentially in specialized adaptation, and their thinking about how they planned for their students with LD changed and (b) although some teachers implemented substantively important, individually tailored adjustments, others relied on adaptations that were uninventive and limited.
Fuchs, L.S., Fuchs, D., Hamlett, C.L., & Stecker, P.M. (1991). Effects of curriculum-based measurement and consultation on teacher planning and student achievement in mathematics operations. American Educational Research Journal, 28, 617-641.
• Reports an experimental study contrasting CBM, CBM with expert systems, and standard treatment; results showed the importance of helping teachers translate classroom-based assessment information via instructional consultation.
Fuchs, L.S., Fuchs, D., Hamlett, C.L., Thompson, A., Roberts, P.H., Kubek, P., & Stecker, P.S. (1994). Technical features of a mathematics concepts and applications curriculum-based measurement system. Diagnostique, 19(4), 23-49.
6
• Reports a study investigating the reliability and validity of a CBM system focused on the concepts and applications mathematics curriculum; results supported the technical adequacy of the CBM graphed scores as well as the CBM diagnostic skills analysis.
Fuchs, L.S., Fuchs, D., Hamlett, C.L., Walz, L., & Germann, G. (1993). Formative evaluation of academic progress: How much growth can we expect? School Psychology Review, 22, 27-48.
• Reports normative information on CBM slopes in reading, spelling, and math expected for typically-developing students.
Fuchs, L.S., Fuchs, D., Hosp, M., & Hamlett, C.L. (2003). The potential for diagnostic analysis within curriculum-based measurement. Assessment for Effective Intervention, 28(3&4), 13-22.
• Describes recent efforts to develop a reading diagnostic analysis to be used in conjunction with CBM for informing teachers how to refocus their instruction to address individual needs.
Fuchs, L.S., Fuchs, D., Hosp, M., & Jenkins, J.R. (2001). Oral reading fluency as an indicator of reading competence: A theoretical, empirical, and historical analysis. Scientific Studies of Reading, 5, 239-256.
• Considers oral reading fluency as an indicator of overall reading competence. The authors examined theoretical arguments for supposing that oral reading fluency may reflect overall reading competence, reviewed several studies substantiating this phenomenon, and provided an historical analysis of the extent to which oral reading fluency has been incorporated into measurement approaches during the past century.
Fuchs, L.S., Fuchs, D., Karns, K., Hamlett, C.L., Dutka, S., & Katzaroff, M. (2000). The importance of providing background information on the structure and scoring of performance assessments. Applied Measurement in Education, 13, 83-121.
• Reports development of curriculum-based measurement problem-solving assessment system, reliability and validity data supporting use of that system, and effects of a study examining the effects of test-wiseness training on scores for low-, average-, and high-performing students.
Fuchs, L.S., Fuchs, D., Karns, K., Hamlett, C.L., Katzaroff, M., & Dutka, S. (1997). Effects of task-focused goals on low-achieving students with and without learning disabilities. American Educational Research Journal, 34(3), 513-544.
• Reports a study that examined the effects of a task-focused goals treatment in mathematics, using curriculum-based measurement. CBM students reported enjoying and benefiting from CBM, chose more challenging and a greater variety of learning topics, and increased their effort differentially. Increased effort, however, was associated with greater learning only for low achievers in TFG without learning disabilities.
7
Fuchs, L.S., Fuchs, D., Karns, K., Hamlett, C.L., & Katzaroff, M. (1999). Mathematics performance assessment in the classroom: Effects on teacher planning and student learning. American Educational Research Journal, 36(3), 609-646.
• Reports the findings of a study examining teachers’ use of a curriculum-based measurement problem-solving system. Teachers were assigned randomly to CBM or control conditions; teachers administered and scored three performance assessments at monthly intervals and planned instruction in response to the assessment feedback. Teachers’ knowledge of performance assessment, their curricular focus, and their instructional plans were described. Outcomes on three types of problem-solving assessments for low-, average-, and high-performing students were assessed.
Gersten, R., & Dimino, J. A. (2001). The realities of translating research into classroom practice. Learning Disabilities Research and Practice, 16, 120-130. Phillips, N.B., Hamlett, C.L., Fuchs, L.S., & Fuchs, D. (1993). Combining classwide curriculum-based measurement and peer tutoring to help general educators provide adaptive education. Learning Disabilities Research and Practice, 8, 148-156.
• Provides an overview of the math PALS methods for practitioners, with a brief summary of an efficacy study.
Stecker, P.M., & Fuchs, L.S. (2000). Effecting superior achievement using curriculum-based measurement: The importance of individual progress monitoring. Learning Disabilities Research and Practice, 15, 128-134.
• Examined the importance of designing students' programs based on individual progress-monitoring data, using curriculum-based measurement. Results indicate that students for whom teachers tailored instructional adjustments based on those students' own CBM data performed significantly better on a global achievement test than did their partners whose instructional adjustments were not based on their own assessment data
8
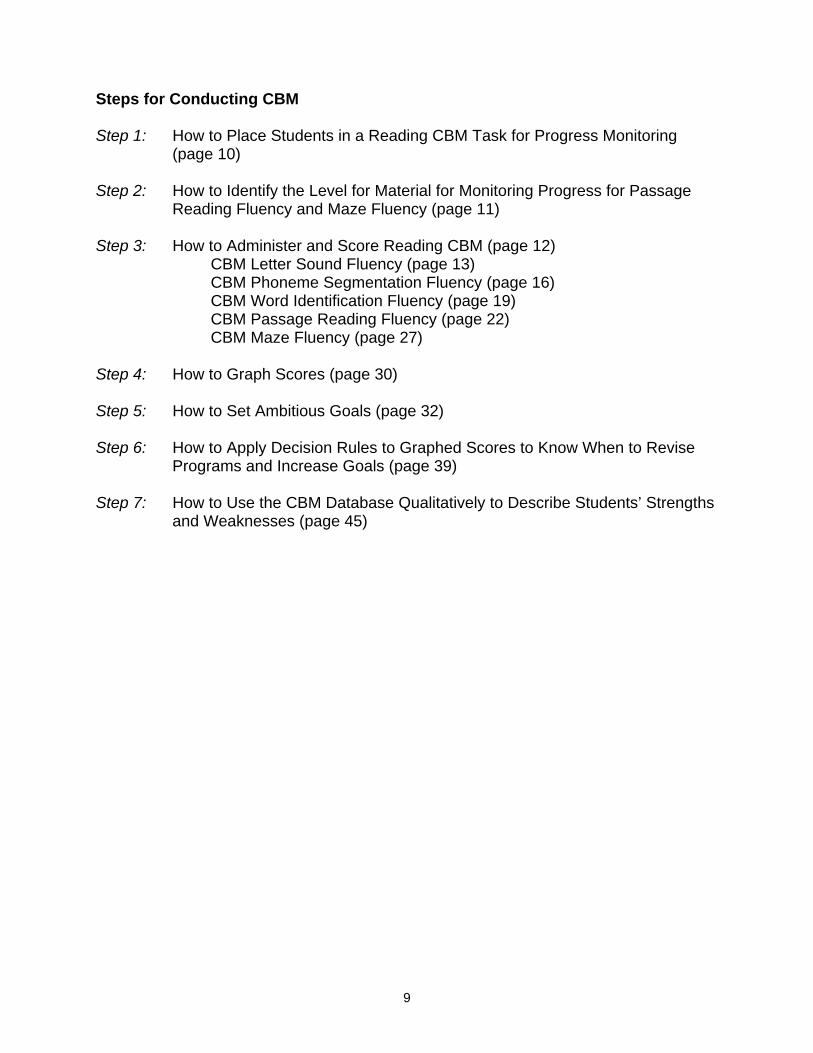
Steps for Conducting CBM Step 1: How to Place Students in a Reading CBM Task for Progress Monitoring (page 10) Step 2: How to Identify the Level for Material for Monitoring Progress for Passage Reading Fluency and Maze Fluency (page 11) Step 3: How to Administer and Score Reading CBM (page 12) CBM Letter Sound Fluency (page 13) CBM Phoneme Segmentation Fluency (page 16) CBM Word Identification Fluency (page 19) CBM Passage Reading Fluency (page 22) CBM Maze Fluency (page 27) Step 4: How to Graph Scores (page 30) Step 5: How to Set Ambitious Goals (page 32) Step 6: How to Apply Decision Rules to Graphed Scores to Know When to Revise Programs and Increase Goals (page 39) Step 7: How to Use the CBM Database Qualitatively to Describe Students’ Strengths and Weaknesses (page 45)
9
Step 1: How to Place Students in a Reading CBM Task for Progress Monitoring The first decision for implementing CBM in reading is to decide which task is developmentally appropriate for each reader to be monitored over the academic year. For students who are developing at a typical rate in reading, the correct CBM tasks are as follows: At Kindergarten, Letter Sound Fluency (or Phoneme Segmentation Fluency).
• Select Letter Sound Fluency if you are more interested in measuring students' progress toward decoding.
• Select Phoneme Segmentation Fluency if you are more interested in measuring students' progress toward phonological awareness.
At Grade 1, Word Identification Fluency.
At Grades 2-3, Passage Reading Fluency.
• See next section for determining which level of passages to use for progress monitoring.
At Grades 4-6, Maze Fluency.
• Use the guidelines in the next section for determining which level of passages to use for progress monitoring.
NOTE: Once you select a task for CBM progress monitoring (and for Passage Reading Fluency or Maze Fluency, a grade level of passages for progress monitoring), stick with that task (and level of passages) for the entire year.
10
Step 2: How to Identify the Level of Material for Monitoring Progress for Passage Reading Fluency and Maze Fluency For Passage Reading Fluency (PRF) and Maze Fluency, teachers use CBM passages written at the student’s current grade level. However, if a student is well below grade-level expectations, he or she may need to read from a lower grade-level passage. If teachers are worried that a student is too delayed in reading to make the grade-level passages appropriate, then find the appropriate CBM level by following these steps.
1. Determine the grade level text at which you expect the student to read
competently by year’s end. 2. Administer 3 passages at this level. Use generic CBM Passage Reading
Fluency (PRF) passages, not passages that teachers use for instruction.
If the student reads fewer than 10 correct words in 1 minute, use the CBM word identification fluency measure instead of CBM PRF or CBM Maze Fluency for progress monitoring.
If the student reads between 10 and 50 correct words in 1 minute but less than 85-90% correct, move to the next lower level of text and try 3 passages.
If the student reads more than 50 correct words in 1 minute, move to the highest level of text where he/she reads between 10 and 50 words correct in 1 minute (but not higher than the student’s grade-appropriate text).
3. Maintain the student on this level of text for the purpose of progress monitoring
for the entire school year.
11
Step 3: How to Administer and Score Reading CBM With Reading CBM, students read letters, isolated words, or passages within a 1-minute time span. The student has a “student copy” of the reading probe, and the teacher has an “examiner copy” of the same probe. The student reads out loud for 1 minute while the teacher marks student errors. The teacher calculates the number of letters or words read correctly and graphs this score on a student graph. The CBM score is a general overall indicator of the student’s reading competency (Fuchs, Fuchs, Hosp, & Jenkins, 2001). In reading, the following CBM tasks are available at these grade levels. Letter Sound Fluency (Kindergarten) Phoneme Segmentation Fluency (Kindergarten) Word Identification Fluency (Grade 1) Passage Reading Fluency (Grades 1-8) Maze Fluency (Grades 1-6) A description of each of these CBM tasks follows. Information on how to obtain the CBM materials for each task is available in Appendix A.
12
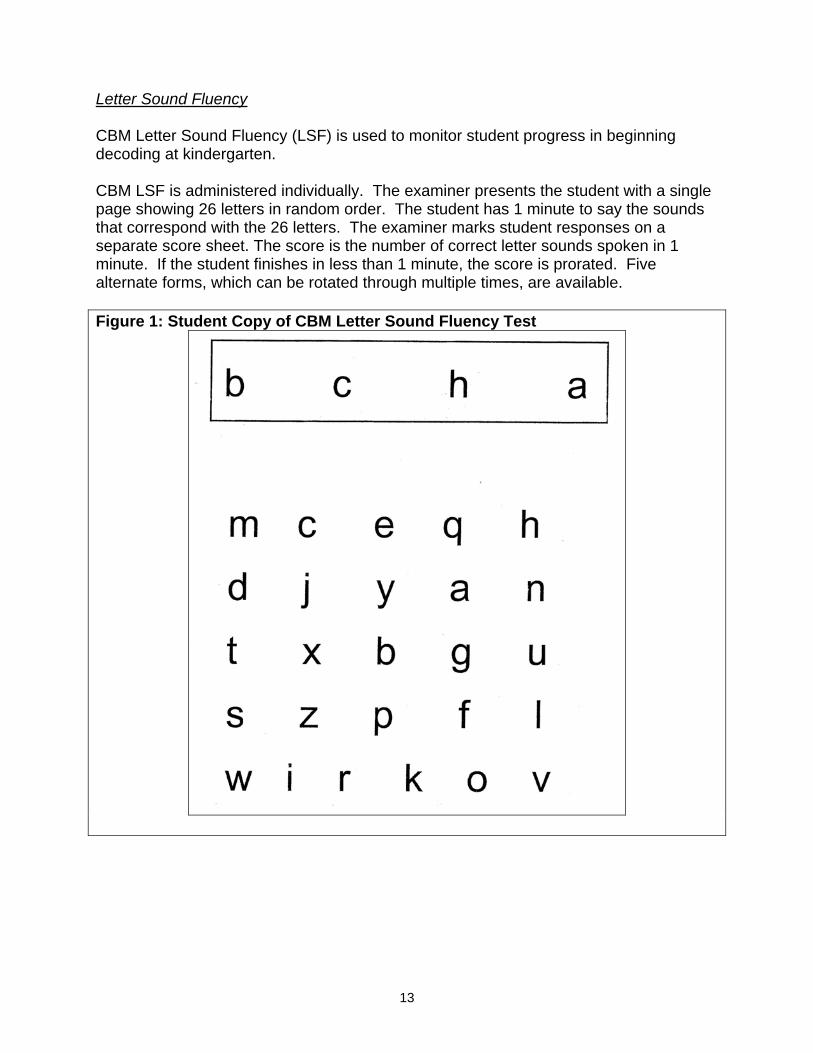
Letter Sound Fluency CBM Letter Sound Fluency (LSF) is used to monitor student progress in beginning decoding at kindergarten. CBM LSF is administered individually. The examiner presents the student with a single page showing 26 letters in random order. The student has 1 minute to say the sounds that correspond with the 26 letters. The examiner marks student responses on a separate score sheet. The score is the number of correct letter sounds spoken in 1 minute. If the student finishes in less than 1 minute, the score is prorated. Five alternate forms, which can be rotated through multiple times, are available. Figure 1: Student Copy of CBM Letter Sound Fluency Test
13
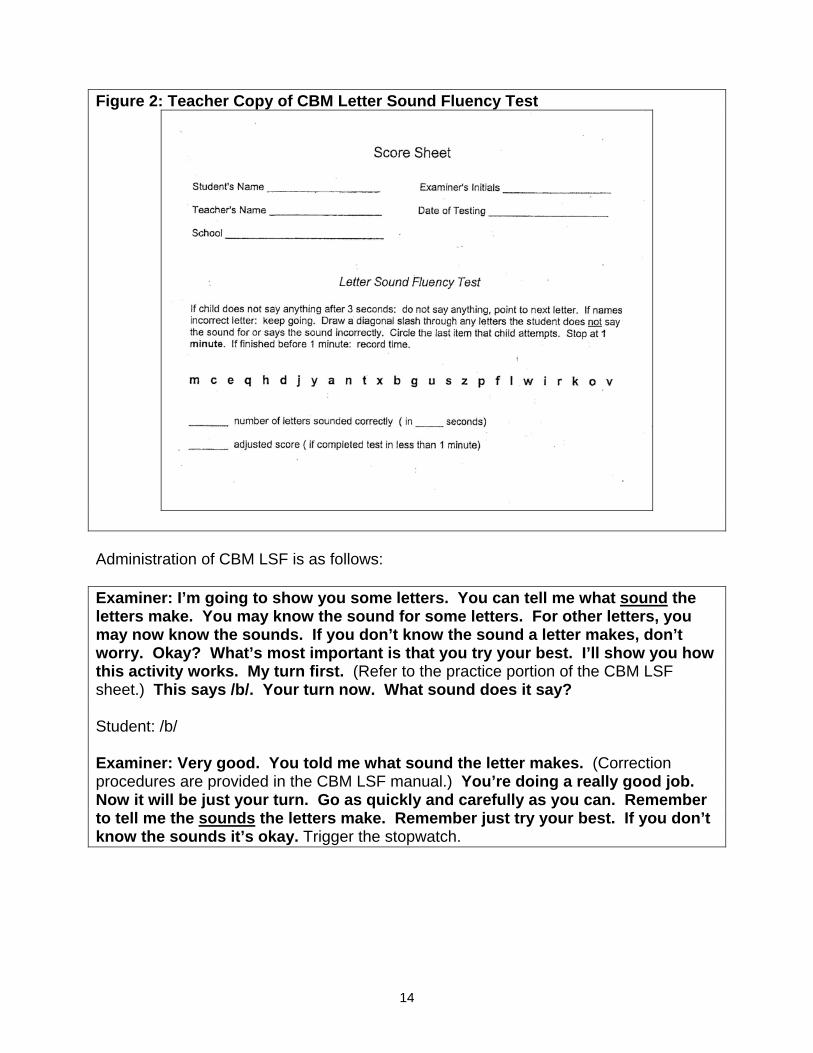
Figure 2: Teacher Copy of CBM Letter Sound Fluency Test
Administration of CBM LSF is as follows: Examiner: I’m going to show you some letters. You can tell me what sound the letters make. You may know the sound for some letters. For other letters, you may now know the sounds. If you don’t know the sound a letter makes, don’t worry. Okay? What’s most important is that you try your best. I’ll show you how this activity works. My turn first. (Refer to the practice portion of the CBM LSF sheet.) This says /b/. Your turn now. What sound does it say? Student: /b/ Examiner: Very good. You told me what sound the letter makes. (Correction procedures are provided in the CBM LSF manual.) You’re doing a really good job. Now it will be just your turn. Go as quickly and carefully as you can. Remember to tell me the sounds the letters make. Remember just try your best. If you don’t know the sounds it’s okay. Trigger the stopwatch.
14
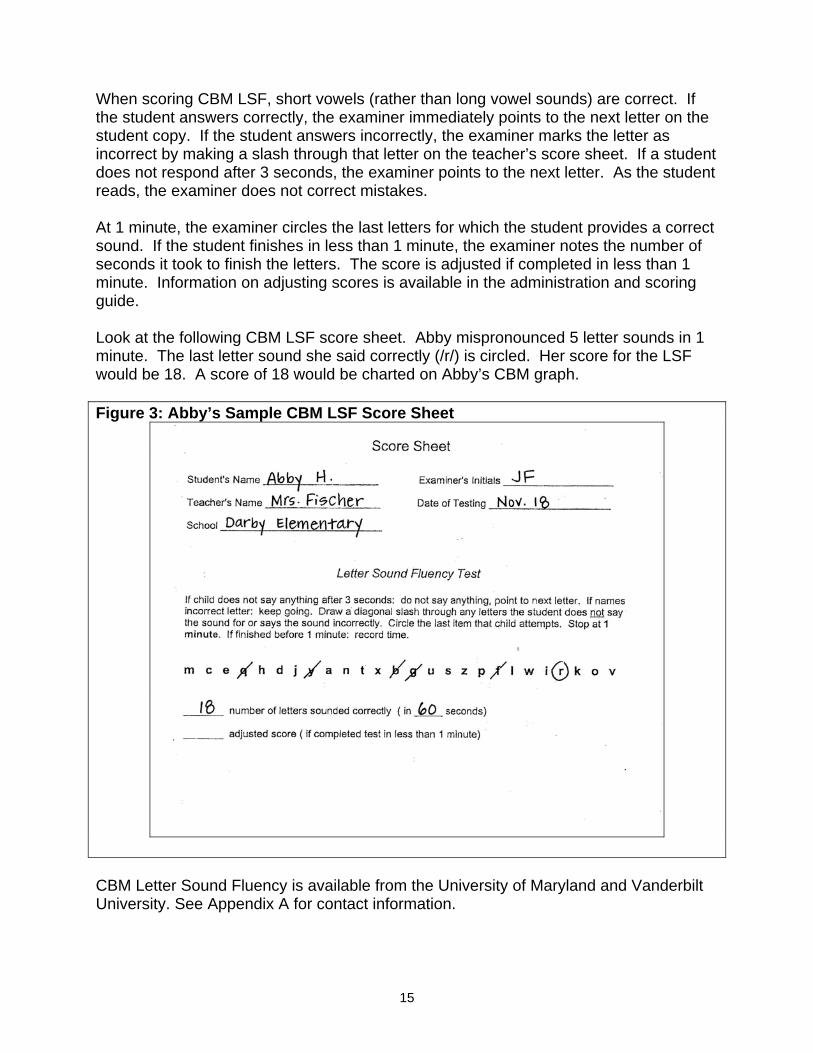
When scoring CBM LSF, short vowels (rather than long vowel sounds) are correct. If the student answers correctly, the examiner immediately points to the next letter on the student copy. If the student answers incorrectly, the examiner marks the letter as incorrect by making a slash through that letter on the teacher’s score sheet. If a student does not respond after 3 seconds, the examiner points to the next letter. As the student reads, the examiner does not correct mistakes. At 1 minute, the examiner circles the last letters for which the student provides a correct sound. If the student finishes in less than 1 minute, the examiner notes the number of seconds it took to finish the letters. The score is adjusted if completed in less than 1 minute. Information on adjusting scores is available in the administration and scoring guide. Look at the following CBM LSF score sheet. Abby mispronounced 5 letter sounds in 1 minute. The last letter sound she said correctly (/r/) is circled. Her score for the LSF would be 18. A score of 18 would be charted on Abby’s CBM graph. Figure 3: Abby’s Sample CBM LSF Score Sheet
CBM Letter Sound Fluency is available from the University of Maryland and Vanderbilt University. See Appendix A for contact information.
15
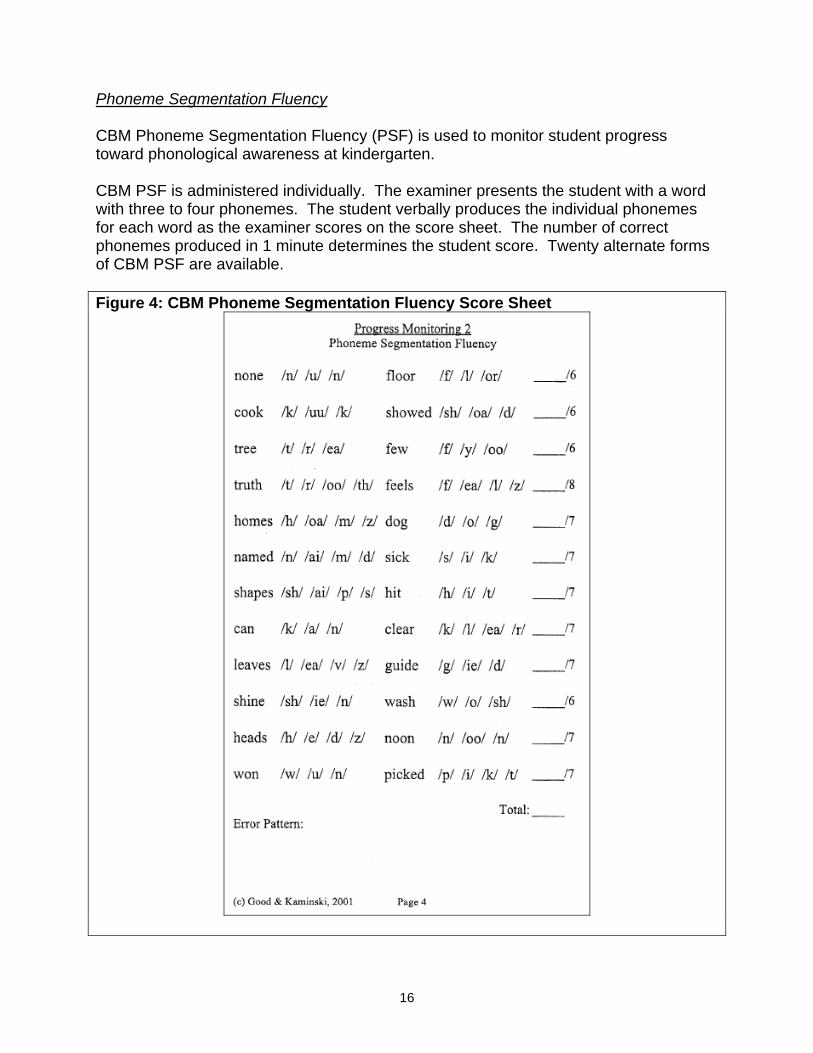
Phoneme Segmentation Fluency CBM Phoneme Segmentation Fluency (PSF) is used to monitor student progress toward phonological awareness at kindergarten. CBM PSF is administered individually. The examiner presents the student with a word with three to four phonemes. The student verbally produces the individual phonemes for each word as the examiner scores on the score sheet. The number of correct phonemes produced in 1 minute determines the student score. Twenty alternate forms of CBM PSF are available. Figure 4: CBM Phoneme Segmentation Fluency Score Sheet
16
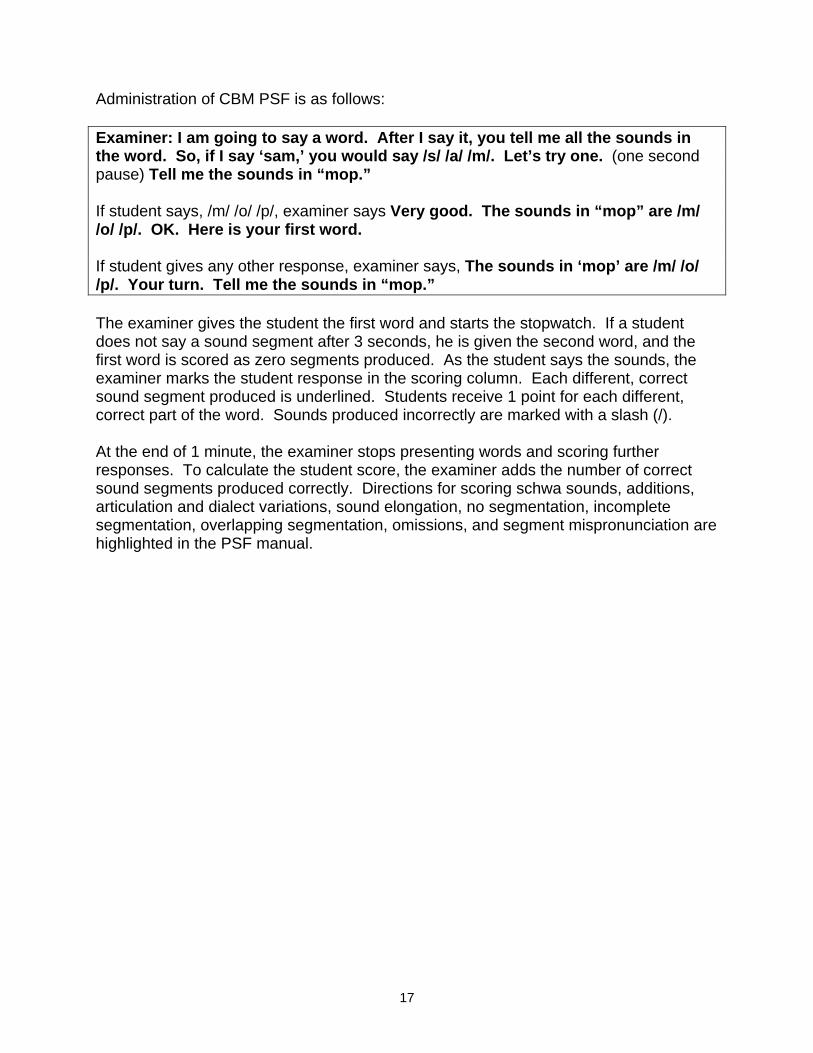
Administration of CBM PSF is as follows: Examiner: I am going to say a word. After I say it, you tell me all the sounds in the word. So, if I say ‘sam,’ you would say /s/ /a/ /m/. Let’s try one. (one second pause) Tell me the sounds in “mop.” If student says, /m/ /o/ /p/, examiner says Very good. The sounds in “mop” are /m/ /o/ /p/. OK. Here is your first word. If student gives any other response, examiner says, The sounds in ‘mop’ are /m/ /o/ /p/. Your turn. Tell me the sounds in “mop.” The examiner gives the student the first word and starts the stopwatch. If a student does not say a sound segment after 3 seconds, he is given the second word, and the first word is scored as zero segments produced. As the student says the sounds, the examiner marks the student response in the scoring column. Each different, correct sound segment produced is underlined. Students receive 1 point for each different, correct part of the word. Sounds produced incorrectly are marked with a slash (/). At the end of 1 minute, the examiner stops presenting words and scoring further responses. To calculate the student score, the examiner adds the number of correct sound segments produced correctly. Directions for scoring schwa sounds, additions, articulation and dialect variations, sound elongation, no segmentation, incomplete segmentation, overlapping segmentation, omissions, and segment mispronunciation are highlighted in the PSF manual.
17
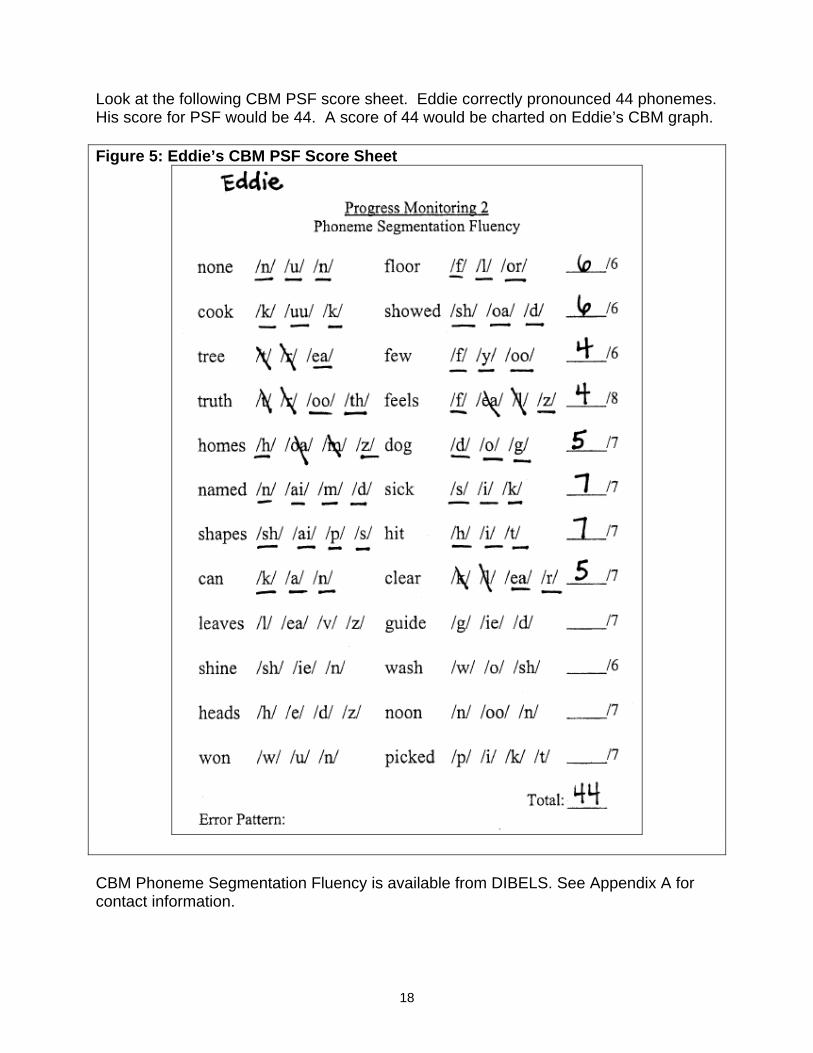
Look at the following CBM PSF score sheet. Eddie correctly pronounced 44 phonemes. His score for PSF would be 44. A score of 44 would be charted on Eddie’s CBM graph. Figure 5: Eddie’s CBM PSF Score Sheet
CBM Phoneme Segmentation Fluency is available from DIBELS. See Appendix A for contact information.
18
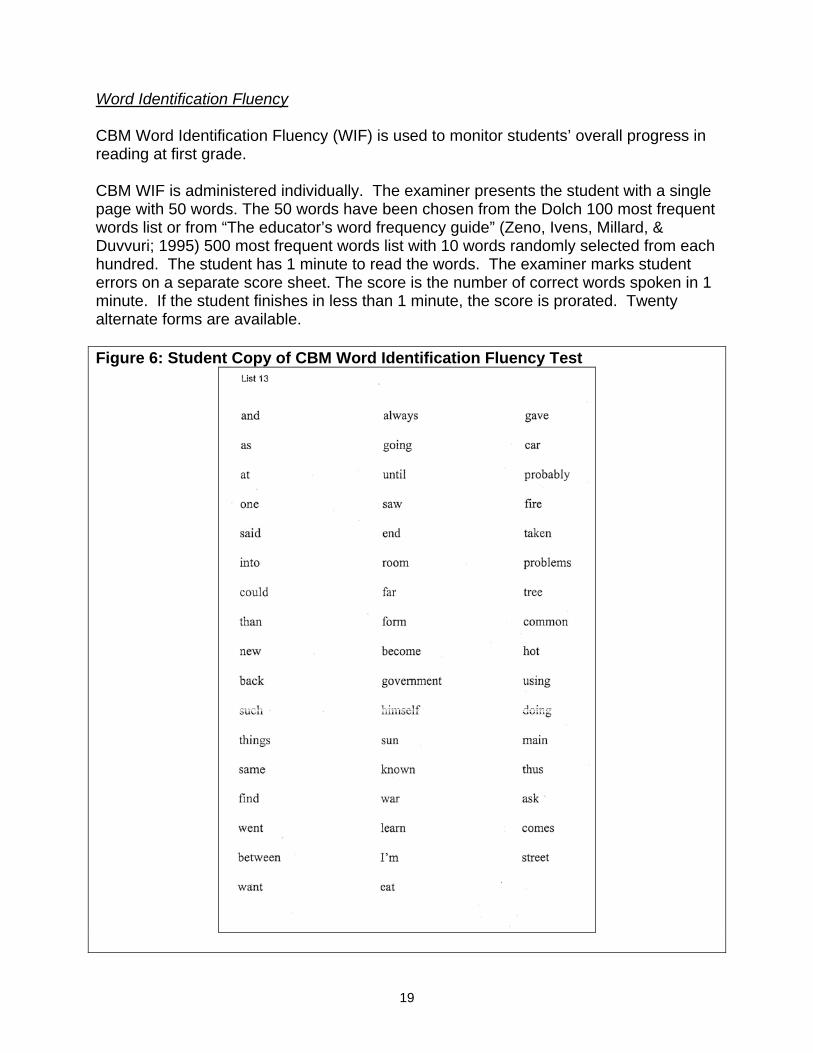
Word Identification Fluency CBM Word Identification Fluency (WIF) is used to monitor students’ overall progress in reading at first grade. CBM WIF is administered individually. The examiner presents the student with a single page with 50 words. The 50 words have been chosen from the Dolch 100 most frequent words list or from “The educator’s word frequency guide” (Zeno, Ivens, Millard, & Duvvuri; 1995) 500 most frequent words list with 10 words randomly selected from each hundred. The student has 1 minute to read the words. The examiner marks student errors on a separate score sheet. The score is the number of correct words spoken in 1 minute. If the student finishes in less than 1 minute, the score is prorated. Twenty alternate forms are available. Figure 6: Student Copy of CBM Word Identification Fluency Test
19
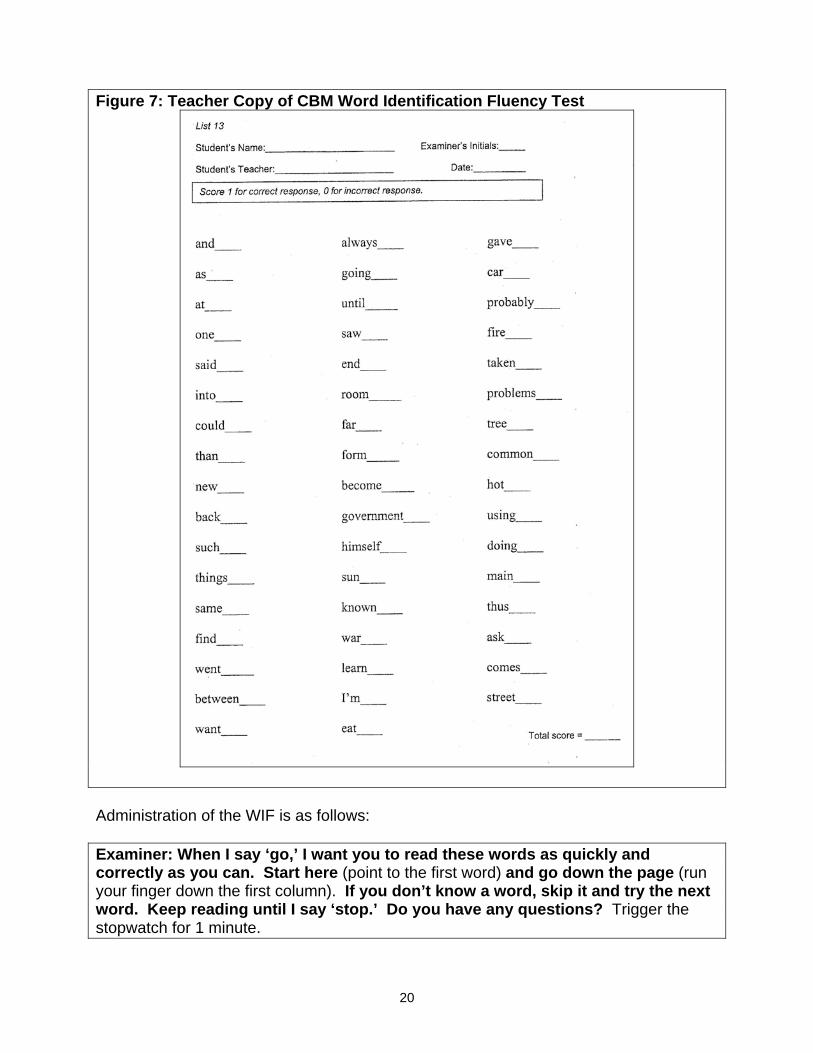
Figure 7: Teacher Copy of CBM Word Identification Fluency Test
Administration of the WIF is as follows: Examiner: When I say ‘go,’ I want you to read these words as quickly and correctly as you can. Start here (point to the first word) and go down the page (run your finger down the first column). If you don’t know a word, skip it and try the next word. Keep reading until I say ‘stop.’ Do you have any questions? Trigger the stopwatch for 1 minute.
20
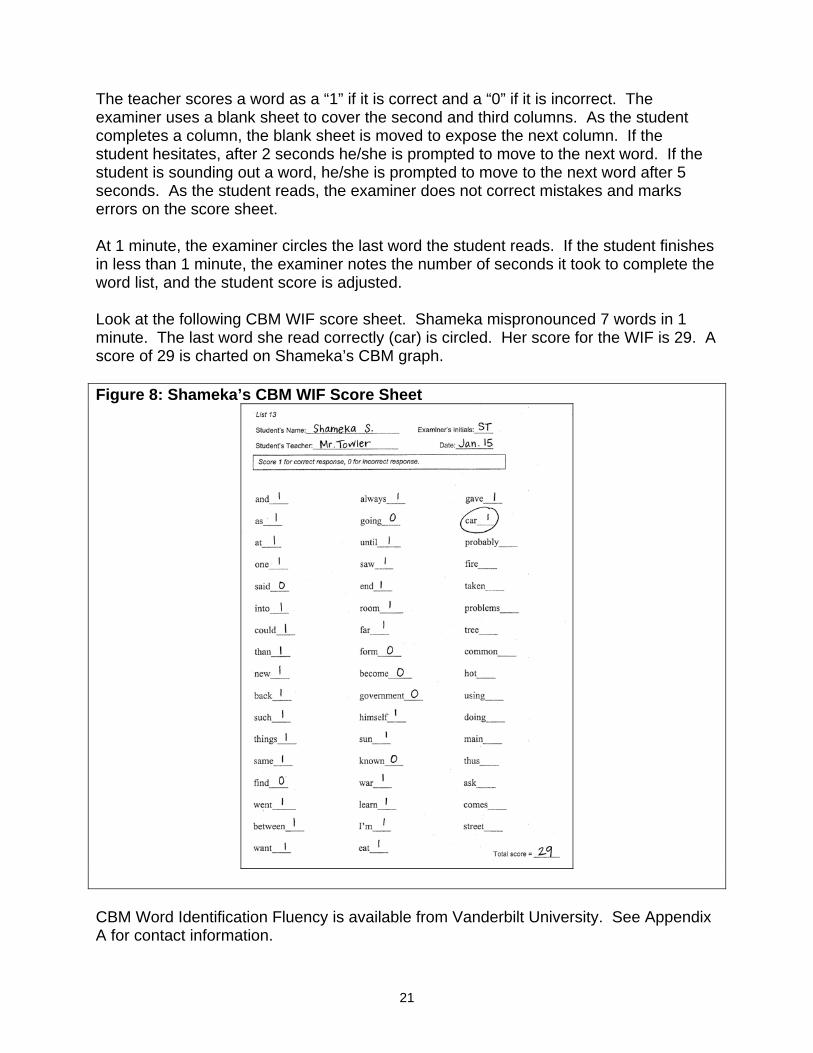
The teacher scores a word as a “1” if it is correct and a “0” if it is incorrect. The examiner uses a blank sheet to cover the second and third columns. As the student completes a column, the blank sheet is moved to expose the next column. If the student hesitates, after 2 seconds he/she is prompted to move to the next word. If the student is sounding out a word, he/she is prompted to move to the next word after 5 seconds. As the student reads, the examiner does not correct mistakes and marks errors on the score sheet. At 1 minute, the examiner circles the last word the student reads. If the student finishes in less than 1 minute, the examiner notes the number of seconds it took to complete the word list, and the student score is adjusted. Look at the following CBM WIF score sheet. Shameka mispronounced 7 words in 1 minute. The last word she read correctly (car) is circled. Her score for the WIF is 29. A score of 29 is charted on Shameka’s CBM graph. Figure 8: Shameka’s CBM WIF Score Sheet
CBM Word Identification Fluency is available from Vanderbilt University. See Appendix A for contact information.
21
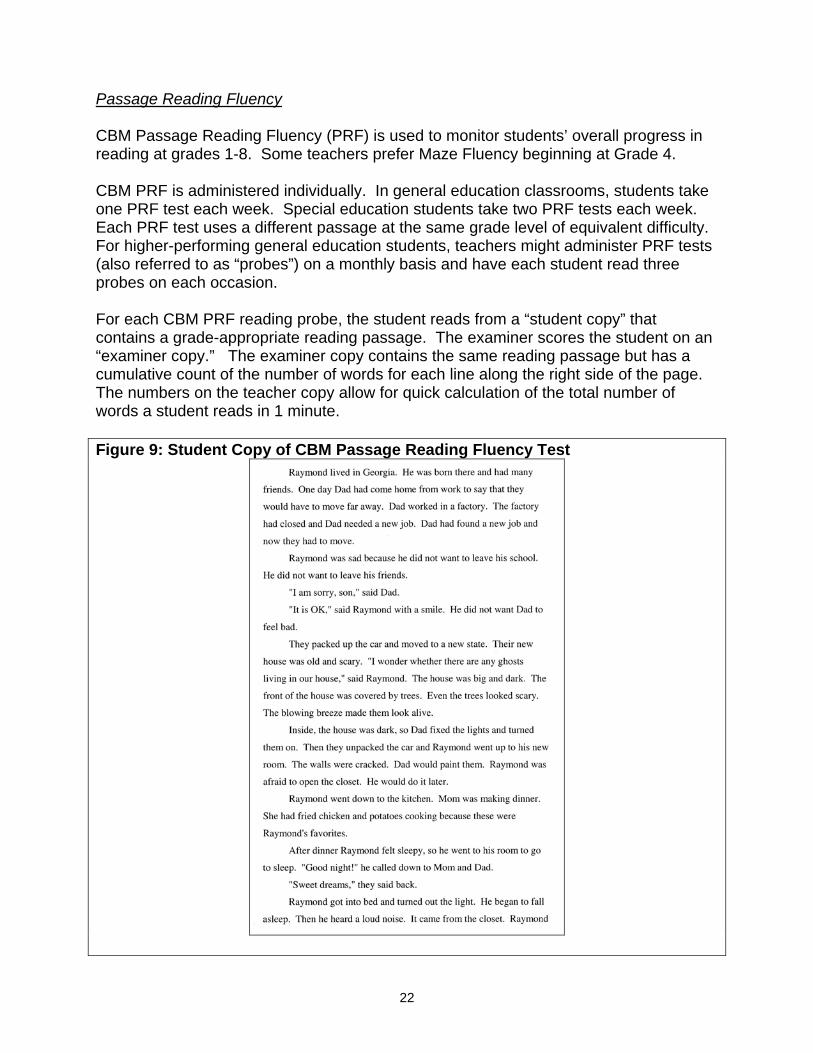
Passage Reading Fluency CBM Passage Reading Fluency (PRF) is used to monitor students’ overall progress in reading at grades 1-8. Some teachers prefer Maze Fluency beginning at Grade 4. CBM PRF is administered individually. In general education classrooms, students take one PRF test each week. Special education students take two PRF tests each week. Each PRF test uses a different passage at the same grade level of equivalent difficulty. For higher-performing general education students, teachers might administer PRF tests (also referred to as “probes”) on a monthly basis and have each student read three probes on each occasion. For each CBM PRF reading probe, the student reads from a “student copy” that contains a grade-appropriate reading passage. The examiner scores the student on an “examiner copy.” The examiner copy contains the same reading passage but has a cumulative count of the number of words for each line along the right side of the page. The numbers on the teacher copy allow for quick calculation of the total number of words a student reads in 1 minute. Figure 9: Student Copy of CBM Passage Reading Fluency Test
22
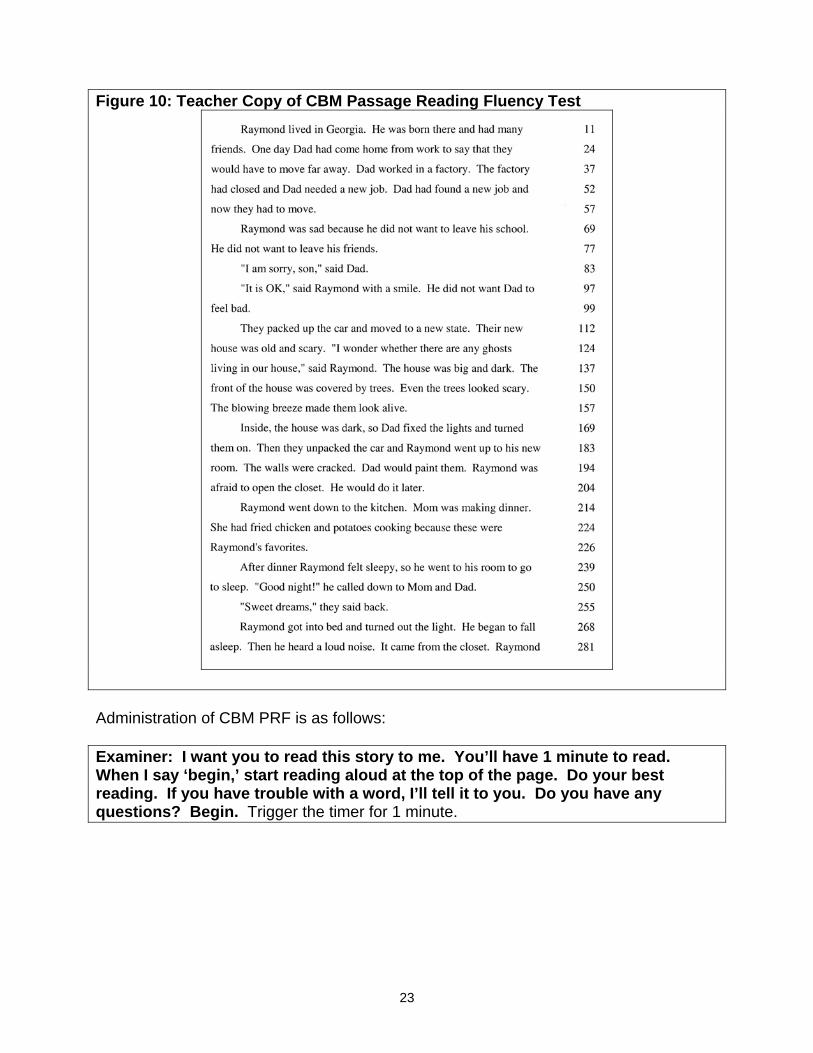
Figure 10: Teacher Copy of CBM Passage Reading Fluency Test
Administration of CBM PRF is as follows: Examiner: I want you to read this story to me. You’ll have 1 minute to read. When I say ‘begin,’ start reading aloud at the top of the page. Do your best reading. If you have trouble with a word, I’ll tell it to you. Do you have any questions? Begin. Trigger the timer for 1 minute.
23
The examiner marks each student error with a slash (/). At the end of 1 minute, the last word read is marked with a bracket (]). If a student skips an entire line of a reading passage, a straight line is drawn through the skipped line. When scoring CBM probes, the teacher identifies the count for the last word read in 1 minute and the total number of errors. The teacher then subtracts errors from the total number of words to calculate the student score. There are a few scoring guidelines to follow when administering reading CBM probes. Repetitions (words said over again), self-corrections (words misread, but corrected within 3 seconds), insertions (words added to passage), and dialectical difference (variations in pronunciation that conform to local language norms) are all scored as correct. Mispronunciations, word substitutions, omitted words, hesitations (words not pronounced within 3 seconds), and reversals (two or more words transposed) are all scored as errors. Numerals are counted as words and must be read correctly within the context of the passage. With hyphenated words, each morpheme separated by a hyphen(s) is counted as a word if it can stand alone on its own (e.g., Open-faced is scored as two words but re-enter is scored as one word). Abbreviations are counted as words and must be read correctly within the context of the sentence. As teachers listen to students read, they can note the types of decoding errors that students make, the kinds of decoding strategies students use to decipher unknown words, how miscues reflect students’ reliance on graphic, semantic, or syntactic language features, and how self-corrections, pacing, and scanning reveal strategies used in the reading process (Fuchs, Fuchs, Hosp, & Jenkins, 2001). Teachers can use these more qualitative descriptions of a student’s reading performance to identify methods to strengthen the instructional program for each student. More information about noting student decoding errors is covered under “Step 7: How to Use the Database Qualitatively to Describe Student Strengths and Weaknesses.”
24
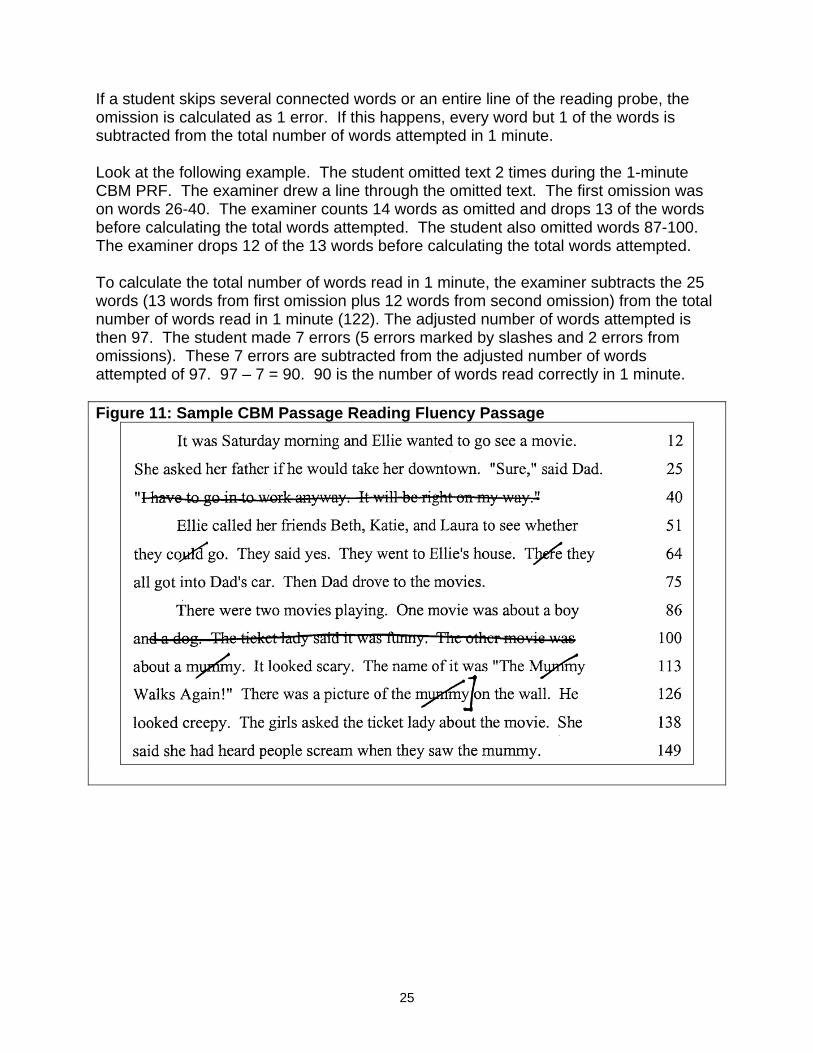
If a student skips several connected words or an entire line of the reading probe, the omission is calculated as 1 error. If this happens, every word but 1 of the words is subtracted from the total number of words attempted in 1 minute. Look at the following example. The student omitted text 2 times during the 1-minute CBM PRF. The examiner drew a line through the omitted text. The first omission was on words 26-40. The examiner counts 14 words as omitted and drops 13 of the words before calculating the total words attempted. The student also omitted words 87-100. The examiner drops 12 of the 13 words before calculating the total words attempted. To calculate the total number of words read in 1 minute, the examiner subtracts the 25 words (13 words from first omission plus 12 words from second omission) from the total number of words read in 1 minute (122). The adjusted number of words attempted is then 97. The student made 7 errors (5 errors marked by slashes and 2 errors from omissions). These 7 errors are subtracted from the adjusted number of words attempted of 97. 97 – 7 = 90. 90 is the number of words read correctly in 1 minute. Figure 11: Sample CBM Passage Reading Fluency Passage
25
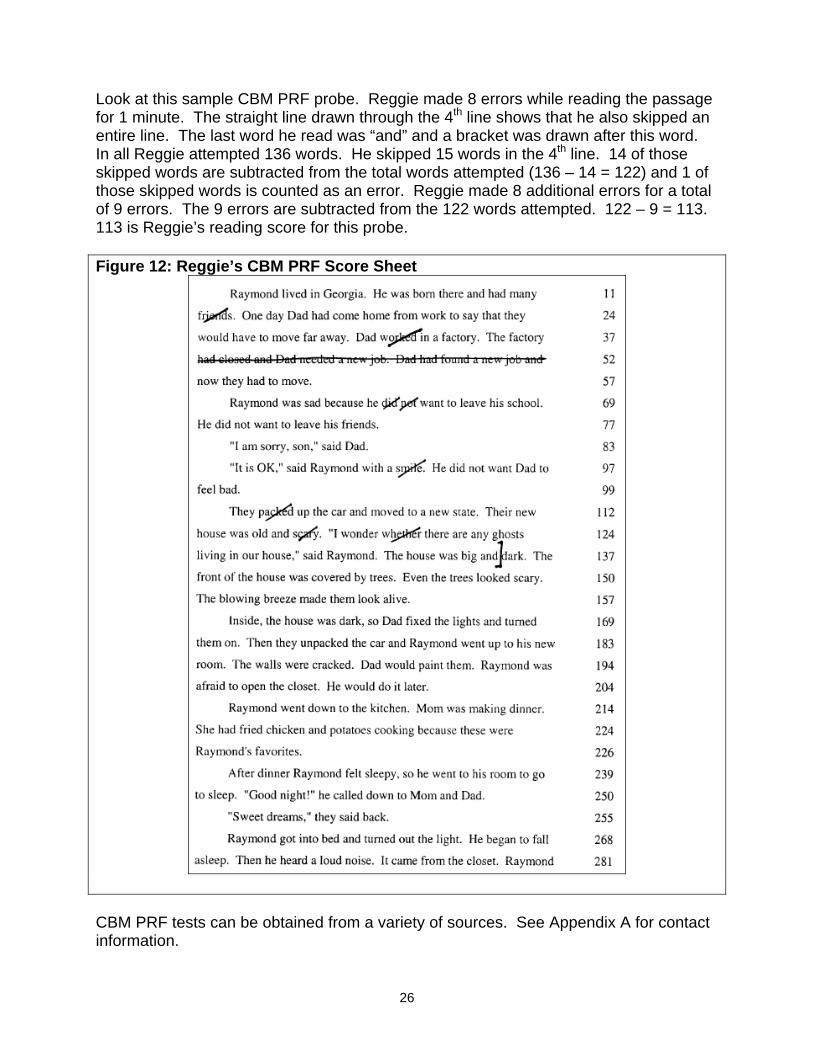
Look at this sample CBM PRF probe. Reggie made 8 errors while reading the passage for 1 minute. The straight line drawn through the 4th line shows that he also skipped an entire line. The last word he read was “and” and a bracket was drawn after this word. In all Reggie attempted 136 words. He skipped 15 words in the 4th line. 14 of those skipped words are subtracted from the total words attempted (136 – 14 = 122) and 1 of those skipped words is counted as an error. Reggie made 8 additional errors for a total of 9 errors. The 9 errors are subtracted from the 122 words attempted. 122 – 9 = 113. 113 is Reggie’s reading score for this probe. Figure 12: Reggie’s CBM PRF Score Sheet
CBM PRF tests can be obtained from a variety of sources. See Appendix A for contact information.
26
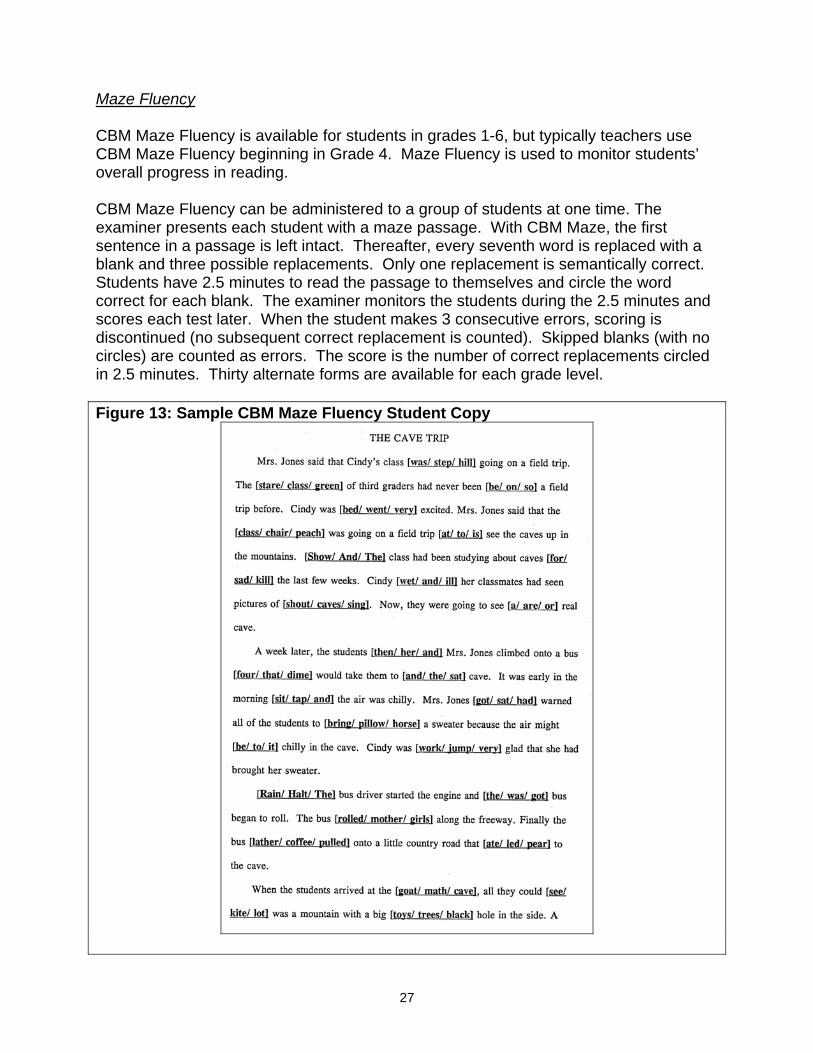
Maze Fluency CBM Maze Fluency is available for students in grades 1-6, but typically teachers use CBM Maze Fluency beginning in Grade 4. Maze Fluency is used to monitor students’ overall progress in reading. CBM Maze Fluency can be administered to a group of students at one time. The examiner presents each student with a maze passage. With CBM Maze, the first sentence in a passage is left intact. Thereafter, every seventh word is replaced with a blank and three possible replacements. Only one replacement is semantically correct. Students have 2.5 minutes to read the passage to themselves and circle the word correct for each blank. The examiner monitors the students during the 2.5 minutes and scores each test later. When the student makes 3 consecutive errors, scoring is discontinued (no subsequent correct replacement is counted). Skipped blanks (with no circles) are counted as errors. The score is the number of correct replacements circled in 2.5 minutes. Thirty alternate forms are available for each grade level. Figure 13: Sample CBM Maze Fluency Student Copy
27
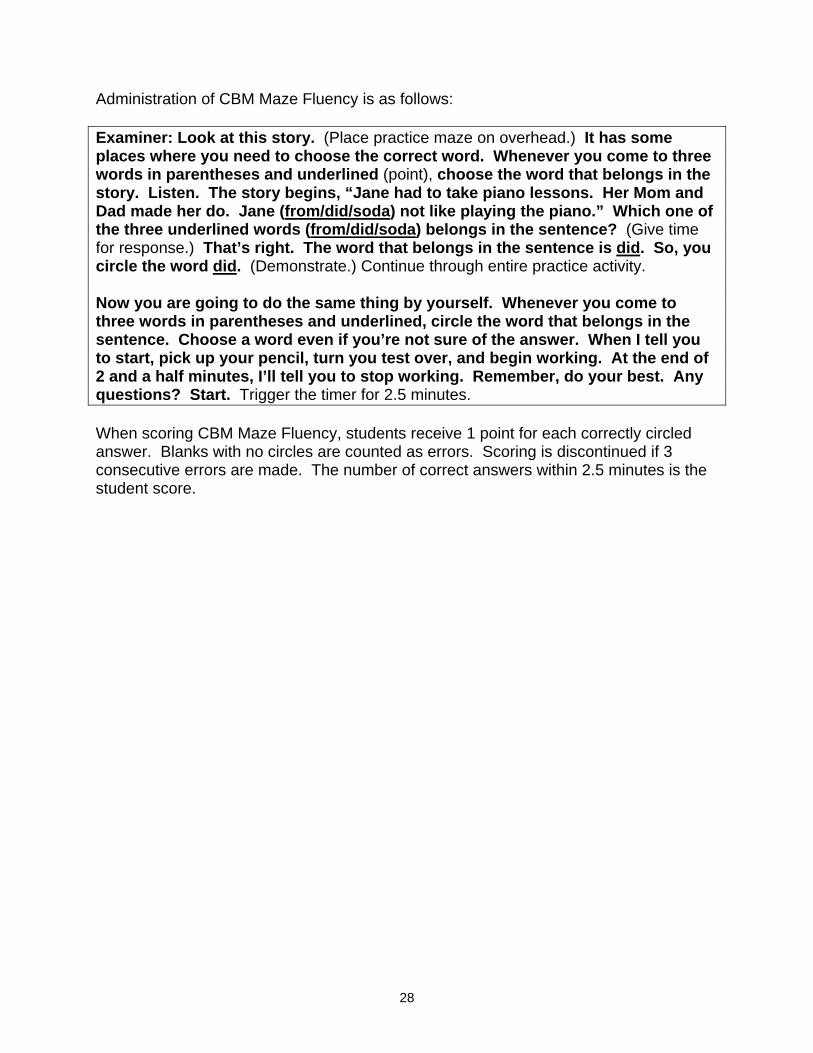
Administration of CBM Maze Fluency is as follows: Examiner: Look at this story. (Place practice maze on overhead.) It has some places where you need to choose the correct word. Whenever you come to three words in parentheses and underlined (point), choose the word that belongs in the story. Listen. The story begins, “Jane had to take piano lessons. Her Mom and Dad made her do. Jane (from/did/soda) not like playing the piano.” Which one of the three underlined words (from/did/soda) belongs in the sentence? (Give time for response.) That’s right. The word that belongs in the sentence is did. So, you circle the word did. (Demonstrate.) Continue through entire practice activity. Now you are going to do the same thing by yourself. Whenever you come to three words in parentheses and underlined, circle the word that belongs in the sentence. Choose a word even if you’re not sure of the answer. When I tell you to start, pick up your pencil, turn you test over, and begin working. At the end of 2 and a half minutes, I’ll tell you to stop working. Remember, do your best. Any questions? Start. Trigger the timer for 2.5 minutes. When scoring CBM Maze Fluency, students receive 1 point for each correctly circled answer. Blanks with no circles are counted as errors. Scoring is discontinued if 3 consecutive errors are made. The number of correct answers within 2.5 minutes is the student score.
28
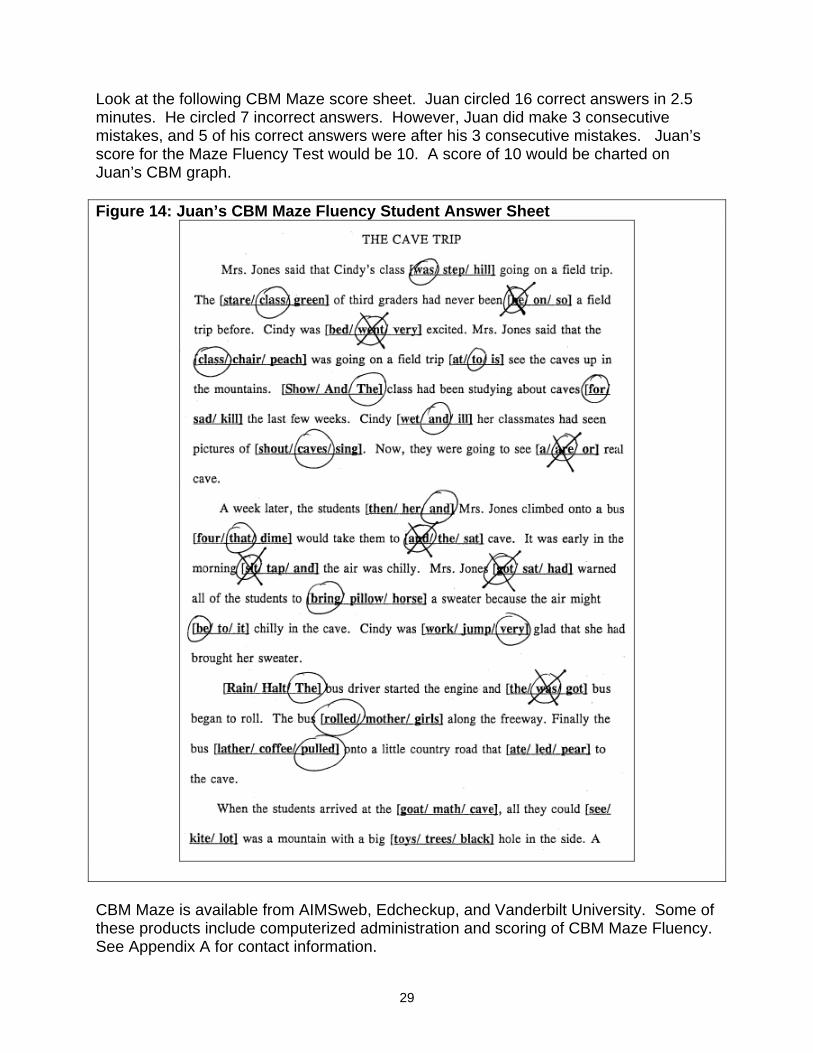
Look at the following CBM Maze score sheet. Juan circled 16 correct answers in 2.5 minutes. He circled 7 incorrect answers. However, Juan did make 3 consecutive mistakes, and 5 of his correct answers were after his 3 consecutive mistakes. Juan’s score for the Maze Fluency Test would be 10. A score of 10 would be charted on Juan’s CBM graph. Figure 14: Juan’s CBM Maze Fluency Student Answer Sheet
CBM Maze is available from AIMSweb, Edcheckup, and Vanderbilt University. Some of these products include computerized administration and scoring of CBM Maze Fluency. See Appendix A for contact information.
29
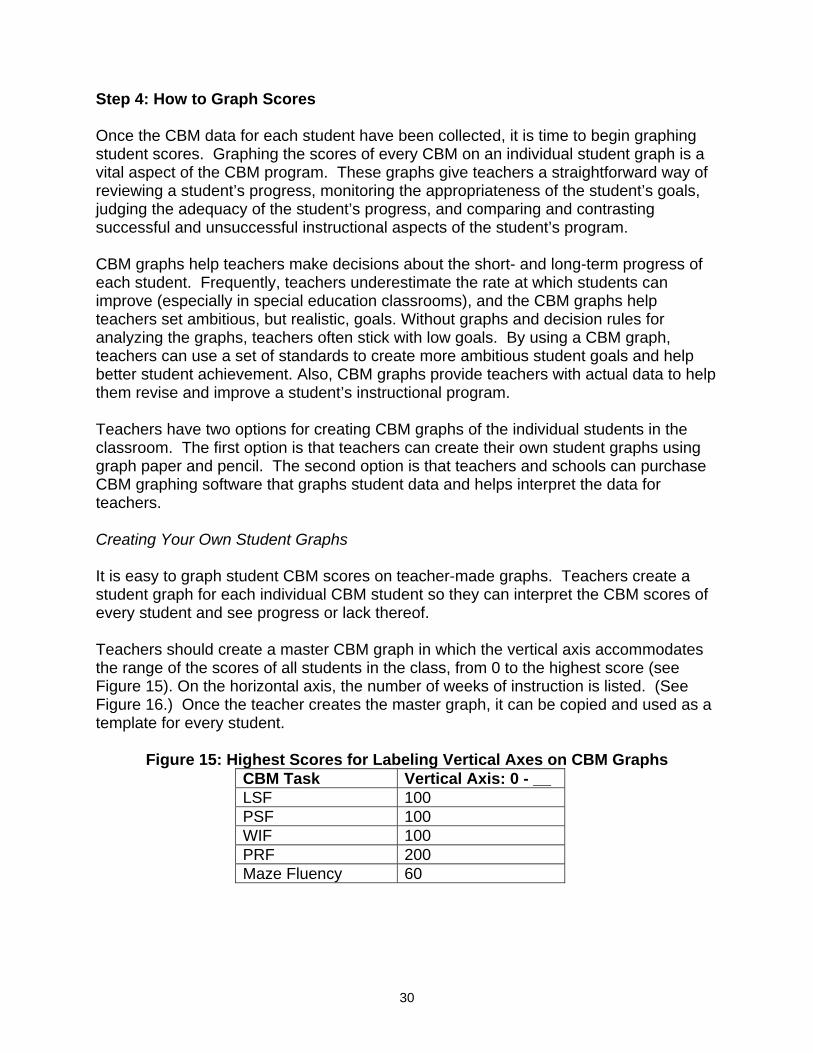
Step 4: How to Graph Scores Once the CBM data for each student have been collected, it is time to begin graphing student scores. Graphing the scores of every CBM on an individual student graph is a vital aspect of the CBM program. These graphs give teachers a straightforward way of reviewing a student’s progress, monitoring the appropriateness of the student’s goals, judging the adequacy of the student’s progress, and comparing and contrasting successful and unsuccessful instructional aspects of the student’s program. CBM graphs help teachers make decisions about the short- and long-term progress of each student. Frequently, teachers underestimate the rate at which students can improve (especially in special education classrooms), and the CBM graphs help teachers set ambitious, but realistic, goals. Without graphs and decision rules for analyzing the graphs, teachers often stick with low goals. By using a CBM graph, teachers can use a set of standards to create more ambitious student goals and help better student achievement. Also, CBM graphs provide teachers with actual data to help them revise and improve a student’s instructional program. Teachers have two options for creating CBM graphs of the individual students in the classroom. The first option is that teachers can create their own student graphs using graph paper and pencil. The second option is that teachers and schools can purchase CBM graphing software that graphs student data and helps interpret the data for teachers. Creating Your Own Student Graphs It is easy to graph student CBM scores on teacher-made graphs. Teachers create a student graph for each individual CBM student so they can interpret the CBM scores of every student and see progress or lack thereof. Teachers should create a master CBM graph in which the vertical axis accommodates the range of the scores of all students in the class, from 0 to the highest score (see Figure 15). On the horizontal axis, the number of weeks of instruction is listed. (See Figure 16.) Once the teacher creates the master graph, it can be copied and used as a template for every student.
Figure 15: Highest Scores for Labeling Vertical Axes on CBM Graphs CBM Task Vertical Axis: 0 - __ LSF 100 PSF 100 WIF 100 PRF 200 Maze Fluency 60
30
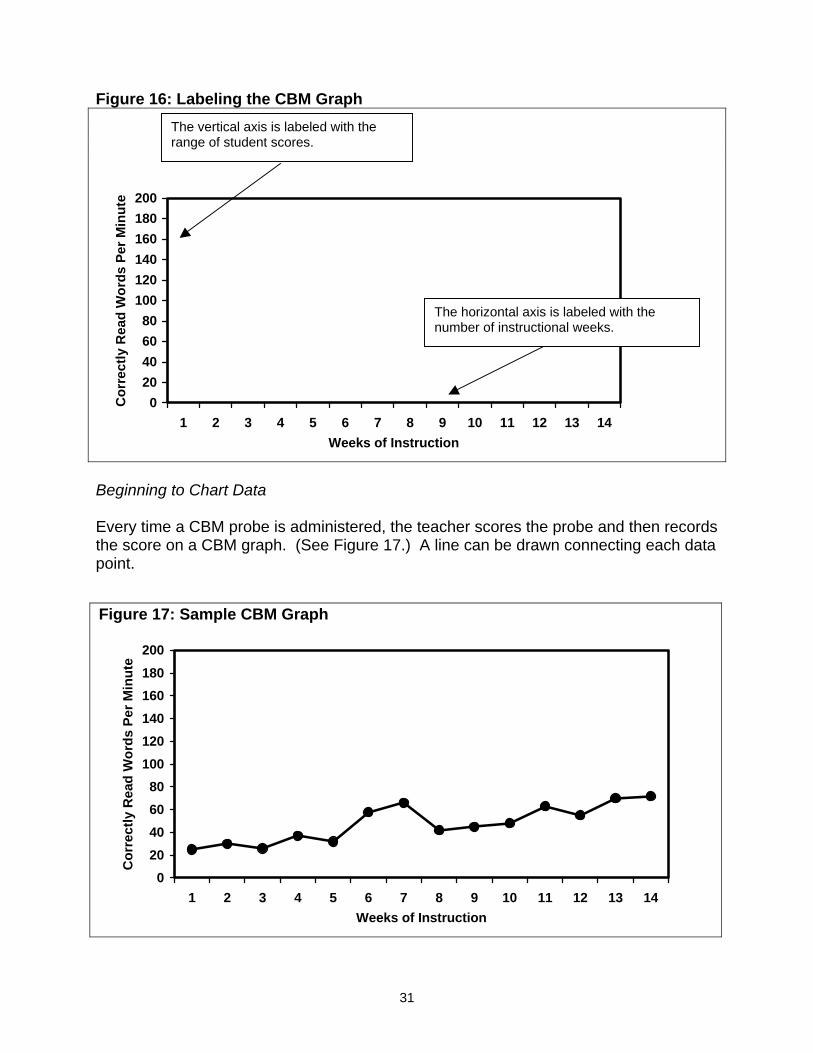
Figure 16: Labeling the CBM Graph
020406080
100120140160180200
1 2 3 4 5 6 7 8 9 10 11 12 13 14Weeks of Instruction
Cor
rect
ly R
ead
Wor
ds P
er M
inut
e
The vertical axis is labeled with the range of student scores.
The horizontal axis is labeled with the number of instructional weeks.
Beginning to Chart Data Every time a CBM probe is administered, the teacher scores the probe and then records the score on a CBM graph. (See Figure 17.) A line can be drawn connecting each data point.
Figure 17: Sample CBM GraphStep 5: How to Set Ambitious Goals
020406080
100120140160180200
1 2 3 4 5 6 7 8 9 10 11 12 13 14Weeks of Instruction
Cor
rect
ly R
ead
Wor
ds P
er M
inut
e
31
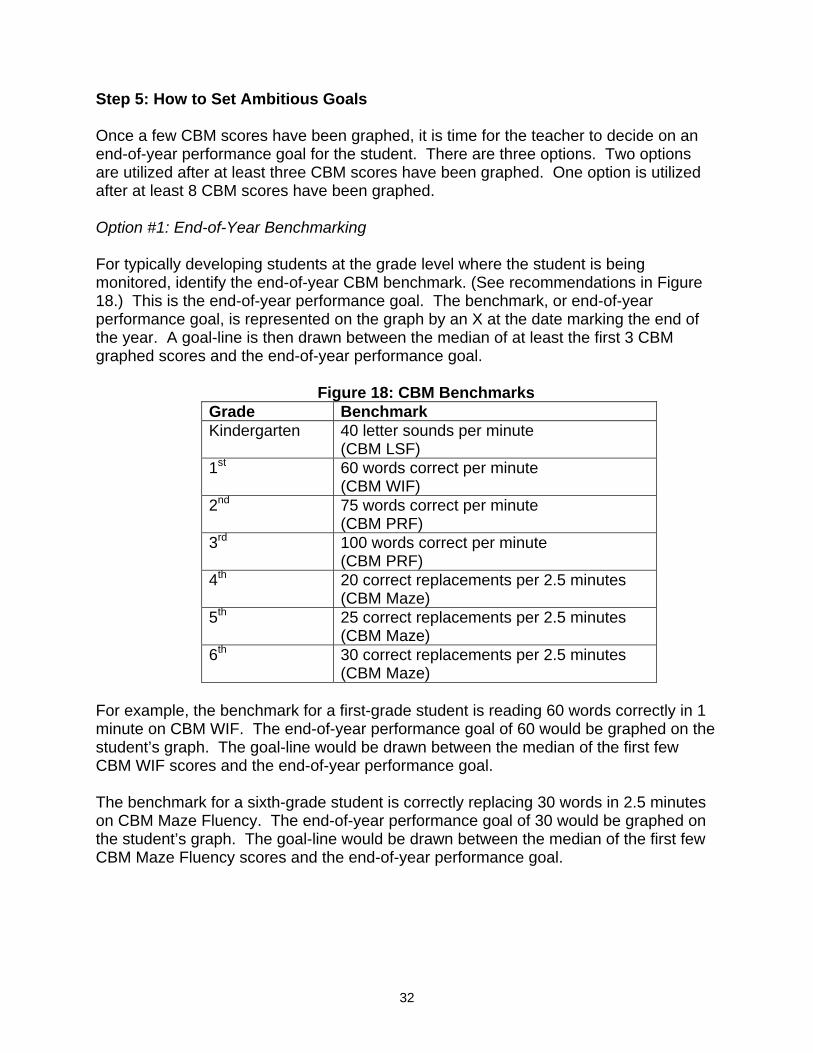
Step 5: How to Set Ambitious Goals Once a few CBM scores have been graphed, it is time for the teacher to decide on an end-of-year performance goal for the student. There are three options. Two options are utilized after at least three CBM scores have been graphed. One option is utilized after at least 8 CBM scores have been graphed. Option #1: End-of-Year Benchmarking For typically developing students at the grade level where the student is being monitored, identify the end-of-year CBM benchmark. (See recommendations in Figure 18.) This is the end-of-year performance goal. The benchmark, or end-of-year performance goal, is represented on the graph by an X at the date marking the end of the year. A goal-line is then drawn between the median of at least the first 3 CBM graphed scores and the end-of-year performance goal.
Figure 18: CBM Benchmarks
Grade Benchmark Kindergarten 40 letter sounds per minute
(CBM LSF) 1st 60 words correct per minute
(CBM WIF) 2nd 75 words correct per minute
(CBM PRF) 3rd 100 words correct per minute
(CBM PRF) 4th 20 correct replacements per 2.5 minutes
(CBM Maze) 5th 25 correct replacements per 2.5 minutes
(CBM Maze) 6th 30 correct replacements per 2.5 minutes
(CBM Maze)
For example, the benchmark for a first-grade student is reading 60 words correctly in 1 minute on CBM WIF. The end-of-year performance goal of 60 would be graphed on the student’s graph. The goal-line would be drawn between the median of the first few CBM WIF scores and the end-of-year performance goal. The benchmark for a sixth-grade student is correctly replacing 30 words in 2.5 minutes on CBM Maze Fluency. The end-of-year performance goal of 30 would be graphed on the student’s graph. The goal-line would be drawn between the median of the first few CBM Maze Fluency scores and the end-of-year performance goal.
32
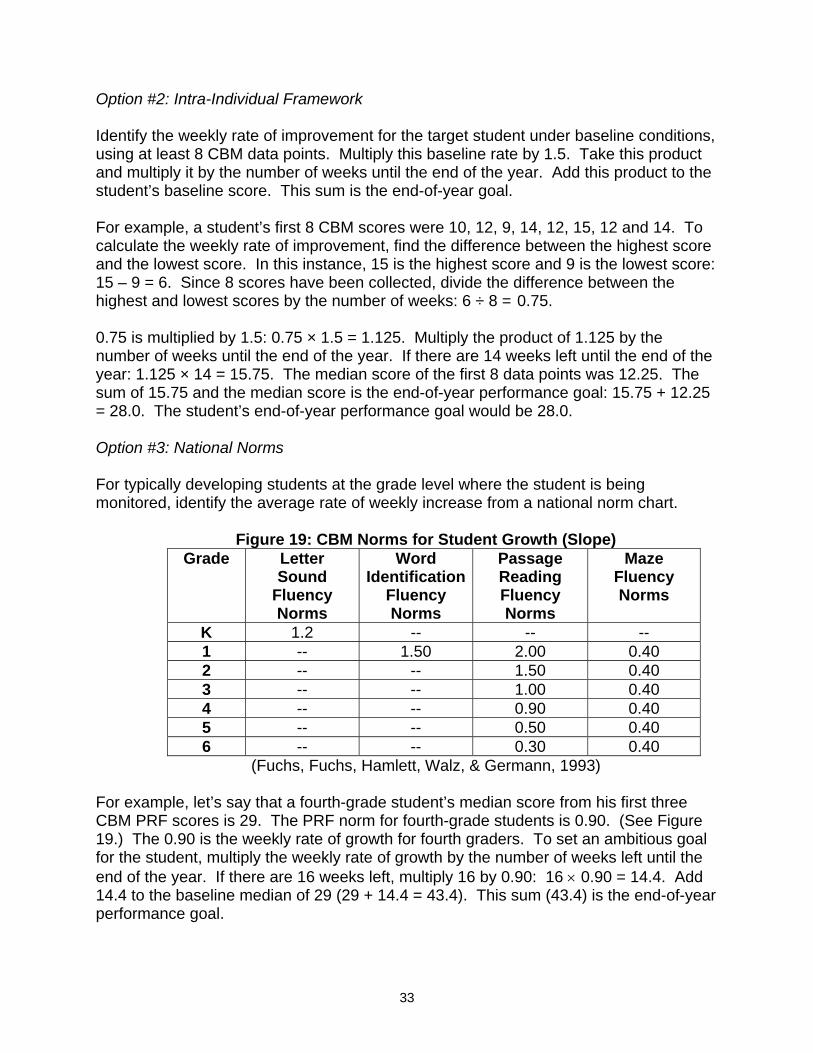
Option #2: Intra-Individual Framework Identify the weekly rate of improvement for the target student under baseline conditions, using at least 8 CBM data points. Multiply this baseline rate by 1.5. Take this product and multiply it by the number of weeks until the end of the year. Add this product to the student’s baseline score. This sum is the end-of-year goal. For example, a student’s first 8 CBM scores were 10, 12, 9, 14, 12, 15, 12 and 14. To calculate the weekly rate of improvement, find the difference between the highest score and the lowest score. In this instance, 15 is the highest score and 9 is the lowest score: 15 – 9 = 6. Since 8 scores have been collected, divide the difference between the highest and lowest scores by the number of weeks: 6 ÷ 8 = 0.75. 0.75 is multiplied by 1.5: 0.75 × 1.5 = 1.125. Multiply the product of 1.125 by the number of weeks until the end of the year. If there are 14 weeks left until the end of the year: 1.125 × 14 = 15.75. The median score of the first 8 data points was 12.25. The sum of 15.75 and the median score is the end-of-year performance goal: 15.75 + 12.25 = 28.0. The student’s end-of-year performance goal would be 28.0. Option #3: National Norms For typically developing students at the grade level where the student is being monitored, identify the average rate of weekly increase from a national norm chart.
Figure 19: CBM Norms for Student Growth (Slope)
Grade Letter Sound
Fluency Norms
Word Identification
Fluency Norms
Passage Reading Fluency Norms
Maze Fluency Norms
K 1.2 -- -- -- 1 -- 1.50 2.00 0.40 2 -- -- 1.50 0.40 3 -- -- 1.00 0.40 4 -- -- 0.90 0.40 5 -- -- 0.50 0.40 6 -- -- 0.30 0.40
(Fuchs, Fuchs, Hamlett, Walz, & Germann, 1993)
For example, let’s say that a fourth-grade student’s median score from his first three CBM PRF scores is 29. The PRF norm for fourth-grade students is 0.90. (See Figure 19.) The 0.90 is the weekly rate of growth for fourth graders. To set an ambitious goal for the student, multiply the weekly rate of growth by the number of weeks left until the end of the year. If there are 16 weeks left, multiply 16 by 0.90: 16 × 0.90 = 14.4. Add 14.4 to the baseline median of 29 (29 + 14.4 = 43.4). This sum (43.4) is the end-of-year performance goal.
33
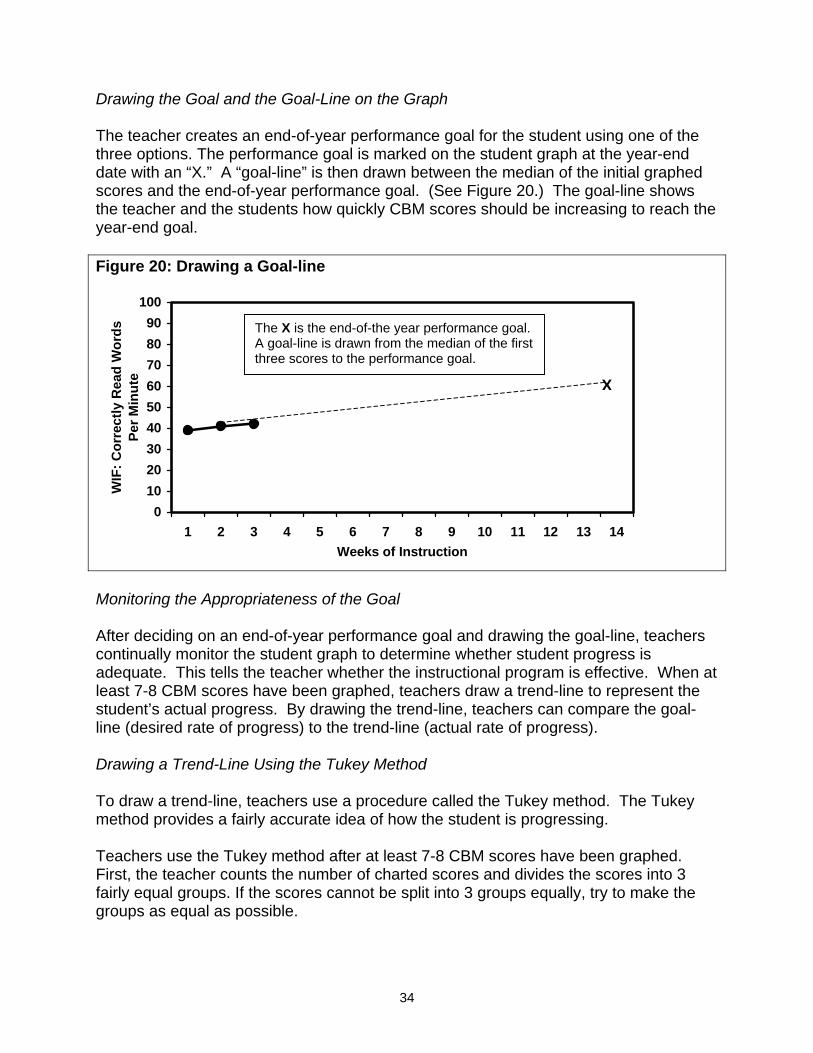
Drawing the Goal and the Goal-Line on the Graph The teacher creates an end-of-year performance goal for the student using one of the three options. The performance goal is marked on the student graph at the year-end date with an “X.” A “goal-line” is then drawn between the median of the initial graphed scores and the end-of-year performance goal. (See Figure 20.) The goal-line shows the teacher and the students how quickly CBM scores should be increasing to reach the year-end goal. Figure 20: Drawing a Goal-line
0102030405060708090
100
1 2 3 4 5 6 7 8 9 10 11 12 13Weeks of Instruction
WIF
: Cor
rect
ly R
ead
Wor
dsPe
r Min
ute X
The X is the end-of-the year performance goal. A goal-line is drawn from the median of the first three scores to the performance goal.
Monitoring the Appropriateness of the Goal After deciding on an end-of-year performance goal and drawing the gocontinually monitor the student graph to determine whether student proadequate. This tells the teacher whether the instructional program is eleast 7-8 CBM scores have been graphed, teachers draw a trend-line tstudent’s actual progress. By drawing the trend-line, teachers can comline (desired rate of progress) to the trend-line (actual rate of progress) Drawing a Trend-Line Using the Tukey Method To draw a trend-line, teachers use a procedure called the Tukey methomethod provides a fairly accurate idea of how the student is progressin Teachers use the Tukey method after at least 7-8 CBM scores have beFirst, the teacher counts the number of charted scores and divides the fairly equal groups. If the scores cannot be split into 3 groups equally, tgroups as equal as possible.
34
14
al-line, teachers gress is ffective. When at o represent the pare the goal-.
d. The Tukey g.
en graphed. scores into 3 ry to make the
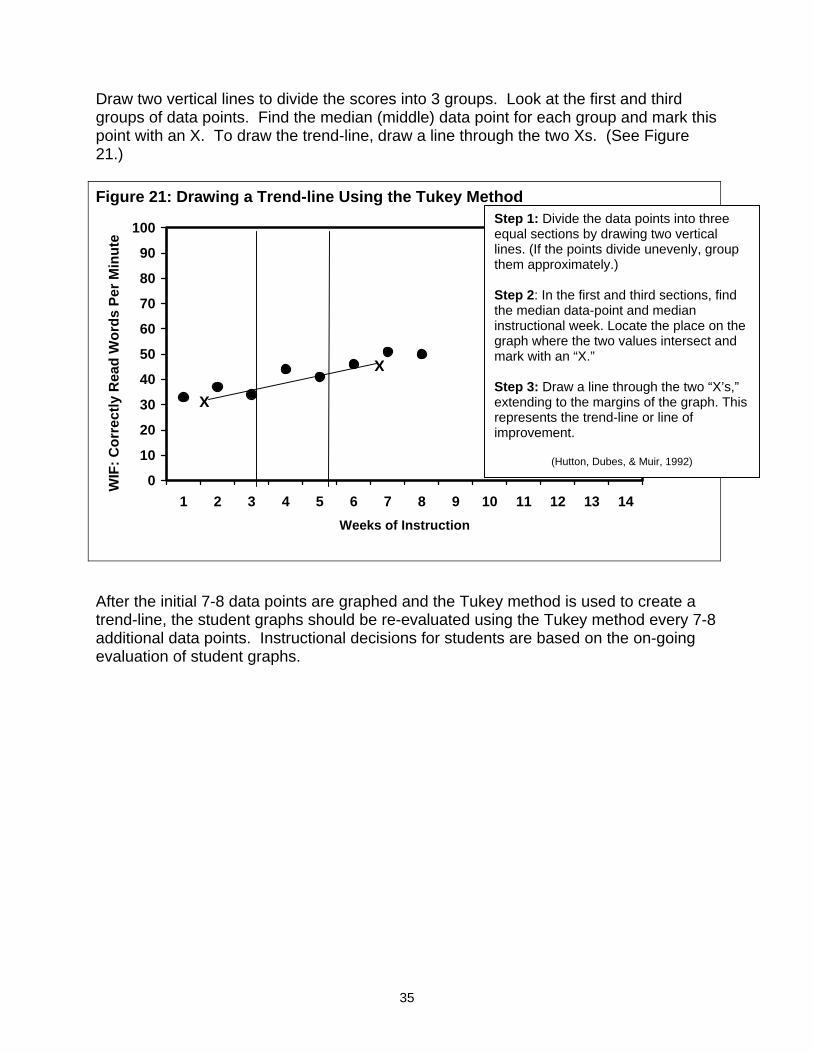
Draw two vertical lines to divide the scores into 3 groups. Look at the first and third groups of data points. Find the median (middle) data point for each group and mark this point with an X. To draw the trend-line, draw a line through the two Xs. (See Figure 21.) Figure 21: Drawing a Trend-line Using the Tukey Method
0
10
20
30
40
50
60
70
80
90
100
1
WIF
: Cor
rect
ly R
ead
Wor
ds P
er M
inut
e
Step 1: Divide the data points into three equal sections by drawing two vertical lines. (If the points divide unevenly, group them approximately.) Step 2: In the first and third sections, find the median data-point and median instructional week. Locate the place on the graph where the two values intersect and mark with an “X.” Step 3: Draw a line through the two “X’s,” extending to the margins of the graph. This X
X
After the initiatrend-line, theadditional daevaluation of
2 3 4 5 6Wee
l 7-8 data points are grap student graphs should b
ta points. Instructional de student graphs.
7 8 9 10 11 12 13 14ks of Instruction
represents the trend-line or line of improvement.
(Hutton, Dubes, & Muir, 1992)
hed and the Tukey method is used to create a e re-evaluated using the Tukey method every 7-8 cisions for students are based on the on-going
35
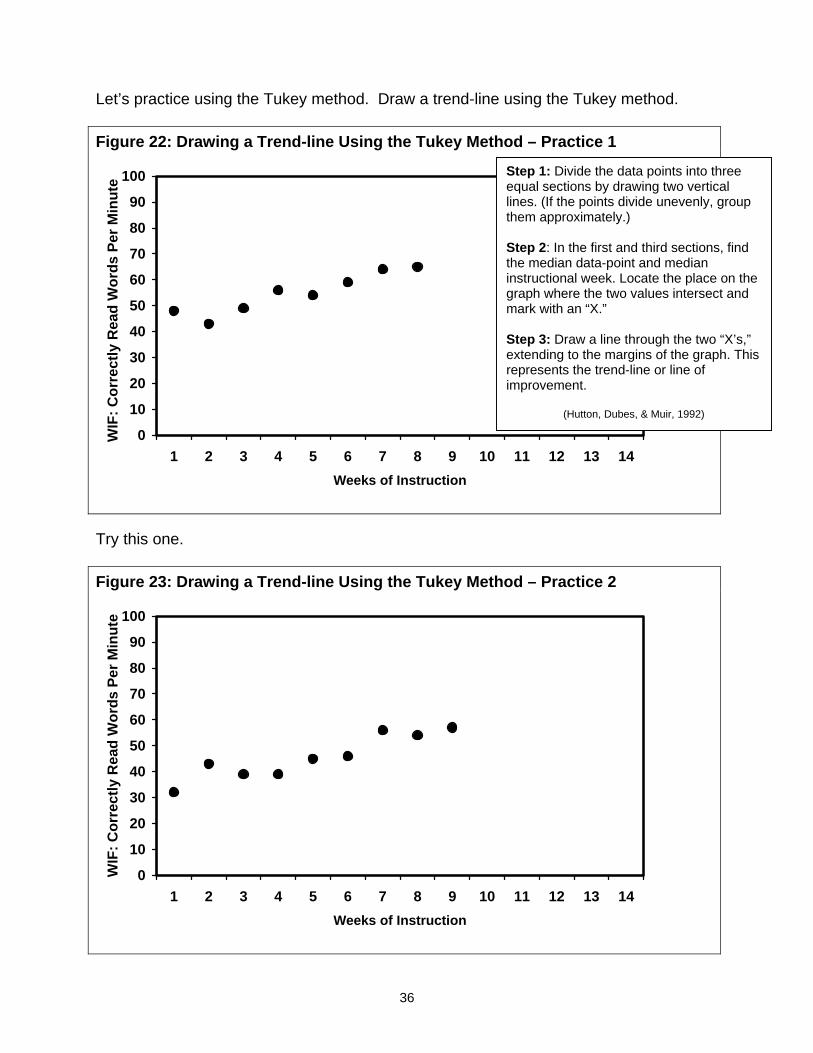
Let’s practice using the Tukey method. Draw a trend-line using the Tukey method. Figure 22: Drawing a Trend-line Using the Tukey Method – Practice 1
0
10
20
30
40
50
60
70
80
90
100
1 2 3 4 5 6 7 8 9 10 11 12 13 14Weeks of Instruction
WIF
: Cor
rect
ly R
ead
Wor
ds P
er M
inut
e
Try this one. Figure 23: Drawing a Trend-line Using the Tukey Method – Practice 2
0
10
20
30
40
50
60
70
80
90
100
1 2 3 4 5 6 7 8 9 10 11 12 13 14Weeks of Instruction
WIF
: Cor
rect
ly R
ead
Wor
ds P
er M
inut
e
Step 1: Divide the data points into three equal sections by drawing two vertical lines. (If the points divide unevenly, group them approximately.) Step 2: In the first and third sections, find the median data-point and median instructional week. Locate the place on the graph where the two values intersect and mark with an “X.” Step 3: Draw a line through the two “X’s,” extending to the margins of the graph. This represents the trend-line or line of improvement.
(Hutton, Dubes, & Muir, 1992)
36
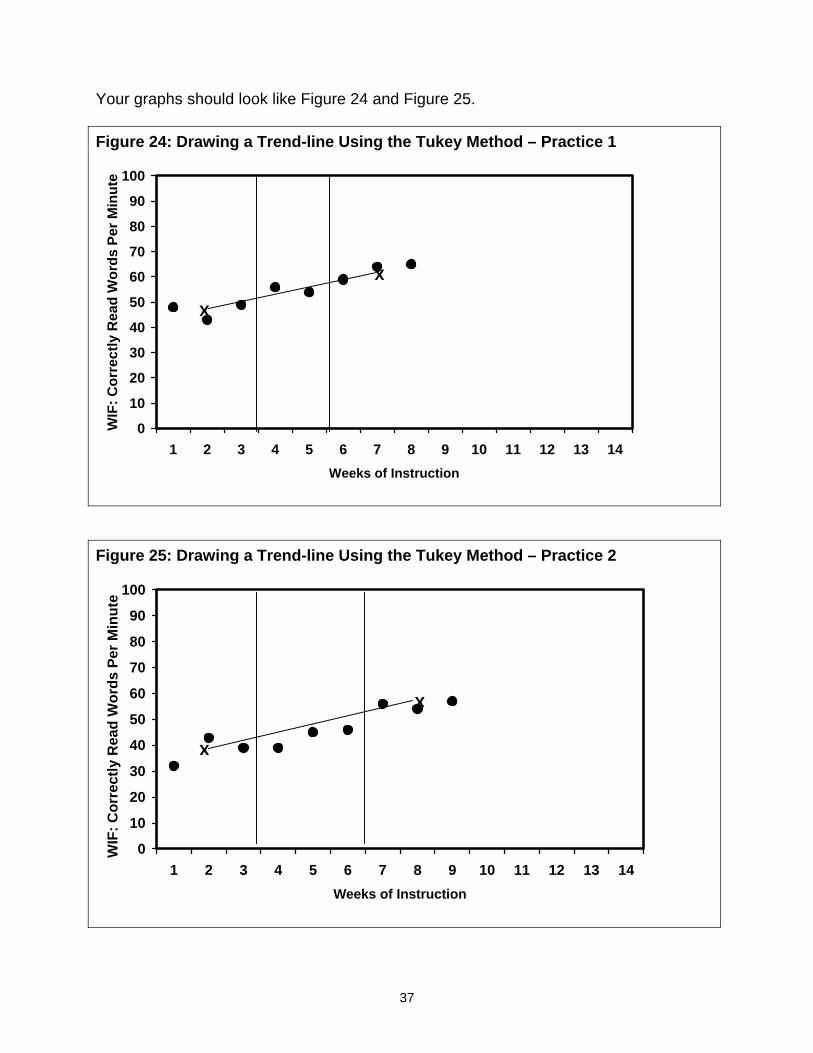
Your graphs should look like Figure 24 and Figure 25. Figure 24: Drawing a Trend-line Using the Tukey Method – Practice 1
0
10
20
30
40
50
60
70
80
90
100
1
WIF
: Cor
rect
ly R
ead
Wor
ds P
er M
inut
e
Figure 25: D
0
10
20
30
40
50
60
70
80
90
100
1
WIF
: Cor
rect
ly R
ead
Wor
ds P
er M
inut
e
X
X
2 3 4 5 6Weeks
rawing a Trend-line Usin
2 3 4 5 6Week
X
7 8 9 10 11 12 13 14 of Instruction
g the Tukey Method – Practice 2
X
7s of I
3
8 9 10 11 12 13 14nstruction
7
Computer Management Programs CBM computer management programs are available for schools to purchase. The computer scoring programs create graphs for individual students after the student scores are entered into the program and aid teachers in making performance goals and instructional decisions. Other computer programs actually collect and score the data. Various types of computer assistance are available at varying fees. Information on how to obtain the computer programs is in Appendix A. AIMSweb provides a computer software program that allows teachers to enter student CBM data, once they have administered and scored the tests, and then receive graphs and automated reports based on a student’s performance. Teachers can purchase the software from AIMSweb. A sample CBM report produced by AIMSweb is available in Appendix A. DIBELS operates an on-line data system that teachers can use for the cost of $1 per student, per year. With the data system, teachers can administer and score tests and then enter student CBM scores and have student graphs automatically prepared. The data system also provides reports for the scores of an entire district or school. A sample CBM report produced by DIBELS is available in Appendix A. Edcheckup operates a computer assistance program that allows teachers to enter student data. They administer and score on-line. Reports and graphs are automatically generated that follow class and student progress. The program also guides teachers to set annual goals and evaluate student progress. The Edcheckup program is available for a fee. McGraw-Hill produces Yearly ProgressPro™, a computer-administered progress monitoring and instructional system to bring the power of Curriculum Based Measurement (CBM) into the classroom. Students take their CBM tests at the computer, eliminating the need for teachers to administer and score probes. Weekly diagnostic assessments provide teachers with the information they need to plan classroom instruction. Reports allow teachers to track progress against state and national standards at the individual student, class, building, or district level. A sample CBM report produced by Yearly ProgressPro™ is available in Appendix A. Pro-Ed supplies a Monitoring Basic Skills Progress (MBSP) computer software package that allows students to complete tests at the computer. The computer automatically scores the tests and provides students with immediate feedback. The program analyzes student performance and provides teachers with class reports and information about teaching decisions. A sample CBM report produced by the MBSP program is available in Appendix A.
38
Step 6: How to Apply Decision Rules to Graphed Scores to Know When to Revise Programs and Increase Goals CBM can judge the adequacy of student progress and the need to change instructional programs. Researchers have demonstrated that CBM can be used to improve the scope and usefulness of program evaluation decisions (Germann & Tindal, 1985) and to develop instructional plans that enhance student achievement (Fuchs, Deno, & Mirkin, 1984; Fuchs, Fuchs, & Hamlett, 1989a). After teachers draw CBM graphs and trend-lines, they use graphs to evaluate student progress and to formulate instructional decisions. Standard CBM decision rules guide decisions about the adequacy of student progress and the need to revise goals and instructional programs. Decision rules based on the most recent 4 consecutive scores:
If the most recent 4 consecutive CBM scores are above the goal-line, the student’s end-of-year performance goal needs to be increased.
If the most recent 4 consecutive CBM scores are below the goal-line, the teacher needs to revise the instructional program.
Decision rules based on the trend-line:
If the student’s trend-line is steeper than the goal-line, the student’s end-of-year performance goal needs to be increased. If the student’s trend-line is flatter than the goal-line, the teacher needs to revise the instructional program. If the student’s trend-line and goal-line are the same, no changes need to be made.
Let’s look at each of these decision rules and the graphs that help teachers make decisions about a student’s goals and instructional programs.
39
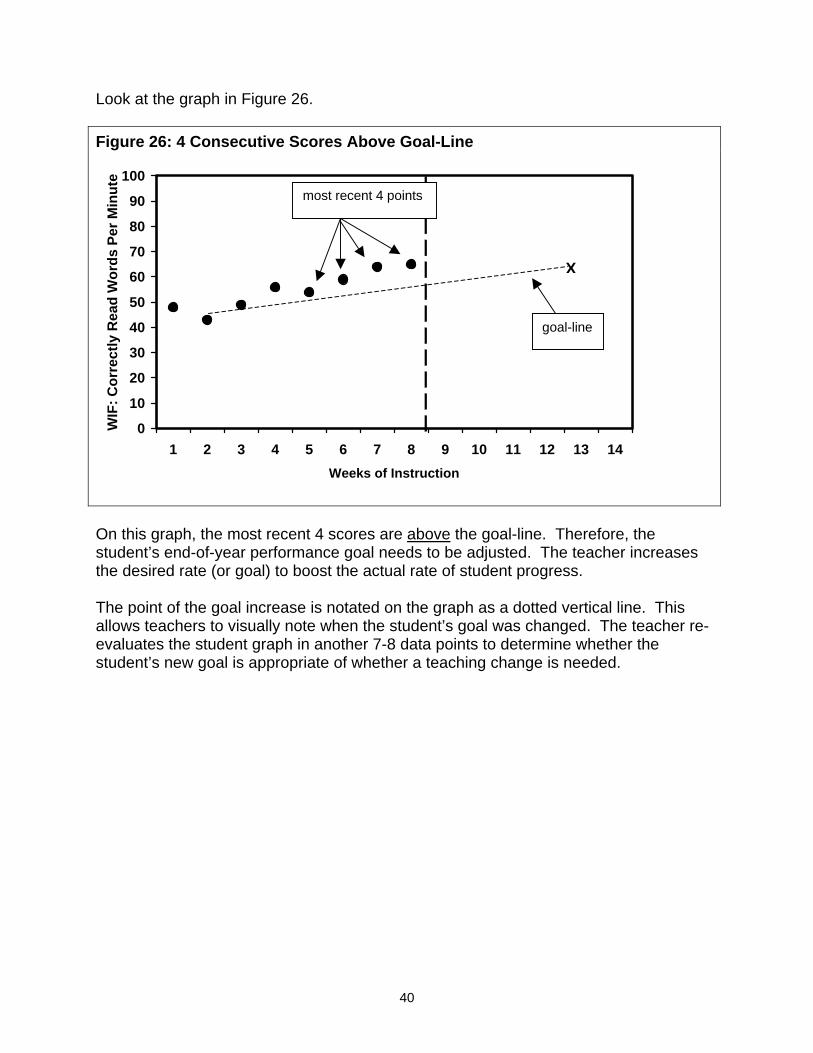
Look at the graph in Figure 26. Figure 26: 4 Consecutive Scores Above Goal-Line
0
10
20
30
40
50
60
70
80
90
100
1 2 3 4 5 6 7 8 9 10 11 12Weeks of Instruction
WIF
: Cor
rect
ly R
ead
Wor
ds P
er M
inut
e
X
most recent 4 points
go
On this graph, the most recent 4 scores are above the goal-line. Tstudent’s end-of-year performance goal needs to be adjusted. Ththe desired rate (or goal) to boost the actual rate of student progre The point of the goal increase is notated on the graph as a dottedallows teachers to visually note when the student’s goal was chanevaluates the student graph in another 7-8 data points to determinstudent’s new goal is appropriate of whether a teaching change is
40
13 14
al-line
herefore, the e teacher increases ss.
vertical line. This ged. The teacher re-e whether the needed.
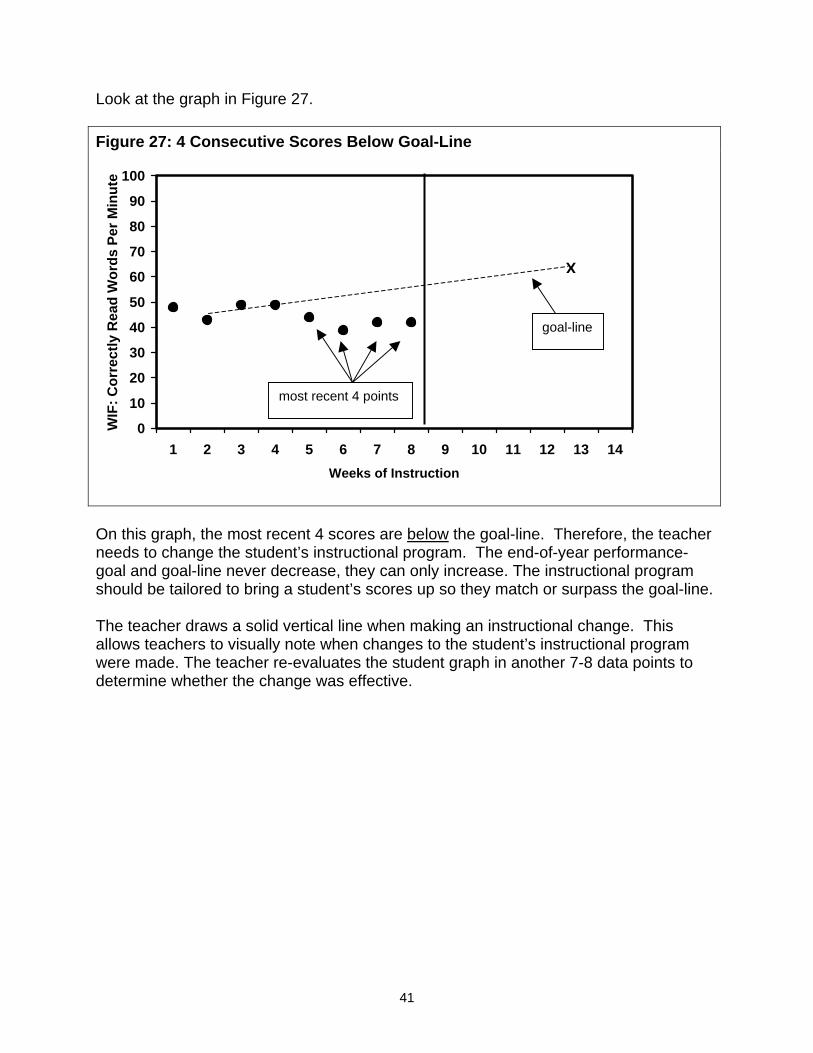
Look at the graph in Figure 27. Figure 27: 4 Consecutive Scores Below Goal-Line
0
10
20
30
40
50
60
70
80
90
100
1 2 3 4 5 6 7 8 9 10 11 12Weeks of Instruction
WIF
: Cor
rect
ly R
ead
Wor
ds P
er M
inut
e
X
go
most recent 4 points
On this graph, the most recent 4 scores are below the goal-line. Tneeds to change the student’s instructional program. The end-of-goal and goal-line never decrease, they can only increase. The inshould be tailored to bring a student’s scores up so they match or The teacher draws a solid vertical line when making an instructionallows teachers to visually note when changes to the student’s inswere made. The teacher re-evaluates the student graph in anothedetermine whether the change was effective.
41
13 14
al-line
herefore, the teacher year performance-structional program surpass the goal-line.
al change. This tructional program r 7-8 data points to
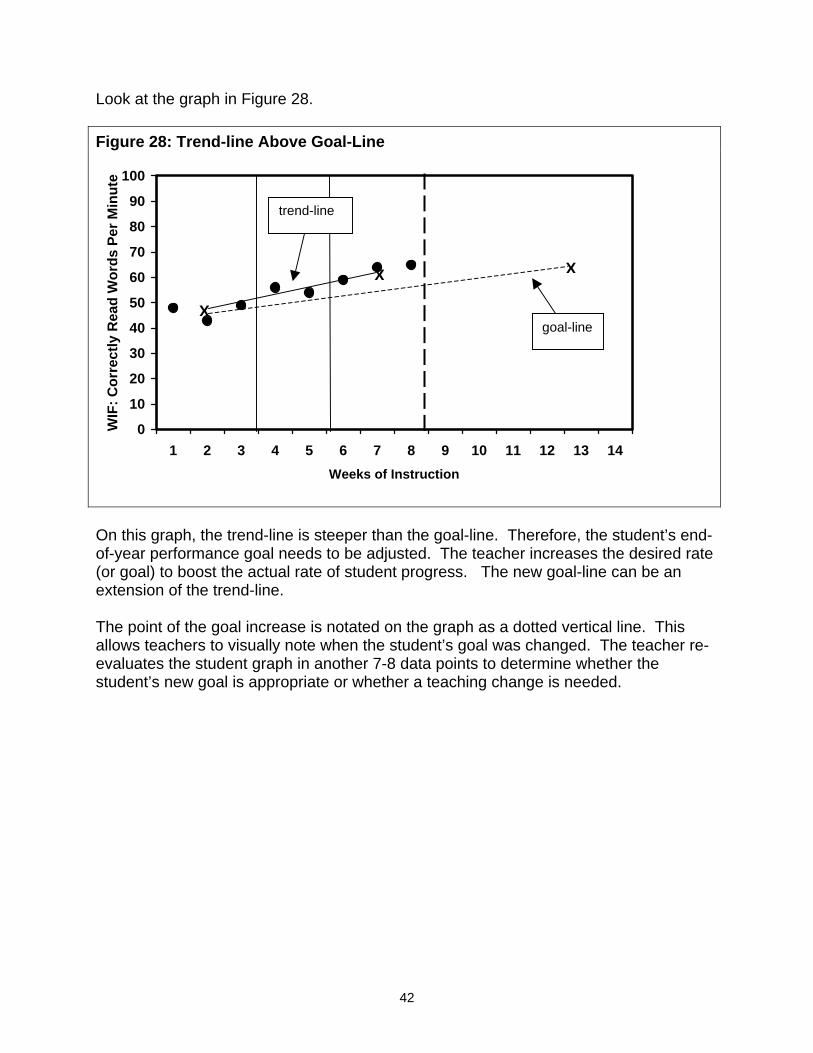
Look at the graph in Figure 28. Figure 28: Trend-line Above Goal-Line
0
10
20
30
40
50
60
70
80
90
100
1 2 3 4 5 6 7 8 9 10 11 12 13 14Weeks of Instruction
WIF
: Cor
rect
ly R
ead
Wor
ds P
er M
inut
e
X
X X
trend-line
goal-line
On this graph, the trend-line is steeper than the goal-line. Therefore, the student’s end-of-year performance goal needs to be adjusted. The teacher increases the desired rate (or goal) to boost the actual rate of student progress. The new goal-line can be an extension of the trend-line. The point of the goal increase is notated on the graph as a dotted vertical line. This allows teachers to visually note when the student’s goal was changed. The teacher re-evaluates the student graph in another 7-8 data points to determine whether the student’s new goal is appropriate or whether a teaching change is needed.
42
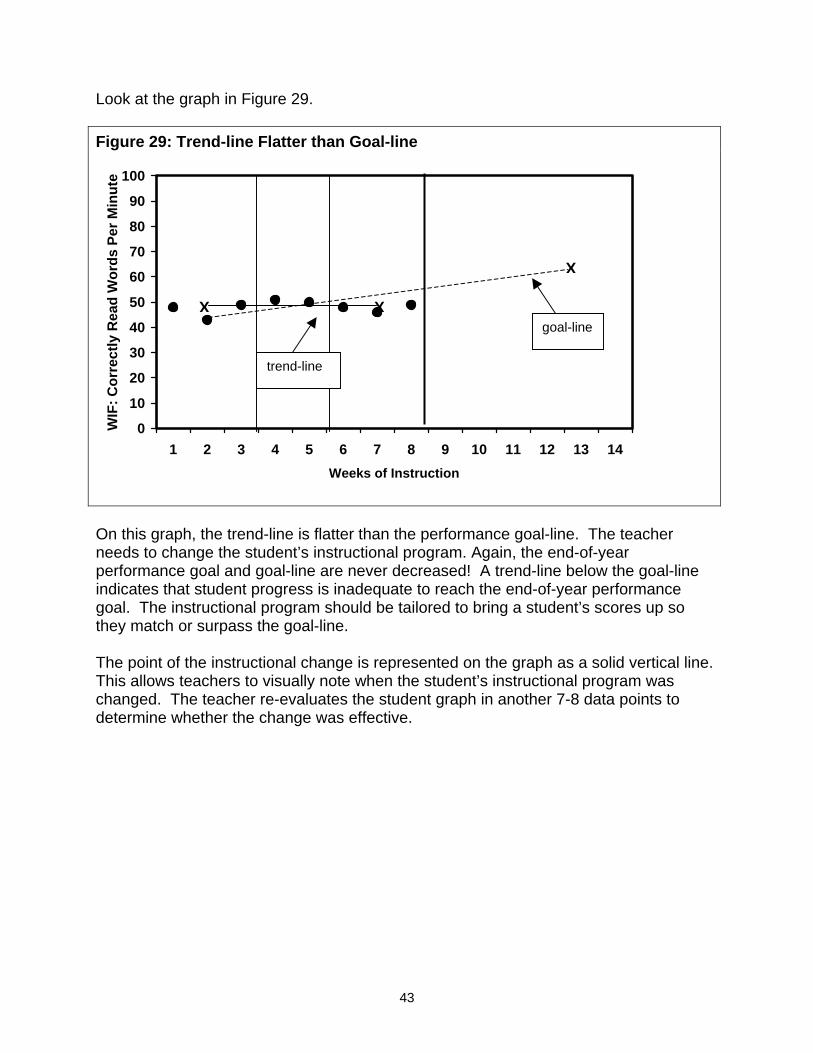
Look at the graph in Figure 29. Figure 29: Trend-line Flatter than Goal-line
0
10
20
30
40
50
60
70
80
90
100
1 2 3 4 5 6 7 8 9 10 11 12 13 14Weeks of Instruction
WIF
: Cor
rect
ly R
ead
Wor
ds P
er M
inut
e
X X
X
goal-line
trend-line
On this graph, the trend-line is flatter than the performance goal-line. The teacher needs to change the student’s instructional program. Again, the end-of-year performance goal and goal-line are never decreased! A trend-line below the goal-line indicates that student progress is inadequate to reach the end-of-year performance goal. The instructional program should be tailored to bring a student’s scores up so they match or surpass the goal-line. The point of the instructional change is represented on the graph as a solid vertical line. This allows teachers to visually note when the student’s instructional program was changed. The teacher re-evaluates the student graph in another 7-8 data points to determine whether the change was effective.
43
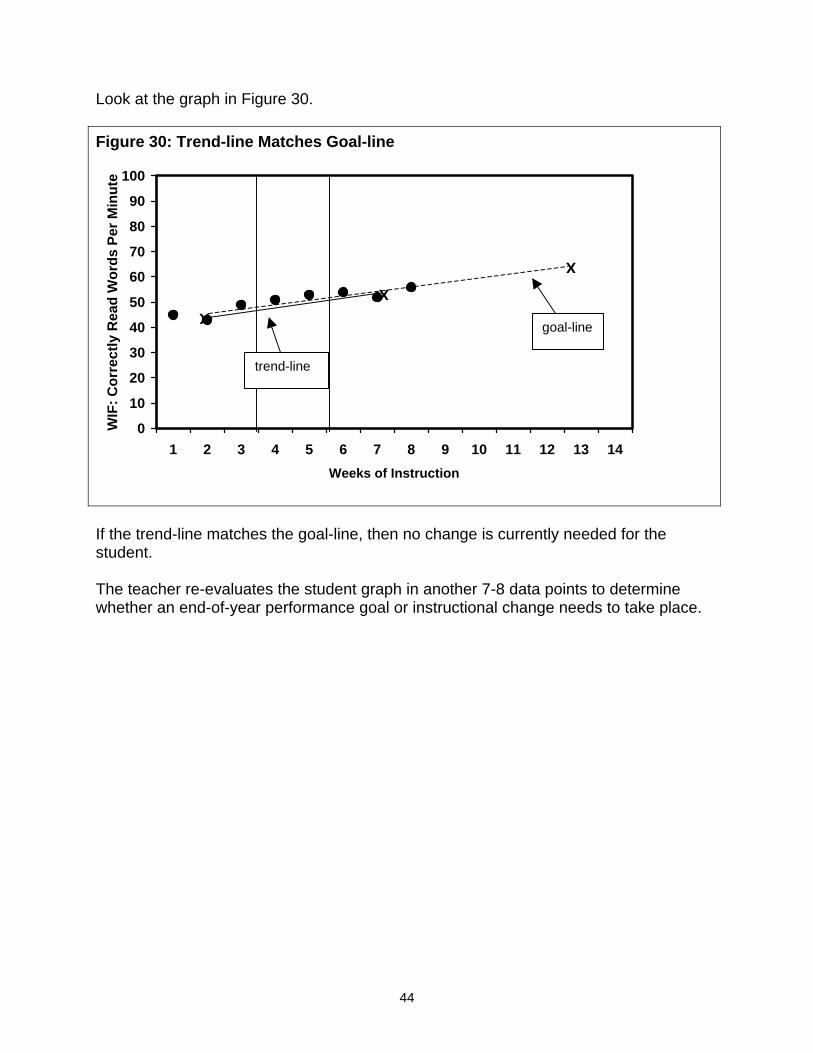
Look at the graph in Figure 30. Figure 30: Trend-line Matches Goal-line
0
10
20
30
40
50
60
70
80
90
100
1 2 3 4 5 6 7 8 9 10 11 12 13 14Weeks of Instruction
WIF
: Cor
rect
ly R
ead
Wor
ds P
er M
inut
e
X
XX
trend-line
goal-line
If the trend-line matches the goal-line, then no change is currently needed for the student. The teacher re-evaluates the student graph in another 7-8 data points to determine whether an end-of-year performance goal or instructional change needs to take place.
44
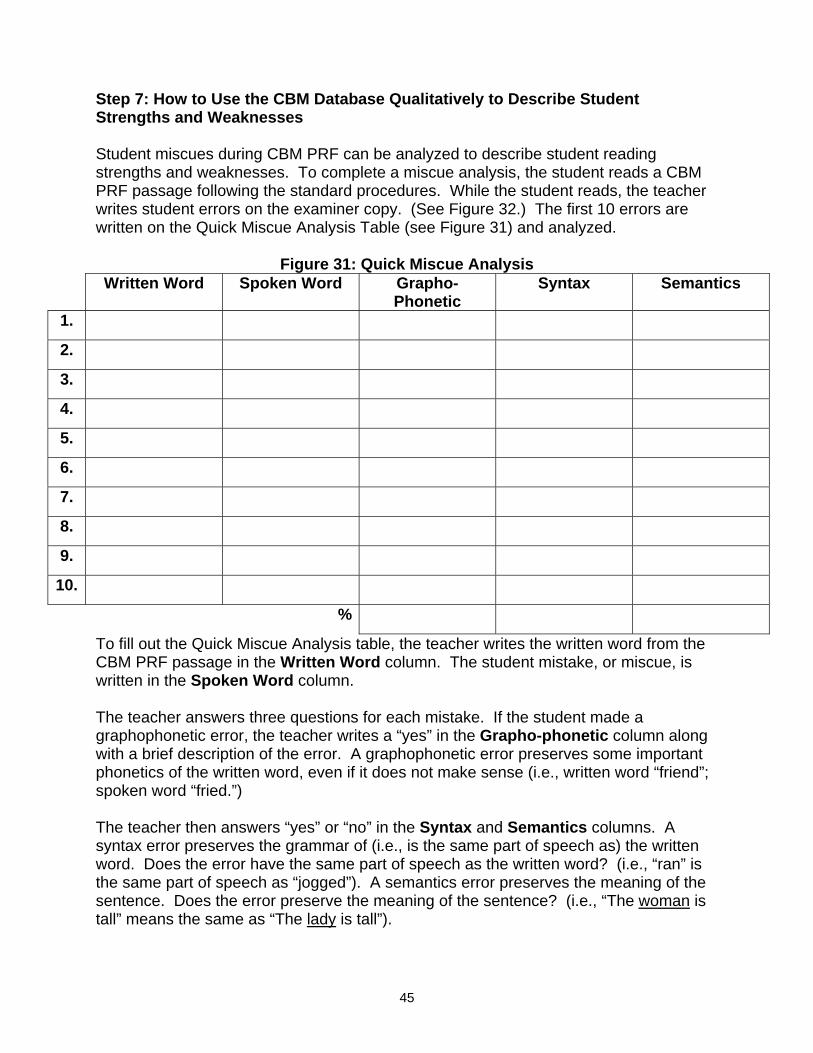
Step 7: How to Use the CBM Database Qualitatively to Describe Student Strengths and Weaknesses Student miscues during CBM PRF can be analyzed to describe student reading strengths and weaknesses. To complete a miscue analysis, the student reads a CBM PRF passage following the standard procedures. While the student reads, the teacher writes student errors on the examiner copy. (See Figure 32.) The first 10 errors are written on the Quick Miscue Analysis Table (see Figure 31) and analyzed.
Figure 31: Quick Miscue Analysis Written Word Spoken Word Grapho-
Phonetic Syntax Semantics
1.
2.
3.
4.
5.
6.
7.
8.
9.
10.
%
To fill out the Quick Miscue Analysis table, the teacher writes the written word from the CBM PRF passage in the Written Word column. The student mistake, or miscue, is written in the Spoken Word column. The teacher answers three questions for each mistake. If the student made a graphophonetic error, the teacher writes a “yes” in the Grapho-phonetic column along with a brief description of the error. A graphophonetic error preserves some important phonetics of the written word, even if it does not make sense (i.e., written word “friend”; spoken word “fried.”) The teacher then answers “yes” or “no” in the Syntax and Semantics columns. A syntax error preserves the grammar of (i.e., is the same part of speech as) the written word. Does the error have the same part of speech as the written word? (i.e., “ran” is the same part of speech as “jogged”). A semantics error preserves the meaning of the sentence. Does the error preserve the meaning of the sentence? (i.e., “The woman is tall” means the same as “The lady is tall”).
45
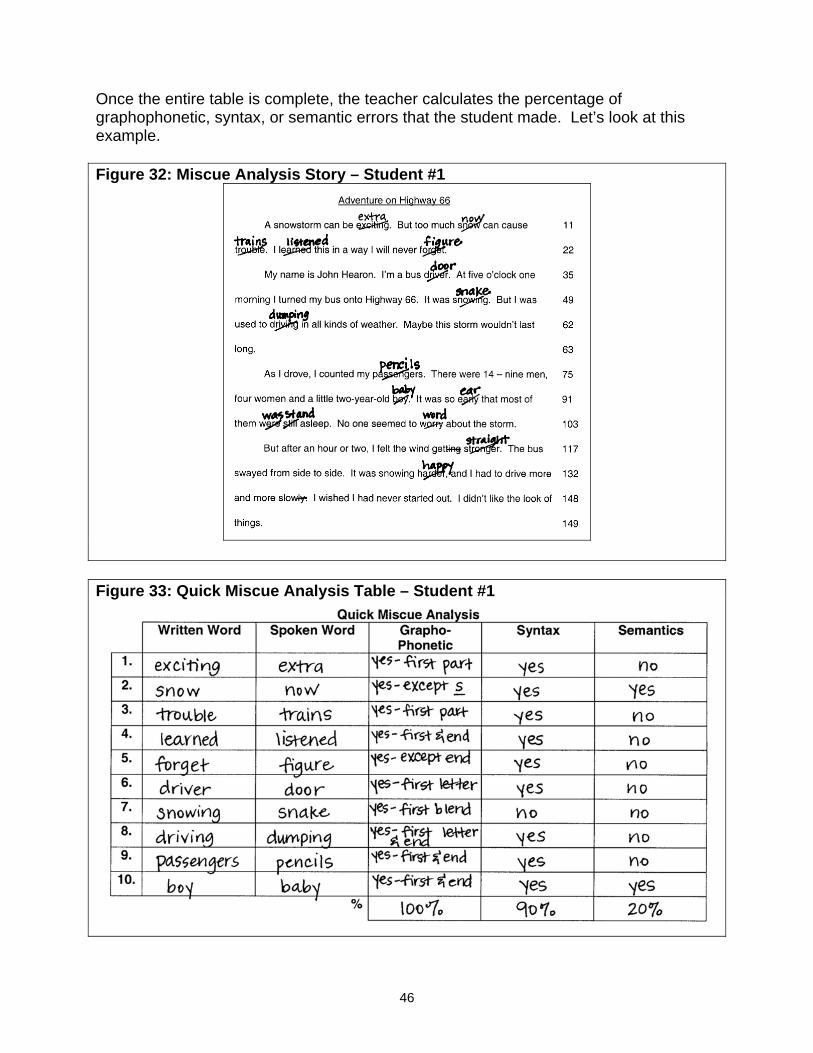
Once the entire table is complete, the teacher calculates the percentage of graphophonetic, syntax, or semantic errors that the student made. Let’s look at this example. Figure 32: Miscue Analysis Story – Student #1
Figure 33: Quick Miscue Analysis Table – Student #1
46
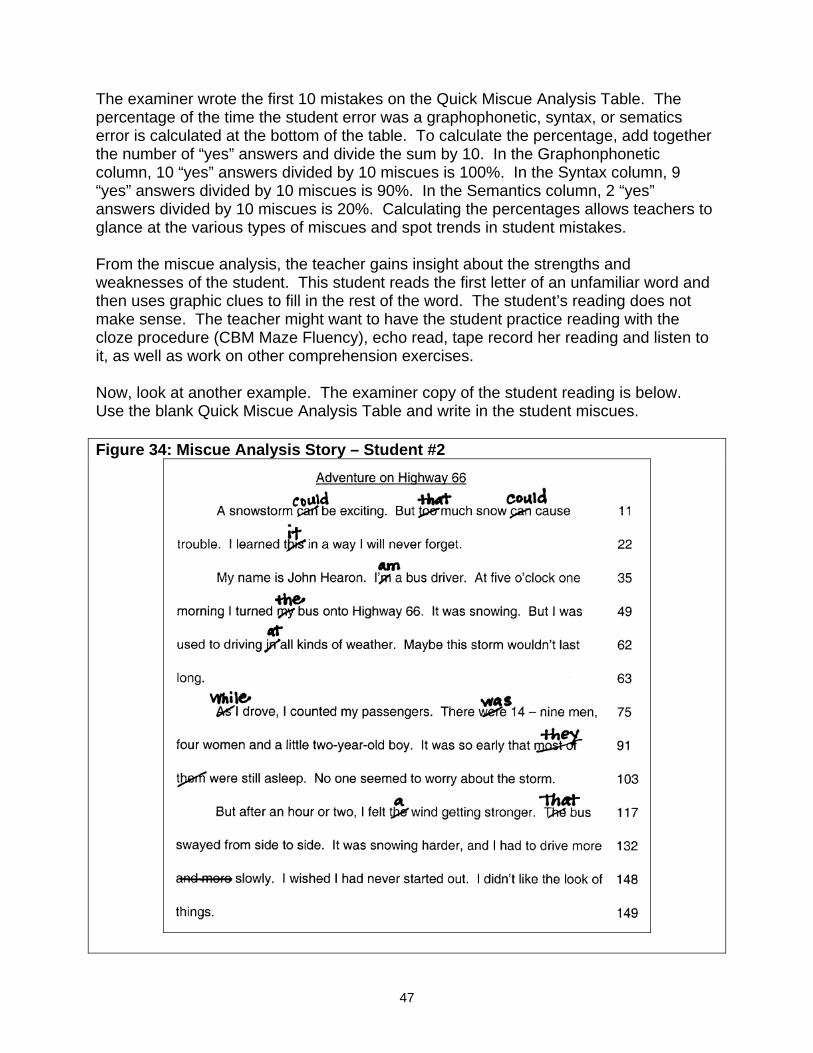
The examiner wrote the first 10 mistakes on the Quick Miscue Analysis Table. The percentage of the time the student error was a graphophonetic, syntax, or sematics error is calculated at the bottom of the table. To calculate the percentage, add together the number of “yes” answers and divide the sum by 10. In the Graphonphonetic column, 10 “yes” answers divided by 10 miscues is 100%. In the Syntax column, 9 “yes” answers divided by 10 miscues is 90%. In the Semantics column, 2 “yes” answers divided by 10 miscues is 20%. Calculating the percentages allows teachers to glance at the various types of miscues and spot trends in student mistakes. From the miscue analysis, the teacher gains insight about the strengths and weaknesses of the student. This student reads the first letter of an unfamiliar word and then uses graphic clues to fill in the rest of the word. The student’s reading does not make sense. The teacher might want to have the student practice reading with the cloze procedure (CBM Maze Fluency), echo read, tape record her reading and listen to it, as well as work on other comprehension exercises. Now, look at another example. The examiner copy of the student reading is below. Use the blank Quick Miscue Analysis Table and write in the student miscues. Figure 34: Miscue Analysis Story – Student #2
47
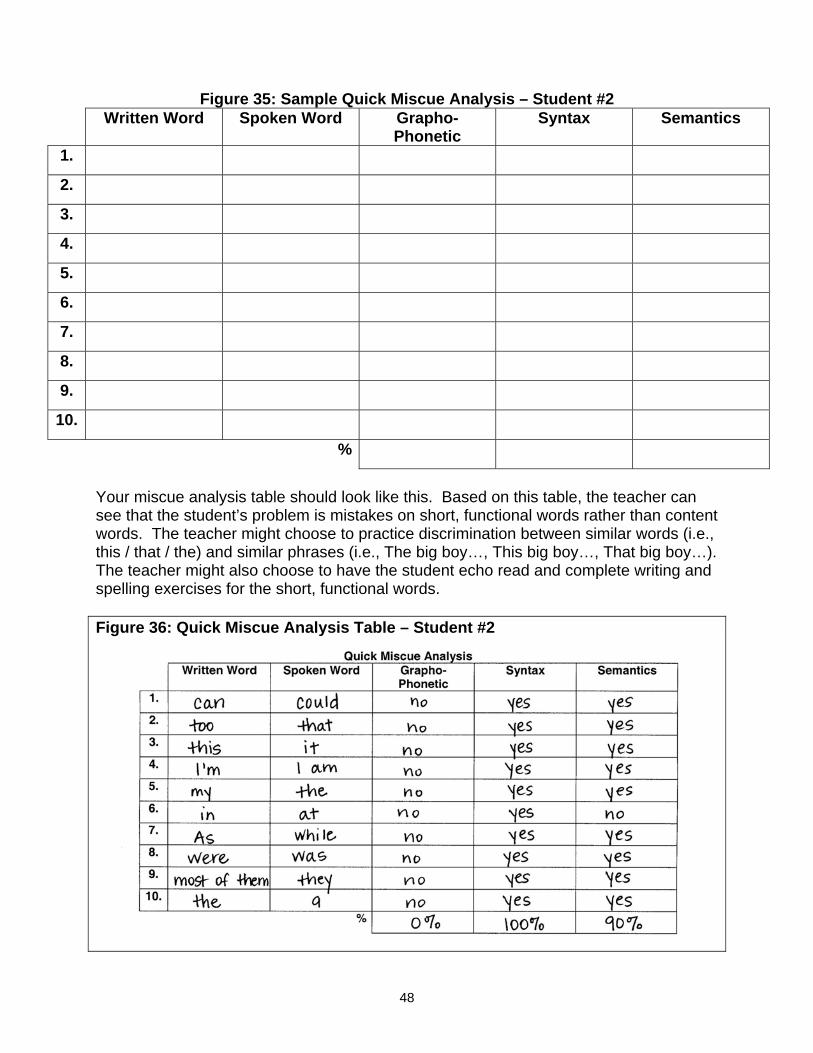
Figure 35: Sample Quick Miscue Analysis – Student #2 Written Word Spoken Word Grapho-
Phonetic Syntax Semantics
1.
2.
3.
4.
5.
6.
7.
8.
9.
10.
%
Your miscue analysis table should look like this. Based on this table, the teacher can see that the student’s problem is mistakes on short, functional words rather than content words. The teacher might choose to practice discrimination between similar words (i.e., this / that / the) and similar phrases (i.e., The big boy…, This big boy…, That big boy…). The teacher might also choose to have the student echo read and complete writing and spelling exercises for the short, functional words. Figure 36: Quick Miscue Analysis Table – Student #2
48
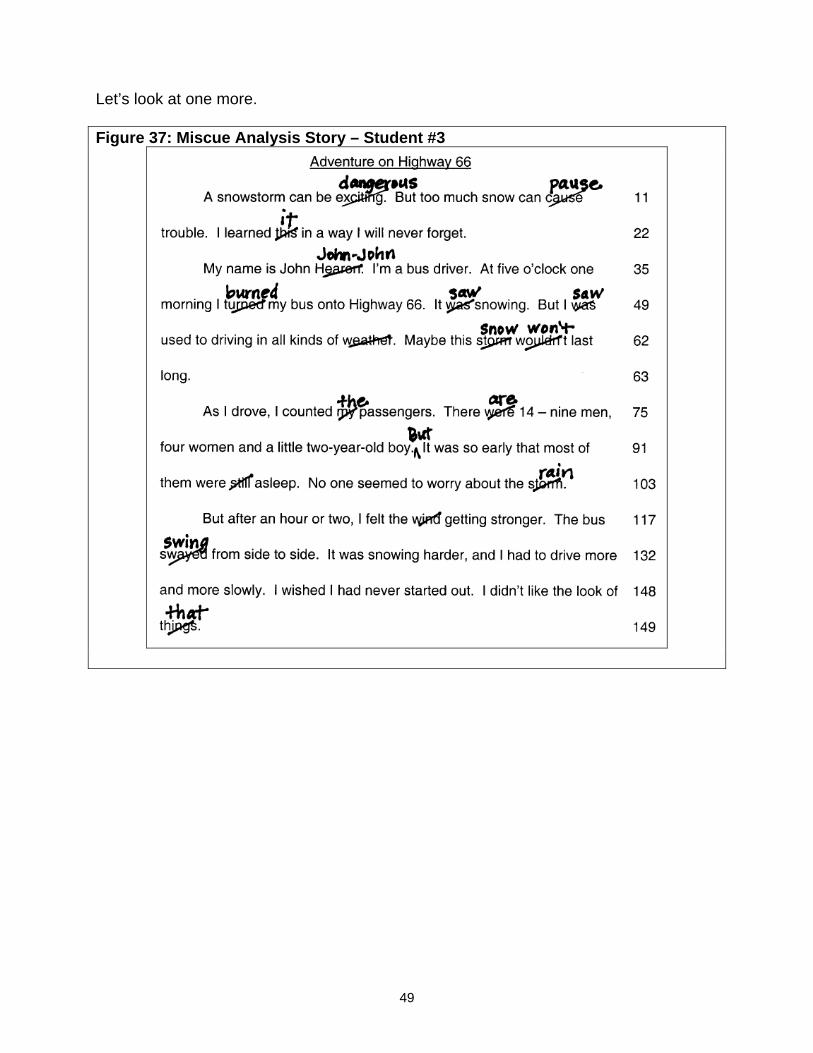
Let’s look at one more. Figure 37: Miscue Analysis Story – Student #3
49
Figure 38: Quick Miscue Analysis – Student #3 Written Word Spoken Word Grapho-
Phonetic Syntax Semantics
1.
2.
3.
4.
5.
6.
7.
8.
9.
10.
%
What are the strengths and weaknesses of this student? What teaching strategies might you choose to implement for this student?
50
Second Half of CBM Manual The rest of this CBM manual provides teachers with the following information. How to Use the CBM Database to Accomplish Teacher and School Accountability for Formulating Policy Directed at Improving School Outcomes (page 52) How to Incorporate Decision-Making Frameworks to Enhance General Educator Planning (page 55) How to Use Progress Monitoring to Identify Non-Responders Within a Response-to-Intervention Framework to Identify Disability (page 58) Case Study #1: Sascha (page 59) Case Study #2: Harrisburg Elementary (page 61) Case Study #3: Mrs. Wilson (page 64) Case Study #4: Joshua (page 67) Appendix A: A List of CBM Materials and Contact Information (page 69) Appendix B: A List of CBM Research and Resources (page 77)
51
How to Use the CBM Database to Accomplish Teacher and School Accountability and for Formulating Policy Directed at Improving Student Outcomes Federal law requires schools to show that they are achieving Adequate Yearly Progress (AYP) toward the “No Child Left Behind” proficiency goal. AYP is the annual minimum growth rate needed to eliminate the discrepancy between a school’s initial proficiency status and universal proficiency within the established time frame. Schools must determine the measure(s) to be used for AYP evaluation and the criterion for deeming an individual student “proficient” on this measure. Schools must quantify AYP for achieving the goal of universal proficiency by the school year 2113-2114. CBM can be used to fulfill the AYP evaluation in reading. Schools can assess every student using CBM to identify the number of students who initially meet benchmarks. This number of students represents a school’s initial proficiency status. Then the discrepancy between initial proficiency and universal proficiency can be calculated. Once the discrepancy between initial and universal proficiency is calculated, the discrepancy is divided by the number of years available before meeting the 2113-2114 goal. The resulting answer gives the number of additional students who must meet CBM end-of-year benchmarks each year. Relying on CBM for specifying AYP provides several advantages. First, the CBM measures are simple to administer and examiners can be trained to administer the tests in a reliable fashion in a short amount of time. Second, because the tests are brief, schools can measure an entire student body relatively efficiently and frequently. Routine testing allows a school to track its own progress over the school year. Progress can be examined at the school, teacher, or student level. Using CBM for multi-level monitoring can transform AYP from a procedural compliance burden into a useful tool for guiding education reform at the school level, for guiding the instructional decision making of individual teachers about their reading programs, and for ensuring that the reading progress of individual students is maximized. CBM provides a multi-level monitoring system that helps schools ensure greater levels of reading success. Here are a few examples of how CBM can be used in conjunction with a school’s AYP.
52
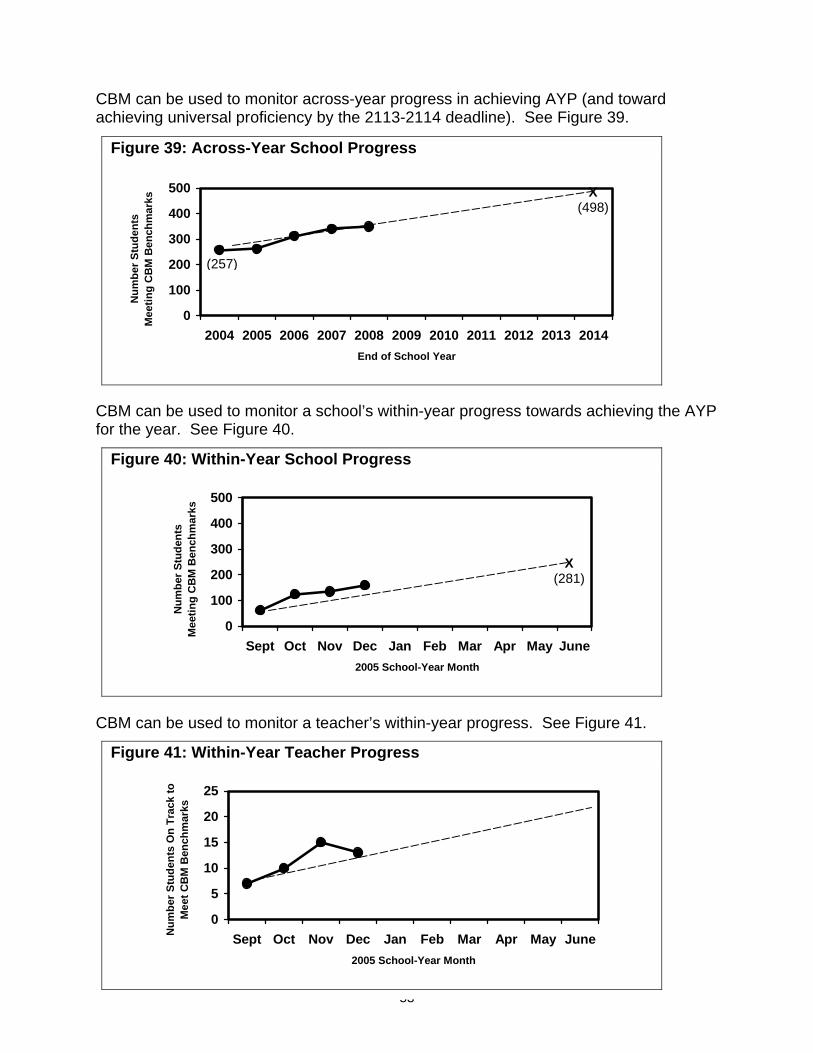
CBM can be used to monitor across-year progress in achieving AYP (and toward achieving universal proficiency by the 2113-2114 deadline). See Figure 39. Cfo C
Figure 39: Across-Year School Progress
BM can be ur the year. S
BM can be u
0
100
200
300
400
500
Num
ber S
tude
nts
Mee
ting
CB
M B
ench
mar
ks
)
X (498)
Num
ber S
tude
nts
Mee
ting
CB
M B
ench
mar
ks
Num
ber S
tude
nts
On
Trac
k to
M
eet C
BM
Ben
chm
arks
(257
sed to monitor a school’s within-year progress towards achieving the AYP ee Figure 40.
2004 2005 2006 2007 2008 2009 2010 2011 2012 2013 2014End of School Year
Figure 40: Within-Year School Progress
sed to monitor a teacher’s within-year progress. See Figure 41.
0
100
200
300
400
500
Sept Oct Nov Dec Jan Feb Mar Apr May June2005 School-Year Month
X (281)
Figure 41: Within-Year Teacher Progress
53
0
5
10
15
20
25
Sept Oct Nov Dec Jan Feb Mar Apr May June2005 School-Year Month
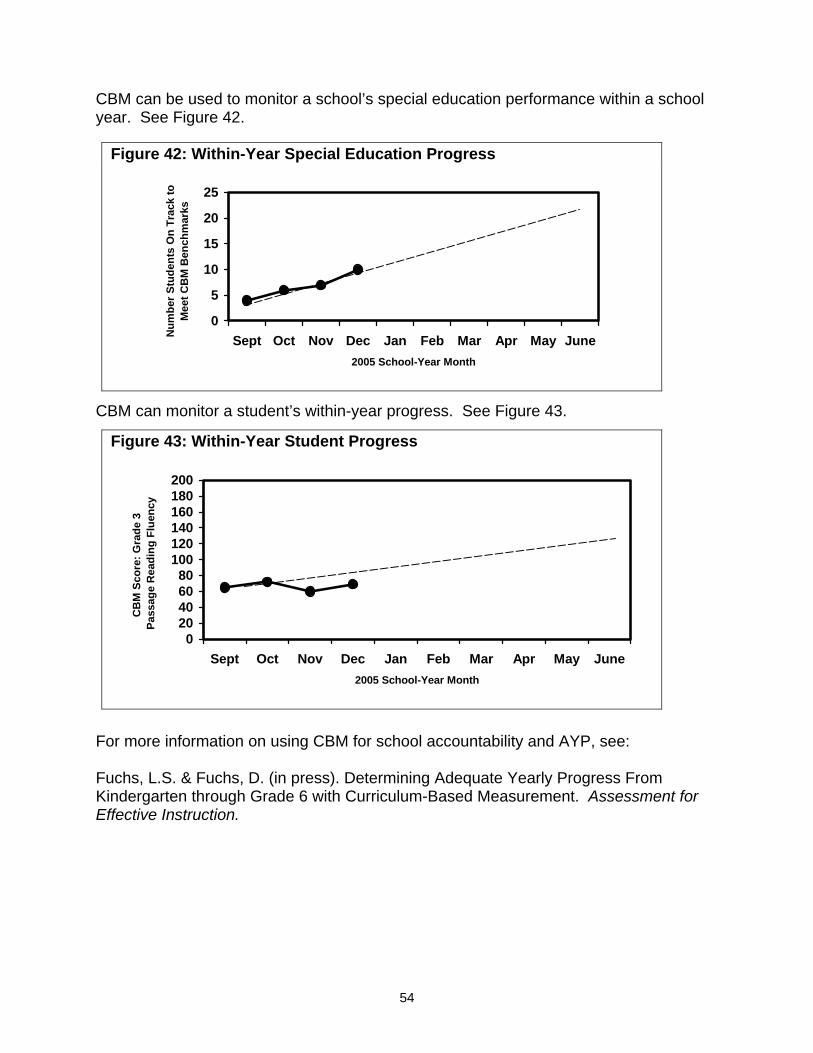
CBM can be used to monitor a school’s special education performance within a school year. See Figure 42. C F FKE
Figure 42: Within-Year Special Education Progress
BM can monitor a student’s within-year progress. See Figure 43.
0
5
10
15
20
25
Sept Oct Nov Dec Jan Feb Mar Apr May June2005 School-Year Month
Num
ber S
tude
nts
On
Trac
k to
M
eet C
BM
Ben
chm
arks
Figure 43: Within-Year Student Progress
020406080
100120140160180200
Sept Oct Nov Dec Jan Feb Mar Apr May June2005 School-Year Month
CB
M S
core
: Gra
de 3
Pas
sage
Rea
ding
Flu
ency
or more information on using CBM for school accountability and AYP, see:
uchs, L.S. & Fuchs, D. (in press). Determining Adequate Yearly Progress From indergarten through Grade 6 with Curriculum-Based Measurement. Assessment for ffective Instruction.
54
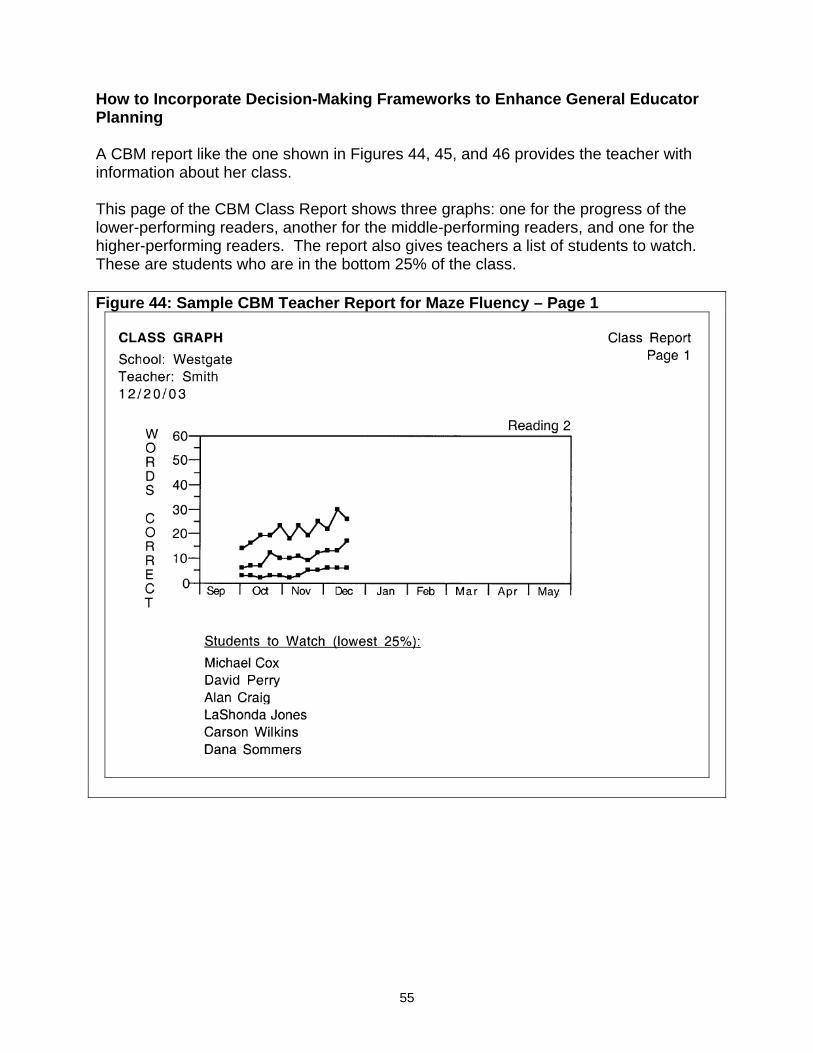
How to Incorporate Decision-Making Frameworks to Enhance General Educator Planning
A CBM report like the one shown in Figures 44, 45, and 46 provides the teacher with information about her class. This page of the CBM Class Report shows three graphs: one for the progress of the lower-performing readers, another for the middle-performing readers, and one for the higher-performing readers. The report also gives teachers a list of students to watch. These are students who are in the bottom 25% of the class. Figure 44: Sample CBM Teacher Report for Maze Fluency – Page 1
55
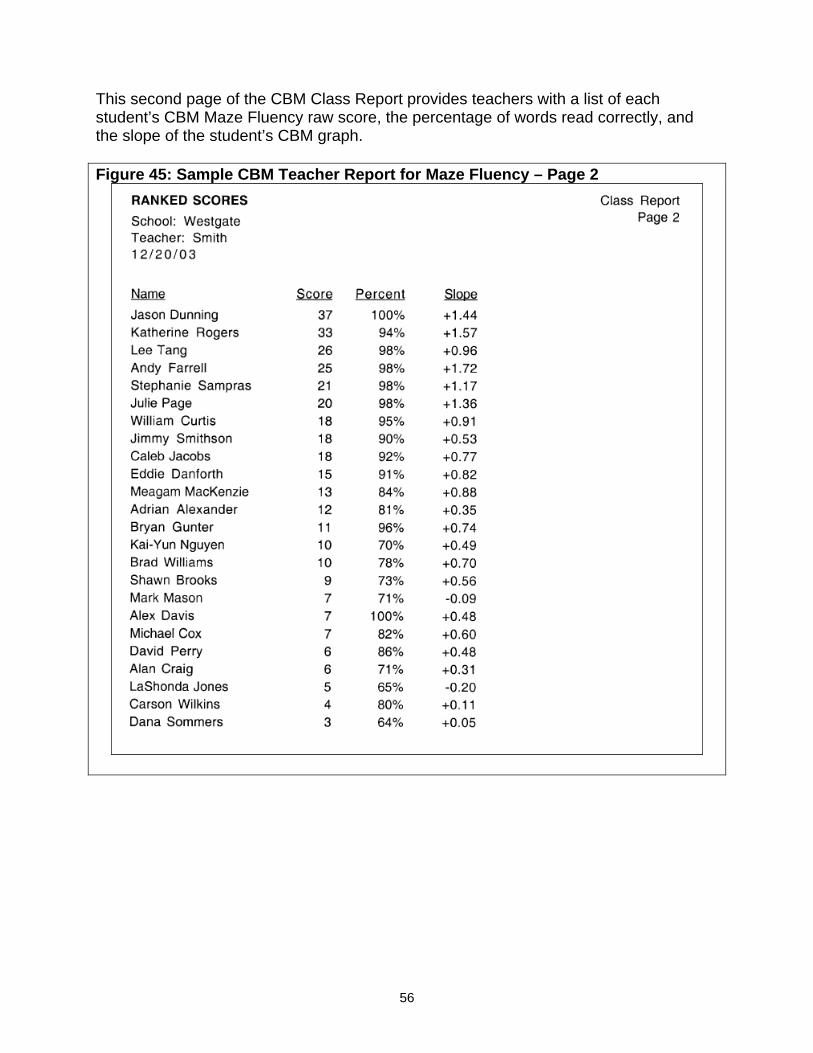
This second page of the CBM Class Report provides teachers with a list of each student’s CBM Maze Fluency raw score, the percentage of words read correctly, and the slope of the student’s CBM graph. Figure 45: Sample CBM Teacher Report for Maze Fluency – Page 2
56
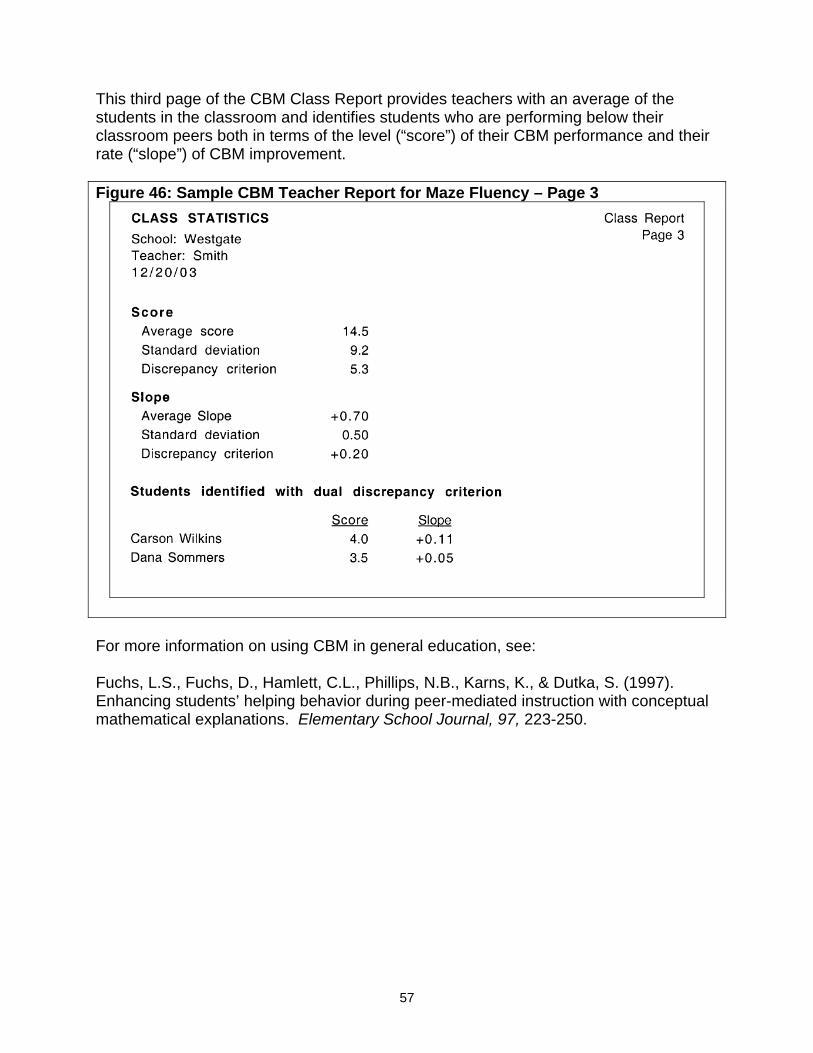
This third page of the CBM Class Report provides teachers with an average of the students in the classroom and identifies students who are performing below their classroom peers both in terms of the level (“score”) of their CBM performance and their rate (“slope”) of CBM improvement. Figure 46: Sample CBM Teacher Report for Maze Fluency – Page 3
For more information on using CBM in general education, see: Fuchs, L.S., Fuchs, D., Hamlett, C.L., Phillips, N.B., Karns, K., & Dutka, S. (1997). Enhancing students’ helping behavior during peer-mediated instruction with conceptual mathematical explanations. Elementary School Journal, 97, 223-250.
57
How to Use Progress Monitoring to Identify Non-Responders Within a Response-to-Intervention Framework to Identify Disability The traditional assessment framework for identifying students with learning disabilities relies on discrepancies between intelligence and achievement tests. This framework has been scrutinized and attacked due to measurement and conceptual differences. An alternative framework is one in which learning disability is conceptualized as non-responsiveness to otherwise effective instruction. It requires that special education be considered only when a student’s performance reveals a dual discrepancy: The student not only performs below the level demonstrated by classroom peers but also demonstrates a learning rate substantially below that of classmates. Educational outcomes differ across a population of learners and a low-performing student may ultimately perform not as well as his or her peers. All students do not achieve the same degree of reading competence. Just because reading growth is low, it does not mean the student should automatically receive special education services. If a low-performing student is learning at a rate similar to the growth rate of other students in the same classroom environment, he or she is demonstrating the capacity to profit from the educational environment. Additional intervention is unwarranted. However, when a low-performing student is not manifesting growth in a situation where others are thriving, consideration of special intervention is warranted. Alternative instructional methods must be tested to address the apparent mismatch between the student’s learning requirements and those represented in the conventional instructional program. CBM is a promising tool for identifying treatment responsiveness due to its capacity to model student growth, to evaluate treatment effects, and to simultaneously inform instructional programming. For more information on using CBM within a response-to-intervention approach to learning disability identification, see: Fuchs, L.S. & Fuchs, D. (2002). Curriculum-Based Measurement: Describing Competence, Enhancing Outcomes, Evaluating Treatment Effects, and Identifying Treatment Nonresponders. Peabody Journal of Education, 77, 64-84.
58
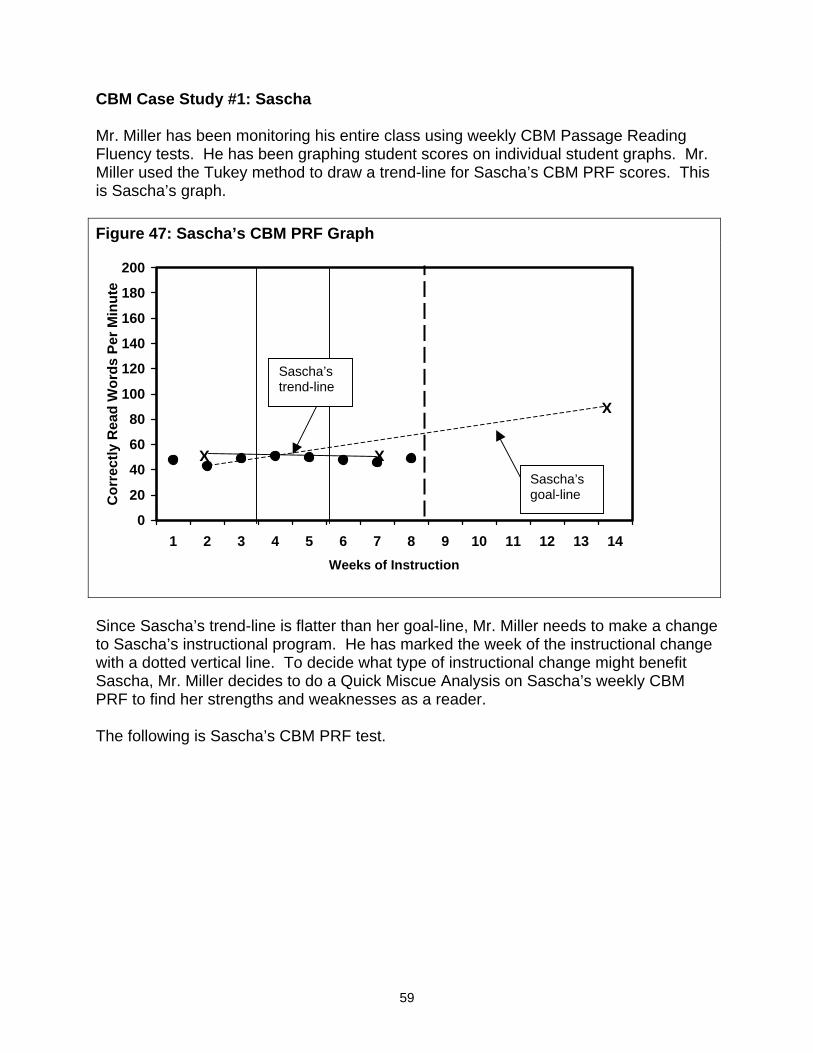
CBM Case Study #1: Sascha Mr. Miller has been monitoring his entire class using weekly CBM Passage Reading Fluency tests. He has been graphing student scores on individual student graphs. Mr. Miller used the Tukey method to draw a trend-line for Sascha’s CBM PRF scores. This is Sascha’s graph. Figure 47: Sascha’s CBM PRF Graph
0
20
40
60
80
100
120
140
160
180
200
1
Cor
rect
ly R
ead
Wor
ds P
er M
inut
e
X X
X
Sascha’s trend-line
Since Saschato Sascha’s iwith a dottedSascha, Mr. PRF to find h The following
2 3 4 5 6Weeks
’s trend-line is flatter thannstructional program. He vertical line. To decide wMiller decides to do a Quier strengths and weaknes
is Sascha’s CBM PRF te
7 8 9 10 11 12 13 of Instruction
Sascha’s goal-line
her goal-line, Mr. Miller needs t has marked the week of the insthat type of instructional change
ck Miscue Analysis on Sascha’s ses as a reader.
st.
59
14
o make a change ructional change might benefit weekly CBM
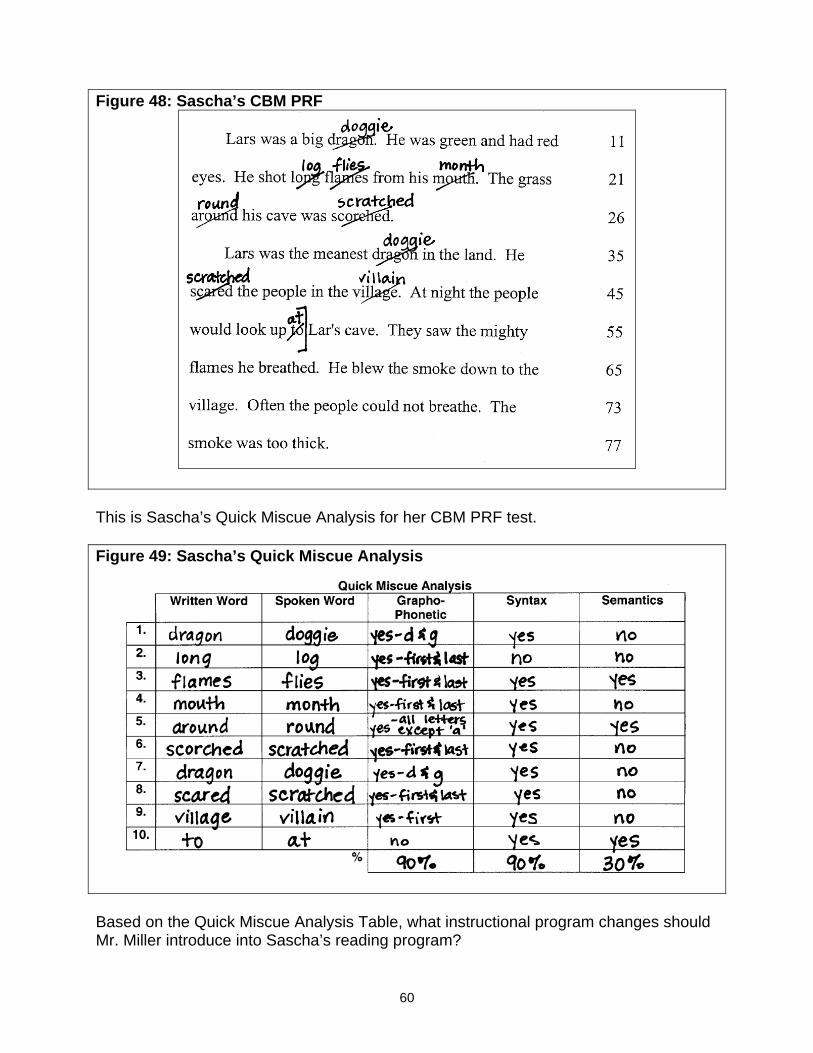
Figure 48: Sascha’s CBM PRF
This is Sascha’s Quick Miscue Analysis for her CBM PRF test. Figure 49: Sascha’s Quick Miscue Analysis
Based on the Quick Miscue Analysis Table, what instructional program changes should Mr. Miller introduce into Sascha’s reading program?
60
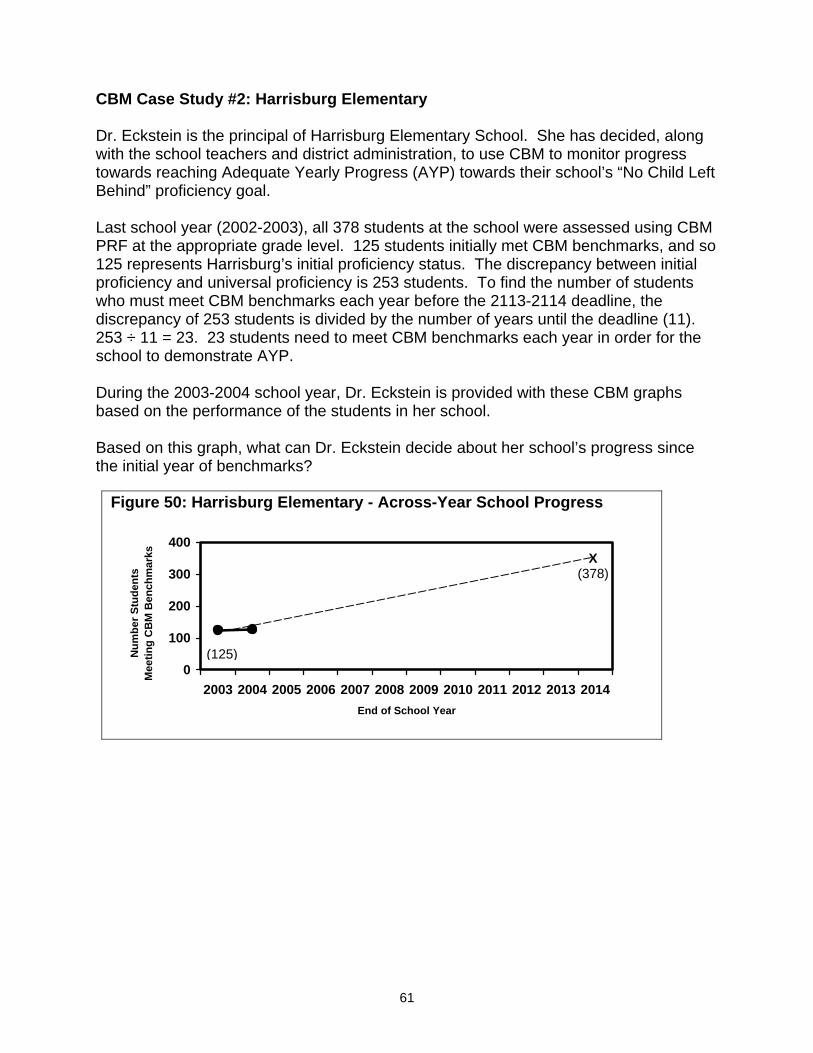
CBM Case Study #2: Harrisburg Elementary Dr. Eckstein is the principal of Harrisburg Elementary School. She has decided, along with the school teachers and district administration, to use CBM to monitor progress towards reaching Adequate Yearly Progress (AYP) towards their school’s “No Child Left Behind” proficiency goal. Last school year (2002-2003), all 378 students at the school were assessed using CBM PRF at the appropriate grade level. 125 students initially met CBM benchmarks, and so 125 represents Harrisburg’s initial proficiency status. The discrepancy between initial proficiency and universal proficiency is 253 students. To find the number of students who must meet CBM benchmarks each year before the 2113-2114 deadline, the discrepancy of 253 students is divided by the number of years until the deadline (11). 253 ÷ 11 = 23. 23 students need to meet CBM benchmarks each year in order for the school to demonstrate AYP. During the 2003-2004 school year, Dr. Eckstein is provided with these CBM graphs based on the performance of the students in her school. Based on this graph, what can Dr. Eckstein decide about her school’s progress since the initial year of benchmarks?
Figure 50: Harrisburg Elementary - Across-Year School Progress
0
100
200
300
400
Num
ber S
tude
nts
Mee
ting
CB
M B
ench
mar
ks X (378)
)
(1252003 2004 2005 2006 2007 2008 2009 2010 2011 2012 2013 2014End of School Year
61
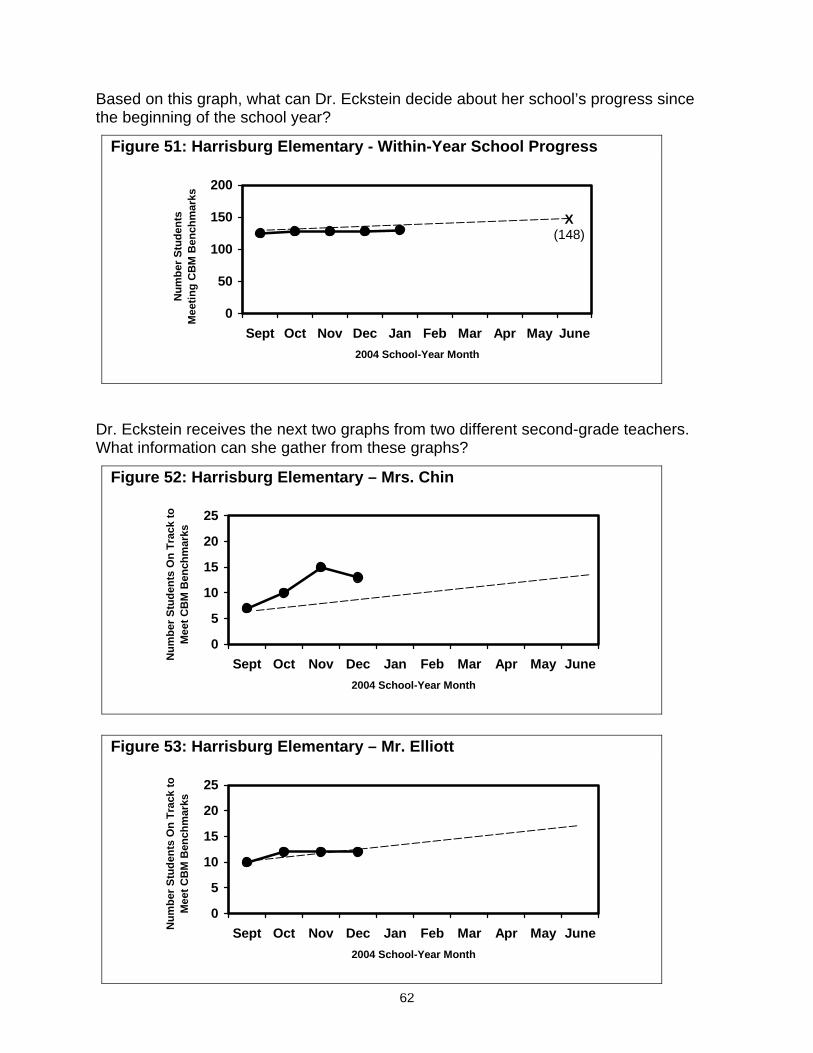
Based on this graph, what can Dr. Eckstein decide about her school’s progress since the beginning of the school year? DW
Figure 51: Harrisburg Elementary - Within-Year School Progress
r. Eckstein receives the next two graphs from two different second-grade teachers. hat information can she gather from these graphs?
0
50
100
150
200
Sept Oct Nov Dec Jan Feb Mar Apr May June2004 School-Year Month
Num
ber S
tude
nts
Mee
ting
CB
M B
ench
mar
ks
X (148)
Figure 52: Harrisburg Elementary – Mrs. Chin
0
5
10
15
20
25
Sept Oct Nov Dec Jan Feb Mar Apr May June2004 School-Year Month
Num
ber S
tude
nts
On
Trac
k to
M
eet C
BM
Ben
chm
arks
Figure 53: Harrisburg Elementary – Mr. Elliott
62
0
5
10
15
20
25
Sept Oct Nov Dec Jan Feb Mar Apr May June2004 School-Year Month
Num
ber S
tude
nts
On
Trac
k to
M
eet C
BM
Ben
chm
arks
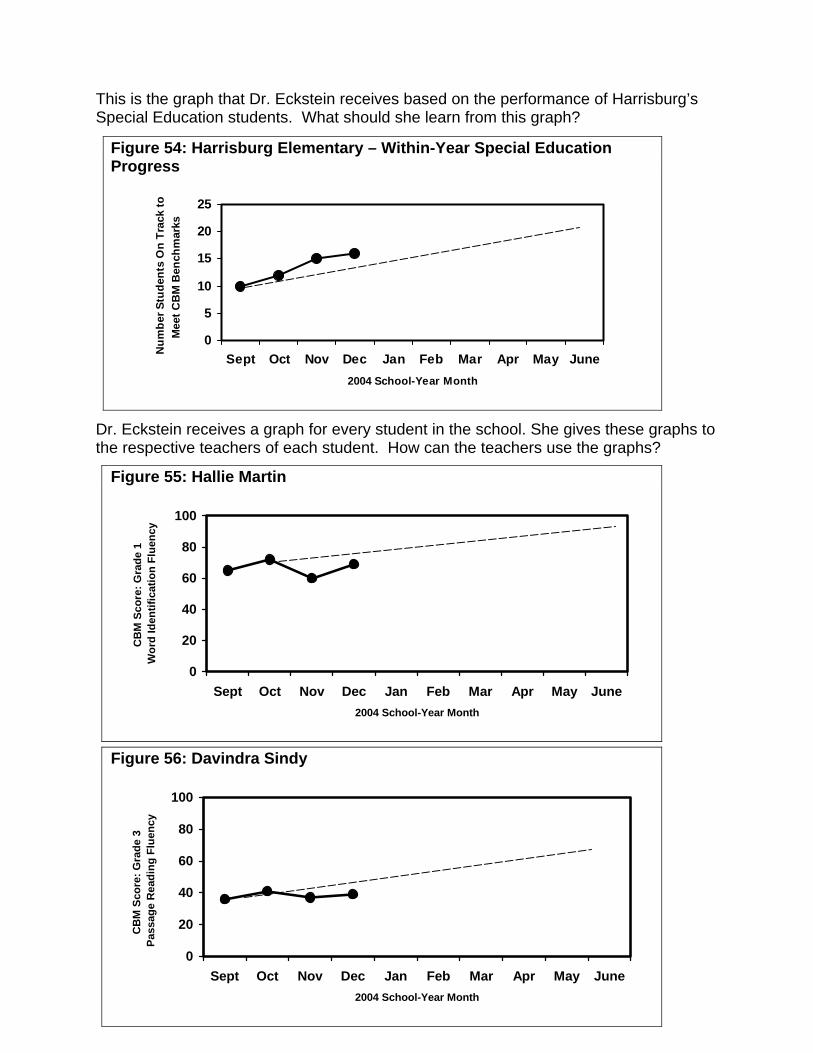
This is the graph that Dr. Eckstein receives based on the performance of Harrisburg’s Special Education students. What should she learn from this graph? Dr. Eckstein receives a graph for every student in the school. She gives these graphs to the respective teachers of each student. How can the teachers use the graphs?
Figure 54: Harrisburg Elementary – Within-Year Special Education Progress
0
5
10
15
20
25
Sept Oct Nov Dec Jan Feb Mar Apr May June2004 School-Year Month
Num
ber S
tude
nts
On
Trac
k to
Mee
t CB
M B
ench
mar
ks
Figure 55: Hallie Martin
0
20
40
60
80
100
Sept Oct Nov Dec Jan Feb Mar Apr May June2004 School-Year Month
CB
M S
core
: Gra
de 1
Wor
d Id
entif
icat
ion
Flue
ncy
Figure 56: Davindra Sindy63
0
20
40
60
80
100
Sept Oct Nov Dec Jan Feb Mar Apr May June2004 School-Year Month
CB
M S
core
: Gra
de 3
Pas
sage
Rea
ding
Flu
ency
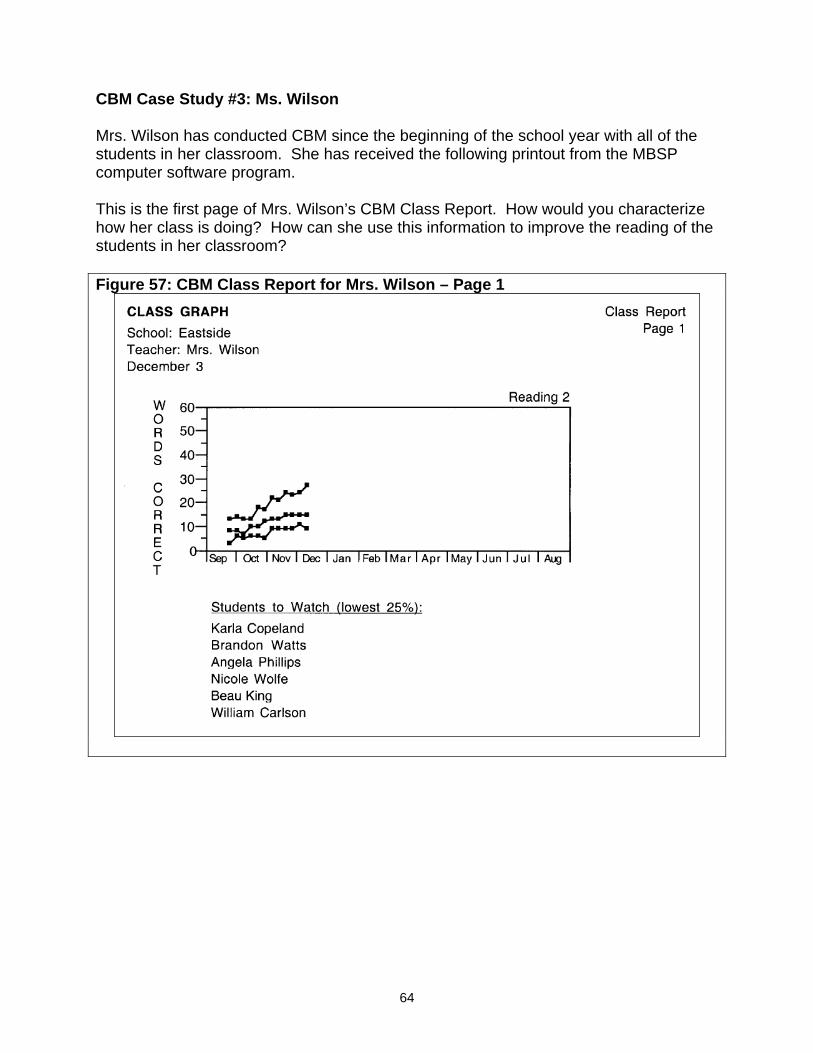
CBM Case Study #3: Ms. Wilson Mrs. Wilson has conducted CBM since the beginning of the school year with all of the students in her classroom. She has received the following printout from the MBSP computer software program. This is the first page of Mrs. Wilson’s CBM Class Report. How would you characterize how her class is doing? How can she use this information to improve the reading of the students in her classroom? Figure 57: CBM Class Report for Mrs. Wilson – Page 1
64
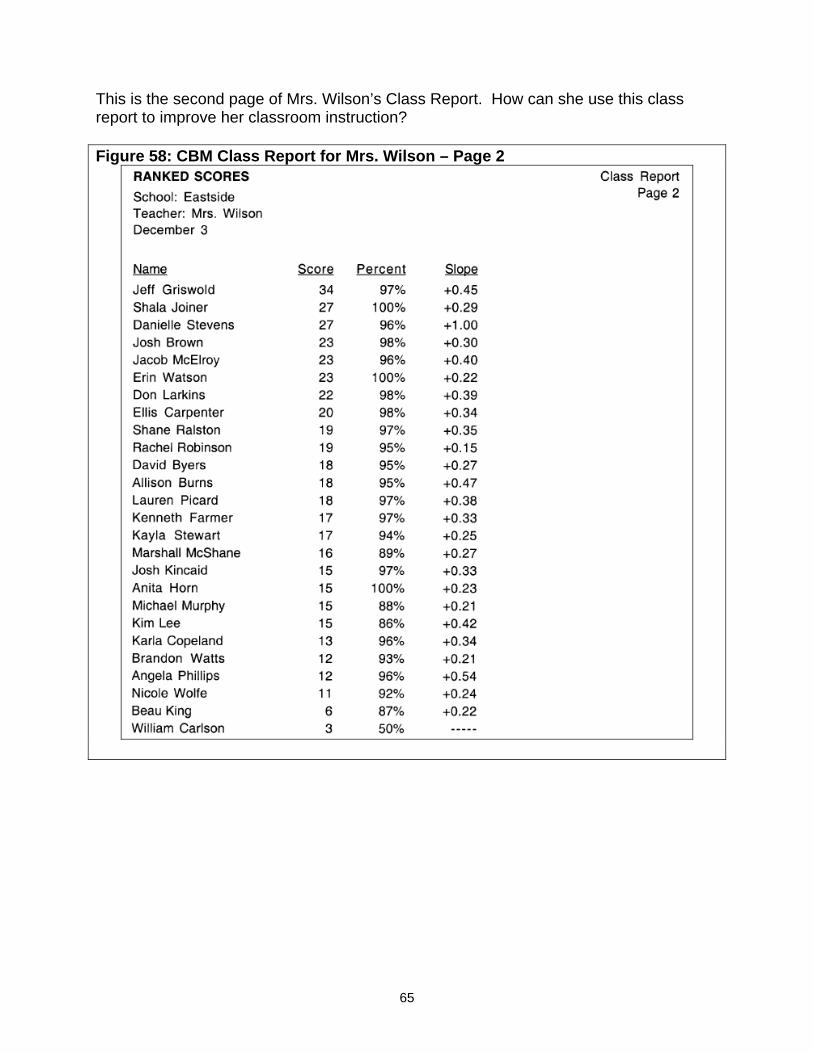
This is the second page of Mrs. Wilson’s Class Report. How can she use this class report to improve her classroom instruction? Figure 58: CBM Class Report for Mrs. Wilson – Page 2
65
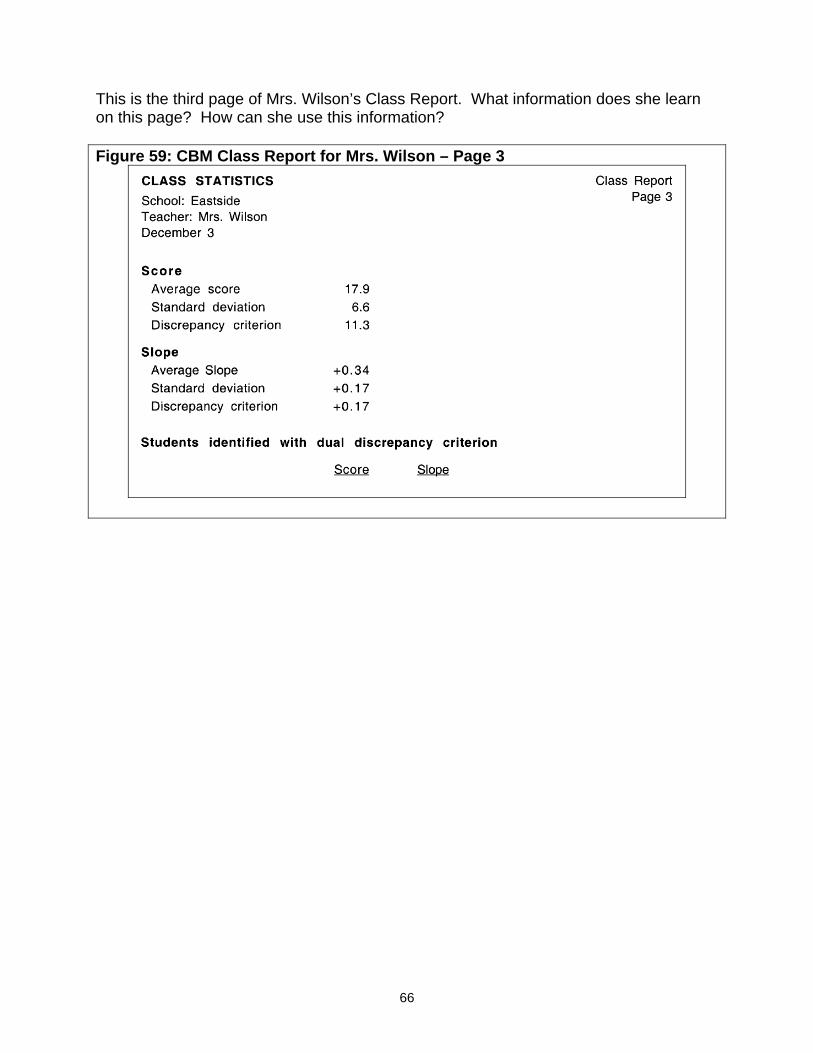
This is the third page of Mrs. Wilson’s Class Report. What information does she learn on this page? How can she use this information? Figure 59: CBM Class Report for Mrs. Wilson – Page 3
66
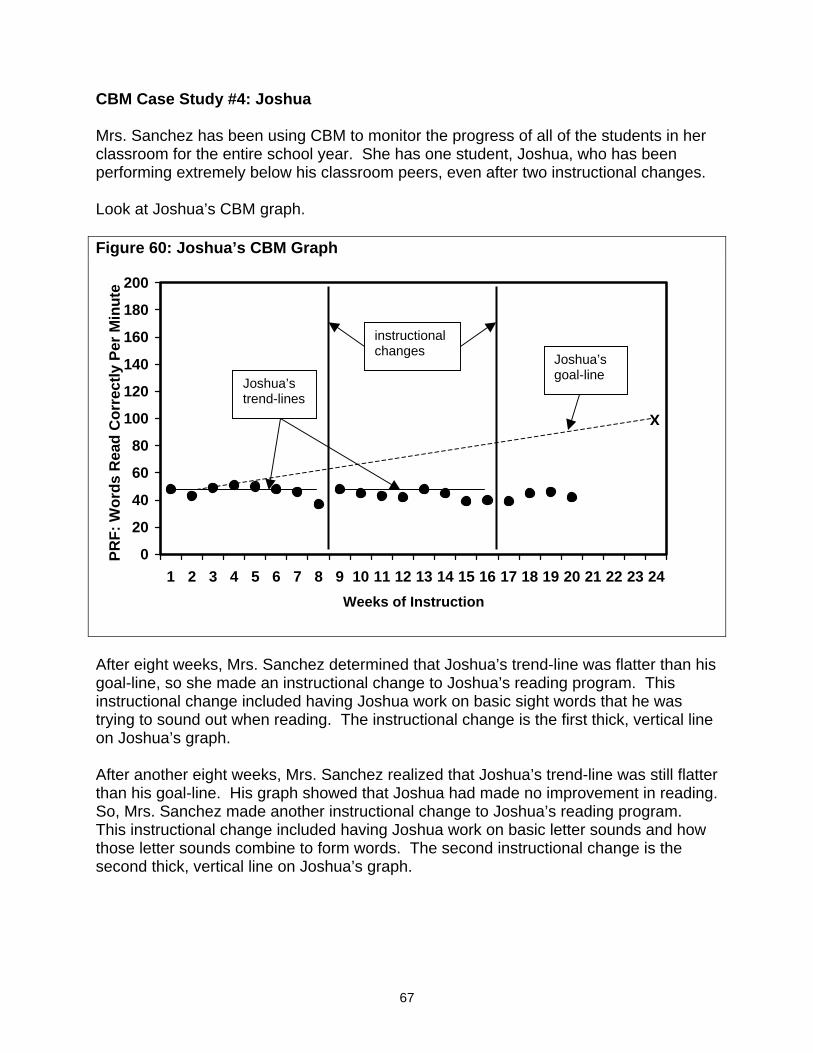
CBM Case Study #4: Joshua Mrs. Sanchez has been using CBM to monitor the progress of all of the students in her classroom for the entire school year. She has one student, Joshua, who has been performing extremely below his classroom peers, even after two instructional changes. Look at Joshua’s CBM graph. Figure 60: Joshua’s CBM Graph
0
20
40
60
80
100
120
140
160
180
200
1 2 3 4 5 6 7 8 9 10 11 12 13 14 15 16 17 18 19 20 21 22 23Weeks of Instruction
PRF:
Wor
ds R
ead
Cor
rect
ly P
er M
inut
e
X
Joshua’s goal-line Joshua’s
trend-lines
instructional changes
After eight weeks, Mrs. Sanchez determined that Joshua’s trend-line was flattgoal-line, so she made an instructional change to Joshua’s reading program. instructional change included having Joshua work on basic sight words that htrying to sound out when reading. The instructional change is the first thick, von Joshua’s graph. After another eight weeks, Mrs. Sanchez realized that Joshua’s trend-line wasthan his goal-line. His graph showed that Joshua had made no improvement So, Mrs. Sanchez made another instructional change to Joshua’s reading proThis instructional change included having Joshua work on basic letter soundsthose letter sounds combine to form words. The second instructional change second thick, vertical line on Joshua’s graph.
67
24
er than his This e was ertical line
still flatter in reading. gram. and how is the
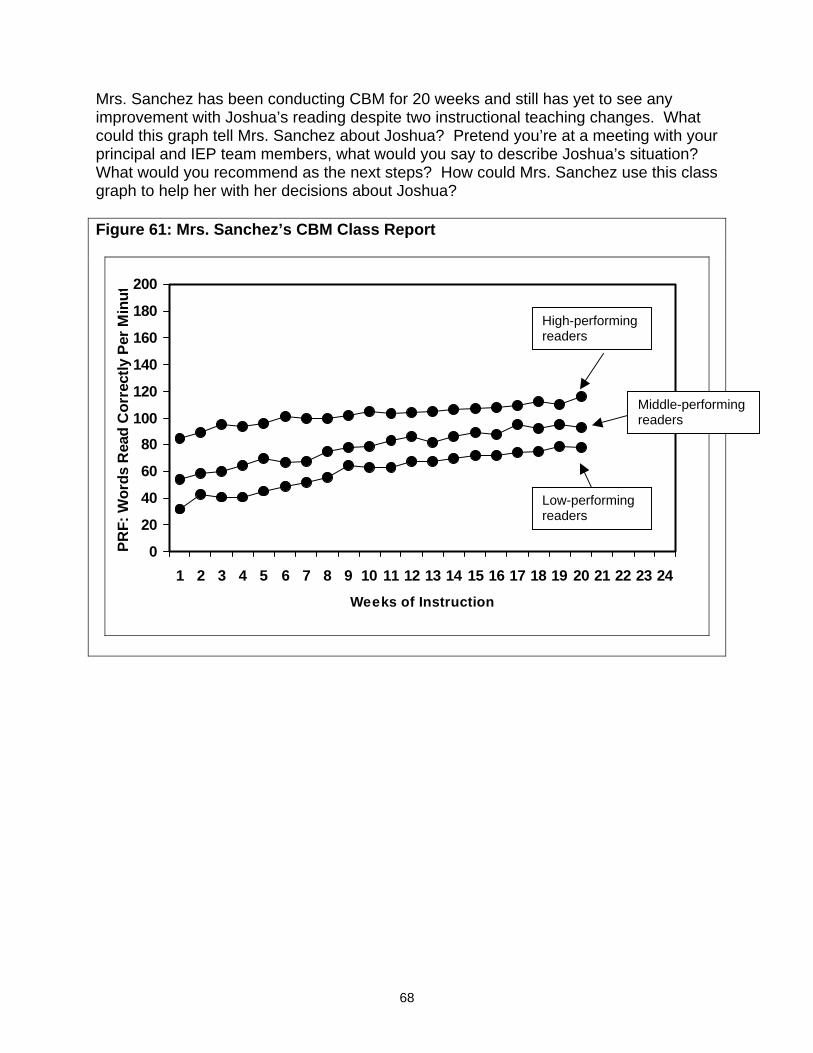
Mrs. Sanchez has been conducting CBM for 20 weeks and still has yet to see any improvement with Joshua’s reading despite two instructional teaching changes. What could this graph tell Mrs. Sanchez about Joshua? Pretend you’re at a meeting with your principal and IEP team members, what would you say to describe Joshua’s situation? What would you recommend as the next steps? How could Mrs. Sanchez use this class graph to help her with her decisions about Joshua? Figure 61: Mrs. Sanchez’s CBM Class Report
0
20
40
60
80100
120
140
160
180
200
1 2 3 4 5 6 7 8 9 10 11 12 13 14 15 16 17 18 19 20 21 22 23 24
Weeks of Instruction
PRF:
Wor
ds R
ead
Cor
rect
ly P
er M
inut
Low-performing readers
Middle-performing readers
High-performing readers
68
Appendix A – CBM Materials The various CBM reading measures and computer software may be obtained from the following sources. AIMSweb / Edformation (CBM reading passages and computer software) AIMSweb is based on CBM. It provides materials for CBM data collection and supports data use. The following reading measures are available:
• Standard Benchmark Reading Assessment Passages: • 3 graded and equivalent passages for grades 1-8 for establishing fall,
winter, and spring benchmarks • (24 total passages) • also available in Spanish
• Standard Progress Monitoring Reading Assessment Passages: • 30 graded and equivalent passages for grades 2-8 • 23 graded and equivalent passages for grade 1 • 23 graded and equivalent passages for primer level • (256 passages total)
• Standard Benchmark Early Literacy Assessment Measures: • 3 equivalent Standard Benchmark Early Literacy Measures to assess
Phonemic Awareness and Phonics for kindergarten and grade 1 for establishing fall, winter, and spring benchmarks
• Standard Progress Monitoring Early Literacy Measures: • 30 equivalent Standard Early Literacy Measures for kindergarten and
grade 1 • (30 tests for each indicator)
• Standard Benchmark Reading Maze Passages: • 3 Standard Assessment Reading Passages for grades 1-8 have been
prepared in a maze (multiple choice close) format to use as another measure of reading comprehension
• (24 maze passages total) • Standard Progress Monitoring Reading Maze Passages:
• 30 graded and equivalent passages prepared in maze format for grades 2-8
• 23 graded and equivalent passages prepared in maze format for grade 1 • 23 graded and equivalent passages prepared in maze format for pre-
primer level • (256 passages total)
The following are provided with the passages:
• Administration and Scoring Directions • Directions for Organizing and Implementing a Benchmark Assessment Program
69
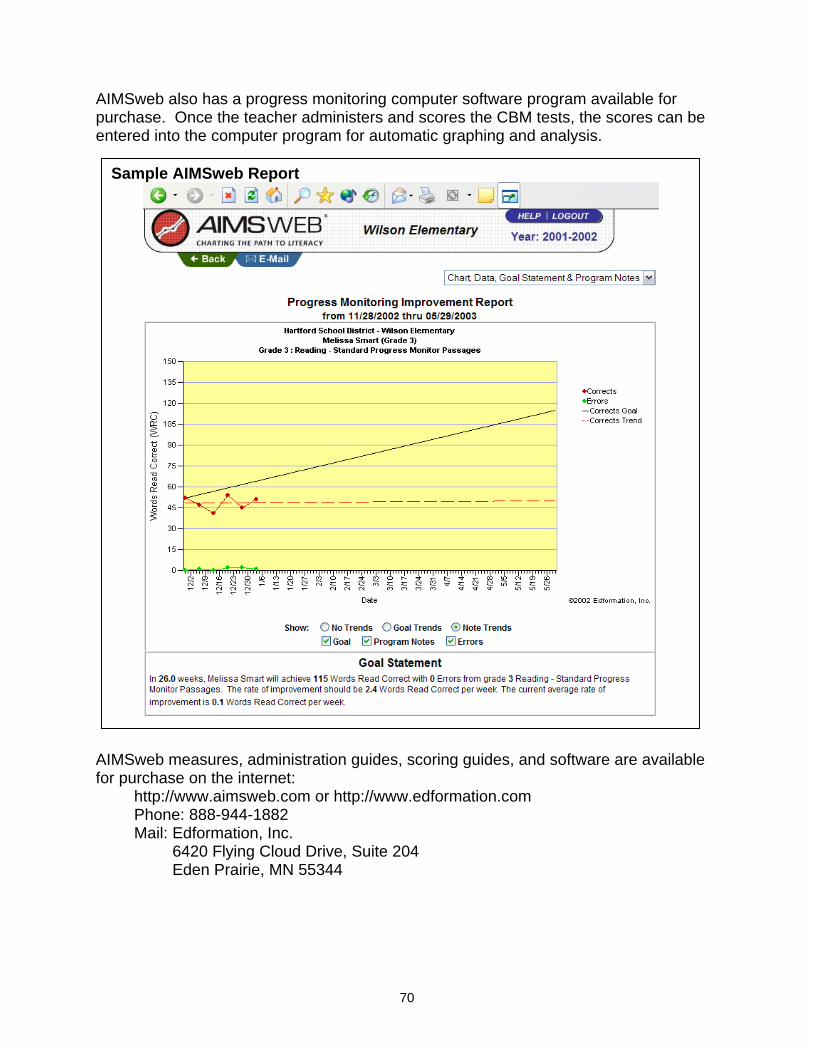
AIMSweb also has a progress monitoring computer software program available for purchase. Once the teacher administers and scores the CBM tests, the scores can be entered into the computer program for automatic graphing and analysis.
Sample AIMSweb Report
AIMSweb measures, administration guides, scoring guides, and software are available for purchase on the internet: http://www.aimsweb.com or http://www.edformation.com Phone: 888-944-1882 Mail: Edformation, Inc. 6420 Flying Cloud Drive, Suite 204 Eden Prairie, MN 55344
70
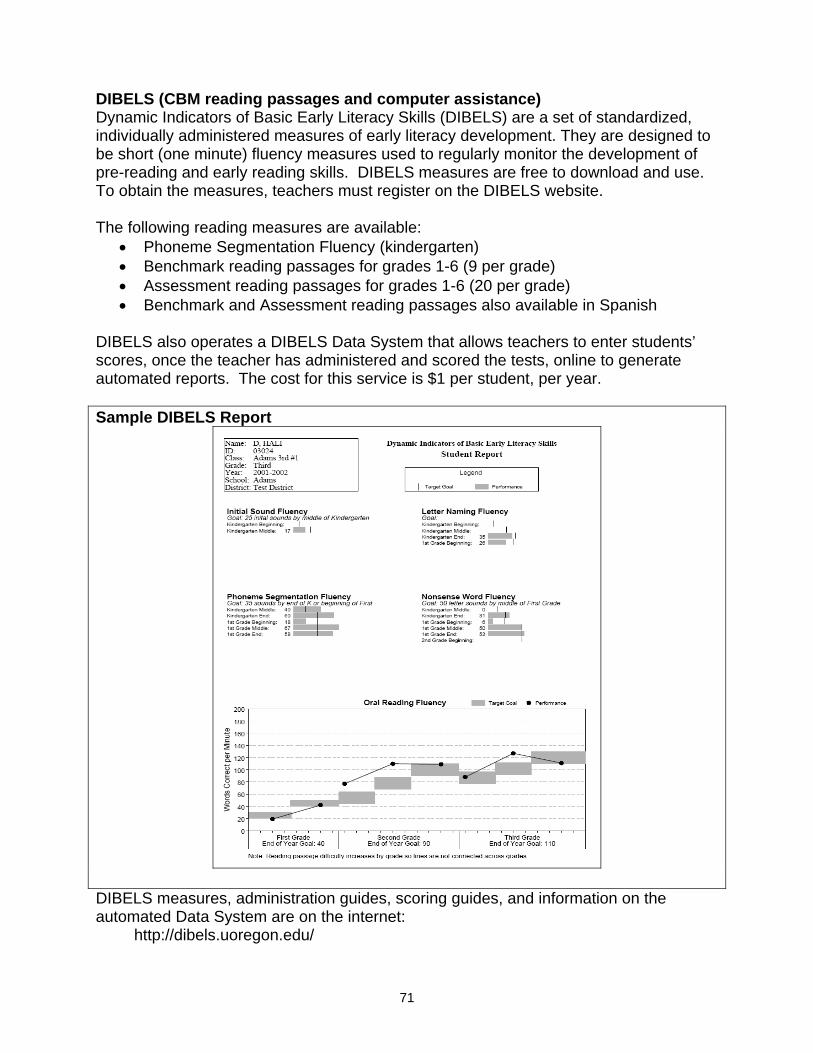
DIBELS (CBM reading passages and computer assistance) Dynamic Indicators of Basic Early Literacy Skills (DIBELS) are a set of standardized, individually administered measures of early literacy development. They are designed to be short (one minute) fluency measures used to regularly monitor the development of pre-reading and early reading skills. DIBELS measures are free to download and use. To obtain the measures, teachers must register on the DIBELS website. The following reading measures are available:
• Phoneme Segmentation Fluency (kindergarten) • Benchmark reading passages for grades 1-6 (9 per grade) • Assessment reading passages for grades 1-6 (20 per grade) • Benchmark and Assessment reading passages also available in Spanish
DIBELS also operates a DIBELS Data System that allows teachers to enter students’ scores, once the teacher has administered and scored the tests, online to generate automated reports. The cost for this service is $1 per student, per year. Sample DIBELS Report
DIBELS measures, administration guides, scoring guides, and information on the automated Data System are on the internet: http://dibels.uoregon.edu/
71
Edcheckup (CBM reading passages) Edcheckup offers an assessment system for screening student performance and measuring student progress toward goals in reading, based on the CBM model. The assessment system administers and scores student tests via computer. The following reading passages are available:
• 138 Oral Reading passages for grades 1-6 • 138 Maze Reading passages for grades 1-6 • 23 Letter Sounds reading probes • 23 Isolated Words reading probes
The following computer assistance is available:
• Student data and scores are entered on-line. • Reports and graphs are automatically generated that follow class and student
progress. • Guidelines for setting annual goals and evaluating student progress are provided.
Edcheckup reading passages are available for purchase on the internet: http://www.edcheckup.com Phone: 952-229-1440 Mail: WebEdCo 7701 York Avenue South – Suite 250 Edina, MN 55435
72
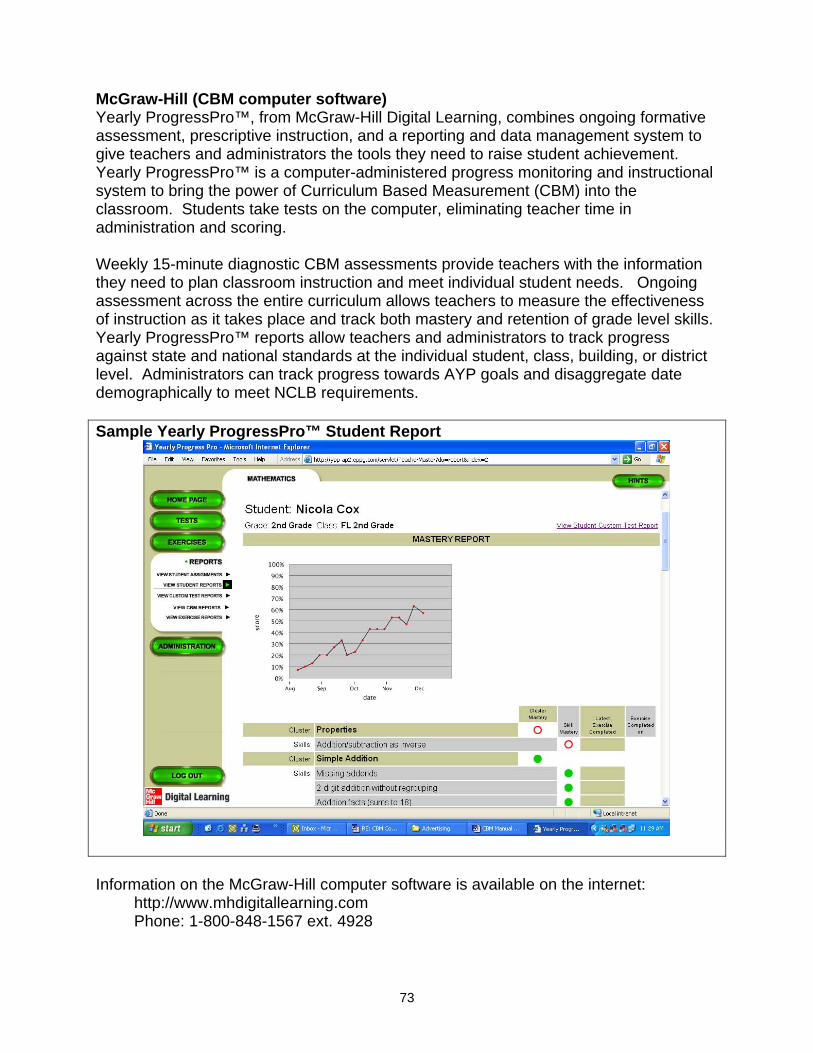
McGraw-Hill (CBM computer software) Yearly ProgressPro™, from McGraw-Hill Digital Learning, combines ongoing formative assessment, prescriptive instruction, and a reporting and data management system to give teachers and administrators the tools they need to raise student achievement. Yearly ProgressPro™ is a computer-administered progress monitoring and instructional system to bring the power of Curriculum Based Measurement (CBM) into the classroom. Students take tests on the computer, eliminating teacher time in administration and scoring. Weekly 15-minute diagnostic CBM assessments provide teachers with the information they need to plan classroom instruction and meet individual student needs. Ongoing assessment across the entire curriculum allows teachers to measure the effectiveness of instruction as it takes place and track both mastery and retention of grade level skills. Yearly ProgressPro™ reports allow teachers and administrators to track progress against state and national standards at the individual student, class, building, or district level. Administrators can track progress towards AYP goals and disaggregate date demographically to meet NCLB requirements. Sample Yearly ProgressPro™ Student Report
Information on the McGraw-Hill computer software is available on the internet: http://www.mhdigitallearning.com Phone: 1-800-848-1567 ext. 4928
73
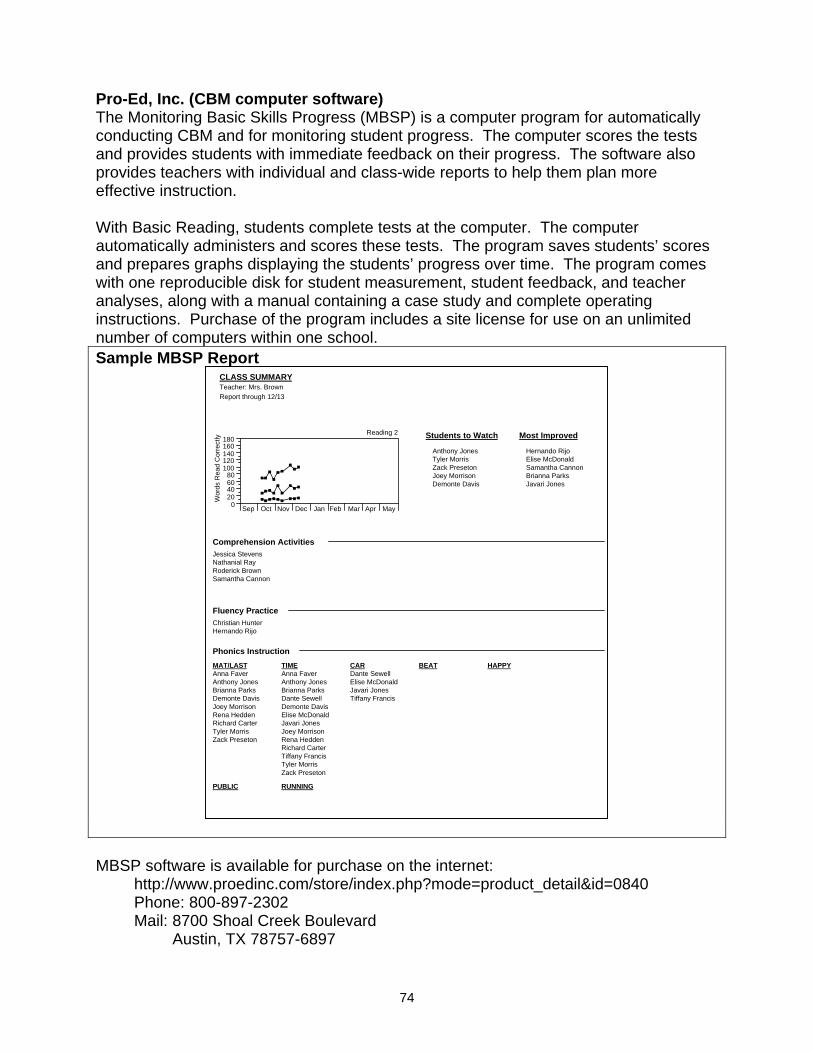
Pro-Ed, Inc. (CBM computer software) The Monitoring Basic Skills Progress (MBSP) is a computer program for automatically conducting CBM and for monitoring student progress. The computer scores the tests and provides students with immediate feedback on their progress. The software also provides teachers with individual and class-wide reports to help them plan more effective instruction. With Basic Reading, students complete tests at the computer. The computer automatically administers and scores these tests. The program saves students’ scores and prepares graphs displaying the students’ progress over time. The program comes with one reproducible disk for student measurement, student feedback, and teacher analyses, along with a manual containing a case study and complete operating instructions. Purchase of the program includes a site license for use on an unlimited number of computers within one school. Sample MBSP Report
MBSP software is available for purchase on the internet: http://www.proedinc.com/store/index.php?mode=product_detail&id=0840
CLASS SUMMARYTeacher: Mrs. BrownReport through 12/13
0 20 40 60 80
100 120 140 160 180
Sep Oct Nov Dec Jan Feb Mar Apr May
Reading 2
Wor
ds R
ead
Cor
rect
ly Students to Watch
Anthony JonesTyler MorrisZack PresetonJoey MorrisonDemonte Davis
Most Improved
Hernando RijoElise McDonaldSamantha CannonBrianna ParksJavari Jones
Comprehension ActivitiesJessica StevensNathanial RayRoderick BrownSamantha Cannon
Fluency PracticeChristian HunterHernando Rijo
Phonics InstructionMAT/LASTAnna FaverAnthony JonesBrianna ParksDemonte DavisJoey MorrisonRena HeddenRichard CarterTyler MorrisZack Preseton
TIMEAnna FaverAnthony JonesBrianna ParksDante SewellDemonte DavisElise McDonaldJavari JonesJoey MorrisonRena HeddenRichard CarterTiffany FrancisTyler MorrisZack Preseton
CARDante SewellElise McDonaldJavari JonesTiffany Francis
BEAT HAPPY
PUBLIC RUNNING
Phone: 800-897-2302 Mail: 8700 Shoal Creek Boulevard Austin, TX 78757-6897
74
University of Maryland (CBM reading passages) Materials for CBM Passage Reading Fluency Tests and CBM Letter Sound Fluency Tests were developed and researched using standard CBM procedures. The following reading passages are available:
• Letter Sound Fluency Test (practice list, 12 lists) • Oral Reading Fluency passages for grade 1 (15 passages) • Oral Reading Fluency passages for grade 2 (19 passages) • Oral Reading Fluency passages for grade 3 (14 passages) • Oral Reading Fluency passages for grade 4 (14 passages)
The CBM measures are free to download and use. The CBM measures, teacher scoring sheets, administration instructions and scoring instructions are on the internet: http://www.glue.umd.edu/~dlspeece/cbmreading
75
Vanderbilt University (CBM reading passages) CBM materials were developed and researched using standard CBM procedures. The following reading passages are available:
• Letter Sound Fluency Test for kindergarten (5 tests) • Word Identification Fluency Test for grade 1 (20 tests) • CBM Reading passages for grades 1-8 (30 passages per grade) • Maze Fluency passages for grades 1-6 (30 passages per grade)
The CBM measures are free, except for copying costs and postage. The CBM measures, scoring sheets, administration instructions, and scoring instructions are available:
Phone: 615-343-4782 Mail: Diana Phillips Peabody #328 230 Appleton Place Nashville, TN 37203-5721
76
Appendix B – Resources Deno, S.L. (1985). Curriculum-based measurement: The emerging alternative. Exceptional Children, 52, 219-232. Deno, S.L., Fuchs, L.S., Marston, D., & Shin, J. (2001). Using curriculum-based measurement to establish growth standards for students with learning disabilities. School Psychology Review, 30, 507-524. Deno, S.L., & Mirkin, P.K. (1977). Data-based program modification: A manual. Reston, VA: Council for Exceptional Children. Fuchs, L.S. (1987). Curriculum-based measurement for instructional program development. Teaching Exceptional Children, 20, 42-44. Fuchs, L.S. & Deno, S.L. (1987). Developing curriculum-based measurement systems for data-based special education problem solving. Focus on Exceptional Children, 19, 1-16. Fuchs, L.S., & Deno, S.L. (1991). Paradigmatic distinctions between instructionally relevant measurement models. Exceptional Children, 57, 488-501. Fuchs, L.S., & Deno, S.L. (1994). Must instructionally useful performance assessment be based in the curriculum? Exceptional Children, 61, 15-24. Fuchs, L.S., Deno, S.L., & Mirkin, P.K. (1984). Effects of frequent curriculum-based measurement of evaluation on pedagogy, student achievement, and student awareness of learning. American Educational Research Journal, 21, 449-460. Fuchs, L.S. & Fuchs, D. (1990). Curriculum-based assessment. In C. Reynolds & R. Kamphaus (Eds.) Handbook of psychological and educational assessment of children (Vol. 1): Intelligence and achievement. New York: Guilford Press. Fuchs, L.S., & Fuchs, D. (1992). Identifying a measure for monitoring student reading progress. School Psychology Review, 58, 45-58. Fuchs, L.S., & Fuchs, D. (1996). Combining performance assessment and curriculum-based measurement to strengthen instructional planning. Learning Disabilities Research and Practice, 11, 183-192. Fuchs, L.S., & Fuchs, D. (1998). Treatment validity: A unifying concept for reconceptualizing the identification of learning disabilities. Learning Disabilities Research and Practice, 13, 204-219. Fuchs, L.S., & Fuchs, D. (1999). Monitoring student progress toward the development of reading competence: A review of three forms of classroom-based assessment. School Psychology Review, 28, 659-671.
77
Fuchs, L.S., & Fuchs, D. (2000). Curriculum-based measurement and performance assessment. In E.S. Shapiro & T.R. Kratochwill (Eds.), Behavioral assessment in schools: Theory, research, and clinical foundations (2nd ed., pp. 168-201). New York: Guilford. Fuchs, L.S., & Fuchs, D. (2002). Curriculum-based measurement: Describing competence, enhancing outcomes, evaluating treatment effects, and identifying treatment nonresponders. Peabody Journal of Education, 77, 64-84. Fuchs, L.S. & Fuchs, D. (in press). Determining Adequate Yearly Progress From Kindergarten through Grade 6 with Curriculum-Based Measurement. Assessment for Effective Instruction. Fuchs, L.S., Fuchs, D., & Hamlett, C.L. (1989a). Effects of alternative goal structures within curriculum-based measurement. Exceptional Children, 55, 429-438. Fuchs, L.S., Fuchs, D., & Hamlett, C.L. (1989b). Effects of instrumental use of curriculum-based measurement to enhance instructional programs. Remedial and Special Education, 10, 43-52. Fuchs, L.S., Fuchs, D., & Hamlett, C.L. (1990). Curriculum-based measurement: A standardized long-term goal approach to monitoring student progress. Academic Therapy, 25, 615-632. Fuchs, L.S., Fuchs, D., & Hamlett, C.L. (1993). Technological advances linking the assessment of students’ academic proficiency to instructional planning. Journal of Special Education Technology, 12, 49-62. Fuchs, L.S., Fuchs, D., & Hamlett, C.L. (1994). Strengthening the connection between assessment and instructional planning with expert systems. Exceptional Children, 61, 138-146. Fuchs, L.S., Fuchs, D., & Hamlett, C.L. (in press). Using technology to facilitate and enhance curriculum-based measurement. In K. Higgins, R. Boone, & D. Edyburn (Eds.), The Handbook of special education technology research and practice. Knowledge by Design, Inc.: Whitefish Bay, WI.
Fuchs, L.S., Fuchs, D., Hamlett, C.L., Phillips, N.B., & Karns, K. (1995). General educators’ specialized adaptation for students with learning disabilities. Exceptional Children, 61, 440-459. Fuchs, L.S., Fuchs, D., Hamlett, C.L., Phillips, N.B., Karns, K., & Dutka, S. (1997). Enhancing students’ helping behavior during peer-mediated instruction with conceptual mathematical explanations. Elementary School Journal, 97, 223-250.
78
Fuchs, L.S., Fuchs, D., Hamlett, C.L., & Stecker, P.M. (1991). Effects of curriculum-based measurement and consultation on teacher planning and student achievement in mathematics operations. American Educational Research Journal, 28, 617-641. Fuchs, L.S., Fuchs, D., Hamlett, C.L., Thompson, A., Roberts, P.H., Kubek, P., & Stecker, P.S. (1994). Technical features of a mathematics concepts and applications curriculum-based measurement system. Diagnostique, 19, 23-49. Fuchs, L.S., Fuchs, D., Hamlett, C.L, Walz, L., & Germann, G. (1993). Formative evaluation of academic progress: How much growth can we expect? School Psychology Review, 22, 27-48. Fuchs, L.S., Fuchs, D., Hosp, M., & Hamlett, C.L. (2003). The potential for diagnostic analysis within curriculum-based measurement. Assessment for Effective Intervention, 28, 13-22. Fuchs, L.S., Fuchs, D., Hosp, M.K., & Jenkins, J.R. (2001). Oral reading fluency as an indicator of reading competence: A theoretical, empirical, and historical analysis. Scientific Studies of Reading, 5, 241-258. Fuchs, L.S., Fuchs, D., Karns, K., Hamlett, C.L., Dutka, S., & Katzaroff, M. (2000). The importance of providing background information on the structure and scoring of performance assessments. Applied Measurement in Education, 13, 83-121. Fuchs, L.S., Fuchs, D., Karns, K., Hamlett, C.L., & Katzaroff, M. (1999). Mathematics performance assessment in the classroom: Effects on teacher planning and student learning. American Educational Research Journal, 36, 609-646. Fuchs, L.S., Fuchs, D., Karns, K., Hamlett, C.L., Katzaroff, M., & Dutka, S. (1997). Effects of task-focused goals on low-achieving students with and without learning disabilities. American Educational Research Journal, 34, 513-544. Fuchs, D., Roberts, P.H., Fuchs, L.S., & Bowers, J. (1996). Reintegrating students with learning disabilities into the mainstream: A two-year study. Learning Disabilities Research and Practice, 11, 214-229. Germann G., & Tindal, G. (1985). An application on curriculum-based assessment: The use of direct and repeated measurement. Exceptional Children, 52, 244-265. Gersten, R., & Dimino, J. A. (2001). The realities of translating research into classroom practice. Learning Disabilities Research and Practice, 16, 120-130. Gickling, E.E. (1981). The forgotten learner. Nevada Public Affairs Review, 1, 19-22. Hutton, J.B., Dubes, R., & Muir, S. (1992). Estimating trend progress in monitoring data: A comparison of simple line-fitting methods. School Psychology Review, 21, 300-312.
79
Jenkins, J.R., Mayhall, W., Peshka, C., & Townshend, V. (1974). Using direct and daily measures to measure learning. Journal of Learning Disabilities, 10, 604-608. Marston, D., Mirkin, P.K., & Deno, S.L. (1984). Curriculum-based measurement: An alternative to traditional screening, referral, and identification of learning disabilities of learning disabled students. The Journal of Special Education, 18, 109-118. Marston, D. (1988). The effectiveness of special education: A time-series analysis of reading performance in regular and special education settings. The Journal of Special Education, 21, 13-26. Phillips, N.B., Hamlett, C.L., Fuchs, L.S., & Fuchs, D. (1993). Combining classwide curriculum-based measurement and peer tutoring to help general educators provide adaptive education. Learning Disabilities Research and Practice, 8, 148-156. Shinn, M.R. (Ed.). (1989). Curriculum-based measurement: Assessing special children. New York: Guilford Press. Shinn, M.R., Tindal, G.A., & Stein, S. (1988). Curriculum-based measurement and the identification of mildly handicapped students: A research review. Professional School Psychology, 3, 69-86.
Stecker, P.M., & Fuchs, L.S. (2000). Effecting superior achievement using curriculum-based measurement: The importance of individual progress monitoring. Learning Disabilities Research and Practice, 15, 128-134. Tindal, G., Wesson, C., Germann, G., Deno, S., & Mirkin, P. A data-based special education delivery system: The Pine County Model. (Monograph No. 19). Minneapolis: University of Minnesota, Institute for Research on Learning Disabilities, 1982. Tucker, J. (1987). Curriculum-based assessment is not a fad. The Collaborative Educator, 1, 4, 10. Wesson, C., Deno, S.L., Mirkin, P.K., Sevcik, B., Skiba, R., King, P.P., Tindal, G.A., & Maruyama, G. (1988). A causal analysis of the relationships among outgoing measurement and evaluation, structure of instruction, and student achievement. The Journal of Special Education, 22, 330-343. Zeno, S. M., Ivens, S. H., Millard, R. T., & Duvvuri, R. (1995). The educator's word frequency guide. New York, NY: Touchstone Applied Science Associates, Inc.
80