Embed Size (px)
Citation preview
Journal of Energy and Power Engineering 10 (2016) 55-63 doi: 10. 17265/1934-8975/2016.01.007
Using Biomass in Power Generation for Supplying
Electrical and Thermal Energy in Iran and Evaluation of
Environmental Pollution Spread
Ailin Asadinejad1, Mostafa G. Varzaneh2, Saeed Mohejeryami3 and Mehrdad Abedi4
1. Department of Electrical Engineering and Computer Science, University of Tennessee, Tennessee 37996, US
2. Department of Industrial and System Engineering, University of Tennessee, Tennessee 37996, US
3. Department of Electrical Engineering, University of North Carolina, Charlotte 28223, US
4. Department of Electrical Engineering, Amirkabir University of Technology, Tehran 15875-4413, Iran
Received: November 16, 2015 / Accepted: December 02, 2015 / Published: January 31, 2016. Abstract: The main objective of this study is estimating environmental pollution of hybrid biomass and co-generation power plants. Efficiency of direct tapping of biomass is about 15%-20%. Consequently, about 80% of energy would be waste in this method. While in co-generation power plant, this number could improve to more than 50%. Therefore, to achieve higher efficiency in utilizing biomass energy, co-generation power plants is proposed by using biogas as fuel instead of natural gas. Proposed system would be supplied thermal and electrical energy for non-urban areas of Iran. In this regard, process of fermentation and gas production from biomass in a vertical digester is studied and simulated using analytic methods. Various factors affecting the fermentation, such as temperature, humidity, PH and optimal conditions for the extraction of gas from waste agriculture and animal are also determined. Comparing between the pollution emission from fossil fuel power plants and power plants fed by biomass shows about 88% reduction in greenhouse emission which significant number. Key words: Biomass energy, digestion, co-generation power plant, biogas, environmental pollution.
Nomenclature
CHP Combined heat and power
ODM Organic dry matter
HV Heat value
biogasv Volume of biogas
d
d
x
t Net growth rate of microorganisms (kg/(m3·s))
d
d
f
t Rate of materials used in the digester (kg/(m3·s))
X Density of microorganisms in the digester (kg/m3)
a Resultant growth factor
b Microorganisms decay coefficient (1/s)
S Concentration (kg/m3)
K Rate of weight loss by microorganisms (kg/(m3·s))
Ks Density of unused material (kg/m3)
ξ Efficient of waste use (0.9-0.6)
Corresponding author: Ailin Asadinejad, Ph.D. candidate,
research fields: renewable energy, biomass, power market and demand response.
Q Flow rate (m3/day)
Px Net mass of release cells (kg/day)
S0 Density of remain material (gr/m3)
1. Introduction
Nowadays, electricity production faces with so
many challenges. Control and protection, efficiency of
small and large customer consumption and demand
response would face with new issues with high
penetration of renewable energies [1-3]. High costs,
pollution and limited resources of fossil fuels are main
motivations for using renewable sources to fulfill the
energy needs [4-6]. Biomass is one of the main
sources of renewable energy. Biomass term used to
describe a series of products that are obtained from
photosynthesis. The most common sources of biomass
are agricultural waste, forest, food, municipal solid
D DAVID PUBLISHING
Using Biomass in Power Generation for Supplying Electrical and Thermal Energy in Iran and Evaluation of Environmental Pollution Spread
56
waste, sewage, water plants and waste from wood
processing. The main aspect of biomass compared to
other renewable energy sources is the availability of it.
Despite wind and solar which their availability
depends on environmental and weather condition,
biomass is local renewable resource that using its
energy does not need any complex technology, and it
is so compatible with most of current fossil fuel power
plants. Some other advantages of biomass energy are [7]:
disposal of a huge amount of organic waste and
recovering energy from it;
animal manure could also be utilized as fertilizer
in agriculture;
political issues related to fuel dependency of
countries;
decrease of the odor problem;
economic and social development in rural areas;
provides new job opportunities.
Bioenergy is the largest global source of renewable
energy, and contributes an estimated 10% of global
primary energy production, in particular as a direct
source of industrial and domestic heat [8]. Most of
this is consumed in developing countries for cooking
and heating, using very inefficient open fires or simple
cook stoves with considerable impact on health
(smoke pollution) and environment (deforestation).
Modern bioenergy supply on the other hand is
comparably small, but has been growing steadily in
the last decade. In the buildings sector, modern
bioenergy use for heat reached around 5 EJ in 2012. In
addition, 8 EJ were used in industry, mainly in the
pulp and paper as well as the food processing sector,
to provide low and medium temperature process heat.
Furthermore, a total of 370 TWh of bioenergy
electricity was produced in 2012. This corresponds to
1.5% of world electricity generation.
Biomass can be formed into solid, liquid and gas
and be used as energy source directly, but the
conversion of biomass to gas, as biogas is better
method since it has higher heating value than other
types of biomass fuel [9]. Biogas first had used in
Assyria to heat the bath water about 10 centuries BC.
The first anaerobic digester was built in 1859 by the
leper colony in Bombay. In 1879, that gas production
from waste was discovered, digester was used in
Britain as source of energy as well. Anaerobic
fermentation was recognized as a science in 1930 and
research to investigate the factors influencing the
growth of bacteria methane took place [10]. In this
study, hybrid system using biomass and co-generation
power plants (combined heat and power—CHP) is
proposed for supplying electrical and thermal energy
need in Iran and release of environmental
contaminants is investigated.
2. Potential of Biomass in Iran
Biogas sources in Iran are divided into four
groups [11]:
(1) Agricultural residue and waste
In the year 2010-2011, almost 75.4 million ton of
crops have been harvested from arable land in Iran. If
the average losses of these products are considered to
be 30%, the amount of waste produced for 1 year is
about 23 million ton [12]. If it is assumed that, an
average of 450 m3 of biogas is produced from each ton
of waste, about 10,350 million m3 biogas will be
generated from agriculture waste.
(2) Municipal solid waste
Percentage of organic waste in municipal solid
waste in Iran is about 75%. Using anaerobic digestion,
most of the organic material in the waste is
decomposed and biogas is produced by anaerobic
bacteria fermentation. In Iran, for every person, an
average of 0.8 kg of waste is produced every day.
About 40-50 thousand tons of waste is produced per
day in Iran and since 1 m3 of biogas is obtained per 15 kg
of solid waste, 841 Petajoules of energy can be
generated from solid municipal waste in Iran [11].
(3) Solid and liquid perishable industrial waste
Industrial wastes such as food and wood industries
can also be used to produce biogas. Biogas from
industrial waste water is highly variable. This quantity
depends on
water refine
For example
can be obtain
(4) Livest
Livestock
produce bio
is produces
According
animal husb
Iran [14].
livestock in
wastes are a
m3 of biogas
Recently,
centers, Iran
power plant
the example
and Tehran.
3. The FerAffecting I
3.1 Digestio
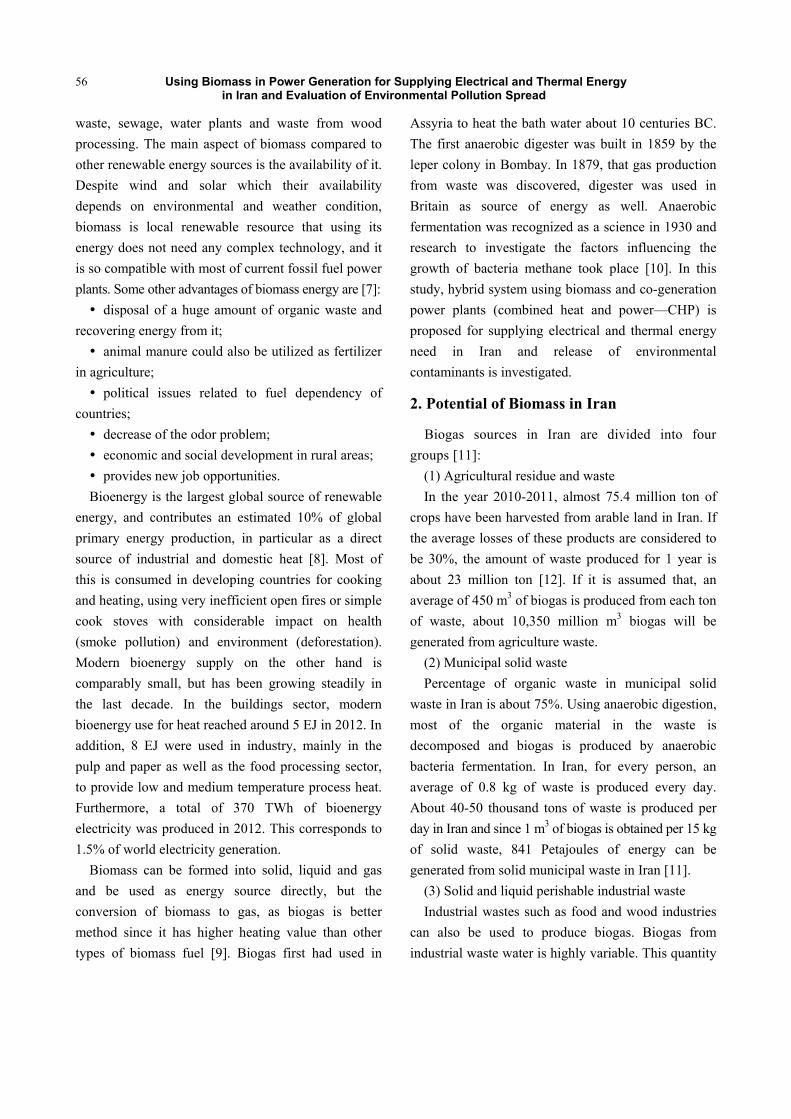
Anaerobic
matter by th
gas that is ty
components
hydrogen, o
gas can be
Fig. 1 The a
Using Bio
the type of
ery process a
e, annually 81
ned from food
tock wastes
k wastes hav
gas. Annuall
s from lives
to the data
bandry with
There are
Iran [15]. A
available in Ir
s can be prod
in addition
n has constru
t using biom
es are: Shira
rmentationIt
on
c digestion
he yeast bact
ypically 65%
such as s
organic acids
e burned dir
anaerobic disin
omass in Powin Iran and
f industry, th
and quantity
1.5-279.4 mil
d industries in
ve considera
y 74 million
stock manur
released, th
2,747,124 c
approximat
Annually 74,9
ran from whi
duced [16].
n to academ
ucted and ope
ass as fuel a
az, Mashhad
n Process an
is fermenta
eria. This pro
% methane and
sulfur compo
and ammon
rectly in bo
ntegration phas
wer GeneratioEvaluation of
he type of w
of waste w
llion m3 of bio
n Iran [11].
able potentia
ton methane
re in Iran [
here are 24
cows in 201
tely 72 mil
64 ton of ani
ich 8,668 mil
mic and rese
erated some p
as well. Som
, Isfahan, Sa
nd the Fact
ation of org
ocess produc
d 35% CO2, w
ounds, nitro
nia. The resul
ilers or inte
ses of organic s
on for Supplyf Environmen
waste
ater.
ogas
al to
e gas
[13].
,659
1 in
llion
imal
llion
arch
pilot
me of
aveh
tors
ganic
ces a
with
ogen,
lting
ernal
com
valu
17
in th
con
that
the
are
acid
con
dige
3.2
O
biom
be i
as p
Dig
the
cyli
the
two
feed
con
be m
sch
3.3
T
substances.
ying Electricantal Pollution
mbustion eng
ue of obtaine
and 325. Typ
he digester tu
nsists of a rich
t is used to im
fermentation
converted i
ds, then met
nverted mater
estion is show
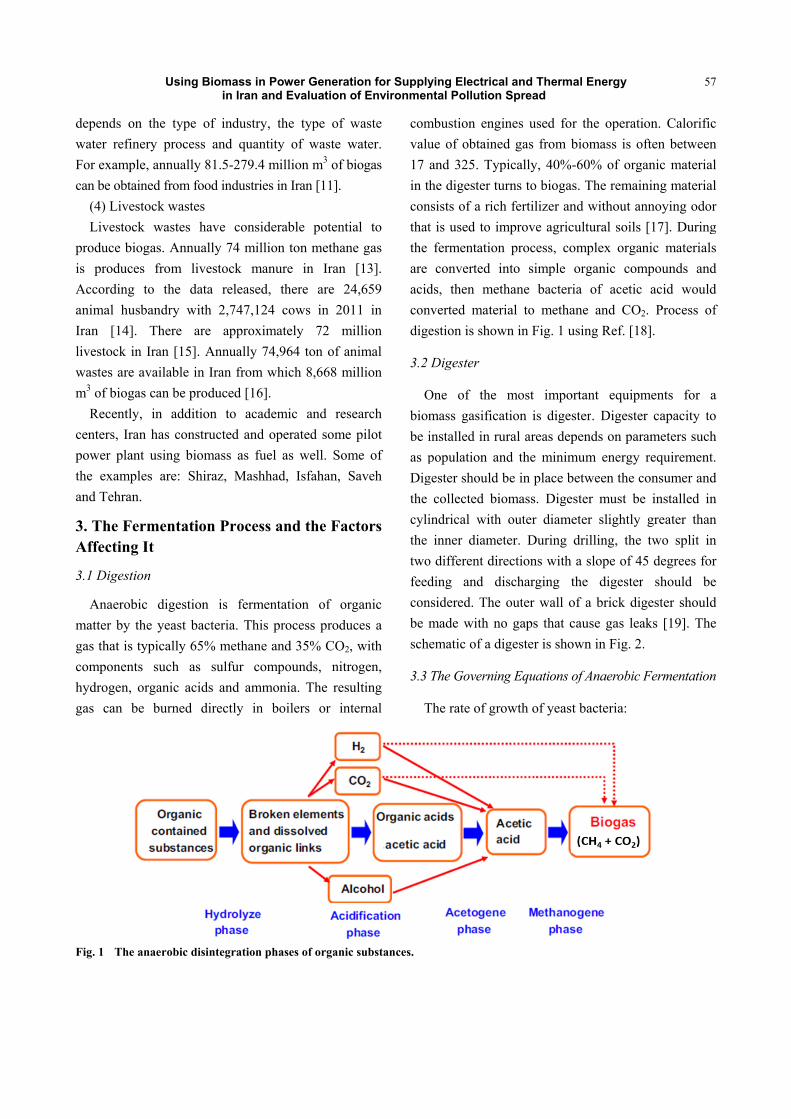
Digester
One of the
mass gasifica
installed in ru
population an
gester should
collected bi
indrical with
inner diame
o different dir
ding and d
nsidered. The
made with n
ematic of a d
The Governin
The rate of gr
al and Thermn Spread
gines used fo
ed gas from b
pically, 40%
urns to bioga
h fertilizer an
mprove agric
n process, co
into simple
thane bacter
rial to metha
wn in Fig. 1 u
most impo
ation is diges
ural areas dep
nd the minim
be in place b
iomass. Dige
h outer diame
eter. During
rections with
discharging t
outer wall o
o gaps that c
digester is sho
ng Equations o
rowth of yeast
mal Energy
r the operati
biomass is o
-60% of orga
s. The remain
nd without an
cultural soils
omplex organ
organic com
ia of acetic
ane and CO2
using Ref. [18
ortant equipm
ster. Digester
pends on par
mum energy
between the c
ester must be
eter slightly
drilling, the
a slope of 45
the digester
of a brick dig
cause gas lea
own in Fig. 2.
of Anaerobic F
t bacteria:
57
on. Calorific
ften between
anic material
ning material
nnoying odor
[17]. During
nic materials
mpounds and
acid would
2. Process of
8].
ments for a
r capacity to
ameters such
requirement.
consumer and
e installed in
greater than
two split in
5 degrees for
should be
gester should
aks [19]. The
.
Fermentation
7
c
n
l
l
r
g
s
d
d
f
a
o
h
.
d
n
n
n
r
e
d
e
n
58
Fig. 2 Digest
Constants
experimenta
can be found
After defi
required vol
on gas vol
digester each
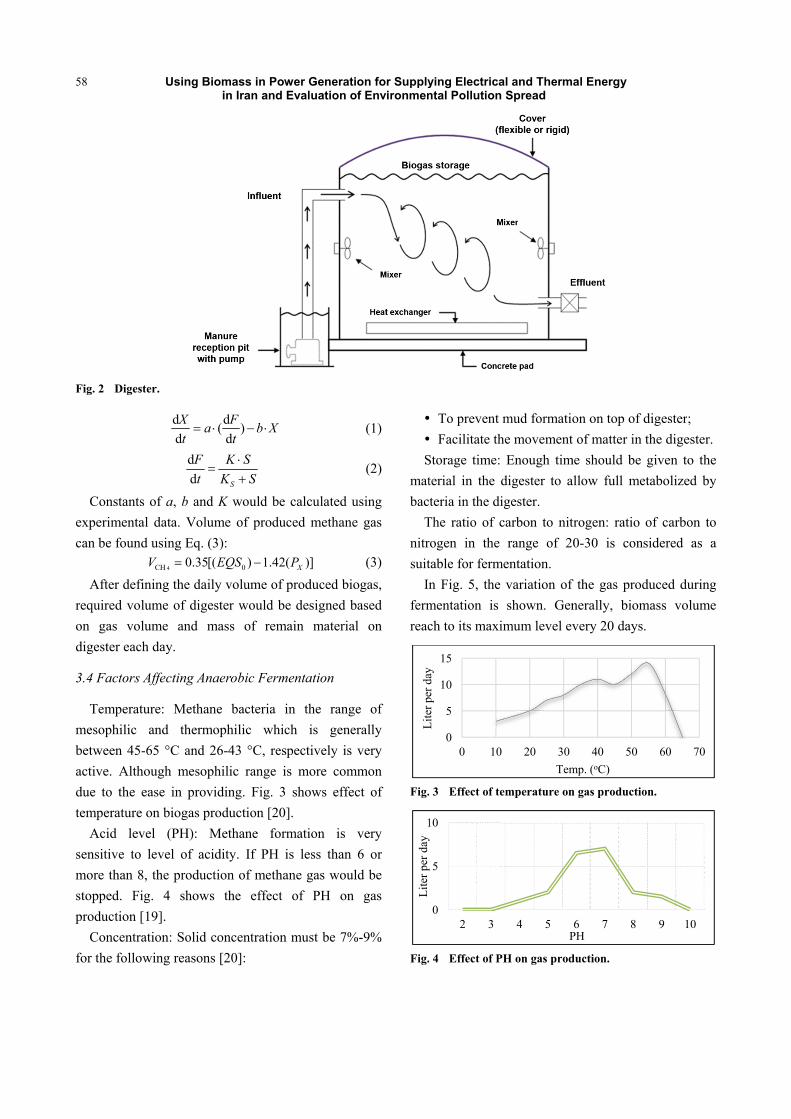
3.4 Factors A
Temperat
mesophilic
between 45-
active. Alth
due to the e
temperature
Acid lev
sensitive to
more than 8
stopped. Fi
production [
Concentra
for the follow
Using Bio
ter.
d
d
Xa
t
d
d
F
t
s of a, b and
al data. Volum
d using Eq. (3
4CH 0.35[(V
ining the dail
lume of diges
lume and m
h day.
Affecting Ana
ure: Methan
and thermo
-65 °C and 2
hough mesoph
ease in provi
on biogas pr
vel (PH): M
level of aci
8, the product
ig. 4 shows
[19].
ation: Solid c
wing reasons
omass in Powin Iran and
d( )
d
Fb X
t
S
K S
K S
K would be
me of produ
3):
0( ) 1.42(EQS
y volume of
ster would be
mass of rem
aerobic Ferm
ne bacteria i
ophilic whic
26-43 °C, res
hilic range i
iding. Fig. 3
roduction [20
Methane for
dity. If PH i
tion of metha
the effect
concentration
s [20]:
wer GeneratioEvaluation of
calculated u
ced methane
( )]XP
produced bio
e designed b
main material
mentation
in the range
ch is gener
spectively is v
is more comm
shows effec
].
rmation is v
is less than
ane gas woul
of PH on
n must be 7%
on for Supplyf Environmen
(1)
(2)
using
e gas
(3)
ogas,
ased
l on
e of
rally
very
mon
ct of
very
6 or
d be
gas
%-9%
S
mat
bac
T
nitr
suit
In
ferm
reac
Fig.
Fig.
Lit
erpe
rda
y
1
Lit
er p
er d
ay
ying Electricantal Pollution
To prevent
Facilitate th
Storage time:
terial in the
teria in the di
The ratio of c
rogen in the
table for ferm
n Fig. 5, the
mentation is
ch to its maxi
. 3 Effect of te
. 4 Effect of P
0
5
10
15
0 10
Lit
er p
er d
ay
0
5
10
2 3
py
al and Thermn Spread
mud formati
he movement
Enough tim
digester to a
igester.
carbon to nit
range of 2
mentation.
variation of
shown. Gen
imum level ev
emperature on
PH on gas prod
0 20 30
Tem
4 5P
mal Energy
on on top of
t of matter in
me should be
allow full me
trogen: ratio
0-30 is con
f the gas prod
nerally, biom
very 20 days
n gas productio
duction.
40 50
mp. (oC)
6 7 8PH
digester;
the digester.
given to the
etabolized by
of carbon to
sidered as a
duced during
mass volume
.
on.
60 70
9 10
e
y
o
a
g
e
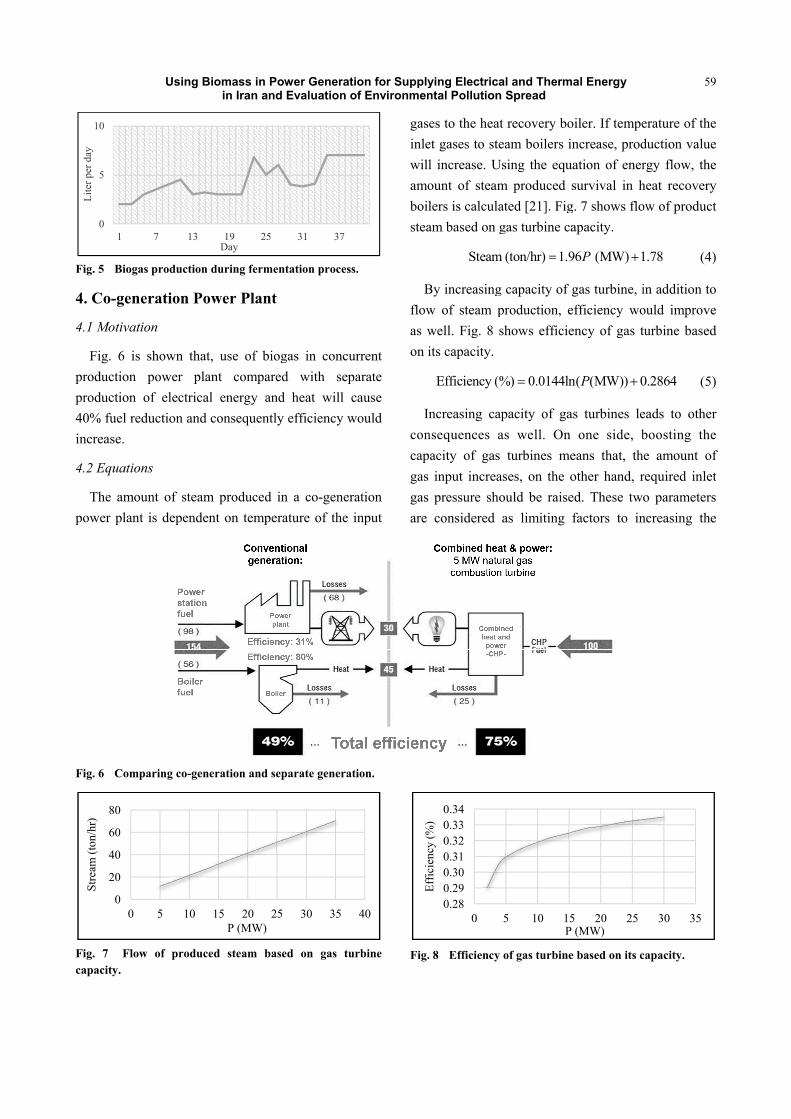
Fig. 5 Bioga
4. Co-gene
4.1 Motivati
Fig. 6 is
production
production
40% fuel red
increase.
4.2 Equation
The amou
power plant
Fig. 6 Comp
Fig. 7 Flowcapacity.
0
5
10
1
Lite
r pe
r da
y
0
20
40
60
80
0
Str
eam
(to
n/hr
)Using Bio
as production d
eration Pow
ion
shown that,
power plan
of electrical
duction and c
ns
unt of steam
t is dependen
paring co-gene
w of produced
7 13
5 10 1
omass in Powin Iran and
during ferment
wer Plant
use of biog
nt compared
energy and
consequently
produced in
nt on tempera
ration and sep
d steam base
19 25Day
15 20 25P (MW)
wer GeneratioEvaluation of
tation process.
gas in concur
d with sepa
heat will c
efficiency w
n a co-genera
ature of the in
parate generati
ed on gas tur
31 37
30 35
on for Supplyf Environmen
.
rrent
arate
ause
ould
ation
nput
gas
inle
will
amo
boil
stea
B
flow
as w
on i
In
con
cap
gas
gas
are
ion.
rbine Fig.
40
Eff
icie
ncy
(%)
ying Electricantal Pollution
es to the heat
et gases to ste
l increase. U
ount of steam
lers is calcula
am based on g
Steam
By increasing
w of steam p
well. Fig. 8 s
its capacity.
Efficiency (%
ncreasing ca
nsequences a
acity of gas
input increa
pressure sho
considered
. 8 Efficiency
0.280.290.300.310.320.330.34
0
Eff
icie
ncy
(%)
al and Thermn Spread
t recovery bo
eam boilers in
Using the equ
m produced s
ated [21]. Fig
gas turbine ca
m (ton/hr) 1.9
g capacity of g
production, e
shows efficie
%) 0.0144ln
apacity of ga
as well. On
turbines me
ases, on the o
ould be raise
as limiting
of gas turbine
5 10 15P
mal Energy
oiler. If tempe
ncrease, prod
uation of ener
survival in h
g. 7 shows flo
apacity.
96 (MW) 1P
gas turbine, i
efficiency wo
ency of gas t
n( (MW)) 0P
as turbines le
one side, b
eans that, th
other hand, r
ed. These two
factors to in
e based on its c
5 20 25(MW)
59
erature of the
duction value
rgy flow, the
heat recovery
ow of product
1.78 (4)
in addition to
ould improve
turbine based
0.2864 (5)
eads to other
boosting the
e amount of
required inlet
o parameters
ncreasing the
capacity.
30 35
9
e
e
e
y
t
)
o
e
d
)
r
e
f
t
s
e
60
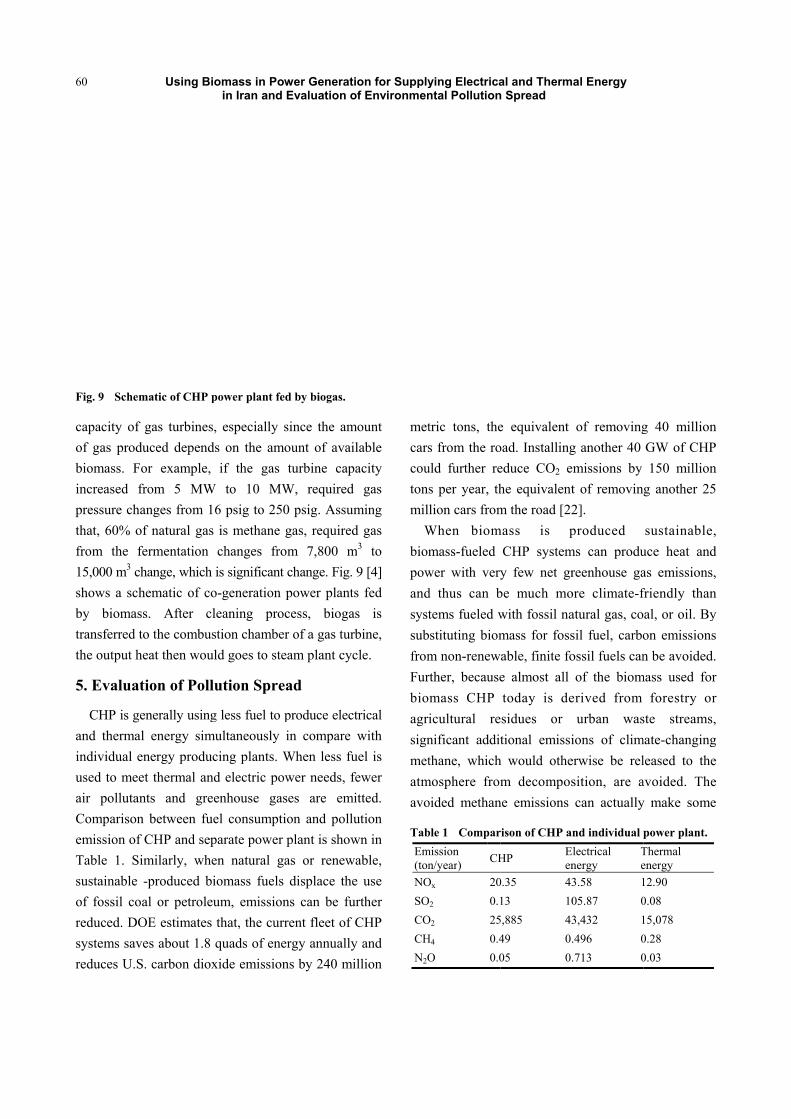
Fig. 9 Schem
capacity of
of gas produ
biomass. Fo
increased fr
pressure cha
that, 60% of
from the fe
15,000 m3 ch
shows a sch
by biomass
transferred to
the output he
5. Evaluat
CHP is ge
and thermal
individual e
used to mee
air pollutan
Comparison
emission of
Table 1. Si
sustainable
of fossil coa
reduced. DO
systems save
reduces U.S
Using Bio
matic of CHP p
gas turbines,
uced depend
or example,
from 5 MW
anges from 1
f natural gas
fermentation
hange, which
hematic of co
s. After cl
o the combus
eat then woul
tion of Pollu
enerally using
l energy sim
nergy produc
et thermal and
nts and gree
n between fue
CHP and sep
milarly, whe
-produced bi
al or petroleu
OE estimates
es about 1.8
. carbon diox
omass in Powin Iran and
power plant fed
, especially s
s on the amo
if the gas
W to 10 MW
6 psig to 250
is methane g
changes fro
is significant
o-generation p
leaning proc
stion chamber
ld goes to ste
ution Sprea
g less fuel to p
multaneously
cing plants. W
d electric pow
enhouse gas
el consumpti
parate power
en natural ga
iomass fuels
um, emission
that, the curr
quads of ene
xide emission
wer GeneratioEvaluation of
d by biogas.
since the amo
ount of avail
turbine capa
W, required
0 psig. Assum
gas, required
om 7,800 m
change. Fig. 9
power plants
cess, biogas
r of a gas turb
eam plant cyc
ad
produce elect
in compare w
When less fu
wer needs, fe
ses are emit
ion and pollu
plant is show
as or renewa
displace the
ns can be fur
rent fleet of C
ergy annually
ns by 240 mil
on for Supplyf Environmen
ount
lable
acity
gas
ming
d gas
m3 to
9 [4]
s fed
s is
bine,
cle.
trical
with
uel is
ewer
tted.
ution
wn in
able,
use
rther
CHP
y and
llion
met
cars
cou
tons
mil
W
biom
pow
and
syst
sub
from
Fur
bio
agri
sign
met
atm
avo
Tab
Em(ton
NO
SO
CO
CH
N2O
ying Electricantal Pollution
tric tons, the
s from the ro
uld further re
s per year, th
lion cars from
When biom
mass-fueled
wer with very
d thus can b
tems fueled w
stituting biom
m non-renew
rther, because
mass CHP
icultural re
nificant addit
thane, which
mosphere from
oided methan
ble 1 Compar
mission n/year)
CH
Ox 20
O2 0.1
O2 25
H4 0.4
O 0.0
al and Thermn Spread
e equivalent
oad. Installing
educe CO2 e
he equivalent
m the road [22
mass is p
CHP system
y few net gr
be much mo
with fossil na
mass for foss
able, finite fo
e almost all
today is de
sidues or
tional emissi
h would othe
m decompos
ne emissions
rison of CHP a
HP Een
0.35 43
13 10
5,885 43
49 0.
05 0.
mal Energy
of removing
g another 40
emissions by
t of removin
2].
produced
ms can produ
reenhouse ga
ore climate-f
atural gas, co
sil fuel, carbo
ossil fuels can
of the biom
erived from
urban was
ions of clim
erwise be rel
sition, are a
can actually
nd individual p
Electrical nergy
Te
3.58 1
05.87 0
3,432 1
.496 0
.713 0
g 40 million
GW of CHP
150 million
g another 25
sustainable,
uce heat and
as emissions,
friendly than
al, or oil. By
on emissions
n be avoided.
mass used for
forestry or
ste streams,
mate-changing
leased to the
avoided. The
y make some
power plant.
Thermal energy
12.90
0.08
15,078
0.28
0.03
n
P
n
5
,
d
,
n
y
s
.
r
r
,
g
e
e
e
Using Biomass in Power Generation for Supplying Electrical and Thermal Energy in Iran and Evaluation of Environmental Pollution Spread
61
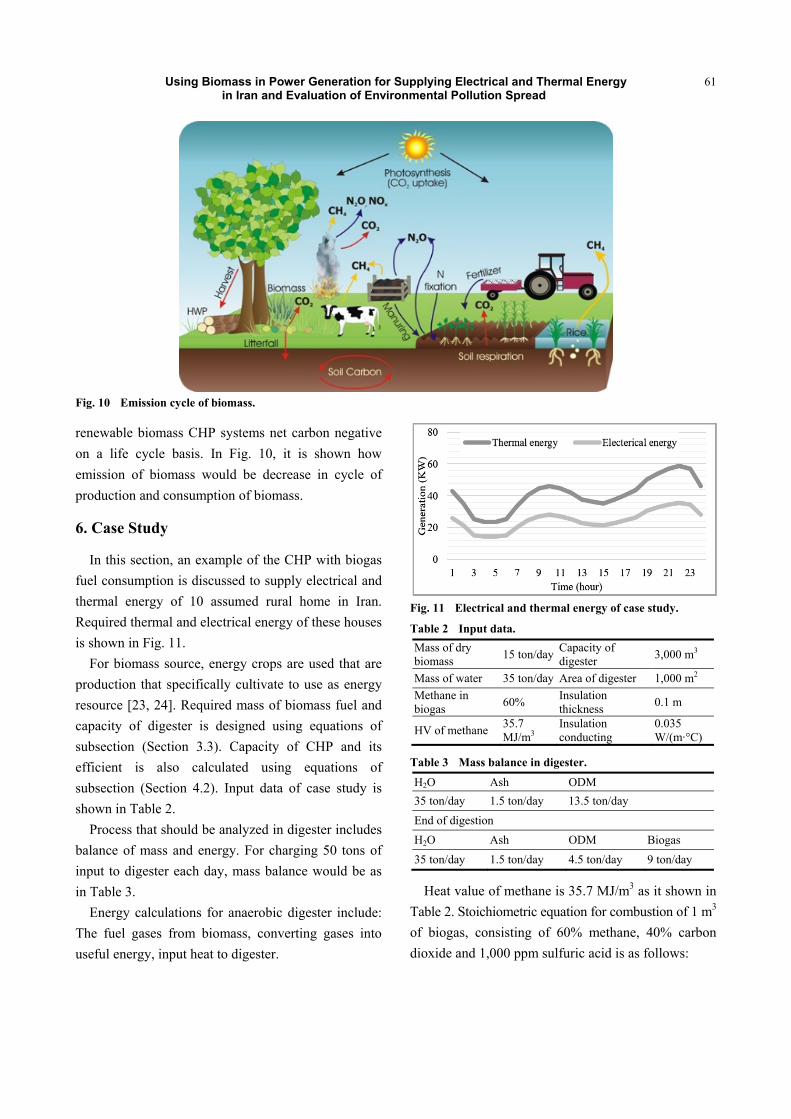
Fig. 10 Emission cycle of biomass.
renewable biomass CHP systems net carbon negative
on a life cycle basis. In Fig. 10, it is shown how
emission of biomass would be decrease in cycle of
production and consumption of biomass.
6. Case Study
In this section, an example of the CHP with biogas
fuel consumption is discussed to supply electrical and
thermal energy of 10 assumed rural home in Iran.
Required thermal and electrical energy of these houses
is shown in Fig. 11.
For biomass source, energy crops are used that are
production that specifically cultivate to use as energy
resource [23, 24]. Required mass of biomass fuel and
capacity of digester is designed using equations of
subsection (Section 3.3). Capacity of CHP and its
efficient is also calculated using equations of
subsection (Section 4.2). Input data of case study is
shown in Table 2.
Process that should be analyzed in digester includes
balance of mass and energy. For charging 50 tons of
input to digester each day, mass balance would be as
in Table 3.
Energy calculations for anaerobic digester include:
The fuel gases from biomass, converting gases into
useful energy, input heat to digester.
Fig. 11 Electrical and thermal energy of case study.
Table 2 Input data.
Mass of dry biomass
15 ton/dayCapacity of digester
3,000 m3
Mass of water 35 ton/day Area of digester 1,000 m2
Methane in biogas
60% Insulation thickness
0.1 m
HV of methane 35.7 MJ/m3
Insulation conducting
0.035 W/(m·°C)
Table 3 Mass balance in digester.
H2O Ash ODM
35 ton/day 1.5 ton/day 13.5 ton/day
End of digestion
H2O Ash ODM Biogas
35 ton/day 1.5 ton/day 4.5 ton/day 9 ton/day
Heat value of methane is 35.7 MJ/m3 as it shown in
Table 2. Stoichiometric equation for combustion of 1 m3
of biogas, consisting of 60% methane, 40% carbon
dioxide and 1,000 ppm sulfuric acid is as follows:
Using Biomass in Power Generation for Supplying Electrical and Thermal Energy in Iran and Evaluation of Environmental Pollution Spread
62
600 lit CH4 +400 lit CO2 +1 lit H2S +1,201.5 lit O2 →
1,000 lit CO2 +1,201 lit H2O +1 lit SO2 +21.4 MJ (6)
In our case study, biogas production is 7,500 m3/day,
that consequently:
In CHP, 1,860 kW gas would be turned into 595 kW
of electrical energy considering 32% efficiency and
985 kW of thermal energy would also produce.
Temperature of inlet heat of digester depends on waste
heat and required energy for increasing temperature of
material. Waste heat could be defined based on
digester area and conducting insulator. Assuming
37 °C temperature of inside temperature and 5 °C for
outlet air, heat waste could calculate as follows:
Required heat energy to increase temperature of
digester is equal to mass of input material by
temperature difference. In our case study that 50 ton
day with 10 °C are injected to digester and should
reach to 37 °C degree, heat energy would be
determined as follows:
Therefore, total required heat energy is:
Summary of output results is shown in Table 4.
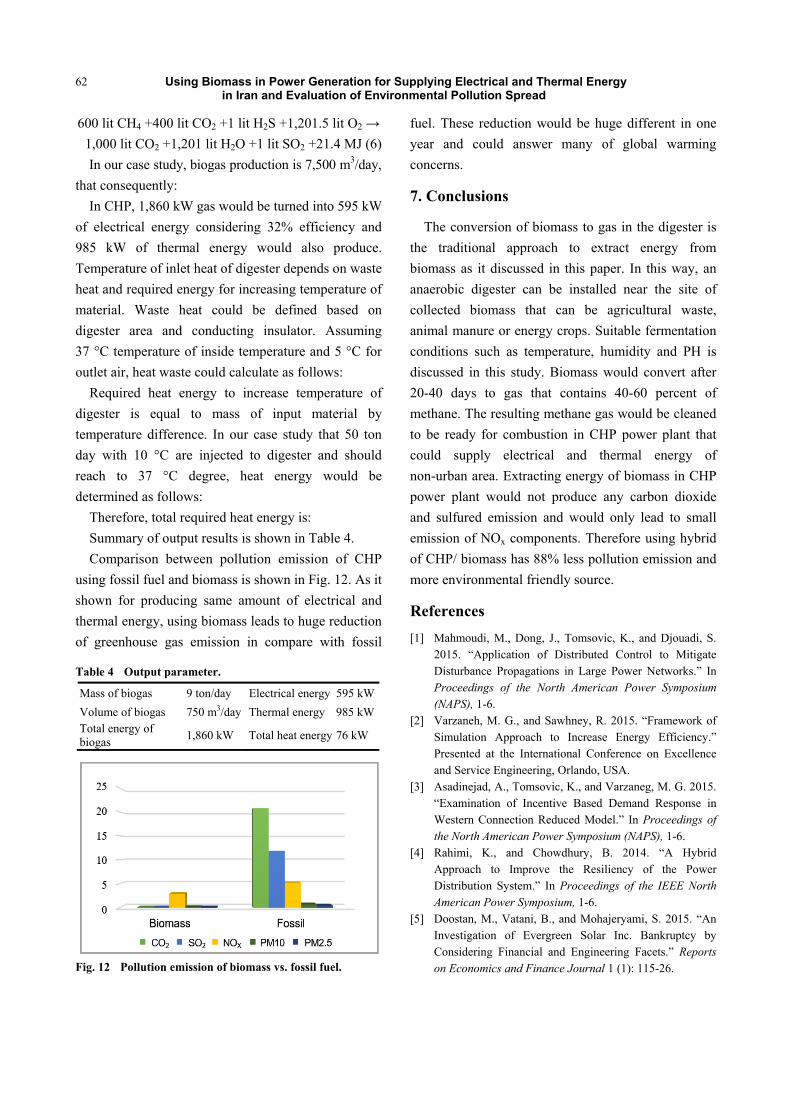
Comparison between pollution emission of CHP
using fossil fuel and biomass is shown in Fig. 12. As it
shown for producing same amount of electrical and
thermal energy, using biomass leads to huge reduction
of greenhouse gas emission in compare with fossil
Table 4 Output parameter.
Mass of biogas 9 ton/day Electrical energy 595 kW
Volume of biogas 750 m3/day Thermal energy 985 kW Total energy of biogas
1,860 kW Total heat energy 76 kW
Fig. 12 Pollution emission of biomass vs. fossil fuel.
fuel. These reduction would be huge different in one
year and could answer many of global warming
concerns.
7. Conclusions
The conversion of biomass to gas in the digester is
the traditional approach to extract energy from
biomass as it discussed in this paper. In this way, an
anaerobic digester can be installed near the site of
collected biomass that can be agricultural waste,
animal manure or energy crops. Suitable fermentation
conditions such as temperature, humidity and PH is
discussed in this study. Biomass would convert after
20-40 days to gas that contains 40-60 percent of
methane. The resulting methane gas would be cleaned
to be ready for combustion in CHP power plant that
could supply electrical and thermal energy of
non-urban area. Extracting energy of biomass in CHP
power plant would not produce any carbon dioxide
and sulfured emission and would only lead to small
emission of NOx components. Therefore using hybrid
of CHP/ biomass has 88% less pollution emission and
more environmental friendly source.
References
[1] Mahmoudi, M., Dong, J., Tomsovic, K., and Djouadi, S. 2015. “Application of Distributed Control to Mitigate Disturbance Propagations in Large Power Networks.” In Proceedings of the North American Power Symposium (NAPS), 1-6.
[2] Varzaneh, M. G., and Sawhney, R. 2015. “Framework of Simulation Approach to Increase Energy Efficiency.” Presented at the International Conference on Excellence and Service Engineering, Orlando, USA.
[3] Asadinejad, A., Tomsovic, K., and Varzaneg, M. G. 2015. “Examination of Incentive Based Demand Response in Western Connection Reduced Model.” In Proceedings of the North American Power Symposium (NAPS), 1-6.
[4] Rahimi, K., and Chowdhury, B. 2014. “A Hybrid Approach to Improve the Resiliency of the Power Distribution System.” In Proceedings of the IEEE North American Power Symposium, 1-6.
[5] Doostan, M., Vatani, B., and Mohajeryami, S. 2015. “An Investigation of Evergreen Solar Inc. Bankruptcy by Considering Financial and Engineering Facets.” Reports on Economics and Finance Journal 1 (1): 115-26.
Using Biomass in Power Generation for Supplying Electrical and Thermal Energy in Iran and Evaluation of Environmental Pollution Spread
63
[6] Yousefian, R., and Monsef, H. 2011. “DG-Allocation Based on Reliability Indices by Means of Monte Carlo Simulation and AHP.” In Proceedings of the 2011 10th International Conference on Environment and Electrical Engineering (EEEIC), 1-4.
[7] Mohammadi, M. M., Ghobadian, B., Najafi, G., and Janzadeh, G. R. 2013. “Potential of Biogas Production in Iran.” Journal of Renewable and Sustainable Energy Reviews 28 (December): 702-14.
[8] Abedi, S., Gharavi, H., Nick, M., and Hosseinian, S. H. 2011. “Economic and Reliable Design of a Hybrid PV-Wind-Fuel Cell Energy System Using Differential Evolutionary Algorithm.” In Proceedings of the 19th Electrical Engineering (ICEE) Iranian Conference, 1-6.
[9] Naskeo Environment, Information Website on Biogas. 2009. Accessed November 16, 2015. http://www.biogas-renewable-energy.info.
[10] Godfrey, B., ed. 2012. Renewable Energy Power for a Sustainable Future. New York: Oxford University Press.
[11] Patel, H., and Chowdhury, S. 2015. “Review of Technical and Economic Challenges for Implementing Rural Microgrids in South Africa.” In Proceedings of the 2015 IEEE Eindhoven PowerTech, 1-6.
[12] Iran Renewable Energy Organization, SUNA. 2015. Accessed November 16, 2015. http://www.suna. org.ir.
[13] Shabanikia, A., Mohammadnejad, J., and Boghlandashti, B. 2011. “Production of Energy from Wood and
Agricultural Waste Using Gasifier Technology.” Presented at the First Bioenergy Conference of Iran,
Tehran, Iran. [14] Sanaieemoghadam, A., Aghakhani, M., Aghel, H.,
Abasporfard, M., and Khodaparast, M. 2011. “Bio-methane Production from Anaerobic Digestion of Potato Waste and Manure Systems by Joint Single-Step
Anaerobic Digester.” Presented at the First Bioenergy Conference of Iran, Tehran, Iran.
[15] Statistical Center of Iran. 2015. Accessed November 16, 2015. http://www.amar.org.ir.
[16] Zareie, H., Fadaiee, S., and Yazdi, M. 2012. “Potential of Using Biomass Energy in Sustainable Economic Development.” Presented at the Second Annual Clean Energy Conference, Kerman, Iran.
[17] Adl, M. 2000. “Estimating Energy Production Capabilities from Biological Waste.” PhD thesis, Tehran University.
[18] Franciso, J., and Antonio, C. 2003. “Modeling of Combined Cycle Power Plant Using Biomass.” Journal of Renewable Energy 28 (5): 743-53.
[19] Bouallagui, H., Cheikh, R. B., Marouani, L., and Hamdi, M. 2003. “Mesophilic Biogas Production from Fruit and Vegetable Waste in a Tubular Digester.” Journal of Bioresource Technology 86 (1): 85-9.
[20] International Renewable Energy Agency. 2015. “Biomass System for Heat and Power.” International Renewable Energy Agency.
[21] Lehtomäki, A. 2006. Biogas Production from Energy Crops and Crop Residues. Finland: University of Jyväskylä.
[22] Kehlhofer, R., Bachmann, R., and Nielsen, H. 2009. Combined―Cycle Gas & Steam Turbine Power Plants. Tulsa, Oklahoma: PennWell Corporation.
[23] U.S. Environmental Protection Agency. 2015. “Fuel and Carbon Dioxide Emissions Savings Calculation Methodology for Combined Heat and Power Systems.” U.S. Environmental Protection Agency, Combined Heat and Power Partnership.
[24] Lehtomäki, A. 2006. Biogas Production from Energy Crops and Crop Residues. Finland: University of Jyväskylä.