Embed Size (px)
Citation preview

Investigation of a 85Rb Dark Magneto-Optical Trap
using an Optical Nanofibre
Laura Russell1,2, Ravi Kumar1,2, Vibhuti Bhushan Tiwari1,3 and
Sıle Nic Chormaic1,2,4
1 Department of Physics, University College Cork, Cork, Ireland2 Light-Matter Interactions Unit, OIST Graduate University, 1919-1 Tancha,
Onna-son, Okinawa 904-0495, Japan3 Laser Physics Applications Section, Raja Ramanna Centre for Advanced
Technology, Indore 452013, India4 School of Chemistry and Physics, University of KwaZulu-Natal, Durban 4001,
South Africa
E-mail: [email protected]
Abstract. We report here measurements on a dark magneto-optical trap (DMOT)
of 85Rb atoms using an optical nanofibre (ONF) with a waist of ∼ 1 µm. The DMOT
is created using a doughnut-shaped repump beam along with a depump beam for
efficient transfer of cold atoms from the bright hyperfine ground state (F = 3) into
the dark hyperfine ground state (F = 2). The fluorescence from the cold 85Rb atoms
of the DMOT is detected by coupling it into the fibre-guided modes of the ONF. The
measured fractional population of cold atoms in the bright hyperfine ground state (p)
is as low as ∼0.04. The dependence of loading rate of DMOT on cooling laser intensity
is investigated and also compared with the loading rate of a bright-MOT (BMOT).
This work lays the foundation for the use of an ONF for probing of a small number of
atoms in an optically-dense cold atomic cloud.
Keywords: laser-cooling, dark MOT, rubidium, tapered optical fibre, optical nanofibre,
atom cloud density
arX
iv:1
306.
5823
v2 [
phys
ics.
atom
-ph]
2 N
ov 2
013

Investigation of a 85Rb DMOT using an ONF 2
1. Introduction
The optical nanofibre (ONF), or optical microfibre depending on the waist diameter,
is an ultrathin light guide usually fabricated from commercially-available fibre using
a heat-and-pull technique [1]. The enhancement of the spontaneous emission from
atoms surrounding an ONF into its guided modes is well known [2], making it an ideal
high-sensitivity tool for channeling atomic fluorescence to a detector. In recent years,
ONFs have been used as probes for cold atoms [3, 4, 5, 6] and hot atomic vapors
[7, 8, 9]. A number of proposals for trapping neutral atoms around ONFs have been
made [10, 11, 12, 13, 14] and two-colour trapping of caesium has been achieved [15, 16].
Some of the advantages of ONFs are that, in addition to trapping applications, the
nanofibre provides an interface that can be exploited for quantum communication using
ensembles of laser-cooled atoms or for studying atom-surface interactions [17, 18]. A
review on recent advances in this field is contained in Morrissey et al. [19].
In the work reported here, atom cloud density enhancement techniques for a
sample of laser-cooled 85Rb atoms are studied in order to increase the fluorescence
and/or absorption signals obtainable with ONFs. The density of atoms in a standard
magneto-optical trap (MOT) is limited to ∼ 1011 atoms/cm3 for two reasons. First, a
transfer of kinetic energy occurs when a ground state atom collides with an excited state
atom leading to a trap loss rate that is proportional to the number of atoms trapped.
The second limitation is due to laser-cooled atoms in the MOT reabsorbing scattered
photons, a phenomenon known as radiation pressure. The outward radiation pressure
of the fluorescent light balances the confining forces of the trapping laser beams at a
particular density and, at this point, if the number of atoms is increased, the atom cloud
simply grows in size rather than in density. For the ONF, this is a major consideration;
if one wishes to do absorption experiments using optical nanofibres, as many atoms as
possible are required to fill the evanescent region around the fibre in order to optimize
the signal quality.
In 1993 Ketterle et al. [20] demonstrated a MOT configuration, known as the
dark MOT (DMOT), which confined sodium atoms in the lower (or dark) hyperfine
ground level, where they are unperturbed by the cooling beams and, thus, the DMOT
is free from the density limitations of a standard bright MOT (BMOT). By reducing
the intensity of the repump beams used in the standard BMOT configuration almost all
the atoms are transferred from the bright hyperfine level, F = 2, to the dark hyperfine
level, F = 1, of the 3S 12
ground state of Na. Although a small excitation rate is optimal
for confining large numbers of atoms at a high density, the maximum possible excitation
rate is required to efficiently capture atoms from a vapor and load them into a MOT.
By using bright and dark regions in the repump beam simultaneously, both of these
requirements can be fulfilled; a doughnut-shaped (or hollow) repump beam can be used
for this as it consists of a bright outer ring of light and a dark inner circle. An atom
which encounters the dark region (i.e. the region with negligible repump intensity) will
only spend a very short time in the cooling cycle before being shelved into the dark

Investigation of a 85Rb DMOT using an ONF 3
hyperfine level. Alternative methods of creating a DMOT have been demonstrated.
For example, Muniz et al. [21] tuned the frequency of the repump laser to create a
DMOT from an intense flux of slowed Na atoms. In the last decade, a more complete
understanding of the DMOT has been formed [22, 23, 24] and recently extended to
studies with ultracold atoms and molecules [25].
One way of working with a BMOT and DMOT is by generating them sequentially in
time using triggered, mechanical shutters and AOMs. However, an alternative approach
is to simultaneously generate the BMOT and DMOT in different spatial regions of
the trap, as achieved using the aforementioned doughnut-shaped repump beam. The
spatially-generated DMOT has advantages since atoms can be continuously loaded into
the dark region from the outer bright MOT where the usual processes occur. In fact,
although the inner, dark region is not really a magneto-optical trap, the outer bright
region still captures background atoms and feeds the dark section. In other words,
experimental parameters for the atoms at the trap center can be monitored and adjusted,
while simultaneously maintaining the high loading rate achievable with the bright MOT.
This is possible because the trapped atom cloud is localized near the minimum of the
magnetic field, whereas the capture of atoms occurs throughout the whole intersection
volume of the cooling laser beams. Note that only the spatial DMOT is considered in
the work that follows. This arrangement is very appealing for optical nanofibre-based
work. For example, the possibility of continuous absorption measurements via an ONF
probe becomes available. Permyakova et al. [26] report that, even with moderate beam
powers of the order of 6 mW, the dark MOT can capture a large number of atoms and
achieve optical densities as high as 9. Thus, by using low cooling laser intensities (for
confining large numbers of atoms at a high density) in a DMOT scheme, high signal-to-
noise ratios for the fluorescence coupling should be achievable for minimal beam powers.
This leads to the potential demonstration of non-linear optical effects in the atom cloud
without requiring high laser powers.
2. Experimental Technique
2.1. Laser configuration
Earlier, Townsend et al. [27] demonstrated atom densities of nearly 1012 cm−3 in a dark
MOT for caesium. Prior to this, no report of similar density enhancements in MOTs
for elements other than sodium had been reported. Excited state hyperfine splitting
is large for heavier alkali-metal atoms which makes it difficult to get the atoms in the
dark state, while still maintaining enough atoms in the trap, by transient reduction of
repump beam intensity as done in case of Na atoms. Hence, Townsend et al. used
a technique of partially blocking the repump beam to create a low repump intensity
region at the centre surrounded by a higher repump intensity, and directed a depump
beam to the dark region to increase the rate of decay to the dark ground state. We
follow the same scheme for creating a DMOT for 85Rb. The depump beam is tuned

Investigation of a 85Rb DMOT using an ONF 4
to the F = 3 → F ′ = 3 transition of 85Rb. Rb atoms (see figure 1) undergo many
cooling cycles (F = 3 → F ′ = 4) before falling to the dark ground state (F = 2) due
to spontaneous Raman processes if no depump beam is used. The use of depump beam
accelerates ground state pumping of atoms.
F=2
F=3
F’=1
F’=2
F’=3
F’=4
780.241 nm
δ
C R
5S1/2
5P3/2
D
Figure 1. Energy levels used in the dark MOT for 85Rb. ‘C’ represents the cooling
laser, ‘R’ represents the repump beam, and ‘D’ represents the depump beam.
In the work reported here, a retro-reflected three beam MOT configuration is used
for laser-cooling and trapping 85Rb atoms. The doughnut-shaped repump beam is
generated in the following manner. First, the laser beam is expanded in a telescope
setup to a diameter of 25 mm (see figure 2). A separate, unit magnification telescope is
used to place a shadow in the beam and project it on to the atom cloud. A glass slide
with an opaque circle as the shadow is placed near the focal point of the telescope and
aligned to create the doughnut-shaped repump beam at the MOT. The opaque circle
has a transmission of 10−4 as determined experimentally. If the circle were placed in
the beam without being incorporated into a telescope system, Fresnel diffraction effects
would occur at the trap centre. This would diminish the efficiency of the dark MOT in
shelving atoms into F = 2. To facilitate switching from a DMOT to a BMOT, the slide
with the shadow in the optical path of the repump beam can be easily removed from
its holder, turning the doughnut beam into a standard Gaussian repump beam.
Rather than directing the doughnut repump beam along a path which copropagates
with a cooling beam, a separate path is used. The reason for this is due to the retro-
reflecting mirrors in the cooling beam path for the MOT design. If the repump beam
were aligned such that it passed centrally through the cloud, but reflected back off a
retro-reflecting mirror, the back-reflected dark spot may not align perfectly with the
forward propagating one and could destroy the DMOT.

Investigation of a 85Rb DMOT using an ONF 5
Repump beam
Ø 25 mm
PCX, f = 150 mm PCX, f = 150 mm
To MOT
Glass slide with opaque spot
Figure 2. Left: Experimental setup used to create the doughnut repump beam using
a unity magnifier with an opaque circle positioned near the centre of two lenses. This
imaging setup reduces Fresnel diffraction in the beam at the position of the MOT.
Right: Repump beam profile obtained using a CCD camera.
2.2. Quantifying the DMOT quality
To quantify the ‘darkness’ of the trap, Ketterle et al. [20] introduced a quality
parameter, p, that denotes the fraction of atoms in the bright, ground hyperfine level
compared to the total number of atoms in the ground state, where
p =Nb
Nb +Nd
. (1)
For 85Rb, Nb is the number of atoms in the bright F = 3 level and Nd is the
number of atoms in the dark F = 2 level of the ground state. The quality of the DMOT
is determined from p, where p = 1 represents a 100% bright MOT and p = 0 is a 100%
dark MOT. For the measurements of p reported here an ONF with diameter ∼1 µm
is passed through the centre of the atom cloud. Fluorescence emitted from the laser-
cooled atoms couples into the guided modes of the ONF and is subsequently measured
at one fibre pigtail end using a single photon counting module (SPCM). The recorded
count rate is proportional to the number of atoms in whichever hyperfine ground level
is probed, thereby enabling a measurement of p to be performed. Alternatively, p can
be estimated from the magnitude of observed absorption dips if free-space spectroscopy
is performed.
3. Results and discussions
3.1. Free-space spectroscopy of the DMOT
The experimental setup is shown in figure 3. Initially, a free-space probe beam is passed
through the atom cloud for absorption spectroscopy measurements, as illustrated in
figure 3(a). The free-space probe beam is aligned with the centre of the cloud so that it
passes through the DMOT. The probe beam is obtained from a 780 nm extended cavity
diode laser (ECDL) operating in scanning mode and frequency tuned via saturated
absorption spectroscopy. The beam, after passing through the cloud, is directed on an
avalanche photodiode (APD) (Hamamatsu model: C5460-01), connected to a computer.
Investigation of a 85Rb DMOT using an ONF 6
O N F
TOF
Cold 85Rb cloud (DMOT)
SPCM
(a) Free-space absorption spectroscopy of the DMOT (b) Studying the DMOT with a TOF and SPCM
Coupled fluorescence from cloud
Depump beam
UHV chamber
APD
Depump beam
Frequency scanned spectroscopy beam
Cold 85Rb cloud (DMOT)
Probe beam (tuned to repump transition)
UHV chamber
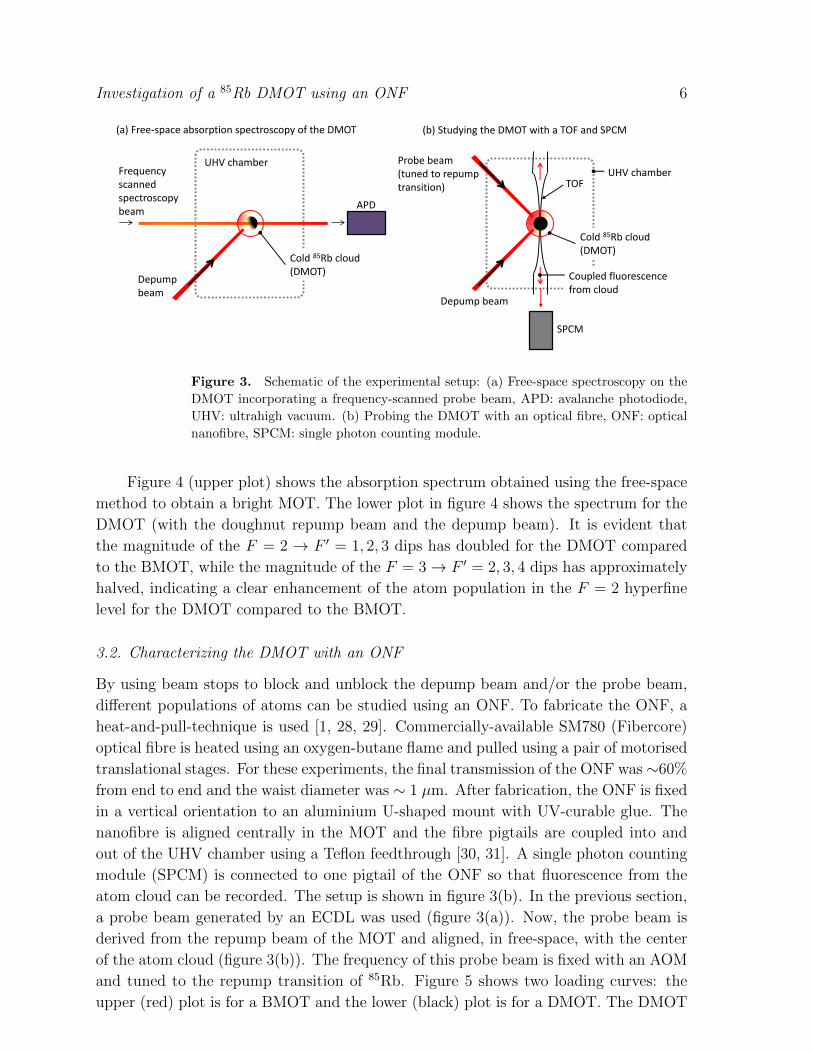
Figure 3. Schematic of the experimental setup: (a) Free-space spectroscopy on the
DMOT incorporating a frequency-scanned probe beam, APD: avalanche photodiode,
UHV: ultrahigh vacuum. (b) Probing the DMOT with an optical fibre, ONF: optical
nanofibre, SPCM: single photon counting module.
Figure 4 (upper plot) shows the absorption spectrum obtained using the free-space
method to obtain a bright MOT. The lower plot in figure 4 shows the spectrum for the
DMOT (with the doughnut repump beam and the depump beam). It is evident that
the magnitude of the F = 2 → F ′ = 1, 2, 3 dips has doubled for the DMOT compared
to the BMOT, while the magnitude of the F = 3→ F ′ = 2, 3, 4 dips has approximately
halved, indicating a clear enhancement of the atom population in the F = 2 hyperfine
level for the DMOT compared to the BMOT.
3.2. Characterizing the DMOT with an ONF
By using beam stops to block and unblock the depump beam and/or the probe beam,
different populations of atoms can be studied using an ONF. To fabricate the ONF, a
heat-and-pull-technique is used [1, 28, 29]. Commercially-available SM780 (Fibercore)
optical fibre is heated using an oxygen-butane flame and pulled using a pair of motorised
translational stages. For these experiments, the final transmission of the ONF was∼60%
from end to end and the waist diameter was ∼ 1 µm. After fabrication, the ONF is fixed
in a vertical orientation to an aluminium U-shaped mount with UV-curable glue. The
nanofibre is aligned centrally in the MOT and the fibre pigtails are coupled into and
out of the UHV chamber using a Teflon feedthrough [30, 31]. A single photon counting
module (SPCM) is connected to one pigtail of the ONF so that fluorescence from the
atom cloud can be recorded. The setup is shown in figure 3(b). In the previous section,
a probe beam generated by an ECDL was used (figure 3(a)). Now, the probe beam is
derived from the repump beam of the MOT and aligned, in free-space, with the center
of the atom cloud (figure 3(b)). The frequency of this probe beam is fixed with an AOM
and tuned to the repump transition of 85Rb. Figure 5 shows two loading curves: the
upper (red) plot is for a BMOT and the lower (black) plot is for a DMOT. The DMOT

Investigation of a 85Rb DMOT using an ONF 7
0 . 8 00 . 8 50 . 9 00 . 9 51 . 0 0
2 0 0 3 0 0 4 0 0 5 0 0 8 0 0 9 0 0 1 0 0 0 1 1 0 0 1 2 0 00 . 8 00 . 8 50 . 9 00 . 9 51 . 0 0
Tra
nsmi
ssion
(a.u.
)Bri
ght M
OT
F = 2 → F ’ = 1 , 2 , 3
(Tran
smiss
ion (a
.u.)
Dark
MOT
T i m e ( a . u . )
F = 3 → F ’ = 2 , 3 , 4
Figure 4. Upper trace: Free-space absorption spectroscopy on a BMOT. Lower
trace: Free-space absorption spectroscopy on an optimized DMOT. The DMOT here is
created using a doughnut repump MOT beam and a depump beam. There is a higher
population in the F = 2 lower hyperfine level for the DMOT compared to the BMOT.
in this instance has no depump shining on it and, thus, it is not extremely dark (i.e.
p is not very low). This explains why the resulting coupling from the DMOT (∼750
counts/5 ms) is not negligible when compared to the coupling from the BMOT (∼2000
counts/5 ms). The steady state count rate for both curves is proportional to the number
of atoms in F = 3 although the distribution of atoms between both hyperfine ground
states, F = 2 and F = 3, is different in each case. However, these two sets of data are
not sufficient to determine the population of each ground state or the darkness of the
DMOT. To determine the value of p with the SPCM and ONF two sets of data must
be recorded and analyzed, as described in the following section.
Figure 6(a) shows the fluorescence count rate through the fibre for a DMOT created
with a doughnut repump beam (and no depumping beam). The black, vertical line at
∼7.5 s indicates the point at which the magnetic field is switched on to allow the DMOT
to load. The fluorescence level increases from 125 counts/2 ms (indicated by the red line
that shows the background light coupling into the fibre) to ∼275 counts/2 ms due to the
residual bright atoms in the DMOT. In other words, the F = 3 atoms contribute ∼150
counts/2 ms to the signal. This is the numerator of p as given in (1). In figure 6(b), the
fluorescence signal is recorded for a DMOT created with the doughnut repump beam
and the depumper. This yields a baseline count rate of 175 counts/2 ms (blue line,

Investigation of a 85Rb DMOT using an ONF 8
1 5 2 0 2 5 3 0 3 50
5 0 0
1 0 0 0
1 5 0 0
2 0 0 0
2 5 0 0
Coun
ts (pe
r 5 m
s gate
)
T i m e ( s e c o n d s )
B M O T D M O T ( w i t h n o d e p u m p e r )
Figure 5. Loading curves for a BMOT (red, upper) and a DMOT (black, lower). This
plot shows the residual fluorescence coupling that can be obtained using a DMOT of
modest p value. In this case, the DMOT has been created with the doughnut repump
beam only (no depump light has been used).
figure 6(b)) and the numerator of p in this case is 50 counts/2 ms. Furthermore, in
this plot, the probe beam is added to the optical configuration. This probe beam is
tuned to the repumping transition of 85Rb (F = 2→ F ′ = 3) and aligned with the dark
region of the cloud. Thus, it “fills in” the dark central region of the doughnut-shaped
repump beam, thereby recreating a standard BMOT configuration. The probe switches
on for 100 ms at 1 Hz repetition rate, while the depump switches off at the same time
and with the same rate. The observed spikes in the fluorescence count rate (∼1150
counts/2 ms) coupled into the ONF are from atoms in both the ground state hyperfine
levels, F = 2 and 3. This is the denominator of p. By taking the ratio of the baseline
(125 counts/2 ms) in figure 6(a) to the peak counts in figure 6(b), and correcting for
the background level, the value for p is determined as ∼0.10 in the DMOT without the
depumper. However, with the inclusion of the depumper the dark MOT is improved
and a value of p ∼ 50/1150 ≈ 0.04 is obtained.
3.3. DMOT loading times
Loading curves were analyzed for the DMOT and BMOT via the ONF with a
methodology similar to that described in [32]. Figure 7(a) shows a loading curve for a
BMOT (red plot) and a loading curve for a DMOT (black plot). Both curves have been
background-corrected. The BMOT curve yields a loading rate, RB, of 15×104 counts/s
by fitting it with N(t) = RB/Γ(1−e−Γt) where Γ is the collisional loss rate in the MOT.

Investigation of a 85Rb DMOT using an ONF 9
4 6 8 1 0 1 2 1 40
1 0 0
2 0 0
3 0 0
4 0 0
0 1 2 3 4 50
5 0 0
1 0 0 0
1 5 0 0
2 0 0 0
Co
unts
(per 2
ms g
ate)
( a ) L o a d i n g c u r v e f o r a D M O T c r e a t e d w i t h a h o l l o wr e p u m p b e a m ( n o d e p u m p e r p r e s e n t . )
M a g n e t i c f i e l d o f f M a g n e t i c f i e l d s w i t c h e d o n
Coun
ts (pe
r 2 m
s gate
)
T i m e ( s e c o n d )
( b ) A D M O T c r e a t e d w i t h a h o l l o w r e p u m p b e a m a n d a d e p u m p e r . I n t h i s d a t a , t h ed e p u m p e r i s s e q u e n c e d t o s w i t c h o f f f o r 1 0 0 m s e v e r y 1 s e c o n d . D u r i n g e a c h 1 0 0 m sw h e n t h e d e p u m p e r i s s w i t c h e d o f f , a p r o b e b e a m ( t u n e d t o F = 2 →F ’ = 3 ) s w i t c h e s o n .
D e p u m p e r o f f ,p r o b e o n
Figure 6. Florescence count rate coupled into the ONF for : (a) a DMOT created
with a doughnut repump beam and no depump light, (b) a DMOT created with a
doughnut repump beam and the depump beam. The depumper is switched off for 100
ms at 1 Hz repetition rate. Additionally, there is also a probe beam that switches on
when the depump is off. For both plots, the doughnut-shaped repump beam is on at
all times. By taking the ratio of the baseline counts in plot a to the peaks in plot b
the value for p is determined to be ∼0.10. However, by including the depumper, p is
determined using the baseline of plot b(blue line) to be 50/1150 ≈ 0.04.
The plot in the lower panel represents the loading for a DMOT which has been created
with a doughnut repump beam and a depumper. The spikes in fluorescence occurring
at 1 Hz (for 100 ms duration) are due to simultaneously switching off the depumper
and switching on the probe beam for detection purposes. As discussed previously, these
conditions (depumper off and probe on) recreate the conditions for a BMOT and provide
a measurement of the denominator of p. These peaks in the DMOT plot reach values of
∼ 1× 10⁵ counts/s, matching the steady state count rate of the BMOT loading curve.
The baseline curve of the DMOT plot represents the loading of the fraction of F = 3
atoms present in the DMOT. The DMOT does not contribute to the loading process so
the loading rate cannot be larger in the DMOT than in the BMOT. In figure 7(a) one
can see that the loading rate of the DMOT, RD, is ∼ 0.2RB. For this DMOT, p=0.22.
The change in RD can be examined as a function of p. In figure 7(b), p is varied
(using different depumper intensities) over the range 0.08 to 0.50. The loading rate of

Investigation of a 85Rb DMOT using an ONF 10
L o a d i n g c u r v e f o r D M O T L i n e a r f i t ⇒ R D = 3 ×1 0 4 c o u n t s / s
0 1 2 30 . 0
2 . 0 x 1 0 4
4 . 0 x 1 0 4
6 . 0 x 1 0 4
8 . 0 x 1 0 4
1 . 0 x 1 0 5
1 . 2 x 1 0 5
1 . 4 x 1 0 5
B M O T T h e o r e t i c a l f i t ⇒ R B = 1 5 ×1 0 4 c o u n t s / s
0 . 1 0 . 2 0 . 3 0 . 4 0 . 5 0 . 0
2 . 0 x 1 0 4
4 . 0 x 1 0 4
6 . 0 x 1 0 4
8 . 0 x 1 0 4
1 . 0 x 1 0 5
1 . 2 x 1 0 5
1 . 4 x 1 0 5Loading rate, R
D (counts per second)
Coun
ts (pe
r sec
ond)
T i m e ( s e c o n d s )
( b ) V a r i a t i o n i n D M O T l o a d i n g r a t e , R D , w i t h p ( a ) L o a d i n g c u r v e s f o r a B M O T a n d D M O T
p
Figure 7. Background-corrected loading curves for the BMOT and DMOT are shown
in (a) with theoretical fits to determine the loading rates: RB = 15 × 104 counts/s,
RD = 3 × 10⁴ counts/s. In this case, p = 0.22 for the DMOT. (b) As the DMOT
becomes darker (i.e. as p reduces) the loading rate RD decreases.
the DMOT decreases for lower p values as expected [33]. Loading rates for the BMOT
and DMOT can be explored by varying the cooling laser intensity (per MOT beam,
Ibeam) and recording the same data as shown in figure 7(a) for each Ibeam. This study is
shown in figure 8. The DMOT loading rate, RD, is consistently lower than the BMOT
loading rate RB.
4. Conclusion
This work examined the implementation of a DMOT in order to circumvent the
density-limitations of a BMOT. For “atom - nanofibre” experiments, this is a major
consideration. If one wishes to do absorption experiments using an ONF, for example,
signal quality will be improved dramatically by forcing as many atoms as possible
to fill the evanescent region around the fibre. Although there will still be collisional
losses in a DMOT (unless p = 0), the reabsorption of scattered photons is no longer
a major problem. By packing more atoms closer to the fibre surface, absorption
of the light passing through the nanofiber can be enhanced as number of atoms in
the evanescent field region is increased. A density improvement is critical to achieve
high optical densities, thereby allowing demonstrations of nonlinear effects such as
electromagnetically induced transparency and slow light [34, 35]. The variation in
DMOT loading rate, RD, for changing p was measured via the ONF, with the lowest

Investigation of a 85Rb DMOT using an ONF 11
B M O T l o a d i n g r a t e , R B D M O T l o a d i n g r a t e , R D L i n e a r f i t t o B M O T l o a d i n g r a t e t r e n d L i n e a r f i t t o D M O T l o a d i n g r a t e t r e n d
2 3 4 5 6 70 . 0
5 . 0 x 1 0 4
1 . 0 x 1 0 5
1 . 5 x 1 0 5
2 . 0 x 1 0 5
Load
ing ra
te (co
unts
per s
econ
d)
C o o l i n g l a s e r i n t e n s i t y p e r b e a m , I b e a m ( m W / c m 2 )
Figure 8. The red (black) data points show the trend in loading rates for the BMOT
(DMOT) while varying the cooling laser intensity per MOT beam, Ibeam. As the
doughnut repump beam and the depumper do not help the loading process, the loading
rates for the DMOT are lower than those of the BMOT. Linear fits have been applied
to each series as a guide to the eye. The error bars are calculated from the loading
curve fits.
values of RD obtained for the darkest DMOTs as expected. This alternative technique
for measurement of DMOT parameters using an ONF has the advantage that it can be
used to probe different local regions of a DMOT. For example, the loss of dark state cold
atoms due to collisions around the central region and near the interface between bright
and dark regions of a DMOT can be studied using an ONF. This would be extremely
difficult to achieve using other commonly employed methods of fluorescence detection,
i.e., using photodetectors.
5. Ackowledgements
This work was supported by Science Foundation Ireland under Grant No.
08/ERA/I1761 through the NanoSci- E+ Transnational Programme, NOIs, and OIST
Graduate University. LR acknowledges support from IRCSET through the Embark
Initiative.
References
[1] Ward J M, O’Shea D G, Shortt B J, Morrissey M J, Deasy K D and Nic Chormaic S 2006 Heat-
and-pull rig for fiber taper fabrication Rev. Sci. Instrum. 77 083105
[2] Le Kien F, Dutta Gupta S, Balykin V I and Hakuta K 2005 Spontaneous emission of a cesium
atom near a nanofiber: Efficient coupling of light to guided modes Phys. Rev. A 72 032509

Investigation of a 85Rb DMOT using an ONF 12
[3] Nayak K P, Melentiev P N, Morinaga M, Le Kien F, Balykin V I and Hakuta K 2007 Optical
nanofiber as an efficient tool for manipulating and probing atomic fluorescence Opt. Exp. 15
5431
[4] Morrissey M J, Deasy K, Wu Y, Chakrabarti S and Nic Chormaic S 2009 Tapered optical fibers
as tools for probing magneto-optical trap characteristics Rev. Sci. Instrum. 80 053102
[5] Russell L, Deasy K, Daly M J, Morrissey M J and Nic Chormaic S 2012 Sub-Doppler temperature
measurements of laser-cooled atoms using optical nanofibres Meas. Sci. Technol. 23 015201
[6] Russell L, Kumar R, Tiwari V B and Nic Chormaic S 2013 Measurements on release-recapture of
cold 85Rb atoms using an optical nanofiber in a magneto-optical trap Opt. Commun. 309 313
[7] Spillane S M, Pati G S, Salit K, Hall M, Kumar P, Beausoleil R G and Shahriar M S 2008
Observation of nonlinear optical interactions of ultralow levels of light in a tapered optical
nanofiber embedded in a hot rubidium vapor Phys. Rev. Lett. 100 233602
[8] Hendrickson S M, Lai M M, Pittman T B and Franson J D 2010 Observation of two-photon
absorption at low power levels ssing tapered optical fibers in rubidium vapor Phys. Rev. Lett.
105 173602
[9] Watkins A, Tiwari V B, Ward J M and Nic Chormaic S 2013 Observation of Zeeman shift in the
rubidium D2 line using an optical nanofiber in vapor arXiv:1208.4708v3
[10] Balykin V I, Hakuta K, Le Kien F, Liang J Q and Morinaga M 2004 Atom trapping and guiding
with a subwavelength-diameter optical fiber Phys. Rev. A 70 011401
[11] Le Kien F, Balykin V I and Hakuta K 2004 Atom trap and waveguide using a two-color evanescent
light field around a subwavelength-diameter optical fiber Phys. Rev. A 70 063403
[12] Sague G, Baade A and Rauschenbeutel A 2008 Blue-detuned evanescent field surface traps for
neutral atoms based on monde interference in ultrathin optical fibres New J. Phys. 10 113008
[13] Reitz D and Rauschenbeutel A 2012 Nanofiber-based double-helix trap for cold atoms Opt.
Commun. 285 4705
[14] Phelan C F, Hennessy T and Busch T 2013 Shaping the evanescent field of optical nanofibers for
cold atom trapping arXiv:1308.0905v1
[15] Vetsch E, Reitz D, Sague G, Schmidt R, Dawkins S T and Rauschenbeutel A 2010 Optical interface
created by laser-cooled atoms trapped in the evanescent field surrounding an optical nanofiber
Phys. Rev. Lett. 104 203603
[16] Goban A, Choi K S, Alton D J, Ding D, Lacroute C, Pototschnig M, Thiele T, Stern N P and
Kimble H J 2012 Demonstration of a state-insensitive, compensated nanofiber trap Phys. Rev.
Lett. 109 033603
[17] Russell L, Gleeson D A, Minogin V G and Nic Chormaic S 2009 Spectral distribution of atomic
fluorescence coupled into an optical nanofibre J. Phys. B: At. Mol. Opt. Phys.42 185006
[18] Minogin V G and Nic Chormaic S 2010 Manifestation of the van der Waals surface interaction in
the spontaneous emission of atoms into an optical nanofiber Las. Phys. 20 32
[19] Morrissey M, Deasy K, Frawley M, Kumar R, Prel E, Russell L, Truong V G and Nic Chormaic S
2013 Spectroscopy, manipulation and trapping of neutral atoms, molecules, and other particles
using optical nanofibers: A review Sensors 13 10449
[20] Ketterle W, Davis K B, Joffe M A, Martin A and Pritchard D E 1993 High densities of cold atoms
in a dark spontaneous-force optical trap Phys. Rev. Lett. 70 2253
[21] Muniz S R, Magalhaes K M F, Henn E A L, Marcassa L G and Bagnato V S 2004 Creating a
self-induced dark spontaneous-force optical trap for neutral atoms Opt. Commun. 235 333
[22] Chapovsky P L 2006 Spectral Characteristics of cold rubidium atoms in a dark magneto-optical
trap J. Exp. Theo. Phys. 103 711
[23] Chapovsky P L 2007 Observation of nonlinear optical recoil-induced resonances in a dark magneto-
optical trap J. Exp. Theo. Phys. 86 78
[24] Singh S, Tiwari V B and Rawat H S 2010 Efficient loading of a Rb dark magneto-optical trap by
controlling current through a getter source J. Exp. Theo. Phys. 111 371
[25] Li-Rong W, Zhong-Hua J, Jin-Peng Y, Yan Y, Yan-Ting Z, Jie M, Lian-Tuan X and Suo-Tang J

Investigation of a 85Rb DMOT using an ONF 13
2012 Investigation of ultracold atoms and molecules in a dark magneto-optical trap Chin. Phys.
B 21 113402
[26] Permyakova O I, Yakovlev A V and Chapovskii P L 2008 Measurement of the lifetime of rubidium
atoms in a dark magneto-optical trap Quant. Elect. 38 884
[27] Townsend C G, Edwards N H, Zetie K P, Cooper C J, Rink J and Foot C J 1996 High-density
trapping of cesium atoms in a dark magneto-optical trap Phys. Rev. A 53 1702
[28] Kenny R P, Birks T A and Oakley K P 1991 Control of optical fibre taper shape Electron. Lett.
27 1654
[29] Brambilla G, Finazzi V and Richardson D 2004 Ultra-low-loss optical fiber nanotapers Opt. Express
12 2258
[30] Abraham E R I and Cornell E A 1998 Teflon feedthrough for coupling optical fibers into ultrahigh
vacuum systems Appl. Opt. 37 1762
[31] Cowpe J and Pilkington R 2008 Swagelok ultra-torr based feed-through design for coupling optical
fibre bundles into vacuum systems Vacuum 82 1341
[32] Anderson M H, Petrich W, Ensher J R and Cornell E A 1994 Reduction of light-assisted collisional
loss rate from a low-pressure vapor-cell trap Phys. Rev. A 50 R3597
[33] Kim J Y and Cho D 2001 Dark-spot magneto-optical trap of cesium atoms J. Kor. Phys. Soc. 39
864
[34] Braje D, Balic V, Yin G and Harris S 2003 Low-light-level nonlinear optics with slow light Phys.
Rev. A 68 041801(R)
[35] Hakuta K 2008 Single atoms on an optical nanofiber: a novel work system for slow light Proc.
SPIE 6904 690406
![arXiv:physics/0006017v1 [physics.atom-ph] 7 Jun 2000 · arXiv:physics/0006017v1 [physics.atom-ph] 7 Jun 2000 FINITE-DIFFERENCE CALCULATIONS FOR ATOMS AND DIATOMIC MOLECULES IN STRONG](https://img.pdfslide.us/doc/110x75/5b883beb7f8b9a1f248e9f59/arxivphysics0006017v1-7-jun-2000-arxivphysics0006017v1-7-jun-2000.jpg)
![arXiv:physics/0511235v2 [physics.atom-ph] 28 Jan 2006 · 2018-11-13 · arXiv:physics/0511235v2 [physics.atom-ph] 28 Jan 2006 Short-pulse photoassociation in rubidium below the D1](https://img.pdfslide.us/doc/110x75/5f03ab817e708231d40a3159/arxivphysics0511235v2-28-jan-2006-2018-11-13-arxivphysics0511235v2-.jpg)

![arXiv:physics/9709010v2 [physics.atom-ph] 14 Dec 1997 · arXiv:physics/9709010v2 [physics.atom-ph] 14 Dec 1997 Andreas E. Klinkmu¨ller • Doctorate thesis 1997 Akademisk avhandling,](https://img.pdfslide.us/doc/110x75/5cfdf54a88c993912c8bd9c8/arxivphysics9709010v2-14-dec-1997-arxivphysics9709010v2-14-dec-1997.jpg)

![arXiv:physics/0506173v2 [physics.atom-ph] 28 Jul 2005 · 2018-08-29 · arXiv:physics/0506173v2 [physics.atom-ph] 28 Jul 2005 1 Fundamental Physical Constants: Looking from Different](https://img.pdfslide.us/doc/110x75/5e692ea3fa9d31478823a9f6/arxivphysics0506173v2-28-jul-2005-2018-08-29-arxivphysics0506173v2-.jpg)
![and Jun Yan arXiv:1712.08134v1 [physics.atom-ph] 21 Dec 2017arXiv:1712.08134v1 [physics.atom-ph] 21 Dec 2017 Draftversion August13,2018 Typeset using LATEX twocolumnstyle in AASTeX61](https://img.pdfslide.us/doc/110x75/60504c1c1894f713772bcc4a/and-jun-yan-arxiv171208134v1-21-dec-2017-arxiv171208134v1-21-dec-2017.jpg)
![arXiv:1609.04082v1 [physics.atom-ph] 14 Sep 2016 · 2016-09-15 · arXiv:1609.04082v1 [physics.atom-ph] 14 Sep 2016 Recent progress in thedescription of positronscattering from atoms](https://img.pdfslide.us/doc/110x75/5f52bbf84de44263f93ac6de/arxiv160904082v1-14-sep-2016-2016-09-15-arxiv160904082v1-14-sep-2016.jpg)
![arXiv:1903.09828v1 [physics.atom-ph] 23 Mar 2019](https://img.pdfslide.us/doc/110x75/61a7d8198a1fa0147b2bbdc4/arxiv190309828v1-23-mar-2019.jpg)
![arXiv:1810.12821v1 [physics.atom-ph] 30 Oct 2018](https://img.pdfslide.us/doc/110x75/62423cc3ab5d24639e7ce2c7/arxiv181012821v1-30-oct-2018.jpg)
![arXiv:1611.05299v1 [physics.atom-ph] 16 Nov 2016](https://img.pdfslide.us/doc/110x75/61b12f94e2d2a01d871216d1/arxiv161105299v1-16-nov-2016.jpg)
![arXiv:1506.03646v1 [physics.atom-ph] 11 Jun 2015](https://img.pdfslide.us/doc/110x75/62591d0edc7e3865f96054a7/arxiv150603646v1-11-jun-2015.jpg)

![arXiv:2110.11123v1 [physics.atom-ph] 21 Oct 2021](https://img.pdfslide.us/doc/110x75/61a4de3ef7eb1f580e764193/arxiv211011123v1-21-oct-2021.jpg)
![arXiv:1208.2526v1 [physics.atom-ph] 13 Aug 2012](https://img.pdfslide.us/doc/110x75/6262353b58ed9457fb62c9f6/arxiv12082526v1-13-aug-2012.jpg)
![arXiv:2012.06688v1 [physics.atom-ph] 12 Dec 2020](https://img.pdfslide.us/doc/110x75/6268a60a2ddf8558342cf963/arxiv201206688v1-12-dec-2020.jpg)
![arXiv:2001.10979v1 [physics.atom-ph] 27 Jan 2020](https://img.pdfslide.us/doc/110x75/62afae9f8701990a2a0d0d5b/arxiv200110979v1-27-jan-2020.jpg)
![arXiv:2110.11559v1 [physics.atom-ph] 22 Oct 2021](https://img.pdfslide.us/doc/110x75/61b376437cf95748f5294f06/arxiv211011559v1-22-oct-2021.jpg)
![arXiv:1907.03607v1 [physics.atom-ph] 8 Jul 2019](https://img.pdfslide.us/doc/110x75/62423a6303b0b651186f97a3/arxiv190703607v1-8-jul-2019.jpg)
![arXiv:2110.08894v1 [physics.atom-ph] 17 Oct 2021](https://img.pdfslide.us/doc/110x75/61bd2daf61276e740b101d1c/arxiv211008894v1-17-oct-2021.jpg)
![arXiv:1908.00853v1 [physics.atom-ph] 2 Aug 2019](https://img.pdfslide.us/doc/110x75/6191c695e150880f326355fd/arxiv190800853v1-2-aug-2019.jpg)

![arXiv:2103.14383v1 [physics.atom-ph] 26 Mar 2021](https://img.pdfslide.us/doc/110x75/627a46e6a400773b41361ef0/arxiv210314383v1-26-mar-2021.jpg)
![arXiv:1302.4822v3 [physics.atom-ph] 1 May 2013](https://img.pdfslide.us/doc/110x75/61f29980f56cd245346a5b4d/arxiv13024822v3-1-may-2013.jpg)


![arXiv:1607.01969v1 [physics.atom-ph] 7 Jul 2016](https://img.pdfslide.us/doc/110x75/619c336e8f38ff6ae55e7a58/arxiv160701969v1-7-jul-2016.jpg)
![arXiv:1805.11265v2 [physics.atom-ph] 12 Jan 2019](https://img.pdfslide.us/doc/110x75/61d71c3a9e8c2e5c1c3b5f0d/arxiv180511265v2-12-jan-2019.jpg)