Embed Size (px)
Citation preview
Using Ambulance Data for Violence PreventionTechnical Report
Alex Sutherland, Lucy Strang, Martin Stepanek,
Chris Giacomantonio, Adrian Boyle
RAND Europe is a not-for-profit organisation that helps to improve policy and decision making through research and analysis. RAND’s publications do not necessarily reflect the opinions of its research clients and sponsors.
Limited Print and Electronic Distribution Rights
This document and trademark(s) contained herein are protected by law. This representation of RAND intellectual property is provided for noncommercial use only. Unauthorized posting of this publication online is prohibited. Permission is given to duplicate this document for personal use only, as long as it is unaltered and complete. Permission is required from RAND to reproduce, or reuse in another form, any of its research documents for commercial use. For information on reprint and linking permissions, please visit www.rand.org/pubs/permissions.
Support RANDMake a tax-deductible charitable contribution at
www.rand.org/giving/contribute
www.rand.org
www.rand.org/randeurope
For more information on this publication, visit www.rand.org/t/RR2216
Published by the RAND Corporation, Santa Monica, Calif., and Cambridge, UK
© Copyright 2017 RAND Corporation
R® is a registered trademark.
iii
Preface
In early 2015, West Midlands Police (WMP) received a grant from the Police Innovation Fund to bring together key partners relevant to accessing, understanding and making the best use of ambulance data to aid with the prevention of violence. This project was led by Chief Inspector Dave Twyford, the then National Policing Lead for Gangs and the Criminal Use of Firearms. West Midlands Violence Prevention Alliance (WMVPA) agreed to oversee and ‘champion’ the implementation of ambulance data sharing in the West Midlands. Public Health England (PHE) and the West Midlands Ambulance Service NHS Foundation Trust (WMAS) supported access to ambulance data and tracking of violence-related outcomes. RAND Europe, Dr Adrian Boyle (Addenbrooke’s Hospital) and Dr Barak Ariel (University of Cambridge) provided independent evaluation of the implementation of ambulance data-sharing and led the development of practitioner guidance in this area. This report presents the technical findings from the project.
Following an introduction to the background to the study and the use of health data to support violence prevention initiatives, the report examines the requirements for access to health data (Chapter 3) and the police, ambulance dispatch and emergency department (ED) admission datasets used by the research team (Chapter 4). The report then sets out results from the process evaluation: factors contributing to changes from the proposed project approach; barriers to data sharing; the WMP organisational restructuring; and gaps in data provided by WMAS (Chapter 5). Next, the report compares police, ambulance and ED data in terms of geographical coverage, overlap and discussed some potential uses of ambulance data by the police (Chapter 6). The report concludes by reflecting on study results, limitations of the evaluation, recommendations for applications of ambulance data and avenues of future research (Chapter 7).
More detail on project methods and additional data is included as appendices to this report, and methodological limitations are noted where appropriate.
RAND Europe is a not-for-profit policy research organisation that aims to improve policy and decision-making in the public interest through independent research and analysis. This report has been peer-reviewed in accordance with RAND’s quality assurance standards. For more information about RAND Europe or this document, please contact:
Dr Alex Sutherland
RAND Europe, Westbrook Centre, Milton Road, Cambridge CB4 1YG
Email: [email protected]

v
Table of contents
Preface ..................................................................................................................................................... iii
Table of contents ....................................................................................................................................... v
Figures .................................................................................................................................................... vii
Tables .................................................................................................................................................... viii
Acknowledgements .................................................................................................................................. ix
Abbreviations used in this document ......................................................................................................... x
1. Summary ............................................................................................................................. 1
1.1.Results.......................................................................................................................................... 3
1.2.Recommendations ........................................................................................................................ 3
2. Introduction ........................................................................................................................ 5
2.1.Using ambulance data for violence prevention: background ......................................................... 5
2.2.Existing evidence on violence prevention as a public health initiative............................................ 6
2.3.Rationale for the RAND Europe ambulance data study ................................................................ 6
2.4.RAND Europe ambulance data study overview ............................................................................ 7
2.5.The potential value of ambulance data for violence prevention ..................................................... 8
2.6.Objectives and research tasks ...................................................................................................... 10
2.7.Report structure ......................................................................................................................... 11
3. Requirements for accessing ambulance data ......................................................................... 12
3.1.Prerequisites for access and implementation ............................................................................... 12
4. Understanding the datasets ................................................................................................. 15
4.1.Data sources ............................................................................................................................... 15
4.2.Geographical coverage of datasets ............................................................................................... 18
4.3.Data processing .......................................................................................................................... 21
4.4.Analysis steps .............................................................................................................................. 22
5. Process evaluation results .................................................................................................... 26
5.1.Process evaluation objectives and questions ................................................................................ 26
vi
5.2.Factors contributing to changing the proposed approach ............................................................ 29
5.3.Findings from process evaluation ................................................................................................ 31
6. Comparing police, ambulance and ED data ......................................................................... 35
6.1.Geographical coverage of different datasets ................................................................................. 35
6.2.Descriptive statistics and trends .................................................................................................. 36
6.3.To what extent do police, ambulance and ED incidents overlap? ................................................ 40
6.4.Hotspots: one example of how ambulance data could be used by police ..................................... 43
7. Conclusion ........................................................................................................................ 49
7.1.Limitations ................................................................................................................................. 50
7.2.Recommendations ...................................................................................................................... 51
References ............................................................................................................................................... 54
Appendix 1 ............................................................................................................................................. 56
Appendix 2 ............................................................................................................................................. 58
Appendix 3 ............................................................................................................................................. 61
Appendix 4 ............................................................................................................................................. 64
Appendix 5 ............................................................................................................................................. 65
Appendix 6 ............................................................................................................................................. 66
Appendix 7 ............................................................................................................................................. 68
vii
Figures
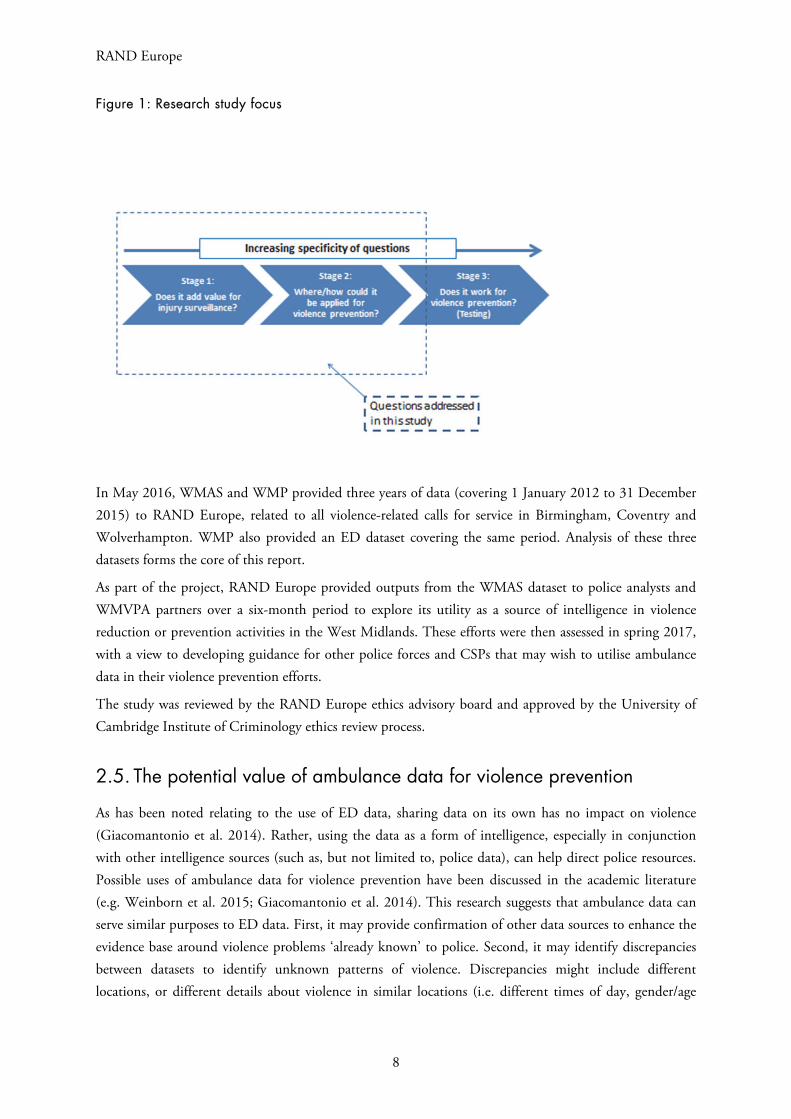
Figure 1: Research study focus .................................................................................................................. 2
Figure 1: Research study focus .................................................................................................................. 8
Figure 2: Geographical coverage of available datasets – police (blue), CAD (green) and ED (red) – in Wolverhampton (west), Birmingham (middle) and Coventry (east) ............................................... 20
Figure 3: Example of conversion between coordinates (blue dot) and postcode (black polygon) using the postcode centroid (red dot) ............................................................................................................ 21
Figure 4: Example of a 200 m x 200 m spatial net in Wolverhampton city centre. Each red dot represents a unique postcode .......................................................................................................................... 24
Figure 5: Representation of cases in Wolverhampton city centre 2012–2015; police (blue), CAD (green) and ED (red) datasets .................................................................................................................... 36
Figure 6: Incidents in the police and CAD datasets by day of week ........................................................ 37
Figure 7: Incidents in the police and CAD datasets by time of day (share of all incidents) ...................... 37
Figure 8: Number of incidents in the police and CAD datasets by month .............................................. 38
Figure 9: Number of incidents in police, ED and CAD datasets over time ............................................. 38
Figure 10: Gender and age distribution in the CAD dataset, April 2016 to March 2017 ........................ 39
Figure 11: Severity of injuries and type of offence in the CAD dataset, April 2016 to March 2017 ........ 39
Figure 12: Records of assault-related injuries reported by clerical/clinical staff at Type 1 emergency departments (ISTV data) vs ambulance call-outs in the CAD dataset............................................. 40
Figure 13: Assaults within the 21–25 years old age group in Wolverhampton from CAD dataset, 2012–2015 (top panel); police dataset of all incidents, 2012–2015 (bottom panel) ................................. 45
Figure 14: Hot street segments in Wolverhampton with and without background in police dataset, 2012–2015 .............................................................................................................................................. 47
viii
Tables
Table 1: CAD dataset variables ............................................................................................................... 16
Table 2: ED dataset variables .................................................................................................................. 17
Table 3: Police call-out dataset variables ................................................................................................. 18
Table 4: Overlap between the police, CAD and ED datasets using postcode referencing and six-hour time nets................................................................................................................................................ 41
Table 5: Proportion of CAD and ED datasets incidents found in the police dataset using varying spatial nets................................................................................................................................................ 42
Table 6: Spatial concentration of crime by postcode ............................................................................... 43
Table 7: Top 10 hot postcodes in ambulance data .................................................................................. 46
Table 8: PFR dataset variables ................................................................................................................ 56
Table 9: WMAS dataset initially requested by RAND Europe ................................................................ 64
Table 10: Caldicott Principles ................................................................................................................ 65
ix
Acknowledgements
The authors would like to thank the many people who have supported this project. First and foremost, we would like to thank our research partners at the West Midlands Police and the Violence Prevention Alliance, including Superintendent Simon Inglis, Chief Inspector Dave Twyford, Ciaran Walsh and Andy Brumwell; and at the West Midlands NHS Ambulance Trust, Chris Kerr. We also thank Dr Adrian Boyle and Dr Barak Arial for their guidance throughout the project, and our former RAND Europe colleague Dr Chris Giacomantonio, who managed the research study in its early stages. We would also like to express our gratitude to Dr Obaghe Edeghere of Public Health England and Dr Zara Quigg of the Public Health Institute, Liverpool John Moores University for engaging with the project. We also thank the Police Innovation Fund for the opportunity to conduct this piece of research. Finally, we are grateful to our Quality Assurance reviewers, Professor Jonathan Shepherd from Cardiff University and Dr James Fox from RAND Europe.
x
Abbreviations used in this document
CAD Computer-Aided Dispatch
CSP Community Safety Partnership
ED Emergency Department
EGYV Ending Gang and Youth Violence
ISA Information Sharing Agreement
ISTV Information Sharing to Tackle Violence
LA Upper-tier Local Authorities
LSOA Lower Layer Super Output Areas
PHE Public Health England
PRF Patient Report Form
TIIG Trauma and Injury Intelligence Group
WMAS West Midlands Ambulance Service NHS Foundation Trust
WMP West Midlands Police
WMVPA West Midlands Violence Prevention Alliance
VRU Violence Reduction Unit
1
1. Summary
Report highlights
This study facilitated the successful implementation of more detailed data sharing between the West Midlands Ambulance Service NHS Foundation Trust and the West Midlands Police, allowing, for the first time in the West Midlands, a detailed comparison of police and ambulance call-out data.
The study found that ambulance records contain substantial new information on violence, with between 66 per cent and 90 per cent of ambulance incidents not found in police data. Therefore, police are not aware of the location of a substantial proportion of violent incidents.
The volume of ambulance call-outs for public violence averages 16 per day in the West Midlands, meaning that ambulance data can offer high volume data that is not typically recorded by the police or ED.
As ambulance data is collected automatically and includes location data for each call, this data does not require substantial additional work to be collated and shared. This means that should ambulance data prove effective in reducing crime, it is easily scalable.
Provided that appropriate precautions are in place, the sharing of ambulance data with the police should not raise any information governance concerns.
Ambulance call-out data is a new form of intelligence that may have value for violence prevention or reduction activities. However, its utility as such a tool is still unproven and further study is required.
In spring 2015, the West Midlands Police (WMP) received a Police Innovation Fund grant to undertake a ‘proof of concept’ evaluation of the utility of using ambulance data for violence prevention activities, to
RAND Europe
2
be conducted by RAND Europe. Similar to emergency department (ED) data utilised in the Cardiff Model approach to violence prevention, (Warburton et al. 2004; Shepherd 2004) ambulance data is thought to offer a new source of intelligence data for police and community safety/violence prevention partnerships (Ariel et al. 2013). Such data may be able to help identify unknown patterns of violence and, from this, contribute to solutions to prevent and/or reduce violence.
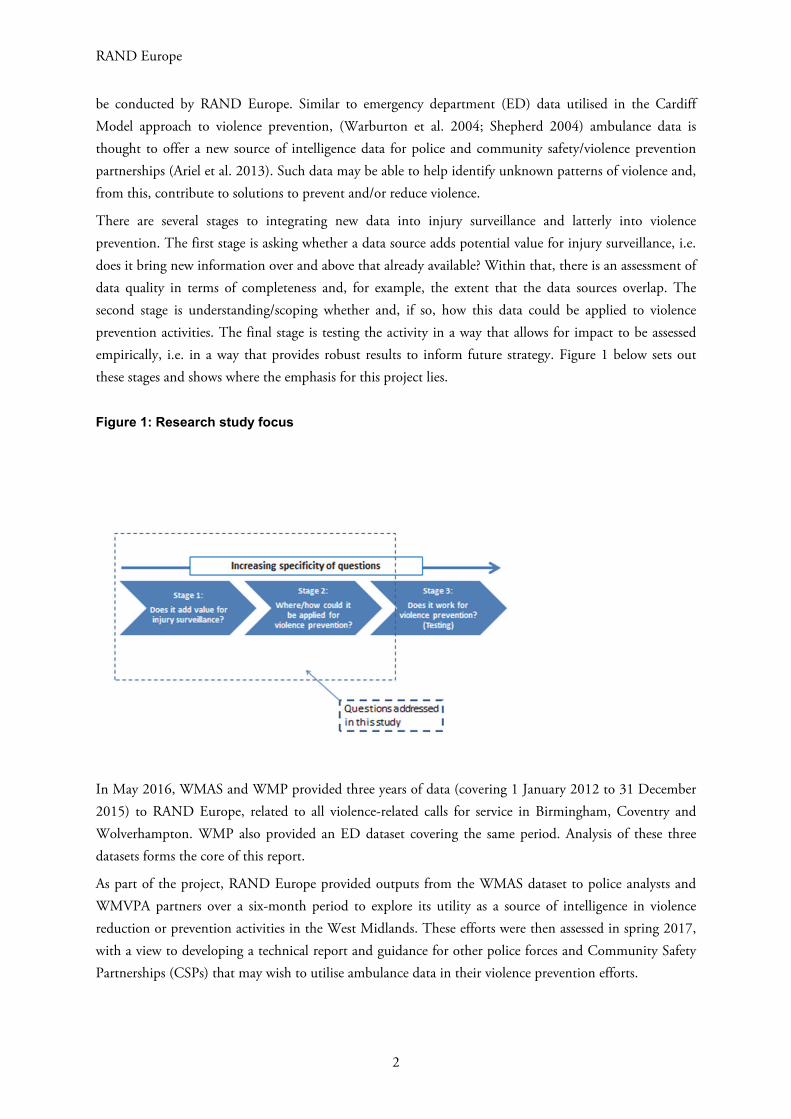
There are several stages to integrating new data into injury surveillance and latterly into violence prevention. The first stage is asking whether a data source adds potential value for injury surveillance, i.e. does it bring new information over and above that already available? Within that, there is an assessment of data quality in terms of completeness and, for example, the extent that the data sources overlap. The second stage is understanding/scoping whether and, if so, how this data could be applied to violence prevention activities. The final stage is testing the activity in a way that allows for impact to be assessed empirically, i.e. in a way that provides robust results to inform future strategy. Figure 1 below sets out these stages and shows where the emphasis for this project lies.
Figure 1: Research study focus
In May 2016, WMAS and WMP provided three years of data (covering 1 January 2012 to 31 December 2015) to RAND Europe, related to all violence-related calls for service in Birmingham, Coventry and Wolverhampton. WMP also provided an ED dataset covering the same period. Analysis of these three datasets forms the core of this report.
As part of the project, RAND Europe provided outputs from the WMAS dataset to police analysts and WMVPA partners over a six-month period to explore its utility as a source of intelligence in violence reduction or prevention activities in the West Midlands. These efforts were then assessed in spring 2017, with a view to developing a technical report and guidance for other police forces and Community Safety Partnerships (CSPs) that may wish to utilise ambulance data in their violence prevention efforts.
Using Ambulance Data for Violence Prevention
3
1.1. Results
The primary achievement of this project has been the successful implementation of more detailed data sharing between WMAS and WMP. That data sharing has facilitated the inclusion, for the first time, of WMAS data into the WMP Violence Prevention Workbook, which is a crucial source of information for the public health approach to violence prevention in the West Midlands. The effort and activity required to secure the data sharing was originally intended to be secondary to an intervention-based study of the impact of the new data on policing (and thus on violence). That the project was not able to progress to that stage is a reflection of the numerous barriers faced by the project team that serve to inform the process evaluation and the recommendations flowing from the project.
The other main contribution of this project has been, again for the first time in the West Midlands, a detailed comparison of police and ambulance data, in order to understand the ‘added value’ of ambulance data. Combining and comparing police and ambulance data produced four key findings:
First, ambulance records contain substantial new information on violence, with between 66 per cent and 90 per cent of ambulance incidents not found in police data. Therefore, police are not aware of the location of a substantial proportion of violent incidents. Ambulance data can be used to inform patrol officers about where violence hotspots are developing and when the areas are ‘active’, both of which they need to know for preventing further incidents.
Second, the volume of ambulance call-outs for public violence, averaging 16 per day in the West Midlands, means ambulance data can offer high volume data that is not typically recorded by the police or ED.
Third, as ambulance data is collected automatically and includes location data for each call, this data does not require substantial additional work to be collated and shared. This means that should ambulance data prove effective in reducing crime, it is easily scalable.
Fourth, a substantial proportion (around 55 per cent) of ambulance calls for service were from police officers, although the research team were only able to link up to 34 per cent of ambulance cases to incidents in the police dataset. Only 6 per cent of calls by police were located in the same postcode as a police station, indicating that the majority of these calls were not a result of people already in custody requiring medical attention. These figures require further research to establish the reason or reasons for the apparent discrepancy in the datasets.
It is important to note, however, that while ambulance data may have value for violence prevention or reduction activities, it is still unproven and further study is required. This recommendation is discussed further below.
1.2. Recommendations
National: Discussions about ambulance data sharing should engage senior members of the violence prevention alliance and ambulance service. The expectation should be that these discussions will focus on the justification for data sharing; beyond that, the degree of risk that is acceptable to the ambulance
RAND Europe
4
service as the data controller will drive discussions. For the West Midlands specifically, discussions with the ambulance service should perhaps be led by Public Health England (PHE).
WMVPA: Given the low overlap between the CAD and police dataset, it may be useful to collect data on presence of ambulance (in the police dataset) or police (in the CAD dataset). In particular, each incident report in the police dataset may further include information on whether ambulance was necessary, and, if yes, whether it was present and whether it was called by police force or someone else. Analogously, the CAD dataset may contain information on presence of police.
Future research: Further study is necessary to investigate the utility of ambulance data sharing with police, to ensure that police resources are not wasted on interventions that are not evidenced based, or detract from other work, especially if data sharing procedures and analyses are not automated. Therefore, it is recommended that the usefulness of ambulance data sharing needs to be further tested in effectiveness and cost–benefit evaluations. Additionally, hot postcodes in the analysis were identified as those with more incidents recorded in the CAD dataset than in the police dataset. However, since police dataset contains substantially more observations overall, we suggest replicating this analysis using different cut-offs; hot postcodes may then be identified, for example, by being associated with at least 50 per cent as many cases in the CAD dataset as in the police dataset.
Using Ambulance Data for Violence Prevention
5
2. Introduction
This chapter briefly discusses the background and context of the study, then sets out the project objectives and research tasks, previous uses of health data for violence prevention initiatives and assesses the potential value of ambulance data for these efforts.
2.1. Using ambulance data for violence prevention: background
Interpersonal violence, defined by the World Health Organisation as violence that occurs between family members, intimate partners, friends, acquaintances and strangers, is a global problem with far-reaching consequences for victims, offenders and wider society (World Health Organization 2014). Recent data from the Crime Survey for England and Wales (CSEW) indicated that there were an estimated 1.3 million incidents of violence in the year ending December 2016 (Office for National Statistics 2016). In the West Midlands, police recorded 109,545 incidents of violence against the person over the same period (Office for National Statistics 2017). Many jurisdictions have moved from seeing violence solely as a policing issue to a public health issue (Reform 2014). In 2013, the United Kingdom government adopted a new Public Health Model for England, implementing a new national framework and indicator set that placed critical policing outcomes such as reoffending, domestic violence, road accidents and violence as key areas that public health should be seeking to inform.
This emphasis on collaboration across public services to reduce and/or prevent violence opens up possibilities for new ways of integrating data and personnel. This project sought to test the viability of ambulance data as an untapped resource for improving understanding of where and when violence occurs, but also to explore whether ambulance data could be used as an operational resource to inform prevention initiatives. In spite of a common-sense assumption that ambulance data should be beneficial for violence prevention, there is currently little evidence supporting this. However, there is evidence on the effectiveness of ED data in violence prevention and, in turn, the efficiency savings for partner organisations. In Cardiff, for example, ED data sharing and concomitant frontline interventions led to a 40 per cent reduction in ED attendance since 2002 and reduced violence in public places and licensed premises (Shepherd 2007). Elsewhere, there is evidence accumulating about the use of ambulance data as a source of intelligence for violence prevention and response activities (Ariel, Weinborn & Boyle 2017; Quigg, McGee & Hughes 2017).
RAND Europe
6
2.2. Existing evidence on violence prevention as a public health initiative
Data on assault victims attending emergency departments (ED) has been used to support community violence prevention initiatives in England and Wales since the mid-1990s, in what is now commonly known as the Cardiff Model of violence prevention (Shepherd 2004). Cardiff Model ED data is typically shared with police and multi-agency violence prevention partnerships as a form of additional intelligence, to identify patterns of interpersonal violence that had been previous unknown to police. ED data is used to support preventive activities (e.g. additional police patrols in high-violence areas, or interventions at licensed premises with high levels of violence). Sharing of ED data has been consistently linked with
statistically significant reductions in violence in a local area.1 For example, an experimental study and time series analysis of an information sharing partnership between the health service, police and local authorities in Cardiff and 14 comparison cities found that the sharing and use of ED data was associated with a substantial and significant reduction in hospital admissions related to violence (Florence et al. 2011). Furthermore, cost–benefit analyses have shown that data sharing partnerships between health services, police and local government have led to substantial savings for the health service and the criminal justice system (Florence et al. 2014).
As a result of the evidence around efficacy, the use of ED data is now a national standard of practice
through the government’s Information Sharing to Tackle Violence (ISTV) guidance.2 Recent examples of violence prevention through data sharing include the Violence Reduction Unit (VRU), a multi-disciplinary team established by Strathclyde Police in 2005 to target violent crime, particularly in relation to knife crime. In 2008, the VRU created the Community Initiative to Reduce Violence, which seeks to improve cross-agency collaboration and information sharing. One such effort led to the establishment of Injury Surveillance Units in the ED wards of local hospitals, which recorded information pertaining to the nature of patient’s injury, and the date, time and location of the violent incident.
2.3. Rationale for the RAND Europe ambulance data study
Through a combination of resource constraint, new reporting requirements and a desire to be more proactive, police forces have been investigating and adopting new methodologies to continue delivering policing services and adapt to an evolving climate in policing and public health.
Furthermore, violence has social and emotional costs for victims and communities that cannot be quantified, and it also creates substantial costs for public services that can be measured. Data from the London and South Central ambulance services suggests that each ambulance call out involving transportation to hospital costs around £250 (Meikle 2015). WMAS receives approximately 6,000 calls for violence-related incidents a year. Even if only half of calls required conveyance to hospital (assuming
1 See, for example, Droste, Miller & Baker (2014) who conducted a systematic review of literature on the use of ED data and found substantial effects on levels of assaults in all areas studied. 2 See https://www.gov.uk/government/news/aes-and-police-to-share-information-to-help-tackle-violence.
Using Ambulance Data for Violence Prevention
7
similar costs), the cost would be in excess of £750,000 per year. One also has to factor in the opportunity cost – attending a violent incident means an ambulance and its crew cannot attend elsewhere.
WMP recorded 109,545 incidents of violence against the person in the year ending December 2016 (Office for National Statistics 2017). Fiscally, each common assault (the most common type of violence)3
is estimated to cost the police £150 and the NHS £160, with the overall cost of each assault around £500 (New Economy n.d.). If we use the figures here as the basis for calculations, this means that in 2016 the costs to public services in the West Midlands of common assault alone was approximately £24 million. These figures do not include Grievous Bodily Harm (GBH), Actual Bodily Harm (ABH) and more severe incidents, which attract higher costs overall. As such, there is a strong incentive for improving responses to public violence, increasing community safety and improving access to services by integrating ambulance and police data to capture unreported crimes and help focus preventative efforts by police.
With increases in some types of violence noted in recent years (College of Policing 2017; Office for National Statistics 2017), this project provides an important contribution in dealing with this issue.
2.4. RAND Europe ambulance data study overview
In spring 2015, WMP received a Police Innovation Fund grant to undertake a ‘proof of concept’ evaluation of the utility of using ambulance data for violence prevention activities, to be conducted by RAND Europe.
Similar to ED data utilised in what is known as the Cardiff Model approach to violence prevention (Warburton et al. 2004; Shepherd 2004), ambulance data has been thought to offer a new source of intelligence data for police and community safety/violence prevention partnerships (Ariel et al., 2013). Such data may be able to help identify unknown patterns of violence and, from this, contribute to solutions to prevent and/or reduce violence.
There are several stages to integrating new data into injury surveillance and latterly into violence prevention. The first stage is asking whether a data source adds potential value for injury surveillance, i.e. does it bring new information over and above that already available? Within that, there is an assessment of data quality in terms of completeness and, for example, the extent that the data sources overlap. The second stage is understanding/scoping whether and, if so, how this data could be applied to violence prevention activities. The final stage is testing the activity in a way that allows for impact to be assessed empirically, i.e. in a way that provides robust results to inform future strategy. Figure 1 below sets out these stages and shows where the emphasis for this project lies.
3 Around 45 per cent of violent incidents in police data for Birmingham, Coventry and Wolverhampton are for common assault. (Source: authors’ own analysis of WMP data.)
RAND Europe
8
Figure 1: Research study focus
In May 2016, WMAS and WMP provided three years of data (covering 1 January 2012 to 31 December 2015) to RAND Europe, related to all violence-related calls for service in Birmingham, Coventry and Wolverhampton. WMP also provided an ED dataset covering the same period. Analysis of these three datasets forms the core of this report.
As part of the project, RAND Europe provided outputs from the WMAS dataset to police analysts and WMVPA partners over a six-month period to explore its utility as a source of intelligence in violence reduction or prevention activities in the West Midlands. These efforts were then assessed in spring 2017, with a view to developing guidance for other police forces and CSPs that may wish to utilise ambulance data in their violence prevention efforts.
The study was reviewed by the RAND Europe ethics advisory board and approved by the University of Cambridge Institute of Criminology ethics review process.
2.5. The potential value of ambulance data for violence prevention
As has been noted relating to the use of ED data, sharing data on its own has no impact on violence (Giacomantonio et al. 2014). Rather, using the data as a form of intelligence, especially in conjunction with other intelligence sources (such as, but not limited to, police data), can help direct police resources. Possible uses of ambulance data for violence prevention have been discussed in the academic literature (e.g. Weinborn et al. 2015; Giacomantonio et al. 2014). This research suggests that ambulance data can serve similar purposes to ED data. First, it may provide confirmation of other data sources to enhance the evidence base around violence problems ‘already known’ to police. Second, it may identify discrepancies between datasets to identify unknown patterns of violence. Discrepancies might include different locations, or different details about violence in similar locations (i.e. different times of day, gender/age
Using Ambulance Data for Violence Prevention
9
characteristics of victims, severity of violence). The analyses that appear appropriate are very similar to those for ED data, for example:
Geospatial analyses (e.g. hotspots and heatmaps)
Time-of-day and time-of-year analyses to identify trends
Analyses around gender and age of victims of different types of violence, and severity of injuries from those (especially previously unknown) cases of violence
Examining overlap with police data as a proxy for ‘unknown’ violence in an area.
Ambulance data can identify locations, times and potentially population subgroups or communities that may be affected by violence. As with ED data, ambulance data can act as a form of soft intelligence that then requires police or other community safety partners to ‘take a look’ at the area, time or population where problems are identified. For example, even where the dataset identifies a ‘hot’ location/premises (e.g. a postcode with many assaults recorded at the address), police cannot necessarily assume that a given premises is to blame. Other nearby premises or local factors may be contributing to the violence at that location as well, so on-the-ground investigation is generally required to confirm inferences made from
these data sources.4
This project was designed to help stakeholders involved in violence prevention determine whether the effort involved in establishing and maintaining an ambulance data sharing partnership is justified by its possible benefits, and we expect these findings to help inform violence prevention partnerships on a national level.
Through this project we have explored the potential benefits that the ambulance data offers. First, ambulance call-out location data is very precise, with eastings and northings included for each call for service. Second, the volume of call-outs that ambulance services typically deal with (around 6,000 per year) means it can offer large-scale data that is not typically included in ED datasets. Third, unlike Cardiff Model data, ambulance data is already available and does not require substantial additional work for datasets to be created and shared. However, the use of ambulance data could also be a net resource drain for stakeholders or have no appreciable impact on violence prevention activities.
In terms of specific types of violence, ambulance data may be able to, for example, identify unknown cases of youth or gang-related violence where injury severity is low (thus not warranting subsequent attendance at an ED), but where similar incidents are geographically concentrated, perhaps indicating an ongoing rivalry or contested territory. In turn, the expansion of the use of ambulance data could be relevant for the Ending Gang and Youth Violence (EGYV) agenda, along with broader benefits in violence reduction, aligning with the approach of the new WMVPA. However, it is important to emphasise that ambulance data (and ED data) is used for the purpose of preventing violence and monitoring its occurrence, rather
4 As ambulance data has, to date, rarely been used in policing and violence prevention initiatives, users of the data should also remain open to the possibility that there are a range of analytic possibilities that have not yet been tested. Further analysis may include additional aggregate/quantitative analyses, in conjunction with police and other data (such as demographic profiles of a neighbourhood), as well as potential qualitative readings of the data to identify specific violence problems or their solution.
RAND Europe
10
than detecting or prosecuting past crimes. As such, they are a form of intelligence for preventative effort and strategic planning.
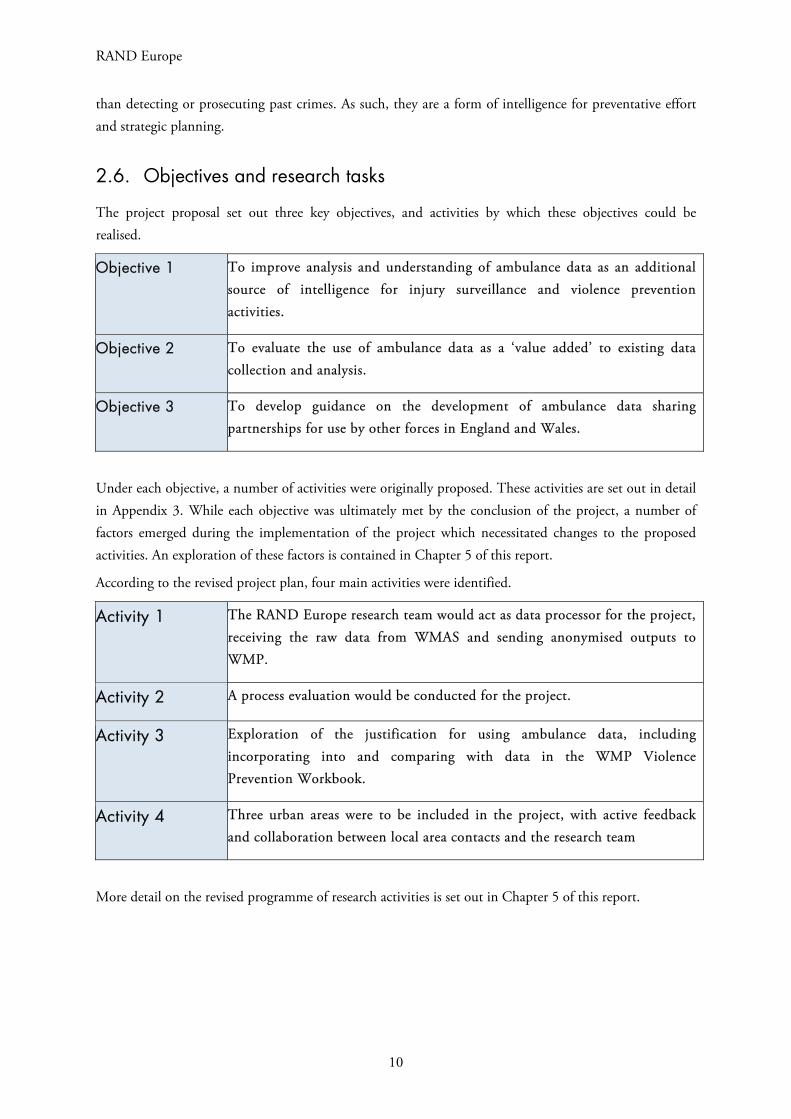
2.6. Objectives and research tasks
The project proposal set out three key objectives, and activities by which these objectives could be realised.
Objective 1 To improve analysis and understanding of ambulance data as an additional source of intelligence for injury surveillance and violence prevention activities.
Objective 2 To evaluate the use of ambulance data as a ‘value added’ to existing data collection and analysis.
Objective 3 To develop guidance on the development of ambulance data sharing partnerships for use by other forces in England and Wales.
Under each objective, a number of activities were originally proposed. These activities are set out in detail in Appendix 3. While each objective was ultimately met by the conclusion of the project, a number of factors emerged during the implementation of the project which necessitated changes to the proposed activities. An exploration of these factors is contained in Chapter 5 of this report.
According to the revised project plan, four main activities were identified.
Activity 1 The RAND Europe research team would act as data processor for the project, receiving the raw data from WMAS and sending anonymised outputs to WMP.
Activity 2 A process evaluation would be conducted for the project.
Activity 3 Exploration of the justification for using ambulance data, including incorporating into and comparing with data in the WMP Violence Prevention Workbook.
Activity 4 Three urban areas were to be included in the project, with active feedback and collaboration between local area contacts and the research team
More detail on the revised programme of research activities is set out in Chapter 5 of this report.

Using Ambulance Data for Violence Prevention
11
2.7. Report structure
We start by setting out the requirements for accessing ambulance data (Chapter 3), then describing the datasets used (Chapter 4). We report basic comparisons between the police and ambulance datasets as the main sources of data and provide results from the overlap analysis between the ambulance and police data, as one of the core tasks (Chapter 6). The process evaluation focuses on feedback from discussions with WMP analysts and police officers about the potential or actual uses for ambulance data (Chapter 5).

RAND Europe
12
3. Requirements for accessing ambulance data
This chapter explores the starting points for incorporating ambulance data into injury surveillance and violence prevention systems, chief among which are: (i) building trust and relationships between key stakeholders, (ii) agreeing a purpose to and scope of the project and (iii) data sharing. Data sharing on its own will not result in less violence (Giacomantonio et al. 2014), but the additional information may have utility in informing police and potentially other ‘blue light’ or emergency services.
3.1. Prerequisites for access and implementation
A clear rationale for why sharing ambulance data might be beneficial: This means benefits to the community, police and ambulance service. In short, what does each group get out of the arrangement? The benefits to each group might also be over different timescales and relate to different outcomes. For example, reduced ambulance call-outs arising from police preventative work is an immediate benefit to an ambulance service, but to get to that requires a chain of decisions and actions involving both police and ambulance service.
Cooperation, buy-in and trust from ambulance service: Without the ambulance service there is no data to share. The route for securing cooperation and buy-in must be at a senior level – meaning that both the police and ambulance service must be willing to engage at a senior level.
Agreement from all stakeholders about the data sharing process, formalised in an information sharing agreement (ISA): Initial discussions should afford clarity about what data is required and why. Linked to a clear rationale is an understanding about what data might be available, what can be requested and in what format. Other questions include the degree of and responsibility for the anonymization of the data, the actors who receive it and the monitoring of the use of this data solely for preventing violent crime.
Clear pathway for ambulance data to be used by analysts in routine work: The receiving police force or CSP must have personnel and information technology resources in place to ensure that the data can be incorporated into police intelligence and strategic processes. An element of this pathway is the presence of champions and leadership to promote the use of the data and keep it prominently in the force’s agenda.
3.1.1. Building trust and relationships
ED data has been shared across England and Wales within violence prevention partnerships for over 20 years without a recorded complaint to date about patient confidentiality or data misuse. This has been possible through a conscientiously managed partnership approach that is replicable in the ambulance data context. As with using ED data, building relationships and trust between police and the ambulance service
Using Ambulance Data for Violence Prevention
13
is a fundamental part of working towards data sharing. Previous research has suggested that this may be achieved by making clear to all stakeholders the benefits of data sharing and fostering collaboration beyond the data share, for example through the involvement of health workers in CSPs, (Jacobson and Broadhurst 2009) or by placing police liaison officers in EDs (Shepherd & Lisles 1998). Regular meetings and training sessions, and using local champions, may also raise awareness of the project to relevant actors and encourage a partnership approach (Davison et al. 2010). For the Trauma and Injury Intelligence Group (TIIG) project established in the Wirral local authority area, regular contact between the police, health and community safety officers involved was maintained, including through bimonthly meetings to discuss the project and potential interventions using the shared data. Furthermore, project tasks were shared across the team: ED receptionists were trained by TIIG officers on completing data collection forms, an ED quality officer examined the data quality, and a TIIG officer cleaned and analysed the data. Data sharing protocols assisted parties to understand how the data was to be managed and shared (Quigg et al. 2011).
3.1.2. Agreeing a purpose
Police and ambulance services have very different ‘missions’, so it is necessary to build an understanding of why the data sharing is required and to what end. Such a shared understanding is also necessary to ensure that the extent and detail of the data share is proportionate (i.e. that enough detail is shared to fulfil a given purpose, but no more). There is an extent of risk management in relation to data sharing and the level of detail being requested that organisations need to engage with and flesh out, as there may not be perfect alignment between organisations.
3.1.3. Data sharing
ED data is normally anonymised before it is shared with police forces, and in this project a similar level of anonymization was utilised. Nonetheless, it is recognised that the details included in the ED dataset could in some cases be converted into personal information in conjunction with data already held by police. However, as noted by the Information Commissioner’s Office,5 this should not be on its own a barrier to the appropriate sharing of personal information, so long as precautions are in place. The precautions would traditionally include an ISA that precludes use of the data outside of project scope and regular oversight by the relevant Caldicott Guardian (a senior person within each NHS organisation responsible for ensuring appropriate information sharing).
During the first year of the project, the primary obstacle was agreeing upon a satisfactory approach to data sharing between WMAS, WMP and RAND Europe that would allow the project to proceed. Underpinning these discussions was a concern around sharing patient-identifiable data with the police, as this could be used to inform criminal investigations or to pursue arrests/charges. As explored further in section 5.1.3, the use of patient-identifiable data is governed by the Caldicott Principles, and must be approved by a Caldicott Guardian.6
5 Communication reference 0288158, in Appendix 7. 6 The Caldicott Principles are set out in Appendix 5.
RAND Europe
14
We sought input from the WMAS Caldicott Guardian and the head of information governance, and were guided by an ISA that specified how and by whom data could be shared, accessed and analysed, and to what end. The research team emphasised that the data was only to be used for future prevention initiatives (as with the current use of ED data), rather than to detect or prosecute past incidents of violence. While the data was originally intended to be shared directly by WMAS to WMP analysts who would then clean and process the data, it was agreed that the RAND Europe research team would act as processor of potentially patient-identifiable data to create anonymised/aggregated outputs for use by WMP and
WMVPA. Furthermore, the final outputs were datasets aggregated to neighbourhood level,7 with low counts (below three) omitted. Following approximately ten months of discussions between WMAS, WMP and RAND Europe, a data sharing agreement was established between WMAS and RAND Europe in April 2016. The data that was subsequently shared under this agreement is described in Chapter 4 and analysed in Chapter 6.
7 Lower Layer Super Output Areas (LSOAs).
Using Ambulance Data for Violence Prevention
15
4. Understanding the datasets
In this chapter, we describe the CAD data, discuss how it differs from ED and police data, and consider some of the main issues with its interpretation.
4.1. Data sources
The analysis presented below was completed using three datasets: recorded crime from the police, ambulance dispatch data and ED data. All three datasets only included incidents involving interpersonal violence (i.e. ambulance call-outs for non-violent incidents as well as other police records were excluded from the data).
The computer-aided dispatch (CAD) dataset, produced automatically at each ambulance call-out, and the Patient Report Form (PRF) dataset, which is recorded on paper by paramedics on the scene of an incident and then read by text recognition software, were both made available by WMAS. The dataset on offences recorded by the police and the ED data were made available by the WMP.
The data for police recorded crime and CAD data cover 2012–2017 in Birmingham, Coventry and Wolverhampton. ED data was from September 2013 to March 2016. In what follows, we briefly describe each dataset in turn, with more detail on the PRF given in Appendix 1.8
WMAS CAD dataset
The CAD dataset allocates each incident to a specific time and postcode. Given that each postcode covers approximately 15 addresses, the referencing is broadly at the same level of precision as geospatial coordinates, but the actual geospatial area covered by a postcode varies by the density of housing in a given location (see Figure 4 for an example of postcode density in the Wolverhampton city centre).9 All reported cases are classified as assault (domestic as well as public), stabbing or shooting, and distributed by severity. Unfortunately, classification of severity has changed over time and its comparison
8 The PRF data were for a narrower time frame because they were resource intensive to produce at the time. As such, that data source was not used in the analyses presented. 9 The raw CAD data contains the coordinate data, but that was not shared as part of this project.
RAND Europe
16
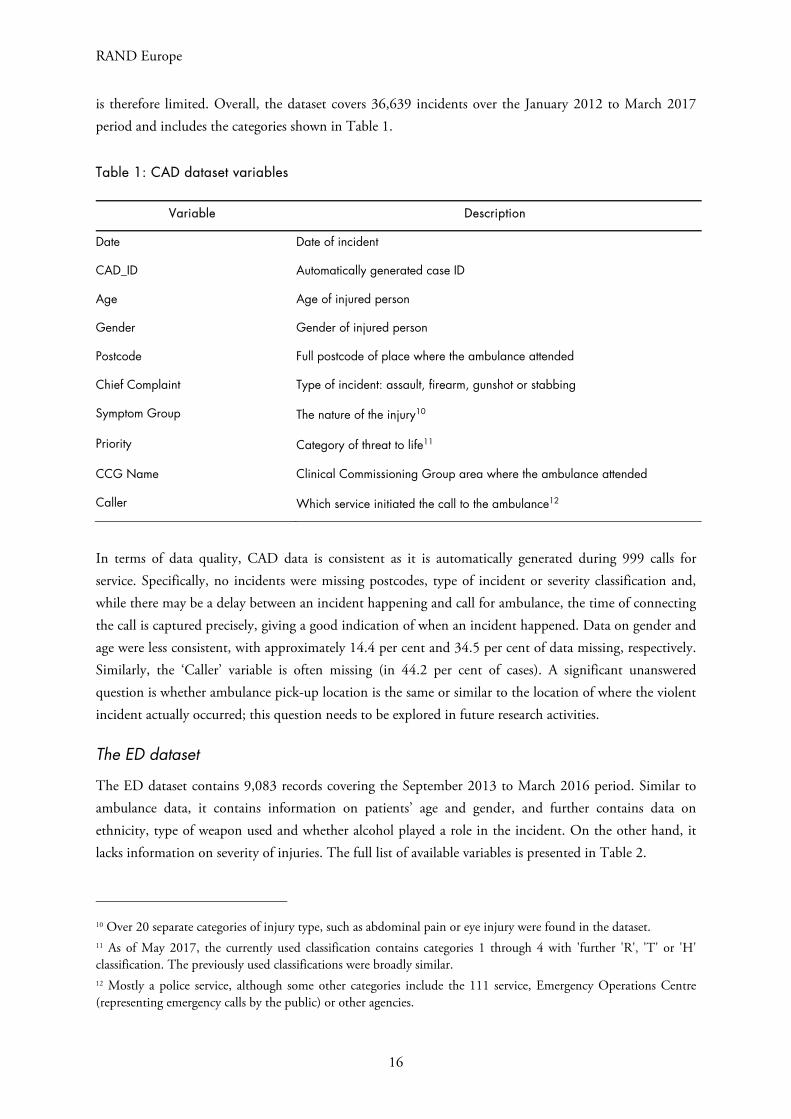
is therefore limited. Overall, the dataset covers 36,639 incidents over the January 2012 to March 2017 period and includes the categories shown in Table 1.
Table 1: CAD dataset variables
Variable Description
Date Date of incident
CAD_ID Automatically generated case ID
Age Age of injured person
Gender Gender of injured person
Postcode Full postcode of place where the ambulance attended
Chief Complaint Type of incident: assault, firearm, gunshot or stabbing
Symptom Group The nature of the injury10
Priority Category of threat to life11
CCG Name Clinical Commissioning Group area where the ambulance attended
Caller Which service initiated the call to the ambulance12
In terms of data quality, CAD data is consistent as it is automatically generated during 999 calls for service. Specifically, no incidents were missing postcodes, type of incident or severity classification and, while there may be a delay between an incident happening and call for ambulance, the time of connecting the call is captured precisely, giving a good indication of when an incident happened. Data on gender and age were less consistent, with approximately 14.4 per cent and 34.5 per cent of data missing, respectively. Similarly, the ‘Caller’ variable is often missing (in 44.2 per cent of cases). A significant unanswered question is whether ambulance pick-up location is the same or similar to the location of where the violent incident actually occurred; this question needs to be explored in future research activities.
The ED dataset
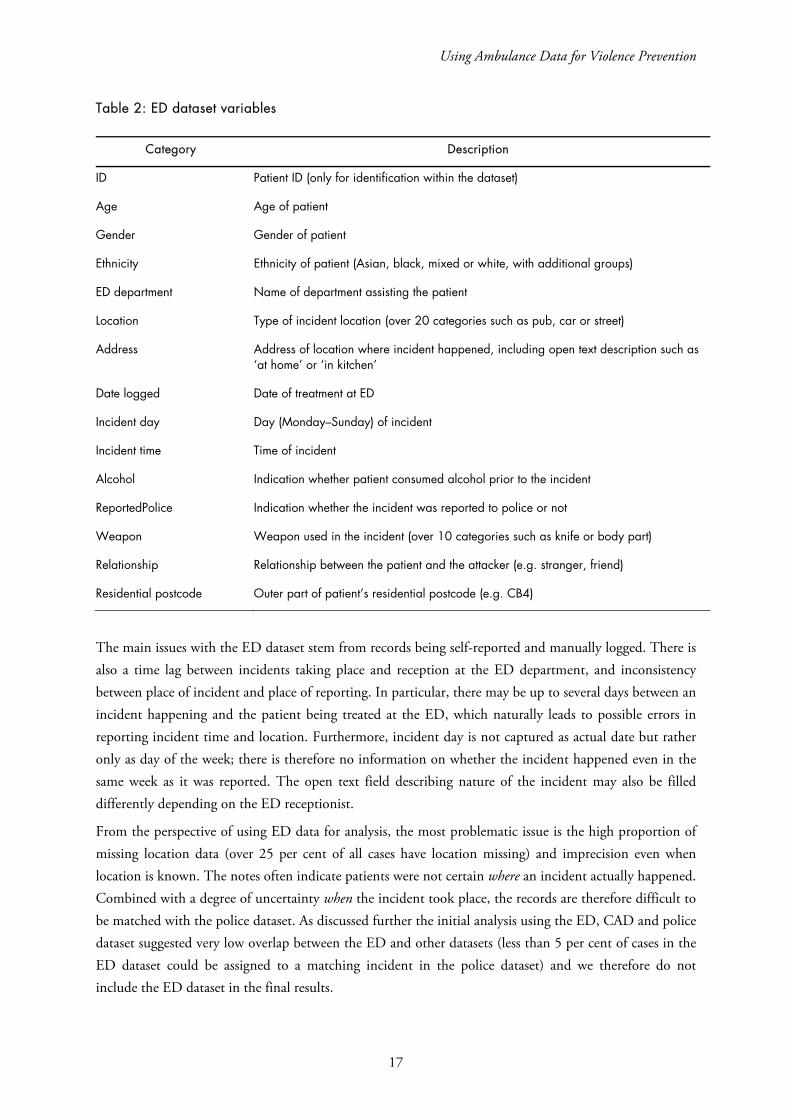
The ED dataset contains 9,083 records covering the September 2013 to March 2016 period. Similar to ambulance data, it contains information on patients’ age and gender, and further contains data on ethnicity, type of weapon used and whether alcohol played a role in the incident. On the other hand, it lacks information on severity of injuries. The full list of available variables is presented in Table 2.
10 Over 20 separate categories of injury type, such as abdominal pain or eye injury were found in the dataset. 11 As of May 2017, the currently used classification contains categories 1 through 4 with 'further 'R'‚ 'T' or 'H' classification. The previously used classifications were broadly similar. 12 Mostly a police service, although some other categories include the 111 service, Emergency Operations Centre (representing emergency calls by the public) or other agencies.
Using Ambulance Data for Violence Prevention
17
Table 2: ED dataset variables
Category Description
ID Patient ID (only for identification within the dataset)
Age Age of patient
Gender Gender of patient
Ethnicity Ethnicity of patient (Asian, black, mixed or white, with additional groups)
ED department Name of department assisting the patient
Location Type of incident location (over 20 categories such as pub, car or street)
Address Address of location where incident happened, including open text description such as ‘at home’ or ‘in kitchen’
Date logged Date of treatment at ED
Incident day Day (Monday–Sunday) of incident
Incident time Time of incident
Alcohol Indication whether patient consumed alcohol prior to the incident
ReportedPolice Indication whether the incident was reported to police or not
Weapon Weapon used in the incident (over 10 categories such as knife or body part)
Relationship Relationship between the patient and the attacker (e.g. stranger, friend)
Residential postcode Outer part of patient’s residential postcode (e.g. CB4)
The main issues with the ED dataset stem from records being self-reported and manually logged. There is also a time lag between incidents taking place and reception at the ED department, and inconsistency between place of incident and place of reporting. In particular, there may be up to several days between an incident happening and the patient being treated at the ED, which naturally leads to possible errors in reporting incident time and location. Furthermore, incident day is not captured as actual date but rather only as day of the week; there is therefore no information on whether the incident happened even in the same week as it was reported. The open text field describing nature of the incident may also be filled differently depending on the ED receptionist.
From the perspective of using ED data for analysis, the most problematic issue is the high proportion of missing location data (over 25 per cent of all cases have location missing) and imprecision even when location is known. The notes often indicate patients were not certain where an incident actually happened. Combined with a degree of uncertainty when the incident took place, the records are therefore difficult to be matched with the police dataset. As discussed further the initial analysis using the ED, CAD and police dataset suggested very low overlap between the ED and other datasets (less than 5 per cent of cases in the ED dataset could be assigned to a matching incident in the police dataset) and we therefore do not include the ED dataset in the final results.
18
RAND Europe
Police recorded crime dataset
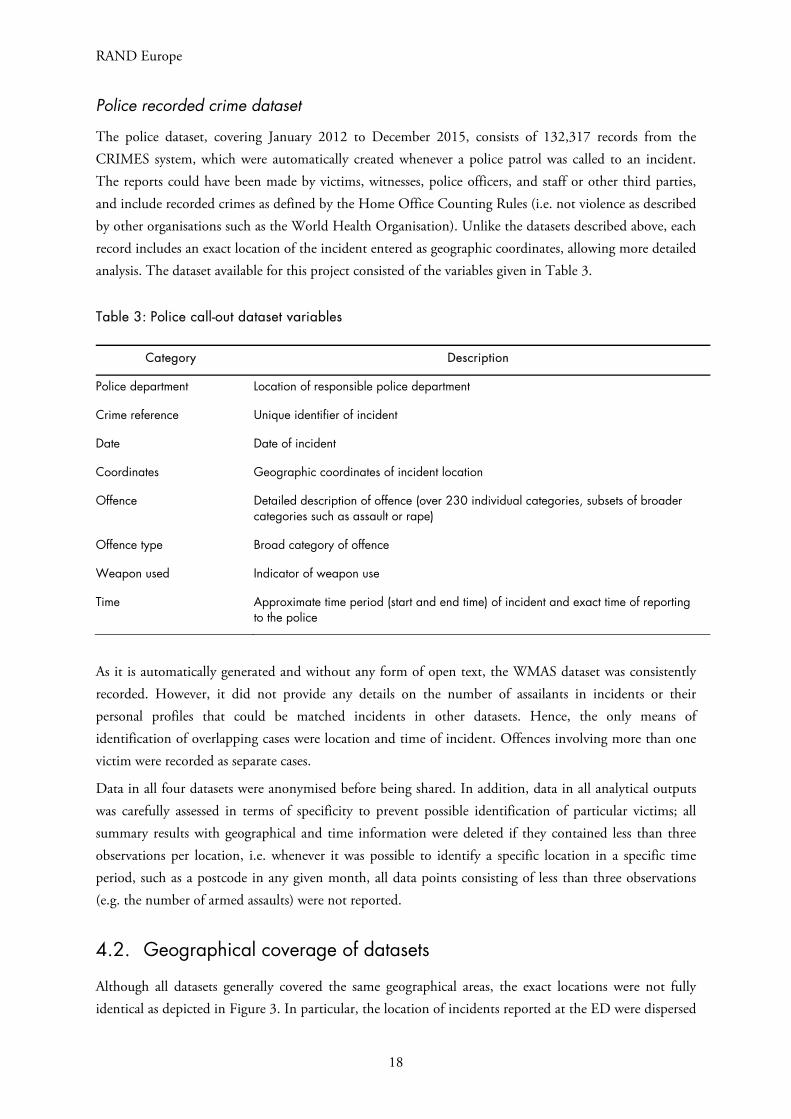
The police dataset, covering January 2012 to December 2015, consists of 132,317 records from the CRIMES system, which were automatically created whenever a police patrol was called to an incident. The reports could have been made by victims, witnesses, police officers, and staff or other third parties, and include recorded crimes as defined by the Home Office Counting Rules (i.e. not violence as described by other organisations such as the World Health Organisation). Unlike the datasets described above, each record includes an exact location of the incident entered as geographic coordinates, allowing more detailed analysis. The dataset available for this project consisted of the variables given in Table 3.
Table 3: Police call-out dataset variables
Category Description
Police department Location of responsible police department
Crime reference Unique identifier of incident
Date Date of incident
Coordinates Geographic coordinates of incident location
Offence Detailed description of offence (over 230 individual categories, subsets of broader categories such as assault or rape)
Offence type Broad category of offence
Weapon used Indicator of weapon use
Time Approximate time period (start and end time) of incident and exact time of reporting to the police
As it is automatically generated and without any form of open text, the WMAS dataset was consistently recorded. However, it did not provide any details on the number of assailants in incidents or their personal profiles that could be matched incidents in other datasets. Hence, the only means of identification of overlapping cases were location and time of incident. Offences involving more than one victim were recorded as separate cases.
Data in all four datasets were anonymised before being shared. In addition, data in all analytical outputs was carefully assessed in terms of specificity to prevent possible identification of particular victims; all summary results with geographical and time information were deleted if they contained less than three observations per location, i.e. whenever it was possible to identify a specific location in a specific time period, such as a postcode in any given month, all data points consisting of less than three observations (e.g. the number of armed assaults) were not reported.
4.2. Geographical coverage of datasets
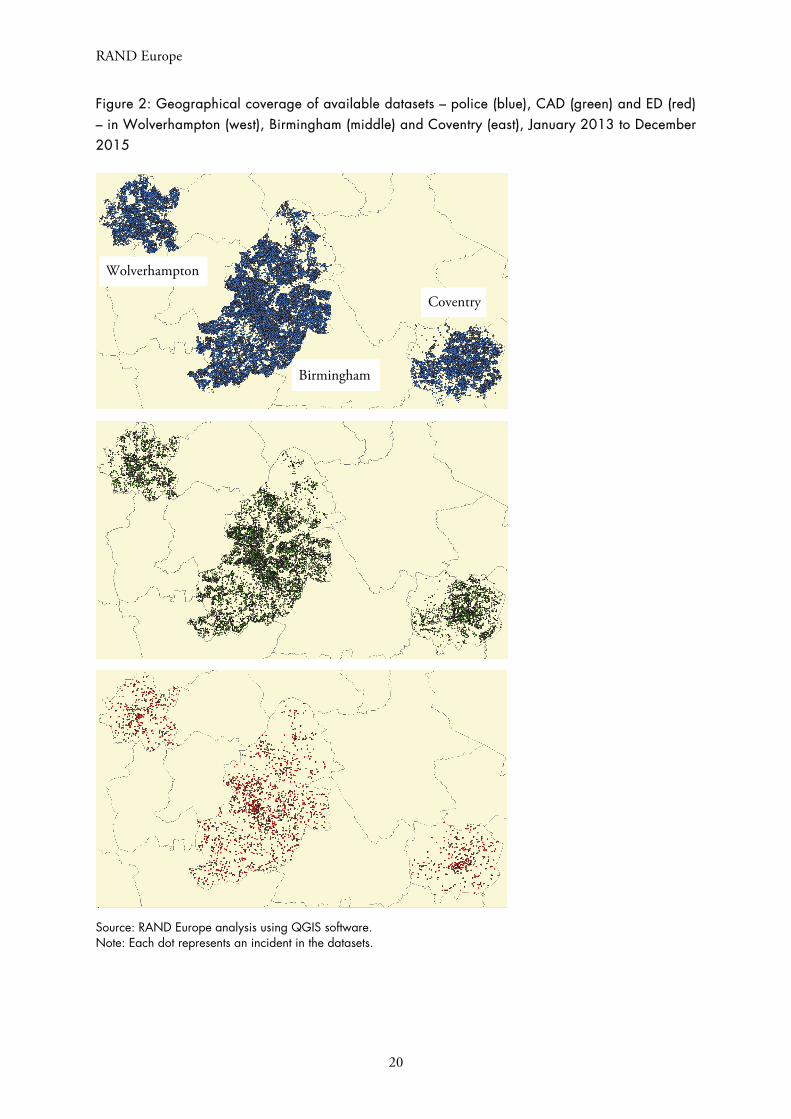
Although all datasets generally covered the same geographical areas, the exact locations were not fully identical as depicted in Figure 3. In particular, the location of incidents reported at the ED were dispersed

Using Ambulance Data for Violence Prevention
19
beyond the city limits (with several cases in different regions), potentially as a result of individuals seeking treatment at their local ED some time after the incident. The incidents shown in Figure 2 have been limited to only those within the city limits in order to be comparable with the other datasets. Figure 2 outlines the differences in volume and geographical distribution of cases between the datasets. In particular, there are more than four times as many incidents recorded in the police dataset than in the CAD dataset – more than 130,000. Ambulance and police data mostly cover the same areas, whereas ED data is far less frequent and more sparsely distributed across the three areas.
RAND Europe
20
Figure 2: Geographical coverage of available datasets – police (blue), CAD (green) and ED (red) – in Wolverhampton (west), Birmingham (middle) and Coventry (east), January 2013 to December2015
Source: RAND Europe analysis using QGIS software. Note: Each dot represents an incident in the datasets.
Birmingham
Coventry
Wolverhampton
Using Ambulance Data for Violence Prevention
21
4.3. Data processing
As a first step in the analysis, the available data was cleaned and recoded. The PRF dataset was not processed given the problems described in Appendix 1. Additionally, adjustments made to the ED
dataset13 are not described here as they were mostly consistent with those made to the CAD dataset, and the ED dataset subsequently showed to contain little added value in the analysis, particularly due to geographical dispersion and inconsistency in when incidents occurred in the data.
The main data processing tasks consisted of the following:
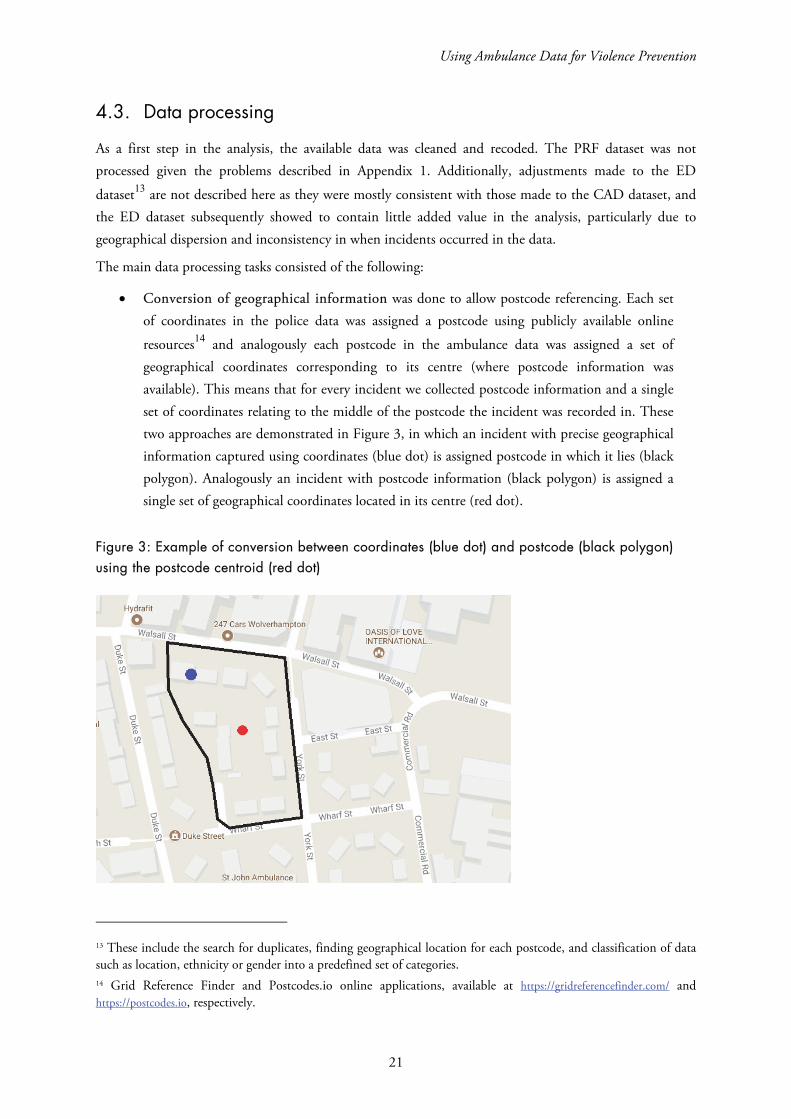
Conversion of geographical information was done to allow postcode referencing. Each set of coordinates in the police data was assigned a postcode using publicly available online
resources14 and analogously each postcode in the ambulance data was assigned a set of geographical coordinates corresponding to its centre (where postcode information was available). This means that for every incident we collected postcode information and a single set of coordinates relating to the middle of the postcode the incident was recorded in. These two approaches are demonstrated in Figure 3, in which an incident with precise geographical information captured using coordinates (blue dot) is assigned postcode in which it lies (black polygon). Analogously an incident with postcode information (black polygon) is assigned a single set of geographical coordinates located in its centre (red dot).
Figure 3: Example of conversion between coordinates (blue dot) and postcode (black polygon) using the postcode centroid (red dot)
13 These include the search for duplicates, finding geographical location for each postcode, and classification of data such as location, ethnicity or gender into a predefined set of categories. 14 Grid Reference Finder and Postcodes.io online applications, available at https://gridreferencefinder.com/ and https://postcodes.io, respectively.
RAND Europe
22
Classification of time into 1- to 4-hour categories, i.e. essentially reclassification of the time variable from continuous (hours and minutes) into categorical (hours or longer time periods) in order to simplify later analyses.
Location filtering so that all remaining data points would be within the city limits. For postcodes, this was done using the outer parts of the postcode; any postcode not starting with ‘B’, ‘CV’ or ‘WV’ (standing for Birmingham, Coventry and Wolverhampton, respectively) was excluded from the analysis. For coordinates, this was done either after matching each
coordinate with a postcode in the same way, or manually using the QGIS software15 by deleting all data points visibly outside of the city boundaries. Additional analysis of overlap was then performed excluding postcodes starting with the correct letter but followed by high numbers (e.g. CV21+).
Classification of variables into consistent categories. This involved particularly
categorisation of offences in the police dataset into a more limited number of categories.16
Removal of missing data and duplicates where necessary. Since the police and ambulance CAD datasets were consistent, only a very few cases with missing/clearly wrong date or location were excluded (less than 0.1 per cent of data).
Subsequently, the police and CAD datasets were combined with coordinates, postcode, date, and time of incident available for all remaining observations, while dataset-specific variables such as type of offence or gender being available only in the respective parts. The combined dataset spanned the period of January 2012 to December 2015 – the largest timeframe available in both individual datasets. All data processing and analysis was done in Stata 13 and Microsoft Excel.
4.4. Analysis steps
Analyses were undertaken in three steps: geographical analysis, analysis of frequencies and analysis of overlap. The geographical analysis consisted principally of data visualisation using the QGIS software. Analysis of frequencies then looked separately at the three sites as well as individual postcodes or their groups and showed the number of incidents across the following dimensions: time (day of week, time of day, month and year), location, type of offence, type of weapon used, severity of injuries and characteristics of the injured individuals. The number of incidents per location were then used in identification of so-called ‘hot postcodes’ reported in the CAD dataset than in the police dataset within
the same time period.17 These hot postcodes indicated that, regardless of overlap between the two datasets, some of the incidents were not reported to the police.
15 See QGIS (2017). 16 The original 231 categories (including categories such as abduction of child by other person) were recategorised into 79 broader categories such as assault, attempted rape, attempted robbery, etc. 17 I.e. counting two and more patients treated in relation to one incidents as a single case.
Using Ambulance Data for Violence Prevention
23
The analysis of overlap was done in two ways: using postcode referencing and spatial nets (‘as the crow
flies’ distance matching).18 The matching variables consisted of time, location and number of observations, but differed across iterations of the analysis:
Time matching: Incidents that happened within the same 1-, 2- or 3-hour periods were considered ‘matched’. We also tested longer time periods – up to 24 hours either side of the incident – but these did not yield improved results and lead to increased probability of matching unrelated incidents. Additionally, we looked for incidents that happened at the same time but on the previous or next day (if not matched on the same day). This is because an incident in one dataset on Monday at 11.59 p.m., might appear in another as 12.01 a.m. on Tuesday.
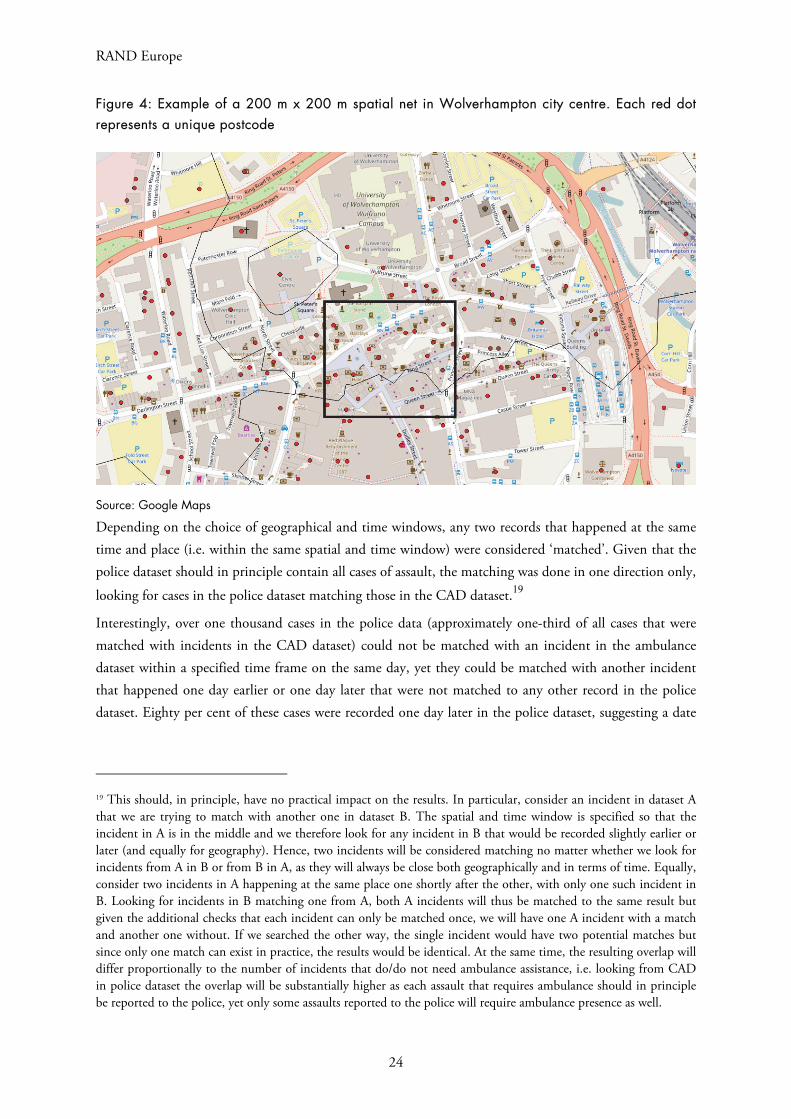
Distance matching: Incidents within the same postcode or within 30 m x 30 m, 100 m x 100 m, and 200 m x 200 m spatial nets were considered matched. Note that the 200 m x 200 m areas are relatively large and may cover multiple postcodes particularly in densely populated areas. This is depicted in Figure 4, which shows an example of a 200 m x 200 m area in the Wolverhampton city centre. We can see that this particular cell in the spatial net covers 19 individual postcodes.
Number of observations: In both the police and CAD datasets, each incident was recorded separately. In some cases there was more than one incident per specified timeframe and area within a dataset, each of these was assigned a unique identifier so that if there were more matching cases in one dataset than in the other one, only the correct proportion would be matched. In other words, for an incident A from the CAD dataset we may find two matching incidents in the police dataset. Hence, one is considered matching and the other one is not. Now if incident B in the CAD dataset happened nearly at the same time and place as A, only the unmatched incident in the police dataset would be considered appropriate.
18 Both analyses were done in Stata 13 using the ‘merge 1:1’ command, which looks for matching pairs of data in two specified datasets and records whether any data point in either of the two datasets was matched or not.
RAND Europe
24
Figure 4: Example of a 200 m x 200 m spatial net in Wolverhampton city centre. Each red dot represents a unique postcode
Source: Google Maps
Depending on the choice of geographical and time windows, any two records that happened at the same time and place (i.e. within the same spatial and time window) were considered ‘matched’. Given that the police dataset should in principle contain all cases of assault, the matching was done in one direction only,
looking for cases in the police dataset matching those in the CAD dataset.19
Interestingly, over one thousand cases in the police data (approximately one-third of all cases that were matched with incidents in the CAD dataset) could not be matched with an incident in the ambulance dataset within a specified time frame on the same day, yet they could be matched with another incident that happened one day earlier or one day later that were not matched to any other record in the police dataset. Eighty per cent of these cases were recorded one day later in the police dataset, suggesting a date
19 This should, in principle, have no practical impact on the results. In particular, consider an incident in dataset A that we are trying to match with another one in dataset B. The spatial and time window is specified so that the incident in A is in the middle and we therefore look for any incident in B that would be recorded slightly earlier or later (and equally for geography). Hence, two incidents will be considered matching no matter whether we look for incidents from A in B or from B in A, as they will always be close both geographically and in terms of time. Equally, consider two incidents in A happening at the same place one shortly after the other, with only one such incident in B. Looking for incidents in B matching one from A, both A incidents will thus be matched to the same result but given the additional checks that each incident can only be matched once, we will have one A incident with a match and another one without. If we searched the other way, the single incident would have two potential matches but since only one match can exist in practice, the results would be identical. At the same time, the resulting overlap will differ proportionally to the number of incidents that do/do not need ambulance assistance, i.e. looking from CAD in police dataset the overlap will be substantially higher as each assault that requires ambulance should in principle be reported to the police, yet only some assaults reported to the police will require ambulance presence as well.
Using Ambulance Data for Violence Prevention
25
reporting error in either the police or CAD data. We recommend that some more detailed work is done by the police and ambulance service to check overlap on a sample of cases individually.
4.4.1. Methodological and technical issues with using CAD and police datasets
Given the presented data limitations, the main methodological issues using the CAD and police datasets consisted of (i) assigning postcodes to grid references and (ii) specifying matching terms. Specifically, the Grid Reference Finder online tool offers a batch conversion method, allowing theoretically unlimited number of postcodes to be transformed into geographical coordinates. In practice, this is limited to several hundreds of postcodes per attempt due to technical limitations, yet a reversed batch conversion tool exists
only in API format20 and therefore requires programming techniques to connect automatically to the server and request postcode information for a prepared set of locations. This was done in Excel VBA but the technical requirement for this task might be a barrier for police analysts. (That could be overcome if coordinate data is provided for ambulance incidents.)
Specifying matching terms was then a methodological rather than technical issue as there is no single correct answer as to how the area or time should be specified. There is a trade-off between matching success rate and reliability of matches. Increasing the geographical and/or time frame around incidents for matching will lead to additional cases in the matching dataset being considered and therefore a greater chance of matching but there is an increased risk of matching two unrelated incidents. This risk of incorrect matching is higher in areas with higher crime rates, because multiple unrelated incidents could happen within a short time period of each other.
We return to the issue of overlap in the results section below (6.4). In the next chapter, we present findings from the process evaluation component of the project.
20 See Bulk Reverse Geocoding, Postcodes (2017).
RAND Europe
26
5. Process evaluation results
5.1. Process evaluation objectives and questions
As the project was intended as a ‘proof of concept’ rather than a fuller impact evaluation, some of the most important knowledge that this project was intended to capture relates to the process of establishing data sharing arrangements, analysing the data and considering potential uses of the data to support preventive interventions. A process evaluation seeks to generate learning from a project by assessing factors such as the delivery of the programme and the quality and fidelity of its implementation, and identify contextual factors such as personnel, structures and procedures. (Moore et al. 2015)
For this evaluation, the research team sought to answer four key questions:
Who was the project intended to reach?
How well was the project implemented?
What were the main barriers to success and how might these be addressed?
Is the approach attractive to stakeholders?
To answer these questions, the research team sought regular feedback from stakeholders involved in the project. In the initial stages of implementation, a member of the research team scheduled monthly calls with all police analysts who received the data outputs. These interviews followed a protocol and focused on the questions including:
How, if at all, has ambulance data been used in the local area (since we last spoke/since you started receiving it)?
If it has been used, what kinds of analyses have been conducted? Why and by whom?
Have there been any notable impacts from its use?
Are there any expectations/plans that it will be used (again) in future operational planning?
What kinds of barriers or issues have you faced in trying to use the data?
What uses might be made of the data if some of the barriers or issues were addressed?21
In addition to these telephone interviews, the research team engaged regularly with WMP project leads and senior analysts via telephone or email, and site visits to WMP headquarters at the start of the project,
21 The interview protocol is set out in Appendix 6.
Using Ambulance Data for Violence Prevention
27
the mid-way point of the project as the implementation stage was shortly to commence, and at the close of the project. These discussions focused on the same questions posed to the data recipients, but also covered more strategic issues around the restructuring that WMP was undergoing over the same period as the project implementation, as well as the potential for incorporating ambulance data in police intelligence and analysis practices in the long term.
This section of the report explores the implementation of the project, with reference to its stated objectives, and reports on factors contributing to changes in approach to the project, before presenting the main findings from the process evaluation.
5.1.1. Project objectives
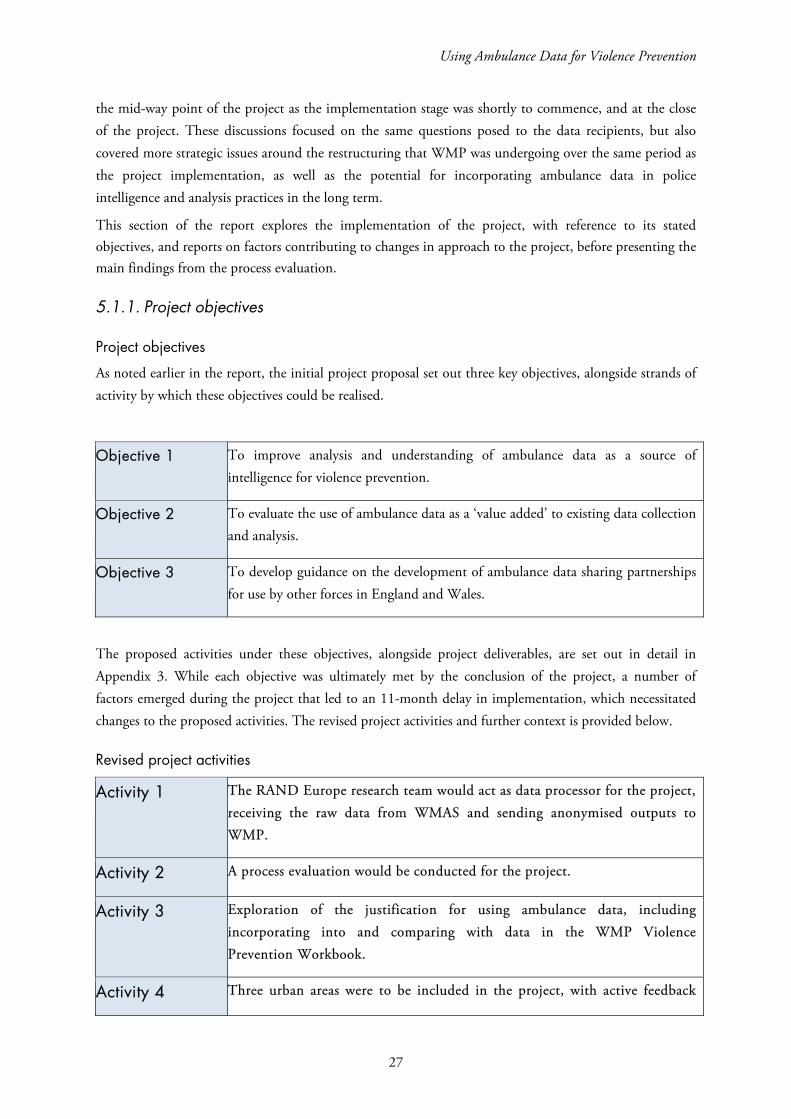
Project objectives
As noted earlier in the report, the initial project proposal set out three key objectives, alongside strands of activity by which these objectives could be realised.
Objective 1 To improve analysis and understanding of ambulance data as a source of intelligence for violence prevention.
Objective 2 To evaluate the use of ambulance data as a ‘value added’ to existing data collection and analysis.
Objective 3 To develop guidance on the development of ambulance data sharing partnerships for use by other forces in England and Wales.
The proposed activities under these objectives, alongside project deliverables, are set out in detail in Appendix 3. While each objective was ultimately met by the conclusion of the project, a number of factors emerged during the project that led to an 11-month delay in implementation, which necessitated changes to the proposed activities. The revised project activities and further context is provided below.
Revised project activities
Activity 1 The RAND Europe research team would act as data processor for the project, receiving the raw data from WMAS and sending anonymised outputs to WMP.
Activity 2 A process evaluation would be conducted for the project.
Activity 3 Exploration of the justification for using ambulance data, including incorporating into and comparing with data in the WMP Violence Prevention Workbook.
Activity 4 Three urban areas were to be included in the project, with active feedback
RAND Europe
28
and collaboration between local area contacts and the research team.
Taking into account the concerns of the WMAS and the Caldicott Guardian around data sharing, as well as the delay in implementing the project, the research team prepared a revised project plan. Firstly, it was agreed that the RAND Europe research team would act as data processor. The research team would be able to see patient-identifiable data from the WMAS dataset, but would only be able to share anonymised outputs from this data (such as hotspot maps and other aggregate analytic products) with WMP. The data was originally intended to be shared directly by WMAS to WMP analysts who would then clean and process the data, but this could not be accommodated based on WMAS’s concerns about sharing patient-identifiable data with the police.
Furthermore, a greater emphasis was placed on process evaluation activities, and impact evaluation activities were removed. Despite the delays in securing data, the project needed to be substantially completed by April 2017 due to Home Office instructions around the use of Police Innovation funding. Based on this timeline, it would not have been possible to do an evaluation of the impact of ambulance data sharing on violence in the West Midlands, since the data would have been in use by police for no more than six months in any location. The project team had initially expected a minimum of a year of data sharing would be required before any impact on violence prevention could reasonably be expected to be measurable.
It was also agreed that additional attention would be paid to the justification for using ambulance data. Before the sharing of WMAS data with WMP (via the RAND Europe research team) began, RAND Europe researchers independently established that there is ‘new’ information in this data not captured by police records that would warrant its use. This was done by examining the datasets from both WMP and WMAS from 2012 to 2015 for ‘overlap’ in terms of the ‘hotspots’ (precise geographic locations where interpersonal violence regularly occurs) identified by each dataset over a three-year period, as well as whether the nature of violence (e.g. the kinds and severity of assaults) in each hotspot was similar where there was overlap. The qualitative information contained in the WMAS data was also reviewed to understand if it reveals patterns not captured in the quantitative categories of the dataset.
Finally, a greater number of local areas was to be examined, however force-wide sharing could not be evaluated. Given WMAS’s concerns, it was considered procedurally more appropriate by WMAS to release ambulance data for specific urban areas (Birmingham, Coventry and Wolverhampton) rather than for the whole of the West Midlands. As such, a force-wide evaluation was not possible. However, where the initial project plan included working directly with just one or two urban areas, three local areas were involved under the revised plan, with more active feedback and collaboration between local area contacts (i.e. champions) and the research team than had been initially intended.
Following receipt of the first dataset of the preceding month’s call-outs for violence-related incidents from WMAS in September 2016, RAND Europe researchers prepared anonymised outputs for the cities of Birmingham, Wolverhampton and Coventry. For the first three months of the data share process, RAND Europe sent these outputs to WMP analysts and CSP teams with responsibility for the relevant areas, along with the lead partners. Coventry did not have a CSP representative in place for the duration of the
Using Ambulance Data for Violence Prevention
29
project, although data for the city was shared with the relevant police analyst and the project’s lead partners in WMP.
5.2. Factors contributing to changing the proposed approach
5.2.1. Contractual delays
The project as proposed assumed that the required data would be shared by WMAS from project inception, in April or May 2015, and the project would subsequently run for 24 months. In fact, the project was kicked off in June 2015 and almost immediately faced further, serious delays in implementation. First, the process of drafting and signing a contract between WMP and RAND Europe was protracted, given the complexity of, and WMP’s unfamiliarity with, a project of this nature (e.g. with PIF funding and an external research contractor). RAND Europe offered to draft a contract, sharing this in October 2015. WMP were then delayed in reviewing the contract for many months (due to a number of reasons such as internal reorganisation, oversight and illness) and the final contract was signed in March 2016.
5.2.2. Barriers to data sharing
As the contracting process was ongoing, it also became apparent that the data needed for the project was substantially different from the kind of data WMAS had been sharing with police to date, or were prepared at that stage to provide. The main concern raised by WMAS regarding the data being requested for this project concerned location data. The data required for this kind of injury surveillance – at a level that could potentially be of use to police to support violence prevention activities – needs to include full location data (i.e. with full postcode or GPS coordinates), but can be otherwise anonymous. However, initially WMAS were only willing to share data at the ‘postcode sector’ level (i.e. first half of the postcode plus one character), which would not have provided enough information for violence prevention interventions because postcode sectors cover many thousands of houses, meaning, for example, that police operations cannot be sufficiently well targeted.
Full location data can be considered ‘patient-identifiable’ data, and WMAS initially did not feel that sharing the data directly with WMP or WMVPA was warranted in this case. RAND Europe provided a note from the Information Commissioner’s Office from 2010 regarding the sharing of potentially person-identifiable ED data with police, and RAND Europe’s security policy, which includes details of site security and data security practices, in the hope that they would resolve the main concerns from WMAS around data sharing. In December 2015, WMAS offered tentative agreement that incident-level data sharing might be possible, providing example data and suggesting that the research team request specific categories, after which we could begin negotiation of a new ISA.
In January 2016, the research team requested from the WMAS the full CAD dataset, selected PRF categories and the dataset that PHE was then receiving from WMAS, to compare in terms of utility surveillance. More detail about the requested WMAS dataset can be found in Appendix 4. At this point, virtually all activities within the project had been delayed by approximately 11 months. However, at this stage, the WMAS Caldicott Guardian indicated that he or she could not see that the data sharing was

RAND Europe
30
justified under the Caldicott Principles,22 putting the project at risk. The use of patient-identifiable data is governed by the Caldicott Principles and must be approved by a Caldicott Guardian, a senior person within each NHS organisation responsible for ensuring appropriate information sharing. In response, the research team prepared a note discussing the potential value of ambulance data for violence prevention, examples of previous, similar sharing under the Cardiff Model of violence prevention and how such sharing can be aligned with the revised Caldicott Principles. The note emphasised that the data, if suitable for use by police, would be used for future prevention initiatives (as with the current use of ED data), rather than to detect or prosecute past incidents of violence. This meant that personal details about patients involved in specific incidents would never be used to pursue arrests or charges. Furthermore, all steps of the project would seek input from the WMAS Caldicott Guardian and the head of information governance and be guided by an ISA that specified how and by whom data could be shared, accessed and analysed, and to what end.
This note, alongside support from WMP and PHE, helped to move the project forward and ultimately secure agreement from WMAS and the Caldicott Guardian, subject to the execution of an ISA. However, RAND Europe and WMP could not progress the ISA until the contract had been signed between the two organisations, so a draft agreement with WMAS was not put forward until March 2016. The agreement was successfully signed in April 2016 with no substantial changes proposed by WMAS. In May 2016, WMAS and WMP both provided three years of their data (2012–2015) to RAND Europe, related to all violence-related calls for service in Birmingham, Coventry and Wolverhampton, and WMP also provided an ED dataset covering the same period.
In August 2016, WMAS sent RAND Europe an additional document stating their continued support for the project and specifically granting permission for RAND Europe to share outputs from WMAS CAD data for analysis with police and public health analysts and champions from the WMP and WMVPA. These outputs would include full postcode data, but only at a minimum incident threshold of three, meaning that no single incidents would be in the output. Furthermore, WMAS agreed to continue to provide monthly updates of the CAD dataset through the life of the project to RAND Europe. At this stage, a revised project plan was drawn up, as set out in 5.1.1.
5.2.3. WMP Organisational Restructuring
A number of police analysts and CSP team members from Birmingham and Wolverhampton participated
in interviews with the RAND Europe research team during the first three months of the data share.23 The interviewees reported that the outputs had utility for the force’s violence prevention work. However, the analysts referred to the centralisation of the community safety partnership team, planned for October 2016, as a key barrier to implementation of the data sharing project. Indeed, for the next three months, none of the interviewees reported using the outputs, citing the prioritisation of managing the restructuring process, and finally their move away from direct responsibility for the relevant geographical areas. In January 2017, the lead partners requested that RAND Europe send the outputs only to them for 22 The Caldicott Principles are set out in Appendix 5. 23 Two police analysts and CSP team members for each city participated in monthly feedback either by telephone or email over the course of the three months.
Using Ambulance Data for Violence Prevention
31
dissemination within the WMVPA; this data share arrangement remained in place until the project’s conclusion in April 2017.
Beyond the involvement of police analysts, these organisational factors also impacted upon stakeholder buy-in and leadership during implementation of the project, which in turn had implications for uptake and impact of the ambulance data outputs by the WMP. According to the original project plan, ambulance data sharing ‘champions’ within WMP were expected to be established within three months from project inception. These champions were to engage in active feedback and collaboration with the research team, which would have especially been beneficial for the development of guidance for practitioners, as a wide range of possible practices could have been examined in more detail. Furthermore, the champions would work to generate buy-in with the WMP by promoting the project internally, supporting colleagues in developing approaches to using the data, and establishing long-term sustainability and resilience in data sharing practices. However, due to uncertainty about police analysts’ positions within the unit, no champions were ever identified, meaning that these potential gains were not realised.
Furthermore, the restructuring also had implications for leadership engagement. Senior police analysts reported that activity within the unit was at unprecedented levels, and were therefore unable to incorporate the project into their workload. Likewise, the project lead from the WMP was managing a variety of competing priorities, which made consistent engagement in the project challenging. The WMP lead was promoted during the course of the project and transferred responsibility for it to another project lead from WMP, who then required time for onboarding. Additionally, the WMVPA was still relatively nascent, having been established only around a year earlier, and internal processes and strategies were still developing. All these factors meant that the engagement of leadership at the different levels necessary to push a project centred around sustained organisational change was inconsistent, which impacted upon the implementation of the project.
5.2.4. Gaps in WMAS data
Following the implementation stage of the project, police analysts discovered that the ambulance call-out data from Birmingham, over the entire period of the project, excluded a significant section of central and west Birmingham. This region is covered by the Clinical Commissioning Group (CCG) for Sandwell and West Birmingham, which was not included in the list of CCGs requested in the initial application from WMAS to the Caldicott Guardian for the authorisation of the data share. The fact that the missing data was not noticed during implementation provides a strong indication that the resource was not utilised, at least in Birmingham, by the police analysts. The missing data also rendered some of the analyses conducted by the research team, such as those integrating the ambulance call-out data with the Violence Prevention Workbook, incomplete or inaccurate. These analyses were subsequently rerun before being included in this this Report.
5.3. Findings from process evaluation
The process evaluation work was dominated by the reorganisation of the WMP analyst teams, which also resulted in fewer analysts overall being employed by WMP. As such, responses from interviewees focus
RAND Europe
32
largely on that issue and how it prevented analysts from using the ambulance data. The clear recommendation arising is that attempting to implement new cross-sectoral collaboration will not be successful if occurring at the same time as large-scale organisational change. This was an unavoidable event for this project, but one that could be mitigated in similar initiatives.
However, there were other themes that emerged that are also relevant to future projects of this nature.
Analysts acknowledged the limitations on the data imposed by the patient-identifiability restrictions. They understood why we needed to prepare the outputs on the level that we have, but said that this meant that the outputs constituted an ‘extra bit of data, not something we will rely on’. Some added that they would not use the outputs for analysis on their own, but to test existing approaches or theories.
In particular, some analysts stressed that the lack of specificity in the data in naming specific premises of interest was a serious issue for police and other enforcement agencies, particularly regarding revocation of licence and licence challenge. Furthermore, one analyst stated that ‘you can image how a barrister or solicitor representing a licenced premises will seek to negate any data if it doesn't specifically point the finger at their named premises’. This feedback indicated that messaging around the use of ambulance data for preventative rather than investigative or prosecutorial purposes was not transmitted effectively to all stakeholders.
One analyst was very enthusiastic about using ambulance data in general and thought it should be ‘incredibly useful’, especially given their priority of preventing violence and with the increasing focus on hotspot priority areas. He also referred to the 2020 strategy that aims to modernise the WMP to make space for crime harm and rely more on data-driven insights. Furthermore, he said that while they had received A&E data in different forms for some time, he thought the ambulance data was ‘five times more useful’.
Another analyst noted that the new strategy for the Safer Wolverhampton Partnership included ‘Violence Prevention’ as one of the three overriding priorities for the partnership through to 2020 (the others being ‘Reducing Reoffending’ and ‘Reducing Victimisation’). First year (2017/18) priorities were to focus on youth violence and gang involvement.
Subsequent to the project’s conclusion, a WMP Partnership Intelligence Liaison Officer sought feedback from the wider team and found consensus that the information from the WMAS PRF would be useful, particularly in relation to the postcode/address of the patient, their mental capacity and capacity to consent.
5.3.1. Implementation
In relation to the first process evaluation question, due to the concurrent reorganizational restructuring, the project simply did not reach its intended targets: the police analysts and CSP teams who received the data outputs and were tasked with utilizing the resource for their geographical area of responsibility in the first instance; and subsequently the police officers who were anticipated to use the analysts’ work with the data to inform their operational strategies. Nevertheless, it was clear through feedback from all stakeholders that using ambulance call-out had significant appeal as an additional source of intelligence, notwithstanding the limitations of the level of detail in the data outputs, where the message around using the data for prevention rather than investigation or prosecution was transmitted effectively.
Using Ambulance Data for Violence Prevention
33
In the case of this project, it is clear that the main barrier to success was the organisational restructuring that took place within the WMP over the implementation period.
However, it is likely that this finding is rather specific to this project; what is more generalisable is the importance of a shared understanding of stakeholders within the relevant police force and ambulance service of the extent and detail of the data sharing required, set out in a formal ISA. Furthermore, given the timeframes involved in creating such an agreement, discussions between the organisations should commence as early as possible. These discussions should explore and find agreement around central questions around the required data fields; the format of the data and the frequency with which it is shared; the degree of and responsible for anonymization of the data; and the processes for sharing it.
Given the issues noted in this chapter, it is apparent that, ultimately, the project was not implemented effectively. However, there are clear indications that in a context of organisational stability and established and efficient information sharing practices, such a project could make a positive contribution to violence prevention efforts. It is important to note that this study did not produce evidence of the effectiveness of ambulance data sharing in these efforts. Furthermore, a limitation resulting from the terms of the data-sharing agreement with WMAS was the level of detail about locations available to police analysts. This precludes the sharing of street locations and the names of particular premises where violent incidents have occurred.
5.3.2. Violence Prevention Workbook
The process evaluation also served a formative role by offering a means to test run the ambulance data within the WMP’s Violence Prevention Workbook on violence-related injuries and helping to develop the categories to be used within that publication. The workbook is produced on behalf of WMVPA by PHE West Midlands and it contains surveillance data and epidemiological summarises on assault-related injuries. It is updated monthly and disseminated to named individuals in the WMP, CSPs, local authority public health departments, Drug & Alcohol Network and other stakeholders with a role in preventing and controlling violence related injuries.
The workbook utilises data submitted by nine participating EDs as part of ISTV guidance, and data from
Hospital Episode Statistics.24 This data is presented at different geographic levels including NHS Trust level, Lower Layer Super Output Areas (LSOA), upper-tier local authorities (LA) and WMP area. The workbook contains the ISTV dataset for the period January to December 2015 and January to March 2016 by hospital, LA and WMP area (counts, crude and directly standardised rates); Hospital Episodes Statistics for in-patient admissions for assault-related injuries for the period April 2014 to March 2015 by LA (counts and crude rates); and Hospital Episodes Statistics for ED attendances for assault-related injuries for the period April 2014 to March 2015 by LA (counts and crude rates).
The research team approached the workbook lead with the idea of incorporating the ambulance data into the workbook, and share the results with them. We sought permission from the WMAS for this activity, who first asked for confirmation that PHE West Midlands was part of the WMVPA. When authorisation
24 For more information, see http://content.digital.nhs.uk/hes

RAND Europe
34
was granted, the research team added summary statistics from the ambulance data to the workbook using the format by which the hospital data was presented. Secondly, the research team also produced a stand-alone workbook that presented only the ambulance data. The longer-term ambition for the WMVPA is have a lookup file for these data sources, so a Community Safety Manager can type a postcode from their area in and see all the available information for that area. The inclusion of ambulance data in the workbook appears promising insofar as it supports a longer-term goal of a more data-driven WMVPA strategy, although the impact of this inclusion remains to be demonstrated.
Using Ambulance Data for Violence Prevention
35
6. Comparing police, ambulance and ED data
The purpose of this analysis was to assess the extent of overlap in the location and timing of incidents recorded in each of the three datasets. The primary reason for doing so was to understand whether ambulance data makes a unique contribution to understanding where and when violence occurs, over and above existing data.
6.1. Geographical coverage of different datasets
The geographical allocation of the recorded incidents in Wolverhampton city centre is shown in Figure 5. There are several interesting findings. First, the overall geographical coverage seems to be very consistent across datasets, with higher frequency of incidents in the densely populated areas. Second, ambulance call-outs seem to be more evenly distributed than the offences attended to by police, with blue dots highly concentrated around the main city buildings and in several other neighbourhoods, whereas the green squares are less consistently distributed around the city centre. Lastly, there are some instances of incidents reported in the ambulance data that do not have a corresponding record in the police dataset, i.e. not only the incidents do not match in the time-geographical space but they are also isolated geographically only. This may be due to errors in reporting but otherwise suggests that some crime-related areas may not be captured in police data.
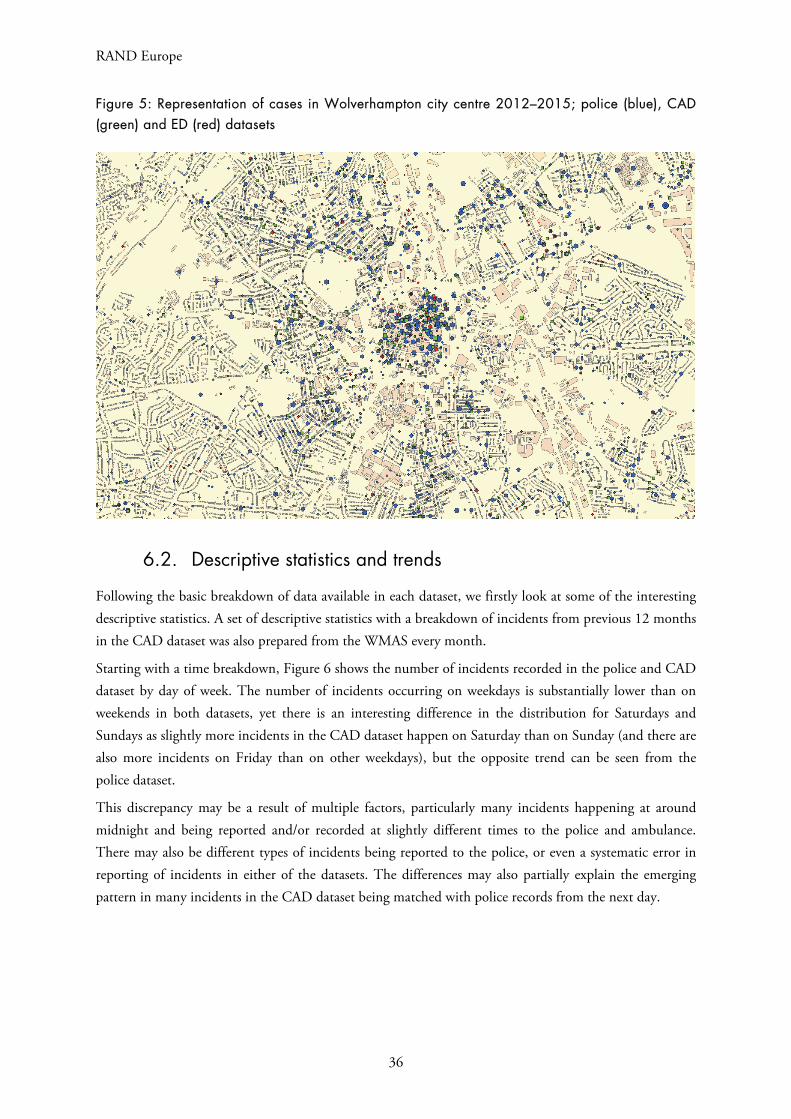
RAND Europe
36
Figure 5: Representation of cases in Wolverhampton city centre 2012–2015; police (blue), CAD (green) and ED (red) datasets
6.2. Descriptive statistics and trends
Following the basic breakdown of data available in each dataset, we firstly look at some of the interesting descriptive statistics. A set of descriptive statistics with a breakdown of incidents from previous 12 months in the CAD dataset was also prepared from the WMAS every month.
Starting with a time breakdown, Figure 6 shows the number of incidents recorded in the police and CAD dataset by day of week. The number of incidents occurring on weekdays is substantially lower than on weekends in both datasets, yet there is an interesting difference in the distribution for Saturdays and Sundays as slightly more incidents in the CAD dataset happen on Saturday than on Sunday (and there are also more incidents on Friday than on other weekdays), but the opposite trend can be seen from the police dataset.
This discrepancy may be a result of multiple factors, particularly many incidents happening at around midnight and being reported and/or recorded at slightly different times to the police and ambulance. There may also be different types of incidents being reported to the police, or even a systematic error in reporting of incidents in either of the datasets. The differences may also partially explain the emerging pattern in many incidents in the CAD dataset being matched with police records from the next day.

Using Ambulance Data for Violence Prevention
37
Figure 6: Incidents in the police and CAD datasets by day of week
To further investigate these patterns, let us compare the data with breakdown of incidents by time of day depicted in Figure 7. Unsurprisingly, the distribution of incidents in the CAD dataset is substantially smoother, suggesting that the call times are reported precisely. On the other hand, there are large differences in the number of incidents at different times, with just a very few incidents being recorded in the morning and most of the incidents happening at night. The distribution of offences in the police dataset is less uniform with several large spikes around lunchtime, mid-afternoon and midnight. (These correspond with, for example, the school day finishing at around 3 p.m. and pubs closing at around 11 p.m.–12 a.m.)
Figure 7: Incidents in the police and CAD datasets by time of day (share of all incidents)
16,000 17,000 18,000 19,000 20,000 21,000
Monday
Tuesday
Wednesday
ThursdayFriday
Saturday
Sunday
Police, day of week
0%
2%
4%
6%
8%0
12
34
5
6
7
89
1011
1213
1415
16
17
18
19
2021
2223
Ambulance, time of day
Ambulance
0%2%4%6%8%
10%0
12
34
5
6
7
89
1011
1213
1415
16
17
18
19
2021
2223
Police, time of day
Police
02000400060008000
Monday
Tuesday
Wednesday
ThursdayFriday
Saturday
Sunday
Ambulance, day of week
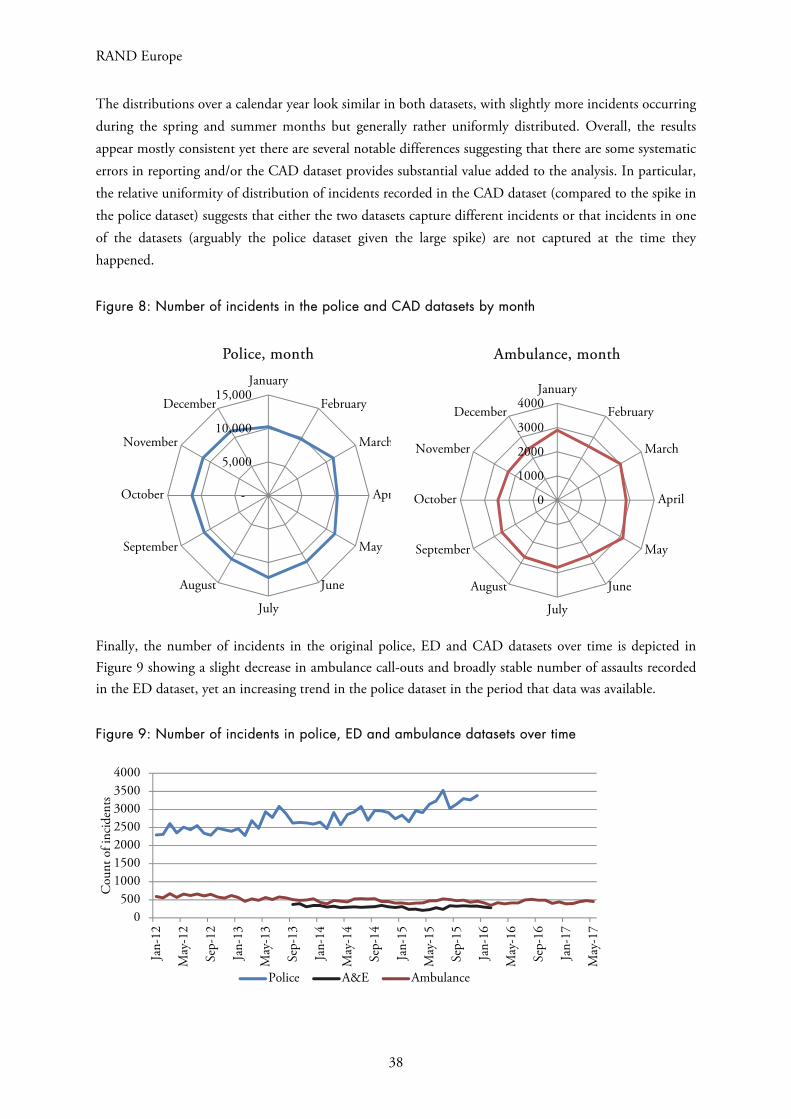
RAND Europe
38
The distributions over a calendar year look similar in both datasets, with slightly more incidents occurring during the spring and summer months but generally rather uniformly distributed. Overall, the results appear mostly consistent yet there are several notable differences suggesting that there are some systematic errors in reporting and/or the CAD dataset provides substantial value added to the analysis. In particular, the relative uniformity of distribution of incidents recorded in the CAD dataset (compared to the spike in the police dataset) suggests that either the two datasets capture different incidents or that incidents in one of the datasets (arguably the police dataset given the large spike) are not captured at the time they happened.
Figure 8: Number of incidents in the police and CAD datasets by month
Finally, the number of incidents in the original police, ED and CAD datasets over time is depicted in Figure 9 showing a slight decrease in ambulance call-outs and broadly stable number of assaults recorded in the ED dataset, yet an increasing trend in the police dataset in the period that data was available.
Figure 9: Number of incidents in police, ED and ambulance datasets over time
-
5,000
10,000
15,000January
February
March
Apr
May
June
July
August
September
October
November
December
Police, month
0500
1000150020002500300035004000
Jan-
12
May
-12
Sep-
12
Jan-
13
May
-13
Sep-
13
Jan-
14
May
-14
Sep-
14
Jan-
15
May
-15
Sep-
15
Jan-
16
May
-16
Sep-
16
Jan-
17
May
-17
Cou
nt o
f inc
iden
ts
Police A&E Ambulance
0500
1,0001,5002,0002,5003,000
January
February
March
April
May
June
July
August
September
October
November
December
Ambulance, month
0
1000
2000
3000
4000January
February
March
April
May
June
July
August
September
October
November
December
Ambulance, month
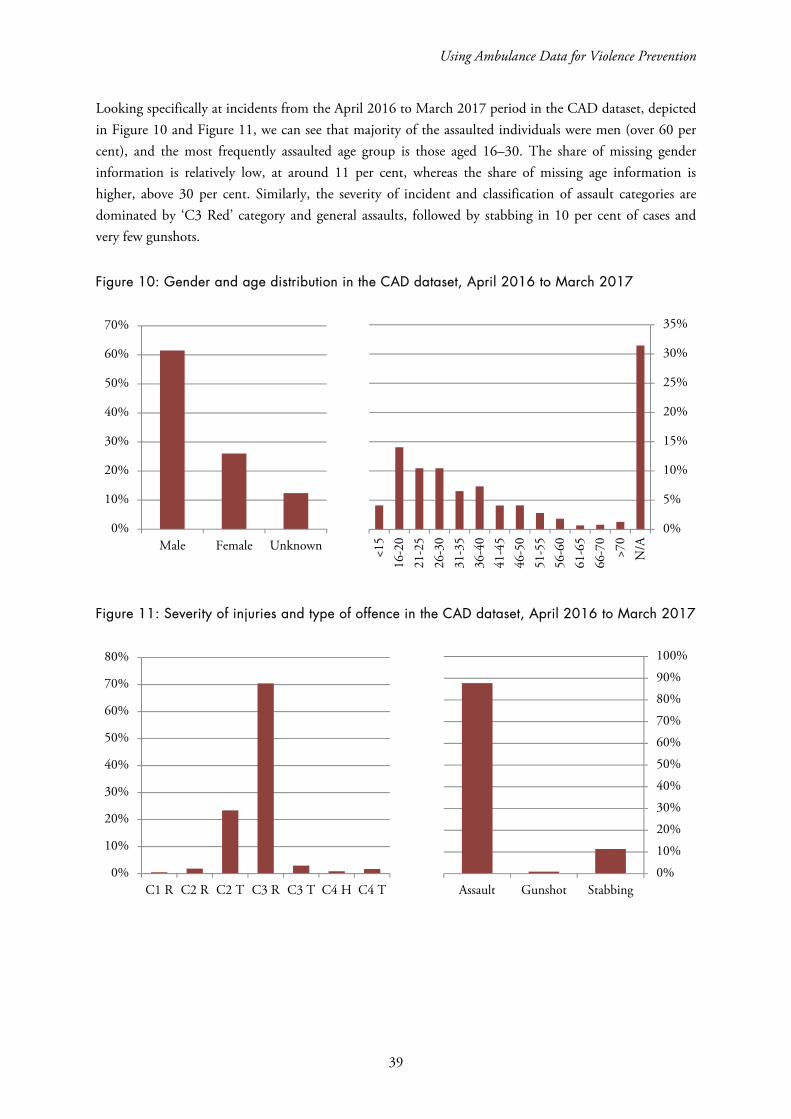
Using Ambulance Data for Violence Prevention
39
Looking specifically at incidents from the April 2016 to March 2017 period in the CAD dataset, depicted in Figure 10 and Figure 11, we can see that majority of the assaulted individuals were men (over 60 per cent), and the most frequently assaulted age group is those aged 16–30. The share of missing gender information is relatively low, at around 11 per cent, whereas the share of missing age information is higher, above 30 per cent. Similarly, the severity of incident and classification of assault categories are dominated by ‘C3 Red’ category and general assaults, followed by stabbing in 10 per cent of cases and very few gunshots.
Figure 10: Gender and age distribution in the CAD dataset, April 2016 to March 2017
Figure 11: Severity of injuries and type of offence in the CAD dataset, April 2016 to March 2017
0%
5%
10%
15%
20%
25%
30%
35%
<15
16-2
021
-25
26-3
031
-35
36-4
041
-45
46-5
051
-55
56-6
061
-65
66-7
0>7
0N
/A
0%
10%
20%
30%
40%
50%
60%
70%
Male Female Unknown
0%
10%
20%
30%
40%
50%
60%
70%
80%
C1 R C2 R C2 T C3 R C3 T C4 H C4 T0%
10%
20%
30%
40%
50%
60%
70%
80%
90%
100%
Assault Gunshot Stabbing
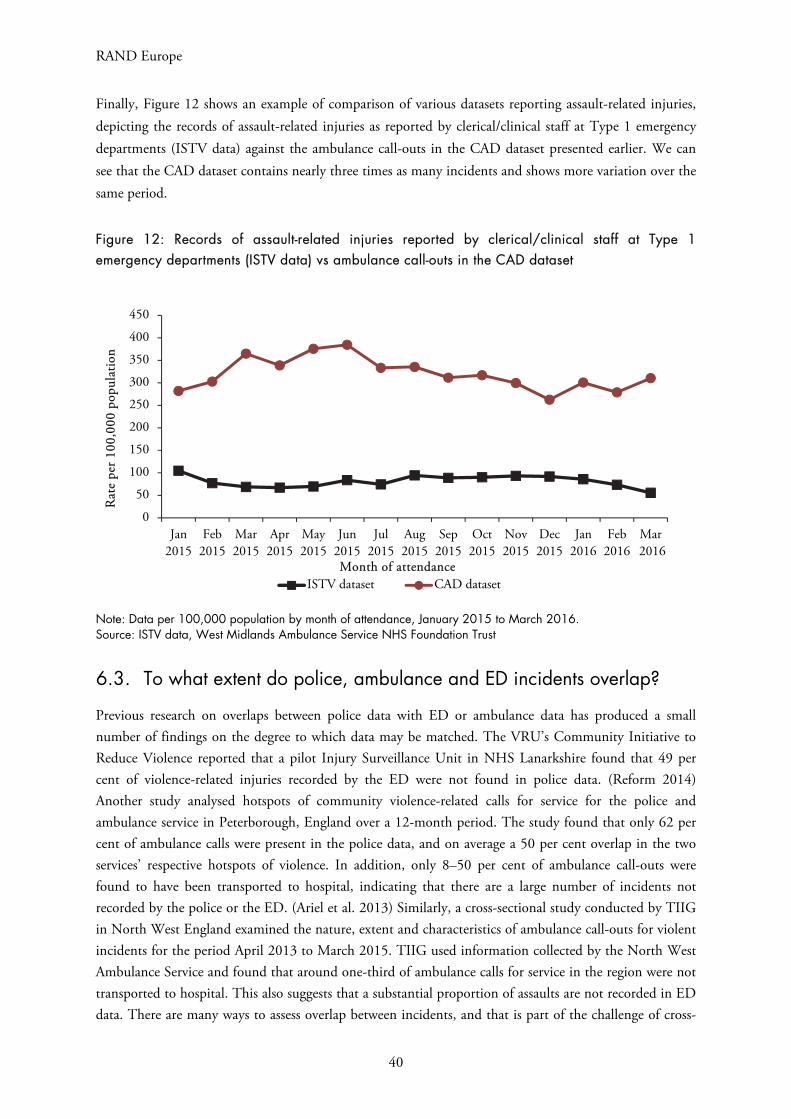
RAND Europe
40
Finally, Figure 12 shows an example of comparison of various datasets reporting assault-related injuries, depicting the records of assault-related injuries as reported by clerical/clinical staff at Type 1 emergency departments (ISTV data) against the ambulance call-outs in the CAD dataset presented earlier. We can see that the CAD dataset contains nearly three times as many incidents and shows more variation over the same period.
Figure 12: Records of assault-related injuries reported by clerical/clinical staff at Type 1 emergency departments (ISTV data) vs ambulance call-outs in the CAD dataset
Note: Data per 100,000 population by month of attendance, January 2015 to March 2016. Source: ISTV data, West Midlands Ambulance Service NHS Foundation Trust
6.3. To what extent do police, ambulance and ED incidents overlap?
Previous research on overlaps between police data with ED or ambulance data has produced a small number of findings on the degree to which data may be matched. The VRU’s Community Initiative to Reduce Violence reported that a pilot Injury Surveillance Unit in NHS Lanarkshire found that 49 per cent of violence-related injuries recorded by the ED were not found in police data. (Reform 2014) Another study analysed hotspots of community violence-related calls for service for the police and ambulance service in Peterborough, England over a 12-month period. The study found that only 62 per cent of ambulance calls were present in the police data, and on average a 50 per cent overlap in the two services’ respective hotspots of violence. In addition, only 8–50 per cent of ambulance call-outs were found to have been transported to hospital, indicating that there are a large number of incidents not recorded by the police or the ED. (Ariel et al. 2013) Similarly, a cross-sectional study conducted by TIIG in North West England examined the nature, extent and characteristics of ambulance call-outs for violent incidents for the period April 2013 to March 2015. TIIG used information collected by the North West Ambulance Service and found that around one-third of ambulance calls for service in the region were not transported to hospital. This also suggests that a substantial proportion of assaults are not recorded in ED data. There are many ways to assess overlap between incidents, and that is part of the challenge of cross-
0
50
100
150
200
250
300
350
400
450
Jan2015
Feb2015
Mar2015
Apr2015
May2015
Jun2015
Jul2015
Aug2015
Sep2015
Oct2015
Nov2015
Dec2015
Jan2016
Feb2016
Mar 2016
Rat
e pe
r 100
,000
pop
ulat
ion
Month of attendanceISTV dataset CAD dataset
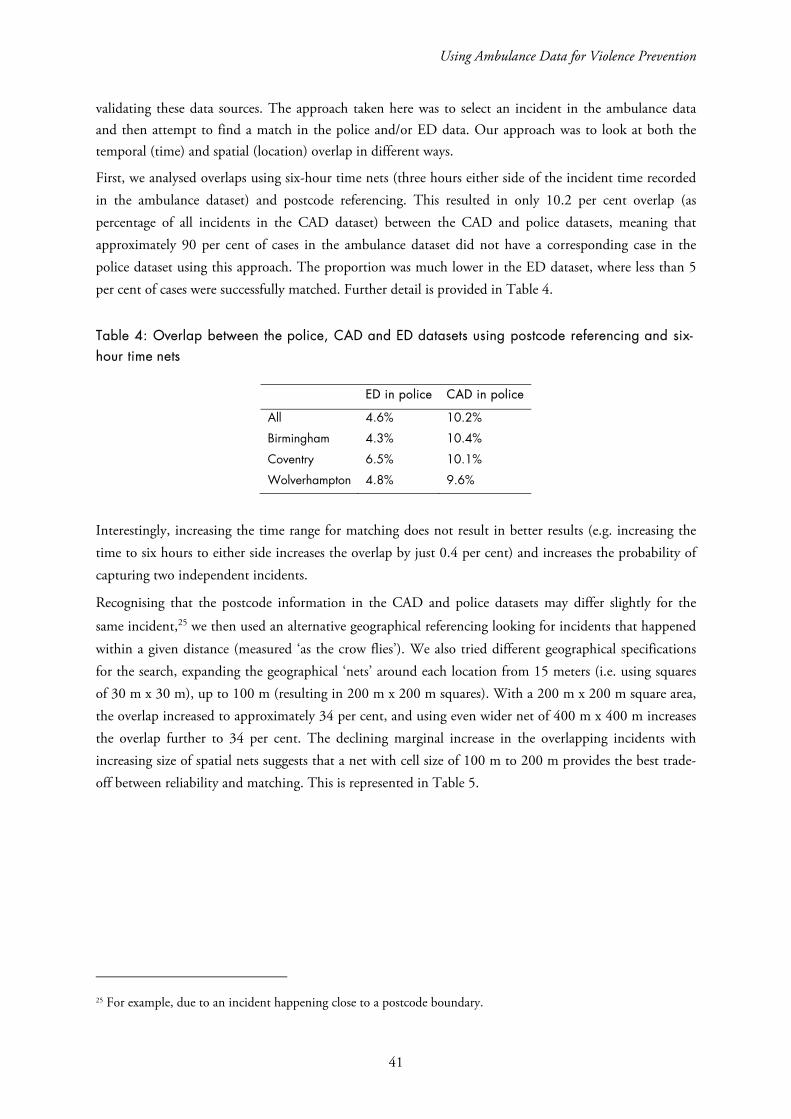
Using Ambulance Data for Violence Prevention
41
validating these data sources. The approach taken here was to select an incident in the ambulance data and then attempt to find a match in the police and/or ED data. Our approach was to look at both the temporal (time) and spatial (location) overlap in different ways.
First, we analysed overlaps using six-hour time nets (three hours either side of the incident time recorded in the ambulance dataset) and postcode referencing. This resulted in only 10.2 per cent overlap (as percentage of all incidents in the CAD dataset) between the CAD and police datasets, meaning that approximately 90 per cent of cases in the ambulance dataset did not have a corresponding case in the police dataset using this approach. The proportion was much lower in the ED dataset, where less than 5 per cent of cases were successfully matched. Further detail is provided in Table 4.
Table 4: Overlap between the police, CAD and ED datasets using postcode referencing and six-hour time nets
ED in police CAD in police
All 4.6% 10.2%
Birmingham 4.3% 10.4%
Coventry 6.5% 10.1%
Wolverhampton 4.8% 9.6%
Interestingly, increasing the time range for matching does not result in better results (e.g. increasing the time to six hours to either side increases the overlap by just 0.4 per cent) and increases the probability of capturing two independent incidents.
Recognising that the postcode information in the CAD and police datasets may differ slightly for the
same incident,25 we then used an alternative geographical referencing looking for incidents that happened within a given distance (measured ‘as the crow flies’). We also tried different geographical specifications for the search, expanding the geographical ‘nets’ around each location from 15 meters (i.e. using squares of 30 m x 30 m), up to 100 m (resulting in 200 m x 200 m squares). With a 200 m x 200 m square area, the overlap increased to approximately 34 per cent, and using even wider net of 400 m x 400 m increases the overlap further to 34 per cent. The declining marginal increase in the overlapping incidents with increasing size of spatial nets suggests that a net with cell size of 100 m to 200 m provides the best trade-off between reliability and matching. This is represented in Table 5.
25 For example, due to an incident happening close to a postcode boundary.
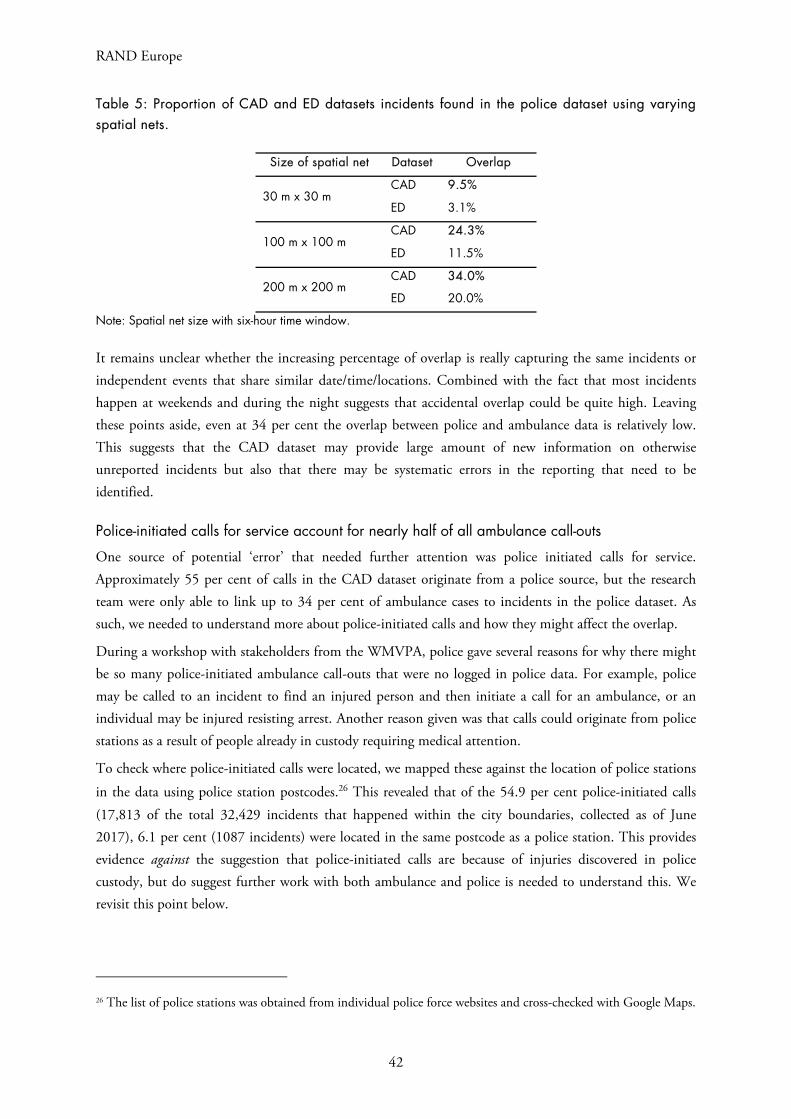
RAND Europe
42
Table 5: Proportion of CAD and ED datasets incidents found in the police dataset using varying spatial nets.
Size of spatial net Dataset Overlap
30 m x 30 m CAD 9.5%
ED 3.1%
100 m x 100 m CAD 24.3%
ED 11.5%
200 m x 200 m CAD 34.0%
ED 20.0%
Note: Spatial net size with six-hour time window.
It remains unclear whether the increasing percentage of overlap is really capturing the same incidents or independent events that share similar date/time/locations. Combined with the fact that most incidents happen at weekends and during the night suggests that accidental overlap could be quite high. Leaving these points aside, even at 34 per cent the overlap between police and ambulance data is relatively low. This suggests that the CAD dataset may provide large amount of new information on otherwise unreported incidents but also that there may be systematic errors in the reporting that need to be identified.
Police-initiated calls for service account for nearly half of all ambulance call-outs
One source of potential ‘error’ that needed further attention was police initiated calls for service. Approximately 55 per cent of calls in the CAD dataset originate from a police source, but the research team were only able to link up to 34 per cent of ambulance cases to incidents in the police dataset. As such, we needed to understand more about police-initiated calls and how they might affect the overlap.
During a workshop with stakeholders from the WMVPA, police gave several reasons for why there might be so many police-initiated ambulance call-outs that were no logged in police data. For example, police may be called to an incident to find an injured person and then initiate a call for an ambulance, or an individual may be injured resisting arrest. Another reason given was that calls could originate from police stations as a result of people already in custody requiring medical attention.
To check where police-initiated calls were located, we mapped these against the location of police stations
in the data using police station postcodes.26 This revealed that of the 54.9 per cent police-initiated calls (17,813 of the total 32,429 incidents that happened within the city boundaries, collected as of June 2017), 6.1 per cent (1087 incidents) were located in the same postcode as a police station. This provides evidence against the suggestion that police-initiated calls are because of injuries discovered in police custody, but do suggest further work with both ambulance and police is needed to understand this. We revisit this point below.
26 The list of police stations was obtained from individual police force websites and cross-checked with Google Maps.
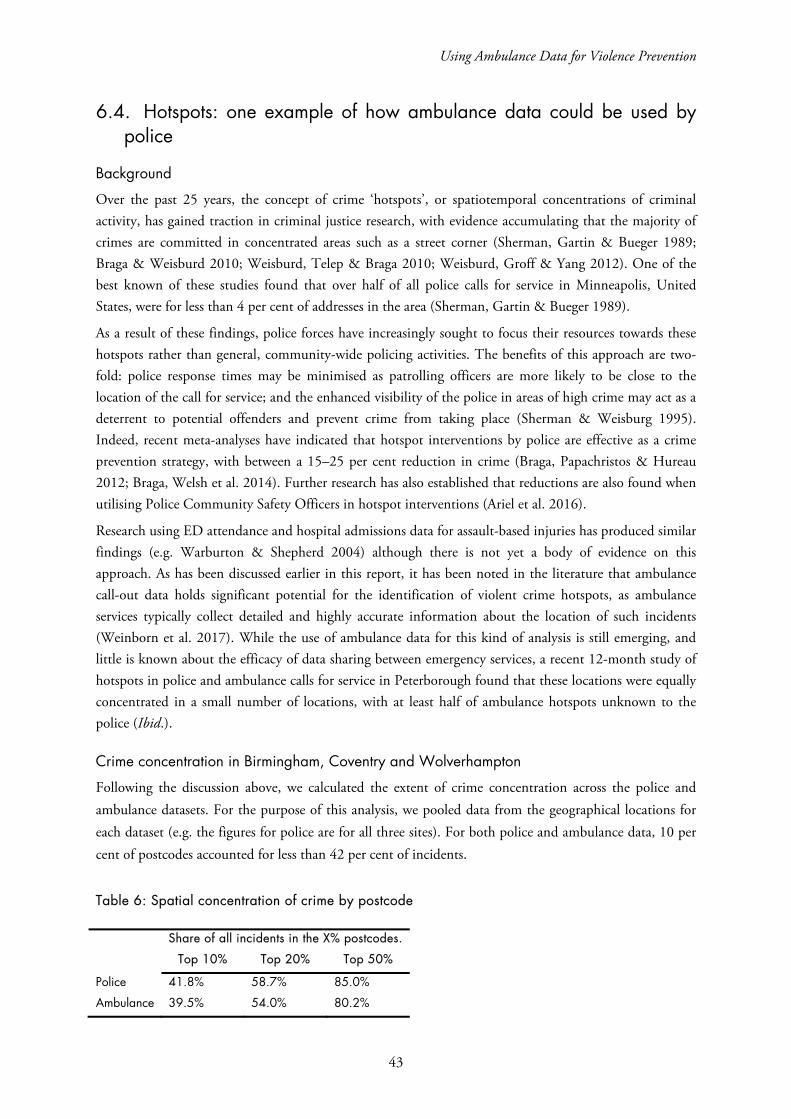
Using Ambulance Data for Violence Prevention
43
6.4. Hotspots: one example of how ambulance data could be used by police
Background
Over the past 25 years, the concept of crime ‘hotspots’, or spatiotemporal concentrations of criminal activity, has gained traction in criminal justice research, with evidence accumulating that the majority of crimes are committed in concentrated areas such as a street corner (Sherman, Gartin & Bueger 1989; Braga & Weisburd 2010; Weisburd, Telep & Braga 2010; Weisburd, Groff & Yang 2012). One of the best known of these studies found that over half of all police calls for service in Minneapolis, United States, were for less than 4 per cent of addresses in the area (Sherman, Gartin & Bueger 1989).
As a result of these findings, police forces have increasingly sought to focus their resources towards these hotspots rather than general, community-wide policing activities. The benefits of this approach are two-fold: police response times may be minimised as patrolling officers are more likely to be close to the location of the call for service; and the enhanced visibility of the police in areas of high crime may act as a deterrent to potential offenders and prevent crime from taking place (Sherman & Weisburg 1995). Indeed, recent meta-analyses have indicated that hotspot interventions by police are effective as a crime prevention strategy, with between a 15–25 per cent reduction in crime (Braga, Papachristos & Hureau 2012; Braga, Welsh et al. 2014). Further research has also established that reductions are also found when utilising Police Community Safety Officers in hotspot interventions (Ariel et al. 2016).
Research using ED attendance and hospital admissions data for assault-based injuries has produced similar findings (e.g. Warburton & Shepherd 2004) although there is not yet a body of evidence on this approach. As has been discussed earlier in this report, it has been noted in the literature that ambulance call-out data holds significant potential for the identification of violent crime hotspots, as ambulance services typically collect detailed and highly accurate information about the location of such incidents (Weinborn et al. 2017). While the use of ambulance data for this kind of analysis is still emerging, and little is known about the efficacy of data sharing between emergency services, a recent 12-month study of hotspots in police and ambulance calls for service in Peterborough found that these locations were equally concentrated in a small number of locations, with at least half of ambulance hotspots unknown to the police (Ibid.).
Crime concentration in Birmingham, Coventry and Wolverhampton
Following the discussion above, we calculated the extent of crime concentration across the police and ambulance datasets. For the purpose of this analysis, we pooled data from the geographical locations for each dataset (e.g. the figures for police are for all three sites). For both police and ambulance data, 10 per cent of postcodes accounted for less than 42 per cent of incidents.
Table 6: Spatial concentration of crime by postcode
Share of all incidents in the X% postcodes.
Top 10% Top 20% Top 50%
Police 41.8% 58.7% 85.0%
Ambulance 39.5% 54.0% 80.2%
RAND Europe
44
‘Hot postcodes’
Figure 13 shows visualisation of ‘hot postcodes’ on a map of Wolverhampton, plotting all incidents involving victims aged 21–25 in the city, differentiating frequency of incidents by size of circles on the map. Such a subgroup analysis may be particularly useful in targeting, for example, a certain vulnerable group of individuals. Note that each location represents a centroid of the relevant postcode as the supplied CAD dataset does not offer detailed coordinate data. Analysis of this type may be particularly helpful in providing a general overview of the main locations accounting for high volumes of incidents for the specific age group (in this example), but the data could be divided up in many different ways. Comparing this with an equivalent map based on the police dataset then helps to see if there are any obvious areas underrepresented in the police dataset. Moreover, restricting the analysis to a particular subgroup in terms of characteristics of individuals, types of assault or severity as it is done in the top panel of Figure 13 may provide better information on the most serious, rather than most frequently repeating, locations (note that police dataset does not have a gender or age variable that would allow comparable subgroup analysis).
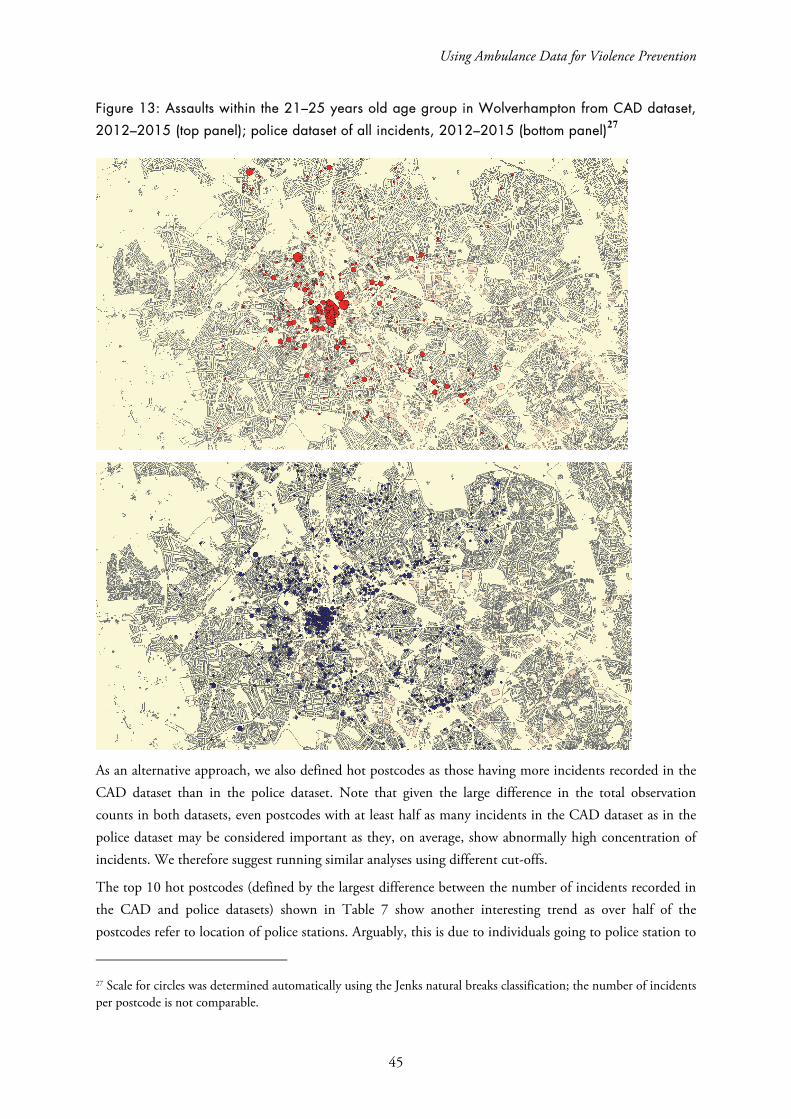
Using Ambulance Data for Violence Prevention
45
Figure 13: Assaults within the 21–25 years old age group in Wolverhampton from CAD dataset,
2012–2015 (top panel); police dataset of all incidents, 2012–2015 (bottom panel)27
As an alternative approach, we also defined hot postcodes as those having more incidents recorded in the CAD dataset than in the police dataset. Note that given the large difference in the total observation counts in both datasets, even postcodes with at least half as many incidents in the CAD dataset as in the police dataset may be considered important as they, on average, show abnormally high concentration of incidents. We therefore suggest running similar analyses using different cut-offs.
The top 10 hot postcodes (defined by the largest difference between the number of incidents recorded in the CAD and police datasets) shown in Table 7 show another interesting trend as over half of the postcodes refer to location of police stations. Arguably, this is due to individuals going to police station to
27 Scale for circles was determined automatically using the Jenks natural breaks classification; the number of incidents per postcode is not comparable.
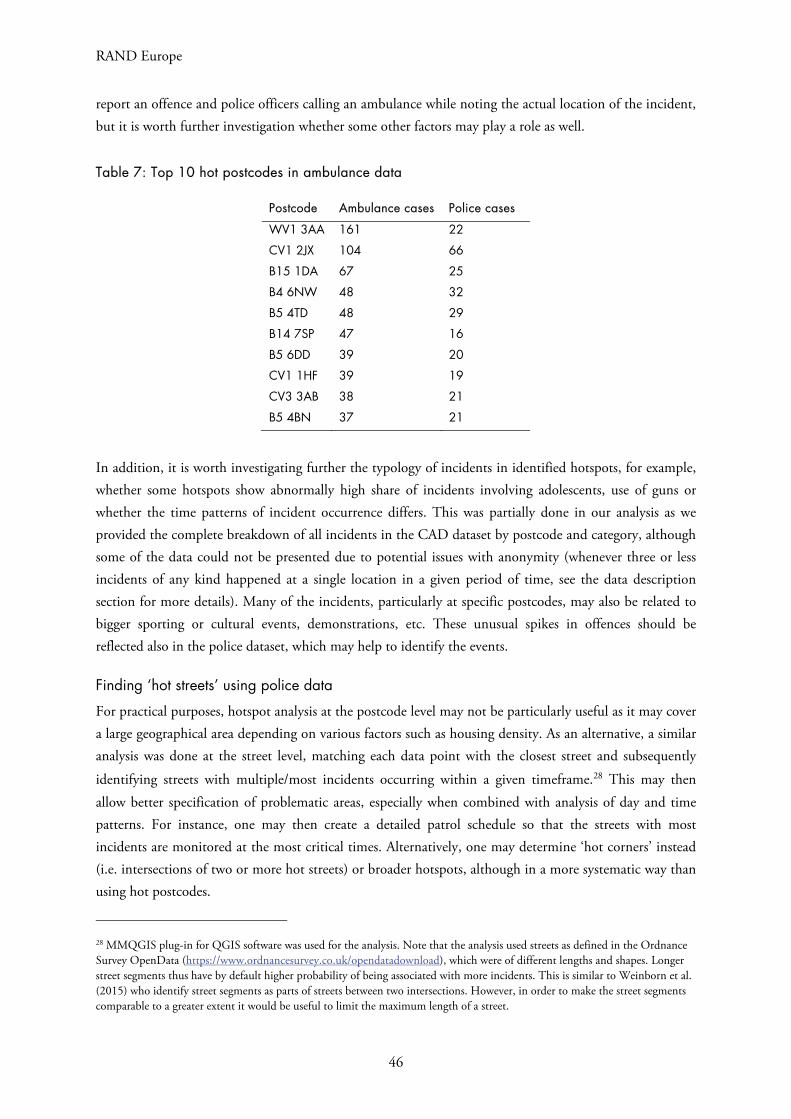
RAND Europe
46
report an offence and police officers calling an ambulance while noting the actual location of the incident, but it is worth further investigation whether some other factors may play a role as well.
Table 7: Top 10 hot postcodes in ambulance data
Postcode Ambulance cases Police cases
WV1 3AA 161 22
CV1 2JX 104 66
B15 1DA 67 25
B4 6NW 48 32
B5 4TD 48 29
B14 7SP 47 16
B5 6DD 39 20
CV1 1HF 39 19
CV3 3AB 38 21
B5 4BN 37 21
In addition, it is worth investigating further the typology of incidents in identified hotspots, for example, whether some hotspots show abnormally high share of incidents involving adolescents, use of guns or whether the time patterns of incident occurrence differs. This was partially done in our analysis as we provided the complete breakdown of all incidents in the CAD dataset by postcode and category, although some of the data could not be presented due to potential issues with anonymity (whenever three or less incidents of any kind happened at a single location in a given period of time, see the data description section for more details). Many of the incidents, particularly at specific postcodes, may also be related to bigger sporting or cultural events, demonstrations, etc. These unusual spikes in offences should be reflected also in the police dataset, which may help to identify the events.
Finding ‘hot streets’ using police data
For practical purposes, hotspot analysis at the postcode level may not be particularly useful as it may cover a large geographical area depending on various factors such as housing density. As an alternative, a similar analysis was done at the street level, matching each data point with the closest street and subsequently
identifying streets with multiple/most incidents occurring within a given timeframe.28 This may then allow better specification of problematic areas, especially when combined with analysis of day and time patterns. For instance, one may then create a detailed patrol schedule so that the streets with most incidents are monitored at the most critical times. Alternatively, one may determine ‘hot corners’ instead (i.e. intersections of two or more hot streets) or broader hotspots, although in a more systematic way than using hot postcodes.
28 MMQGIS plug-in for QGIS software was used for the analysis. Note that the analysis used streets as defined in the Ordnance Survey OpenData (https://www.ordnancesurvey.co.uk/opendatadownload), which were of different lengths and shapes. Longer street segments thus have by default higher probability of being associated with more incidents. This is similar to Weinborn et al. (2015) who identify street segments as parts of streets between two intersections. However, in order to make the street segments comparable to a greater extent it would be useful to limit the maximum length of a street.
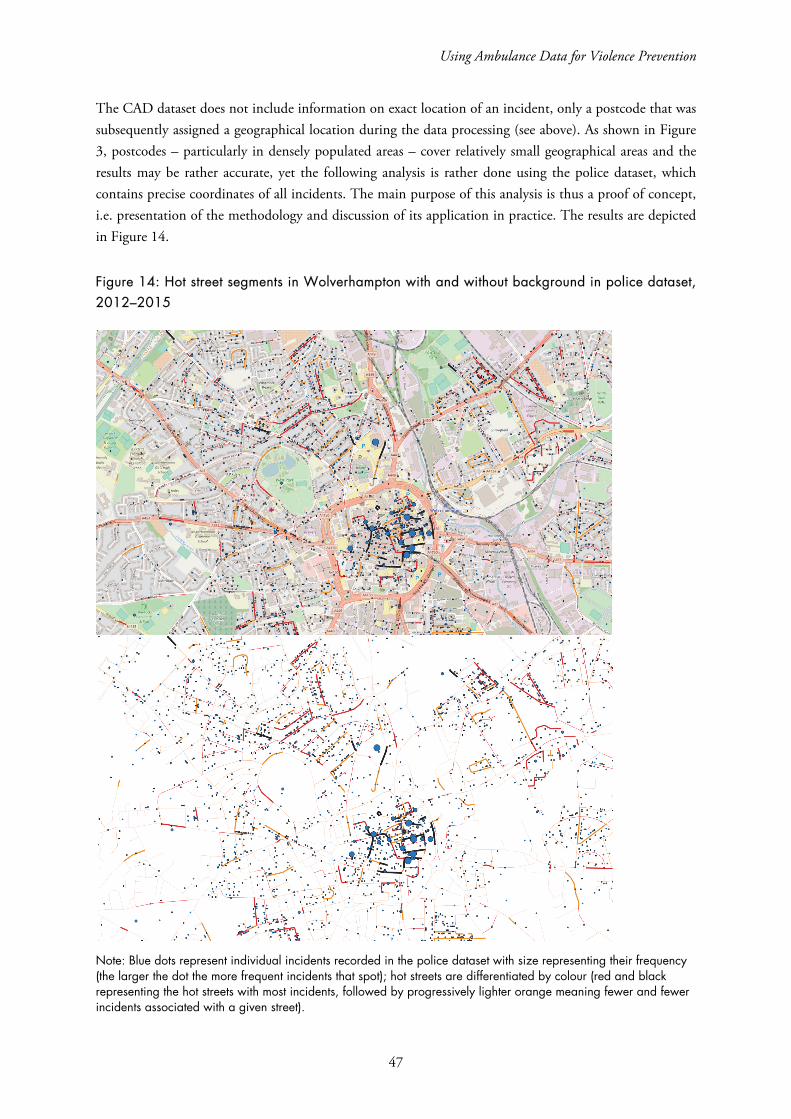
Using Ambulance Data for Violence Prevention
47
The CAD dataset does not include information on exact location of an incident, only a postcode that was subsequently assigned a geographical location during the data processing (see above). As shown in Figure 3, postcodes – particularly in densely populated areas – cover relatively small geographical areas and the results may be rather accurate, yet the following analysis is rather done using the police dataset, which contains precise coordinates of all incidents. The main purpose of this analysis is thus a proof of concept, i.e. presentation of the methodology and discussion of its application in practice. The results are depicted in Figure 14.
Figure 14: Hot street segments in Wolverhampton with and without background in police dataset, 2012–2015
Note: Blue dots represent individual incidents recorded in the police dataset with size representing their frequency (the larger the dot the more frequent incidents that spot); hot streets are differentiated by colour (red and black representing the hot streets with most incidents, followed by progressively lighter orange meaning fewer and fewer incidents associated with a given street).

RAND Europe
48
We can see from the figures above that while the overall picture remains unchanged, with the city centre showing by far the highest concentration of incidents, it is possible to better identify particularly affected segments. This type of analysis may also useful for easier patrol planning as some of the street segments may be connected. The application of this approach to ambulance data means it would be possible to identify much more specific locations that are ‘high frequency’ in terms of calls for service, and aid with violence prevention efforts in those locations and the surrounding area. The other benefit of such targeting – assuming that coordinate level data could be used for incidents in the ambulance data – is that it is more equitable and cost-effective; the additional precision means a specific junction or location could be the focus rather than a wider ‘neighbourhood’.
Using Ambulance Data for Violence Prevention
49
7. Conclusion
Several conclusions can be drawn from this pilot project, with relevance in the West Midlands and beyond.
The first is an acknowledgement that the different ‘ethos’ in police and ambulance services can lead to difficulties with cross-sectoral working. These differences were manifested most clearly in the process of agreeing on the terms of the data sharing in such a way as to satisfy patient confidentiality requirements, but was also useful for police and the wider violence prevention alliance. This data sharing process was protracted, and illustrated the tensions and concerns in bringing together medical and police agency data, as has previously been highlighted with the sharing of ED data (see Giacomantonio et al. 2014; Shepherd & Lisles 1998).
What we take from this process is that the earlier discussions about data sharing could have advanced more quickly if conducted with both strategic and operational leads from both services involved. As it stood, much of the discussions were routed or facilitated through RAND Europe, a process which may not have been as efficient as it could have been. The other benefit of having both services ‘around the table’ earlier would mean that the relationships required to sustain data sharing would be in place for the end of the project. As it stands, WMVPA are faced with having to build that relationship at the same time as RAND Europe’s support ceases.
Beyond perceptions about what drives police and ambulance services, there are similar operational pressures as both are primarily reactive in nature. Similarly, police and ambulance services engage in proactive and preventative initiatives that are intended to reduce calls for service and thereby alleviate pressure on services. However, there is little evidence on the effectiveness of ambulance-led initiatives to reduce violence in the UK. It may be that ambulance services do not have the operational flexibility to engage in these activities, particularly at a time following significant cuts to front-line services (and operational capacity) driven by government ‘austerity’.
However, that does not mean that ambulance services cannot inform activities undertaken by other agencies. The second set of conclusions we draw from this project are: (i) data generated by ambulance services add substantially to existing data on violence in terms of victims, volume, timing, location and severity; and (ii) ambulance data has the potential to directly inform preventative efforts by police or other public safety agencies. This may be through identifying areas at increased risk through demonstrating that the burden of violence in a given neighbourhood is actually higher than police data alone might suggest – with the addition of ambulance data to the VPA workbook and the potential for data sharing to continue this sort of detailed postcode level analysis is a realistic next step. Another option, and one we have explored in this report, is demonstrating areas where violence is
RAND Europe
50
high in ambulance data, but low or not recorded in police data. Further, these hidden ‘hotspots’ of violence may play a role in how violence is ‘transmitted’, or may be early signals of spikes in police data, but these ideas need to be explored further.
Third, the ability of agencies to utilise data depends on cooperation and capacity. The multi-agency approach taken for the VPA substantially increases the opportunities for cross-fertilisation of ideas and resourcing from public health, community safety and policing. This has already begun to produce benefits in terms of PHE being able to take a lead on data analytics; however, the ambulance service is not yet engaged with the WMVPA and there are likely key pieces of information that could inform preventative efforts across the West Midlands.
One final observation is that interagency cooperation between ‘blue light’ services and the wider VPA means a fundamental shift in how services think about key performance indicators, or perhaps how they are created. In particular, discussions around the potential for ambulance data hotspots to inform preventative action by police illustrate that there may be cross-sectoral benefits, but also asymmetric costs. Police would be committing resources through the variation of neighbourhood patrols for example, but the benefits may be realised to the ambulance service through reduced calls for service. Equally, there may also be reductions in police calls for service but we do not know, which leads into discussions about possible next steps.
7.1. Limitations
Limitations of the process evaluation
The project team were in ongoing communication with the relevant stakeholders in the project, including police leaders, senior analysts and the CSP team members and police analysts who were originally tasked with receiving the ambulance data outputs. This engagement included site visits and analyst workshops over the course of the project, interviews with the police analysts and CSP team members during the initial three months of data sharing, and regular discussions via telephone or email with more senior members of the WMP project team. Nevertheless, the research team was not onsite throughout the project, and the absence of project champions within the WMP may mean that some of the factors which influenced the implementation of the project were not observed by or fed back to the research team, or included in the process evaluation. Furthermore, given the process evaluation’s dependence on feedback from police analysts, there is the risk of unknown biases factoring into study findings.
Generalisability beyond the West Midlands
A significant barrier to the implementation of the project was the large-scale organisational restructuring within the relevant WMP units that occurred over the course of the project. As noted in Chapter 5, it is unlikely that another police force would implement a similar study while executing organisational change of this scale and nature. However, police forces are often adapting to meet changing conditions, such as shifts in priorities and policing strategies, resource constraints and changes in local criminal activity, for example. Therefore, lessons learned about coordinating the implementation of such an initiative with broader organisational management may be generalisable to all forces, and clear communication and
Using Ambulance Data for Violence Prevention
51
ongoing engagement with all stakeholders is key to ensuring that barriers emerging from organisational change are mitigated where possible.
Delays and issues around the exact nature of the data sharing processes between the police force and ambulance service also provide lessons that may be relevant for other forces. Building trust and strong relationships between the stakeholders in the participating agencies, agreeing to a purpose and scope of the project at its outset, and establishing clear processes to data sharing are all vitally important to ensure that all parties are well informed and comfortable with the project goals and methods.
A particular set of limitations relates to categorisation and (re)classification of variables across and within the used datasets. Those include potential errors introduced through comparison of incidents in the police dataset, which contains precise geographical information, and the CAD dataset, where each incident was only assigned a postcode. When looking for overlaps in the datasets using geospatial nets (i.e. looking for relevant incidents in the other dataset that happened within a given timeframe and close proximity to a given incident), assigning incident location to a centre of postcode may move boundary of the spatial net by a number of meters, which can lead both to exclusion of relevant incidents in the other dataset, as well as inclusion of other, unrelated incidents. On the contrary, time in the overlap analysis was treated as a continuous variable (the algorithm searched for relevant incidents that would occur within a given timeframe before and after the precise recorded time of the incident).
It is also worth reflecting on how limitations to current data share in the West Midlands may prevent other types of action. One crucial element of how ED data has been used in the past is for licencing enforcement action. This was facilitated through the inclusion of premises names in the standard question set (and latterly in ISTV data). As discussed in this report, ambulance data currently being shared includes postcodes, but not names of premises. This means incidents can be related to an area rather than a specific premises, limiting the enforcement capability of licencing officers and CSPs. However, the additional data would allow for approaches on specific locations that may encompass several premises.
7.2. Recommendations
Discussions about ambulance data sharing should engage senior members of the violence prevention alliance and ambulance service. The expectation should be that these discussions will focus on the justification for data sharing, beyond that, then the degree of risk that is acceptable to the ambulance service as the data controller will drive discussions. For the West Midlands specifically, discussions with the ambulance service should perhaps be led by PHE.
Given the low overlap between the CAD and police dataset, it may be useful to collect data on presence of ambulance (in the police dataset) or police (in the CAD dataset). In particular, each incident report in the police dataset may further include information on whether ambulance was necessary; if yes, whether it was present, and called by police force or someone else. Analogously, the CAD dataset may include additional information on the presence of police.
Additionally, hot postcodes in the analysis above were identified as those with more incidents recorded in the CAD dataset than in the police dataset. However, since police dataset contains substantially more observations overall, we suggest replicating this analysis using different cut-offs; hot postcode may then be
RAND Europe
52
identified (for example) by being associated with at least 50 per cent as many cases in the CAD dataset as in the police dataset.
7.2.1. Next steps
The collated data opens up several avenues for future activities, some of which are more policy or operationally relevant, and others that are more research driven.
Although this project has demonstrated the value of ambulance data as an additional source of intelligence, there is still no evidence on the effectiveness of ambulance data for violence reduction or prevention initiatives. This could be remedied in part through running a randomised experiment that uses ambulance data as the basis for violence prevention initiatives, or uses ambulance data as one source of outcome data.
Further development of the injury surveillance system in the West Midlands should be a priority. There are different ways in which this could be extended (e.g. postcode lookups to allow CSPs to interrogate aggregated neighbourhood data directly), but given the momentum that has built around this task, it is important to nurture it further. More sustained and entrenched sharing of the data is the only way we can find a clear answer on whether this data provides true added value to preventive policing and community safety initiatives.
A significant unanswered question is whether the ambulance pick-up location is the same or similar to the location of where the violent incident actually occurred. This question needs to be explored in future research activities, for example through the use of 360-degree cameras some ambulance services have put installed on ambulance vehicles to help monitor crews.
There is a basic research task relating to understanding the prevalence of police-initiated calls for service that appear in the ambulance data. The intuition is that police are first responders to violent incidents and that is what is driving this relationship. This could be confirmed through, for example, speaking to ambulance dispatch operators. However, it appears from the data that a substantial proportion of police-initiated ambulance calls are not being recorded by the police in their own data. WMP should review its recording practices in these cases to ensure that their intelligence is valid and reliable
There is a basic question about whether police and ambulance data are predictive of one another. The low overlap in the incident count suggests not, but this should be explored empirically. In the longer term, ambulance data could be a source of data to inform so-called ‘predictive policing’ (see Perry et al. 2016), i.e. statistical models that allow police to map those areas at highest risk in the coming weeks/months. As an extension of this, the combination of police, ambulance and ED data allows for a fuller assessment of the extent of spatial ‘creep’ in violence. It is well established that violence is ‘contagious’, in that it spreads between offender and victim, but also to witnesses and impacts on communities in time and space (Huesmann 2012). Through the combination of these three datasets, it may allow us to understand this phenomenon better to aide with the design of interventions to ‘interrupt’ violence.

Using Ambulance Data for Violence Prevention
53
The combined data also presents opportunities for more rigorous assessment of violence prevention initiatives. For example, if police are engaged to reduce violence, it would be possible to independently verify impacts using ambulance data as an additional source of intelligence.
RAND Europe
54
References
Ariel, B., Weinborn, C., & Sherman, L. W. 2016. “Soft” policing at hot spots—do police community support officers work? A randomized controlled trial. Journal of Experimental Criminology 12(3): 277–317.
Davison, T., van Staden, L., Nicholas, S., & Feist, A. 2010. Process evaluation of data sharing between Emergency Departments and Community Safety Partnerships in the South East Research – Report 46. London: Home Office.
Droste, N., Miller, P., & Baker, T. 2014. Emergency department data sharing to reduce alcohol-related violence: a systematic review of the feasibility and effectiveness of community-level interventions. Australasian College for Emergency Medicine and Australasian Society for Emergency Medicine 26(4):3 26-35.
Giacomantonio, C., Sutherland, A., Boyle, A., Shepherd, J., Kruithof, K., & Davies, M. 2014. Injury Surveillance: Using A&E Data for Crime Reduction – Guidance for Police Analysts and Practitioners. Ryton-on-Dunsmore: College of Policing.
Gov.uk. 2014. ‘A&Es and Police Will Share Information to Help Tackle Violence.’ As of 20 July 2017: https://www.gov.uk/government/news/aes-and-police-to-share-information-to-help-tackle-violence.
Huesmann, R. J. 2012. ‘The Contagion of Violence: The Extent, Processes, and the Outcomes.’ In Patel, D. M. & Taylor, R. M. Social and Economic Costs of Violence: Workshop Summary, 63–69. Washington D. C.: National Academies Press.
Jacobson, J., & Broadhurst, K. 2009. Accident and Emergency Data Sharing in London: Early Lessons for Policy and Practice. Leicester: Perpetuity Research & Consultancy International (PRCI) Ltd.
Meikle, J. 2015. ‘Frequent 999 callers cost NHS millions of pounds a year.’ The Guardian, February 25. As of 20 July 2017: https://www.theguardian.com/society/2015/dec/25/frequent-999-callers-nhs-england-ambulance-emergency.
New Economy. n.d. ‘Unit Cost Database.’ As of 20 July 2017:
http://www.neweconomymanchester.com/our-work/research-evaluation-cost-benefit-analysis/cost-benefit-analysis/unit-cost-database.
Office for National Statistics. 2016. ‘Statistical bulletin: Crime in England and Wales: Year Ending Dec 2016’. As of 20 July 2017:
https://www.ons.gov.uk/peoplepopulationandcommunity/crimeandjustice/bulletins/crimeinenglandandwales/yearendingdec2016#latest-violent-crime-figures-continue-to-present-a-complex-picture.
Using Ambulance Data for Violence Prevention
55
Office for National Statistics. 2017. ‘Crime in England and Wales: Police Force Area Data Tables’. As of 20 July 2017:
https://www.ons.gov.uk/peoplepopulationandcommunity/crimeandjustice/datasets/policeforceareadatatables.
Perry, W. L., McInnis, B., Price, C. C., Smith, S. & Hollywood, J. S. (2013) Predictive Policing: The Role of Crime Forecasting in Law Enforcement Operations. Santa Monica, CA: RAND Corporation.
Postcodes. 2017. ‘Documentation.’ As of 20 July 2017: https://postcodes.io/docs.
QGIS. 2017. ‘A Free and Open Source Geographic Information System.’ As of 20 July 2017: http://www.qgis.org/en/site/.
Quigg, Z., Hughes, K., & Bellis, M.A. 2012. ‘Data Sharing for Prevention: A Case Study in the Development of a Comprehensive Emergency Department Injury Surveillance System and its Use in Preventing Violence and Alcohol-related Harms.’ Inj Prev. 18(5): 315–320. doi: 10.1136/injuryprev-2011-040159
Reform. 2014. ‘Violence Reduction Unit, Scotland’. As of 20 July 2017: http://www.reform.uk/wp-content/uploads/2014/11/Preventative_criminal_justice_in_Glasgow_Scotland.pdf.
Shepherd, J. 2004. Effective NHS Contributions to Violence Prevention – the Cardiff Model. Cardiff, UK: Cardiff University.
Shepherd, J. P. & Lisles, C. 1998. ‘Towards Multi-Agency Violence Prevention and Victim Support: An Investigation of Police-Accident and Emergency Service Liaison.’ The British Journal of Criminology. 38(3): 351–370.
Warburton, A. L. & Shepherd, J. P. 2004. ‘Development, Utilisation, and Importance of Accident and Emergency Department Derived Assault Data in Violence Management’. Emergency Medicine Journal. 21(4): 473–477.
Weinborn, C., Ariel, B., Sherman, L. W. & O’Dwyer, E. 2017. ‘Hotspots vs. Harmspots: Shifting the Focus from Counts to Harm in the Criminology of Place.’ Applied Geography. 86: 226–244.
World Health Organization. 2014. ‘Global status report on violence prevention.’ As of 20 July 2017: http://www.who.int/violence_injury_prevention/violence/status_report/2014/en/
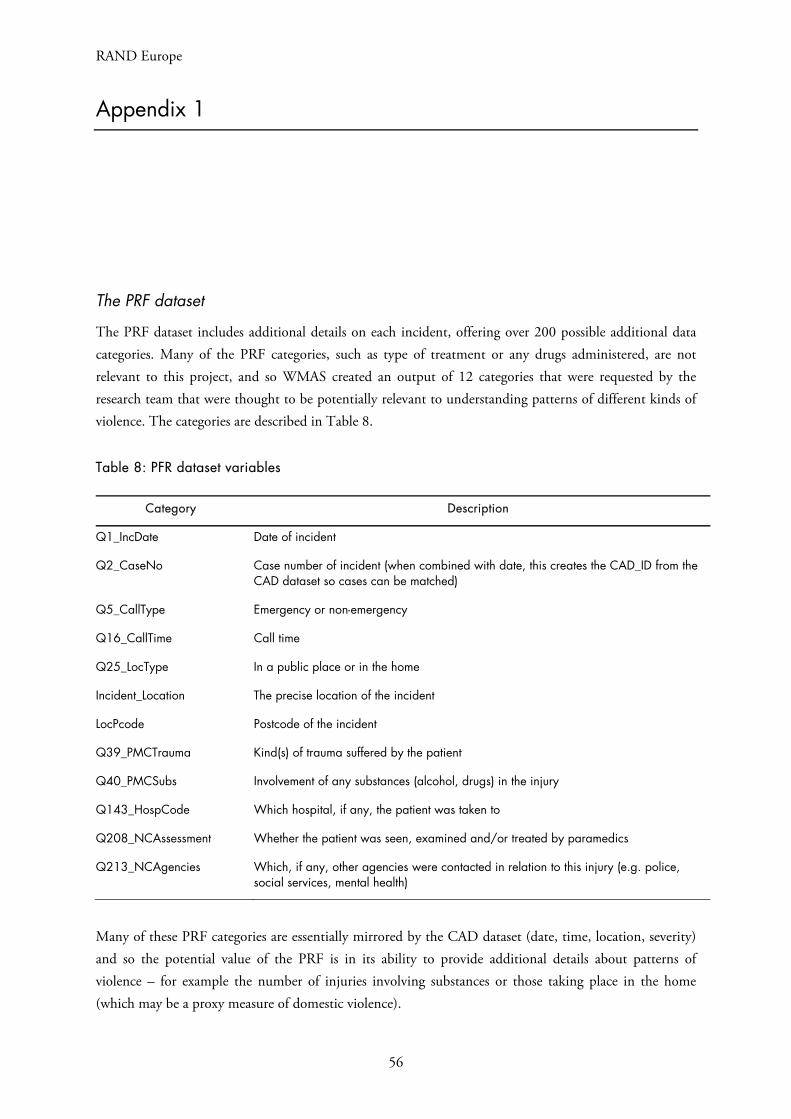
RAND Europe
56
Appendix 1
The PRF dataset
The PRF dataset includes additional details on each incident, offering over 200 possible additional data categories. Many of the PRF categories, such as type of treatment or any drugs administered, are not relevant to this project, and so WMAS created an output of 12 categories that were requested by the research team that were thought to be potentially relevant to understanding patterns of different kinds of violence. The categories are described in Table 8.
Table 8: PFR dataset variables
Category Description
Q1_IncDate Date of incident
Q2_CaseNo Case number of incident (when combined with date, this creates the CAD_ID from the CAD dataset so cases can be matched)
Q5_CallType Emergency or non-emergency
Q16_CallTime Call time
Q25_LocType In a public place or in the home
Incident_Location The precise location of the incident
LocPcode Postcode of the incident
Q39_PMCTrauma Kind(s) of trauma suffered by the patient
Q40_PMCSubs Involvement of any substances (alcohol, drugs) in the injury
Q143_HospCode Which hospital, if any, the patient was taken to
Q208_NCAssessment Whether the patient was seen, examined and/or treated by paramedics
Q213_NCAgencies Which, if any, other agencies were contacted in relation to this injury (e.g. police, social services, mental health)
Many of these PRF categories are essentially mirrored by the CAD dataset (date, time, location, severity) and so the potential value of the PRF is in its ability to provide additional details about patterns of violence – for example the number of injuries involving substances or those taking place in the home (which may be a proxy measure of domestic violence).
Using Ambulance Data for Violence Prevention
57
WMAS provided a three-month example output of PRF data for our review. From initial analysis, we find that the dataset has a substantial amount of missing data, for example of the 6621 records found in the three-month example output:
4054 (61 per cent) did not indicate whether other agencies were contacted (Q213_NCAgencies)
6457 (98 per cent) did not indicate whether a substance was involved (Q40_PMCSubs)
1455 (22 per cent) did not indicate whether the incident took place in a public place or the home (Q25_LocType).
It is not known if the missing data in the above categories is a consequence of non-recording of data that should have been recorded, or if it indicates instances where the available categories were not applicable (e.g. no other agencies were contacted, no substances were involved, or the location was neither public nor home). Regarding location data in the PRF:
All records had postcode (LocPcode) data, but most of these had formatting issues (e.g. additional spaces introduced) that would require correction before geospatial analysis could be conducted.
Zero records had additional location (Incident_Location) data.
It is worth noting that WMAS reported that they are moving to an electronic data collection approach for PRF data that should, in time, be integrated into the CAD system so that a more comprehensive and complete dataset from each call may be available. This is particularly interesting since at least 64 per cent of the incidents in the PRF dataset were recorded as occurring in the home, and it may be possible to use this data as a proxy measure for domestic violence in an area (which is not possible with the CAD data alone).
However, the PRF dataset was reported by WMAS as very time-consuming to produce for regular reports, and could take an analyst four hours or more to produce a cleaned one-month output from the PRF system to share with this project. Given the data quality issues identified above, the PRF dataset was not used further in the analysis.
RAND Europe
58
Appendix 2
RAND Europe Note to the WMAS Caldicott Guardian for Ambulance Data Sharing
Justification for use of routinely collected ambulance data to reduce community violence
This brief relates to a project on the potential use of ambulance data for violence prevention in the West Midlands. The project is supported by funding from the Police Innovation Fund. WMP and WMVPA are responsible for the overarching initiative but the research element that this note relates to involves a partnership between WMP/WMVPA; researchers from RAND Europe led by Dr Alex Sutherland and Dr
Chris Giacomantonio;29 Dr Adrian Boyle, an Emergency Physician from Addenbrooke’s Hospital; and Dr Barak Ariel, Lecturer in Experimental Criminology from the University of Cambridge.
The potential value of ambulance data for violence prevention
The project intends to examine the potential value of routinely collected ambulance data to support violence prevention initiatives, specifically using ambulance data alongside (and in addition to) police data for injury surveillance purposes. Possible uses of ambulance data for violence prevention have been
discussed in the academic literature,30 but have not yet been systematically tested. For example, can ambulance data be used as a form of preventive intelligence that adds value to pre-existing data and intelligence on the persistent causes and locations of violence in an area? This project is designed to answer such questions through helping all stakeholders involved in violence prevention determine whether the effort involved in establishing and maintaining an ambulance data sharing partnership is justified by its possible benefits, and we expect these findings to help inform violence prevention partnerships on a national level.
As a ‘proof of concept’ study, the first goal of the project is to understand what additional information (i.e. information about violence not currently known to police through other available data) is contained in data held by the WMAS. This will require an analysis of overlap between existing datasets held by WMVPA (including police and ED data) and WMAS’s datasets in terms of where, when and what type of violent offences take place. For this project to progress, the research team will therefore need to access anonymised but potentially person-identifiable information such as the location of assault incidents and certain details surrounding the incidents such as type of assault, time of day and levels of injury sustained.
29 RAND Europe is a not-for-profit policy research institution based in Cambridge. 30 See for example Ariel, Weinborn & Boyle (2013); Giacomantanio et al. (2014).
Using Ambulance Data for Violence Prevention
59
Analysing the levels of overlap between these datasets will help the research team determine whether there is added value in regular collection and analysis of ambulance data.
If there is value, the next steps in the project would be to determine which ambulance data categories (in both the CAD and PRF datasets) might provide value for violence reduction, how these might be used in a preventative fashion, the data sharing concerns these might raise, and how this data can be appropriately anonymised to mitigate risks to confidentiality. Following these steps, we would then explore how this could be used by police by sharing appropriately anonymised data with selected WMP analysts, who have previous experience using ED data for preventive interventions. The analysts would be tasked with assessing whether and how they are able to make effective use of the data in a way that might justify establishing an ongoing data sharing agreement between WMAS and WMVPA.
We emphasise that the data, if suitable for use by police, would be used for future prevention initiatives (as with the current use of ED data), rather than to detect or prosecute past incidents of violence. This means that personal details about patients involved in specific incidents would never be used to pursue arrests or charges. All steps of the project would seek input from the WMAS Caldicott Guardian and the head of information governance and be guided by an ISA that specified how and by whom data could be shared, accessed and analysed, and to what end.
Previous similar sharing – the Cardiff Model of violence prevention
We recognise that, based on the revised Caldicott Principles, sharing of personal confidential data should be done only where justified, necessary and to the minimum degree possible, but also that data sharing where there is a public benefit can be justified under the Data Protection Act and is explicitly encouraged within the revised Caldicott framework. In the case of ambulance data, there is a clear parallel in previous practice of data sharing, specifically relating to assault data from ED departments.
Data on assault victims attending ED departments has been used to support community violence prevention initiatives in England and Wales since the mid-1990s, in what is now commonly known as the Cardiff Model of violence prevention. Cardiff Model ED data is traditionally shared with police and multi-agency violence prevention initiatives as a form of additional intelligence, to identify patterns of interpersonal violence that had been previous unknown to police. ED data is used to support preventive activities (e.g. additional police patrols in high-violence areas, or interventions at licensed premises with high levels of violence). Sharing of ED data has been consistently linked with statistically significant
reductions in violence in a local area.31 The use of ED data is now a national standard of practice through
the government’s Information Sharing to Tackle Violence (ISTV) guidance.32
Moreover, ED data has been shared across England and Wales within violence prevention partnerships for over 20 years without a recorded complaint to date about patient confidentiality or data misuse. This has been possible through a conscientiously managed partnership approach that is replicable in the ambulance data context.
31 See, for example, Droste, Miller & Baker (2014), who conducted a systematic review of literature on the use of ED data and found substantial effects on levels of assaults in all areas studies. 32 See https://www.gov.uk/government/news/aes-and-police-to-share-information-to-help-tackle-violence
RAND Europe
60
ED data is normally anonymised before it is shared with police forces, and in this project a similar level of anonymization would be expected. Nonetheless, it is recognised that the details included in the ED dataset could in some cases be converted into personal information in conjunction with data already held
by police. However, as noted by the Information Commissioner’s Office,33 this should not be on its own a barrier to the appropriate sharing of personal information, so long as precautions are in place. The precautions would traditionally include an ISA that precludes use of the data outside of project scope, and regular oversight by the relevant Caldicott Guardian.
As noted above, we would expect to implement similar precautions in this project. Furthermore, as the data processor in this project, RAND Europe has extensive experience of handling confidential data, including patient identifiable data. RAND Europe’s Cambridge office is an accredited List X site, which means we are approved to hold government protectively marked documents, and we therefore take data security responsibilities very seriously. Our data security policy is also provided for information.
33 Communication reference 0288158, in Appendix 7.
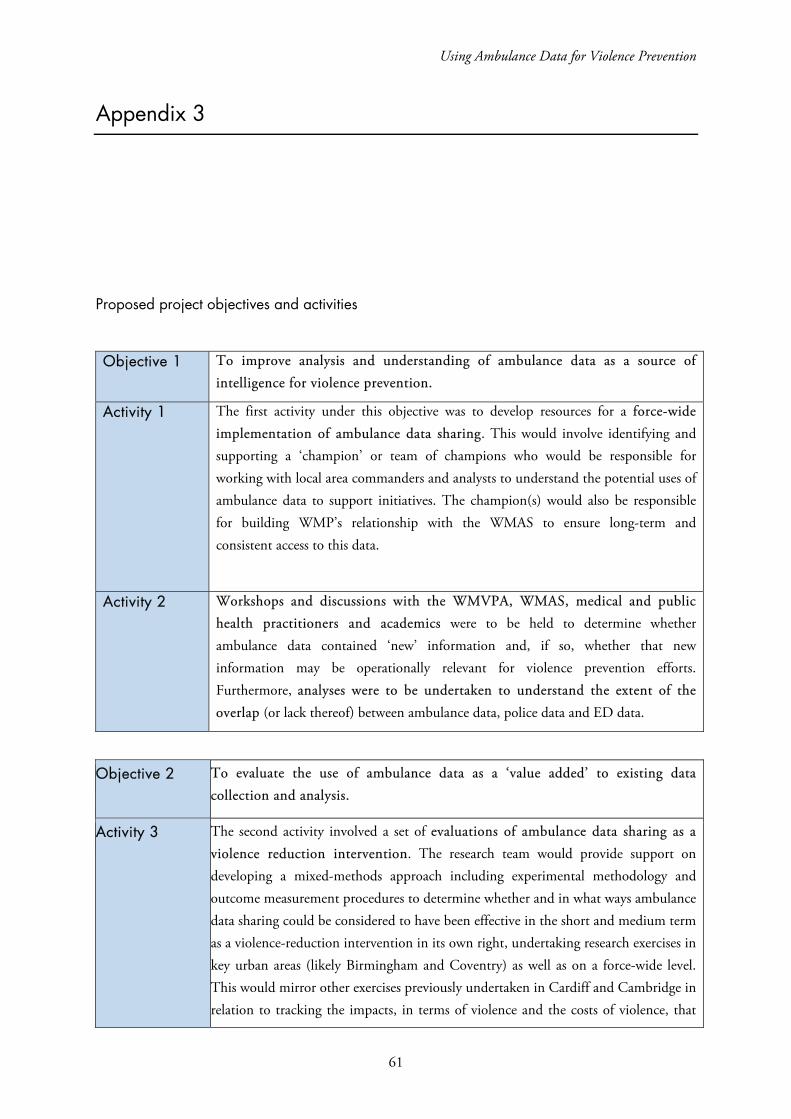
Using Ambulance Data for Violence Prevention
61
Appendix 3
Proposed project objectives and activities
Objective 1 To improve analysis and understanding of ambulance data as a source of intelligence for violence prevention.
Activity 1 The first activity under this objective was to develop resources for a force-wide implementation of ambulance data sharing. This would involve identifying and supporting a ‘champion’ or team of champions who would be responsible for working with local area commanders and analysts to understand the potential uses of ambulance data to support initiatives. The champion(s) would also be responsible for building WMP’s relationship with the WMAS to ensure long-term and consistent access to this data.
Activity 2 Workshops and discussions with the WMVPA, WMAS, medical and public health practitioners and academics were to be held to determine whether ambulance data contained ‘new’ information and, if so, whether that new information may be operationally relevant for violence prevention efforts. Furthermore, analyses were to be undertaken to understand the extent of the overlap (or lack thereof) between ambulance data, police data and ED data.
Objective 2 To evaluate the use of ambulance data as a ‘value added’ to existing data collection and analysis.
Activity 3 The second activity involved a set of evaluations of ambulance data sharing as a violence reduction intervention. The research team would provide support on developing a mixed-methods approach including experimental methodology and outcome measurement procedures to determine whether and in what ways ambulance data sharing could be considered to have been effective in the short and medium term as a violence-reduction intervention in its own right, undertaking research exercises in key urban areas (likely Birmingham and Coventry) as well as on a force-wide level. This would mirror other exercises previously undertaken in Cardiff and Cambridge in relation to tracking the impacts, in terms of violence and the costs of violence, that
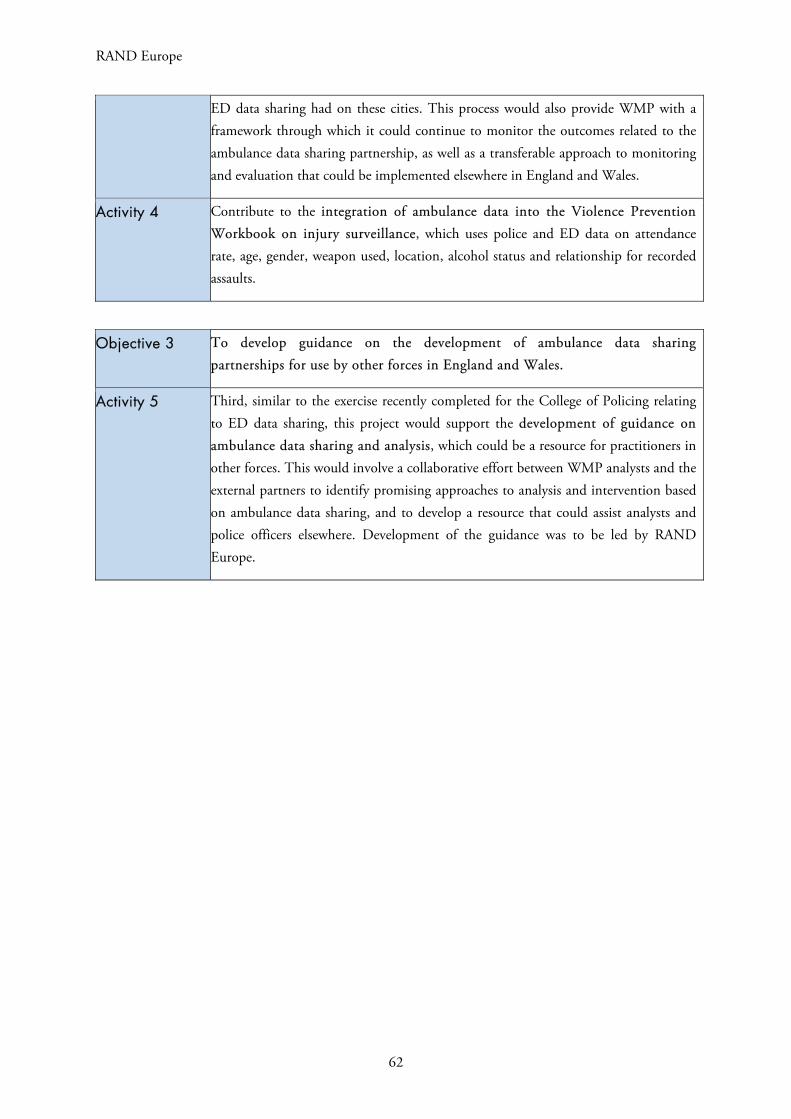
RAND Europe
62
ED data sharing had on these cities. This process would also provide WMP with a framework through which it could continue to monitor the outcomes related to the ambulance data sharing partnership, as well as a transferable approach to monitoring and evaluation that could be implemented elsewhere in England and Wales.
Activity 4 Contribute to the integration of ambulance data into the Violence Prevention Workbook on injury surveillance, which uses police and ED data on attendance rate, age, gender, weapon used, location, alcohol status and relationship for recorded assaults.
Objective 3 To develop guidance on the development of ambulance data sharing partnerships for use by other forces in England and Wales.
Activity 5 Third, similar to the exercise recently completed for the College of Policing relating to ED data sharing, this project would support the development of guidance on ambulance data sharing and analysis, which could be a resource for practitioners in other forces. This would involve a collaborative effort between WMP analysts and the external partners to identify promising approaches to analysis and intervention based on ambulance data sharing, and to develop a resource that could assist analysts and police officers elsewhere. Development of the guidance was to be led by RAND Europe.
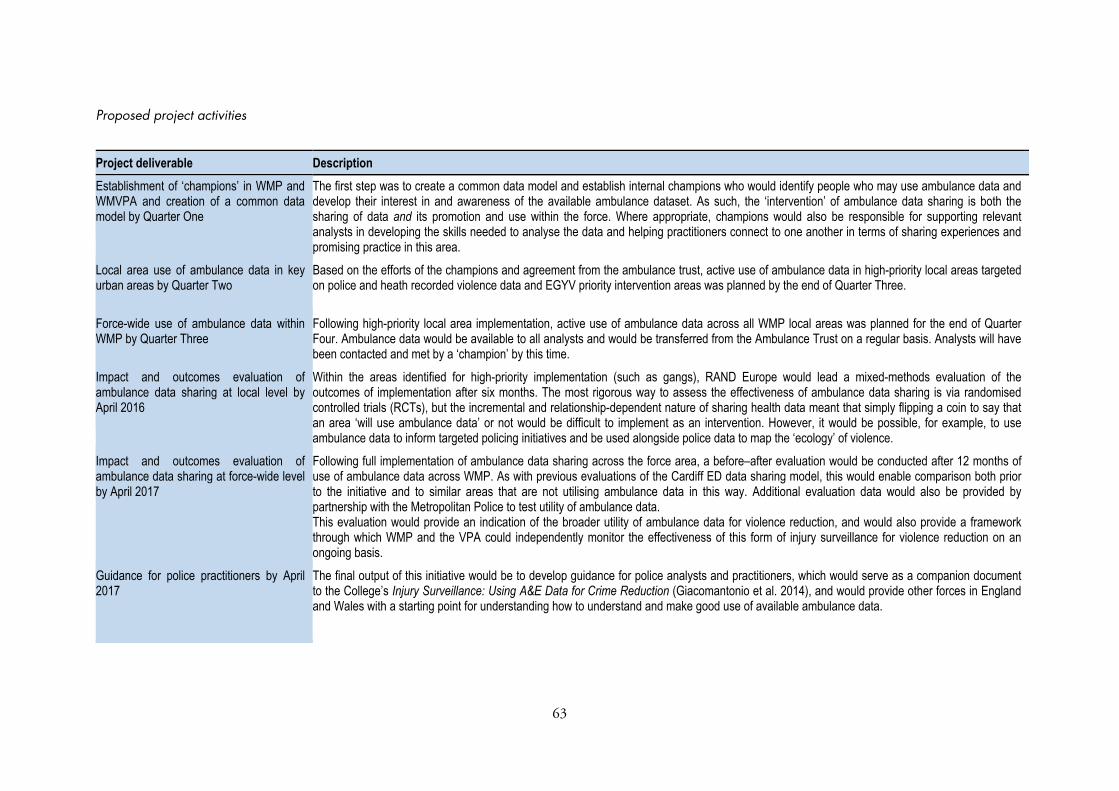
63
Proposed project activities
Project deliverable Description Establishment of ‘champions’ in WMP and WMVPA and creation of a common data model by Quarter One
The first step was to create a common data model and establish internal champions who would identify people who may use ambulance data and develop their interest in and awareness of the available ambulance dataset. As such, the ‘intervention’ of ambulance data sharing is both the sharing of data and its promotion and use within the force. Where appropriate, champions would also be responsible for supporting relevant analysts in developing the skills needed to analyse the data and helping practitioners connect to one another in terms of sharing experiences and promising practice in this area.
Local area use of ambulance data in key urban areas by Quarter Two
Based on the efforts of the champions and agreement from the ambulance trust, active use of ambulance data in high-priority local areas targeted on police and heath recorded violence data and EGYV priority intervention areas was planned by the end of Quarter Three.
Force-wide use of ambulance data within WMP by Quarter Three
Following high-priority local area implementation, active use of ambulance data across all WMP local areas was planned for the end of Quarter Four. Ambulance data would be available to all analysts and would be transferred from the Ambulance Trust on a regular basis. Analysts will have been contacted and met by a ‘champion’ by this time.
Impact and outcomes evaluation of ambulance data sharing at local level by April 2016
Within the areas identified for high-priority implementation (such as gangs), RAND Europe would lead a mixed-methods evaluation of the outcomes of implementation after six months. The most rigorous way to assess the effectiveness of ambulance data sharing is via randomised controlled trials (RCTs), but the incremental and relationship-dependent nature of sharing health data meant that simply flipping a coin to say that an area ‘will use ambulance data’ or not would be difficult to implement as an intervention. However, it would be possible, for example, to use ambulance data to inform targeted policing initiatives and be used alongside police data to map the ‘ecology’ of violence.
Impact and outcomes evaluation of ambulance data sharing at force-wide level by April 2017
Following full implementation of ambulance data sharing across the force area, a before–after evaluation would be conducted after 12 months of use of ambulance data across WMP. As with previous evaluations of the Cardiff ED data sharing model, this would enable comparison both prior to the initiative and to similar areas that are not utilising ambulance data in this way. Additional evaluation data would also be provided by partnership with the Metropolitan Police to test utility of ambulance data. This evaluation would provide an indication of the broader utility of ambulance data for violence reduction, and would also provide a framework through which WMP and the VPA could independently monitor the effectiveness of this form of injury surveillance for violence reduction on an ongoing basis.
Guidance for police practitioners by April 2017
The final output of this initiative would be to develop guidance for police analysts and practitioners, which would serve as a companion document to the College’s Injury Surveillance: Using A&E Data for Crime Reduction (Giacomantonio et al. 2014), and would provide other forces in England and Wales with a starting point for understanding how to understand and make good use of available ambulance data.
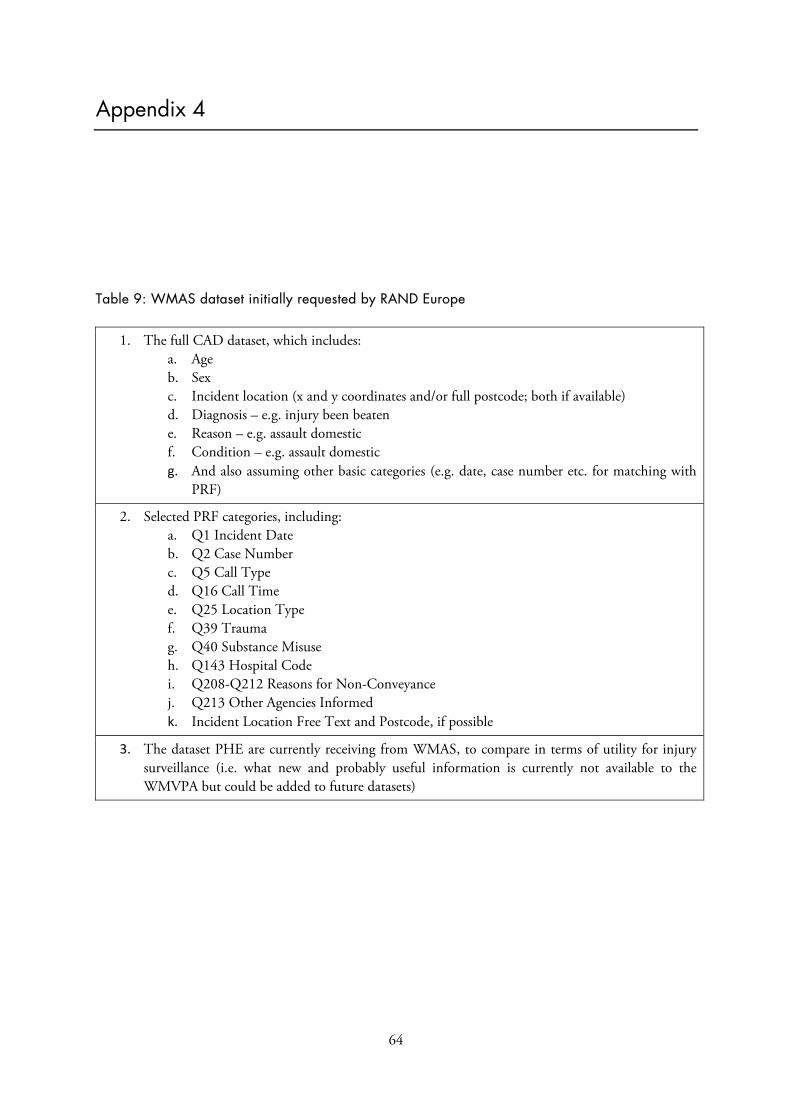
64
Appendix 4
Table 9: WMAS dataset initially requested by RAND Europe
1. The full CAD dataset, which includes:a. Ageb. Sexc. Incident location (x and y coordinates and/or full postcode; both if available)d. Diagnosis – e.g. injury been beatene. Reason – e.g. assault domesticf. Condition – e.g. assault domesticg. And also assuming other basic categories (e.g. date, case number etc. for matching with
PRF)
2. Selected PRF categories, including:a. Q1 Incident Dateb. Q2 Case Numberc. Q5 Call Typed. Q16 Call Timee. Q25 Location Typef. Q39 Traumag. Q40 Substance Misuseh. Q143 Hospital Codei. Q208-Q212 Reasons for Non-Conveyancej. Q213 Other Agencies Informedk. Incident Location Free Text and Postcode, if possible
3. The dataset PHE are currently receiving from WMAS, to compare in terms of utility for injurysurveillance (i.e. what new and probably useful information is currently not available to theWMVPA but could be added to future datasets)
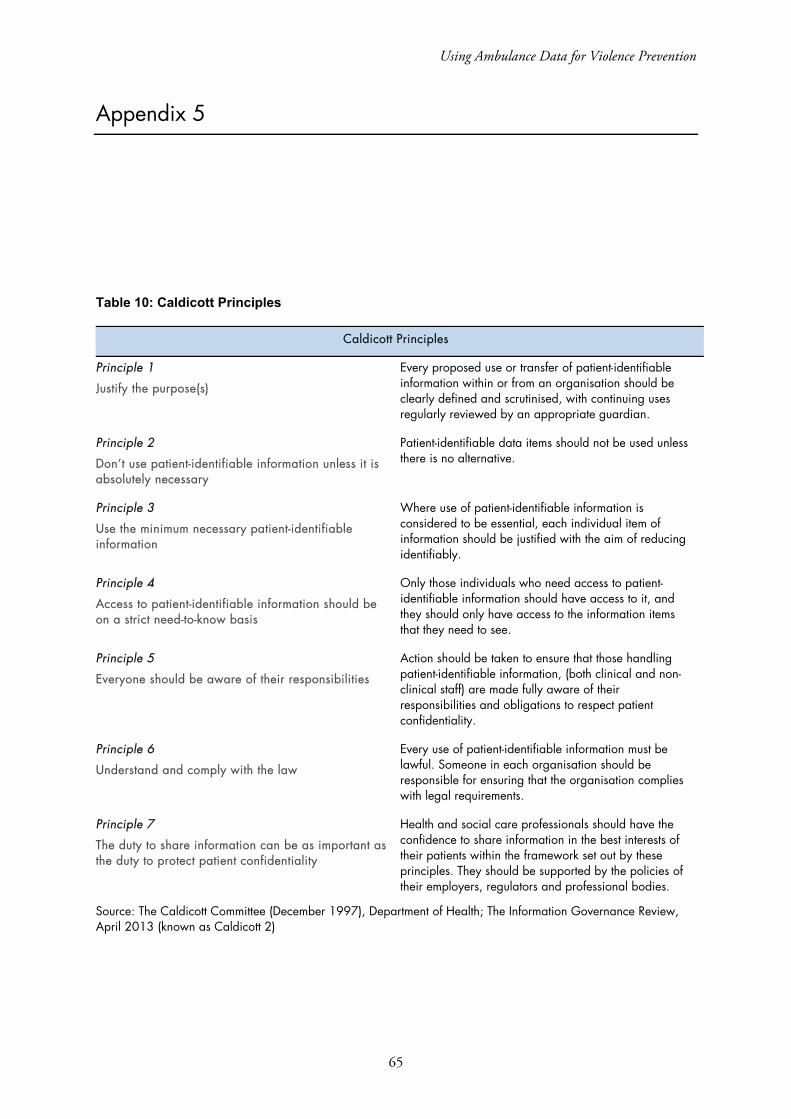
Using Ambulance Data for Violence Prevention
65
Appendix 5
Table 10: Caldicott Principles
Caldicott Principles
Principle 1
Justify the purpose(s)
Every proposed use or transfer of patient-identifiable information within or from an organisation should be clearly defined and scrutinised, with continuing uses regularly reviewed by an appropriate guardian.
Principle 2
Don’t use patient-identifiable information unless it is absolutely necessary
Patient-identifiable data items should not be used unless there is no alternative.
Principle 3
Use the minimum necessary patient-identifiable information
Where use of patient-identifiable information is considered to be essential, each individual item of information should be justified with the aim of reducing identifiably.
Principle 4
Access to patient-identifiable information should be on a strict need-to-know basis
Only those individuals who need access to patient-identifiable information should have access to it, and they should only have access to the information items that they need to see.
Principle 5
Everyone should be aware of their responsibilities
Action should be taken to ensure that those handling patient-identifiable information, (both clinical and non-clinical staff) are made fully aware of their responsibilities and obligations to respect patient confidentiality.
Principle 6
Understand and comply with the law
Every use of patient-identifiable information must be lawful. Someone in each organisation should be responsible for ensuring that the organisation complies with legal requirements.
Principle 7
The duty to share information can be as important as the duty to protect patient confidentiality
Health and social care professionals should have the confidence to share information in the best interests of their patients within the framework set out by these principles. They should be supported by the policies of their employers, regulators and professional bodies.
Source: The Caldicott Committee (December 1997), Department of Health; The Information Governance Review, April 2013 (known as Caldicott 2)
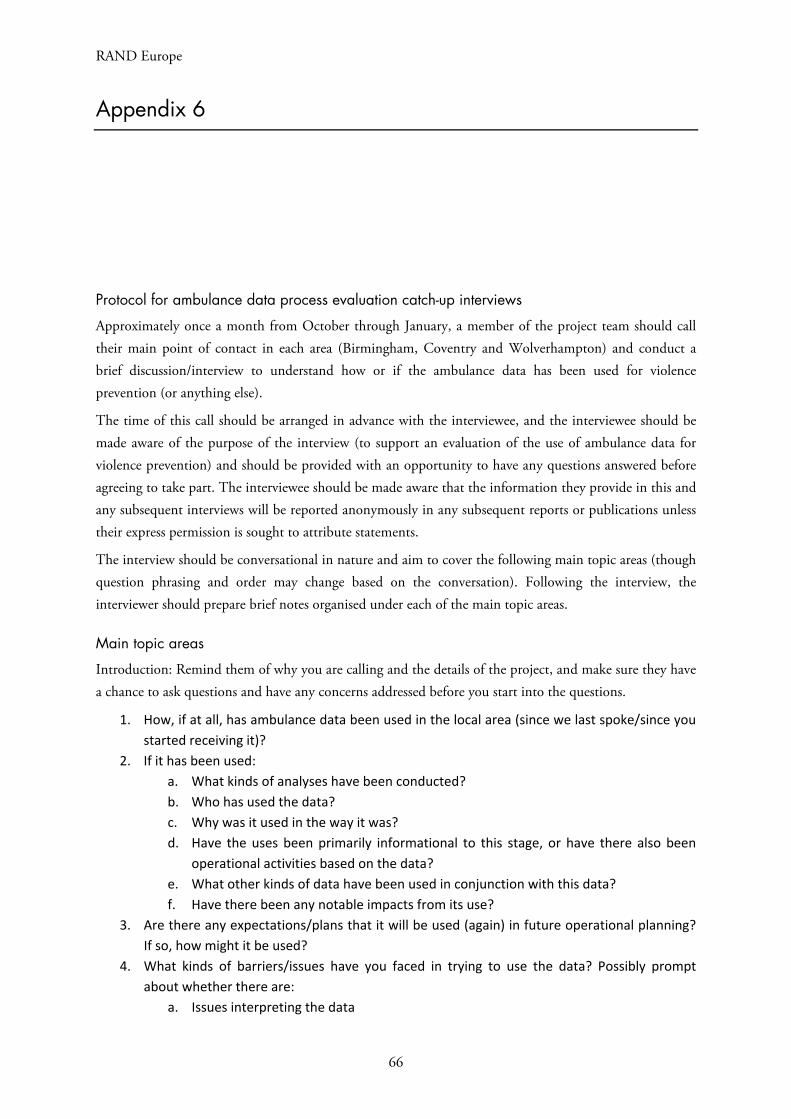
RAND Europe
66
Appendix 6
Protocol for ambulance data process evaluation catch-up interviews
Approximately once a month from October through January, a member of the project team should call their main point of contact in each area (Birmingham, Coventry and Wolverhampton) and conduct a brief discussion/interview to understand how or if the ambulance data has been used for violence prevention (or anything else).
The time of this call should be arranged in advance with the interviewee, and the interviewee should be made aware of the purpose of the interview (to support an evaluation of the use of ambulance data for violence prevention) and should be provided with an opportunity to have any questions answered before agreeing to take part. The interviewee should be made aware that the information they provide in this and any subsequent interviews will be reported anonymously in any subsequent reports or publications unless their express permission is sought to attribute statements.
The interview should be conversational in nature and aim to cover the following main topic areas (though question phrasing and order may change based on the conversation). Following the interview, the interviewer should prepare brief notes organised under each of the main topic areas.
Main topic areas
Introduction: Remind them of why you are calling and the details of the project, and make sure they have a chance to ask questions and have any concerns addressed before you start into the questions.
1. How, if at all, has ambulance data been used in the local area (since we last spoke/since you
started receiving it)?
2. If it has been used:
a. What kinds of analyses have been conducted?
b. Who has used the data?
c. Why was it used in the way it was?
d. Have the uses been primarily informational to this stage, or have there also been
operational activities based on the data?
e. What other kinds of data have been used in conjunction with this data?
f. Have there been any notable impacts from its use?
3. Are there any expectations/plans that it will be used (again) in future operational planning?
If so, how might it be used?
4. What kinds of barriers/issues have you faced in trying to use the data? Possibly prompt
about whether there are:
a. Issues interpreting the data

Using Ambulance Data for Violence Prevention
67
b. Inadequacies in the data/outputs provided
c. Not enough time/workload issues
d. Lack of interest from colleagues/operational police in making use of the data
e. Any other barriers.
5. What uses might be made of the data if some of the barriers/issues were addressed?
6. Is there anything else we should be aware of in terms of your experience with this data?

RAND Europe
68
Appendix 7