Embed Size (px)
Citation preview
Tottori University of Environmental Studies
Faculty of Business Administration
Discussion Paper Series
Using a neural network
for text analysis of sustainability disclosure
Yuriko Nakao, Aya Ishino, Hitoshi Okada
Discussion Paper No. 2018-03
Tottori University of Environmental Studies
Faculty of Business Administration
1-1-1, Wakabadai-kita, Tottori City,
Tottori Prefecture, 689-1111, Japan
1
Using a neural network for text analysis of sustainability disclosure:
Evidence from Japan
Yuriko Nakaoi; Aya Ishinoii; Hitoshi Okadaiii
Abstract
Purpose – The first purpose of this study was to construct a neural network model, which
is one method of machine learning, to analyses top management messages on
sustainability information. The second purpose of this study was to describe the model
constructed by the neural network as a means of environmental and social disclosure
through the use of three mediums: environmental reports, sustainability reports, and
integrated reports.
Design/methodology/approach –We construct a model of a neural network trained with
expert data of sustainability information. In addition, we compared our model with the
text mining software to evaluate its usefulness. Next, we adopt a lot of sustainability
information to the model.
Findings – First, our model shows usefulness compared to the text mining method.
Second, the results tend to that changes in environmental and social descriptions by
sustainability disclosure media for a top management strategy.
Originality/value – First, the special feature of this model consists in its ability to train
sustainability information using data judged by experts. Second, we show that the model
can be adapted to concrete information, there is a processing speed advantage over human
analysis and an availability of archival data.
Keywords Text analysis, Machine learning, Neural network, Environmental reports,
Sustainability reports, Integrated reports, Top management strategy
i Corresponding author, Faculty of Business Administration, Tottori University of Environmental Studies, Email:y-nakao@kankyo-
u.ac.jp
ii Faculty of Business Administration,Hiroshima University of Economics
iii Faculty of Business Administration,Hiroshima University of Economics
2
1. Introduction
Japanese companies are increasingly focusing on addressing environmental and social
issues beyond the requirements of the law (e.g., Amel-Zadeh and Serafeim, 2017).
Companies are now voluntarily disclosing sustainability information(Hahn and Kühnen,
2013; KPMG, 2017). In this study, the disclosure of information related to environmental
and social issues, such as environmental reports (ERs), sustainability reports (SRs), and
integrated reports (IRs), will be referred to as “sustainability information”. From the latter
half of the 1990s, companies were required to disclose sustainability information in
accordance with the guidelines. Such information includes data on companies' global
warming countermeasures, waste information, consumer issues, and internal controls. In
addition, the “top management message” is that there is no major change in the content
described in the revision of the guidelines (e.g. Barkemeyer et al, 2014; GRI, 2016; IIRC,
2013; MOE, 2018). The messages from top management are mainly composed of
descriptive information (henceforth, descriptive information, which in natural language
is referred to as text). Furthermore, these messages indicate the top management's
sustainability strategy for the company1. Hence, by analysing the descriptive information
provided in these messages, it is possible to interpret corporations' attitudes towards
sustainability.
Many researchers have adopted the text mining software2 to analyse textual
information such as messages from top management. However, in text mining, natural
language is processed according to a morphological analysis on basic units of meaning
(hereinafter, “word unit”). Hence, the entire sentence is not processed (Omori, 2014;
Komoda and Nasukawa, 2014). Sustainability information changes according to
institutional measures, such as international environmental policy, and responses to social
aspects. In other words, it is necessary for these types of information to be judged by
experts who can interpret international environmental and social issues. Therefore, in this
study, we adopt a neural network, which is a type of machine learning, for texts with
sustainability information, and incorporate expert judgments as training data. By
comparing the usefulness of this model with the text mining software, we aim at
examining the efficiency of the former in the automatic discernment of texts with
sustainability information.

3
Information concerning ERs has been integrated from the latter half of the 1990s to
the early 2000s, SRs including social reports and governance reports have been added
since the mid-2000s, and sustainability information and financial information since 2010.
These disclosure medium has been changing due to the influence of international
guidelines. The differences in the disclosure medium for sustainability information may
be due to changes in the contents of the environment and social reports issued by the top
management. However, there is no research on the changes in the quantity of description
due to the transition in the disclosure medium. The top management message on
sustainability information is an important way to identify environmental and social issues.
Therefore, it is important to understand the changes in the environmental and social
information in these messages. Accordingly, the second objective of this study was to
apply the neural network model to the top management messages in ERs from 2001 to
2017. The volume of text and disclosure rate of an environment- and social- related texts
based on SRs and IRs is also determined.
This study is structured as follows. Section 2 provides an overview of the changes in
the guidelines related to voluntary sustainability information disclosure. In addition, the
results of a previous study on sustainability information are reviewed, as they constitute
the background of this study. Section 3 presents the research design. Section 4 presents
the results of the current study. Section 5 presents the conclusion.
2. Changes in the guidelines on sustainability information and text analysis research
2.1 Changes in the guidelines on sustainability information
The disclosure of sustainability information is not legally binding, but domestic and
foreign guidelines on the matter have been issued since the late 1990s and revised(e.g.
GRI, 2016; IIRC, 2013; MOE, 2018).Therefore, companies refer to those guidelines and
disclose sustainability information accordingly.
“Guidelines for preparing environmental reports - How to make a well-understood
environmental report,” and in 2001, the “Environmental Report Guidelines (2000
version) - Environment Guidance for report preparation” was published. After this,
revised versions were issued in 2003, 2007, 2012, and 2018by the Ministry of the
Environment.

4
In terms of the international sustainability guidelines, the Global Reporting Initiative
(GRI) guidelines on international SRs incorporated the concept of sustainable
development in 1997, resulting in the issue of the “GRI Guidelines First Edition” in 2000.
After that, the second (G2), third (G3), and fourth editions (G4) were issued in 2002, 2006,
and 2013, respectively, and a new GRI standard was issued in 2016.
The International Integrated Reporting Committee (IIRC) was founded in 2010 with
the intention to develop an information disclosure medium that conveys the value creation
process of the organization to its financial providers. The concepts of the conventional
environmental, social, and economic issues and the financial value of the corporation
were central to this. Then, in 2013, the International Integrated Reporting Framework
(IIRF) was announced.
As described above, the domestic and foreign guidelines on sustainability information
are changing over time. The information disclosure medium has also changed from ERs
to SRs and even IRs.
Inoue (2017) shows the transition of environmental and social activities in Japan in
detail. On the other hand, Idowu et al., (2016) show that comparing the framework of
GRI and ISO 26000 guidelines centered on environmental and social issues with the IIRC
framework included the non-financial value. In addition, Tengblad and Ohlsson (2009)
examined changes over time in the interpretation of the word “CSR” due to environmental
changes surrounding corporations. Their research used content analysis and analysed
keywords related to CSR for about 20 years of CEO statements of 15 Swedish companies'
annual reports. As a result, the terms related to “CSR” in 1981 were “government”,
“import/export”, and “inflation”. Twenty years later, in 2001, the terms related to “CSR”
were “sustainability”, “ethics”, and “morals”. The authors pointed out that the trend of
globalization has affected language related to CSR over time and the interpretation of
CSR is changing.
However, there is no research that shows the differences in the contents of disclosure
that arise from the changes in these guidelines and the difference in the disclosure medium
used by the top management of companies. Furthermore, since the message from top
management is important in the disclosure of sustainability information, it is possible to
determine changes in the views of top management executives on environmental and

5
social issues by investigating the content of disclosed information. Therefore, in this study,
we attempt to clarify the tendencies in the content related to environment and social issues
in the messages from top management.
2.2 Text analysis research on sustainability information
Research on the contents of Japanese sustainability report includes the study of the
frequency tendency of words used in sustainability reports (Otsubo and Huang, 2014;
Nakamura et al., 2015) and sustainability reports (Kawakami et al., 2013; Otsubo and
Huang, 2017; Harimoto et al., 2017), which analyses the relationship between words used
in the Japanese language and other attribute information. In order to study the frequency
of words used in sustainability reports, Otsubo and Huang (2014) used text mining to
determine changes in important aspects emphasized by the person preparing the report.
In their analysis, the words are classified according to attributes such as being business-
related, finance-related, and product-related, and the temporal trends are also considered.
Nakatsu et al. (2015) conducted a trend analysis of words used in environmental reports
from 2010 to 2012. Kawakami et al. (2013) analysed the association between words used
in sustainability reports and other attribute information to determine the relationship
between companies with large environmental conservation costs and the keywords in
environment/corporate social responsibility (CSR).
In addition, Otsubo and Huang (2017) showed the relationship between the frequency
of words used in such reports and the type of reports (Integrated reports, sustainability
reports, etc.). Harimoto et al. (2017) used financial performance as an explanatory
variable, using indicators of CSR activities in sustainability reports extracted with text
mining software as explanatory variables, and found a positive relation between CSR
activities and financial performance. The research shows significant results regarding the
relationship between the trends in the frequency of words used in sustainability reports in
Japan and attributes information with financial performance and others.
In these studies of texts analysis software in English, the relationship with the
difference due to the environmental performance as a characteristic unique to a company
has been analysed (Cho et al., 2010; Cong et al., 2014; Arena et al., 2015; Hummel et
al.,2017). Here, the “environmental performance” is collectively based on the

6
environmentally hazardous substances discharged by companies and environmental
ratings.
However, these studies are based on word units, not sentences. Therefore, analysing
messages from top management on a sentence-by-sentence basis is important. In this
study, we analyse such messages by adopting deep averaging networks (DAN) (Iyyer et
al., 2015), which target sentences.
3. Research design
Figure 1 shows the analysis process of the study. In Step 1, we create training data.
Training data refers to data to be learned for the training of a model in machine learning.
In this study, we created training data by collecting the judgments appropriateness of
experts on the content of the top management message (3.1).
In Step 2, expert data are set as training data. In Step 2, expert data are set as training
data, and a model is constructed that can be automatically judged by a neural network
model (3.2). In Step 3, by comparing the model of the neural network constructed in this
study with the text mining software, we study the usefulness of the model (4.1).
Finally, in Step 4, the neural network model constructed in this study is applied to more
data (54 companies for 17 years [918 reports], for a total of 29,669 sentences) (4.2).

7
Figure 1 Overall analysis process of this study
3.1 Model construction using DAN
In this study, we constructed a model that uses a neural network to automatically judge
whether one sentence on sustainability information describes the environment or
describes social. First, we create training data. In doing so, environmental labels are
manually given to sentences describing the environment, and social labels are given to
sentences describing social. Both environmental labels and social labels are given to
sentences that talk about both topics. Table 1 shows an image obtained by manually
attaching labels to one sentence of sustainability information. Labels given manually are
called correct answer labels.
Step1:Creating training data(3.1)Determination of environmental and social labels of sustainability information
by two experts (70 reports, about 2,000 sentences)
Step 2: Construction of a model using a neural network(3.2)Building a model that automatically judges texts using Deep Averaging Networks
(DAN) through the use of sustainability information judged by experts as training data
Step3:Evaluation of sustainability information
using the neural network model(4.1)Comparison of the neural network model with the existing text mining method
Step4:Application of the neural network model to sustainability information(4.2)
54 companies, applied over 17 years (918 reports), including 29,669;
Results of descriptive trends by three types of disclosure media
(environmental reports, sustainability reports, integrated reports)

8
Table 1 Image of the table obtained by manually attaching both environmental
labels and social labels to one sentence of sustainability information
Sentence Label
At Hitachi, Ltd., we celebrate our centennial in 2010. none
On behalf of the Hitachi Group, I would like to express my gratitude
to all who have supported us over the years. none
The business climate has been extremely tough for Hitachi in recent
years. none
We have accumulated a diverse portfolio of environmental
technologies for creating smarter, more sustainable equipment and
systems in everything from power to transportation to water
systems.
environmental
Our greatest strength is that we can deliver comprehensive solutions
for the entire social infrastructure. social
As I look out globally, the opportunities have increased greatly for
us to help governments fulfil their missions of accomplishing
economic growth while safeguarding the environment and
supporting healthy lifestyles.
environmental,
social
For the creation of training data, we used, as a result of the judgment, labels of labels
of an environment, social, and laboratory sentences (sentence of the training data are
paraphrased) for each sentence about sustainability information of about 70 Japanese
reports (about 2,000 sentences) issued from 2001 to 2017. Data were given environmental
labels, social labels, and in other words, called “correct labels”. Table 2 shows the results
of the experts” judging of correct labels.
Table 2 Creation of training data:
Number of correct labels given by experts for sustainability information
Environment label Social label
987 984

9
3.2 Automatic Judgment Method for Environmental and Social Labels Using a Neural
Network
For machine learning, a deep averaging network (DAN) (Iyyer et al., 2015), a type of
neural network, was adopted. Figure 1 illustrates the automatic labelling method with
DAN for judging environmental labels. The horizontally elongated rectangle in the figure
is a schematic representation of a feature vector to be input into and output from DAN.
In this study, we can estimate by using the function of converting words into vectors. The
functions used below are those used in machine learning.
Figure 2 Diagram of the automatic judgment method of
DAN’s environmental labels
As shown in Figure 2, the input to DAN was one sentence from the sustainability
information. The sentence was divided into words, and each word was transformed into
portfolio
of
environmental
technologies
.
・・・
presence or absence
Environmental label
One sentence from the sustainability information
10
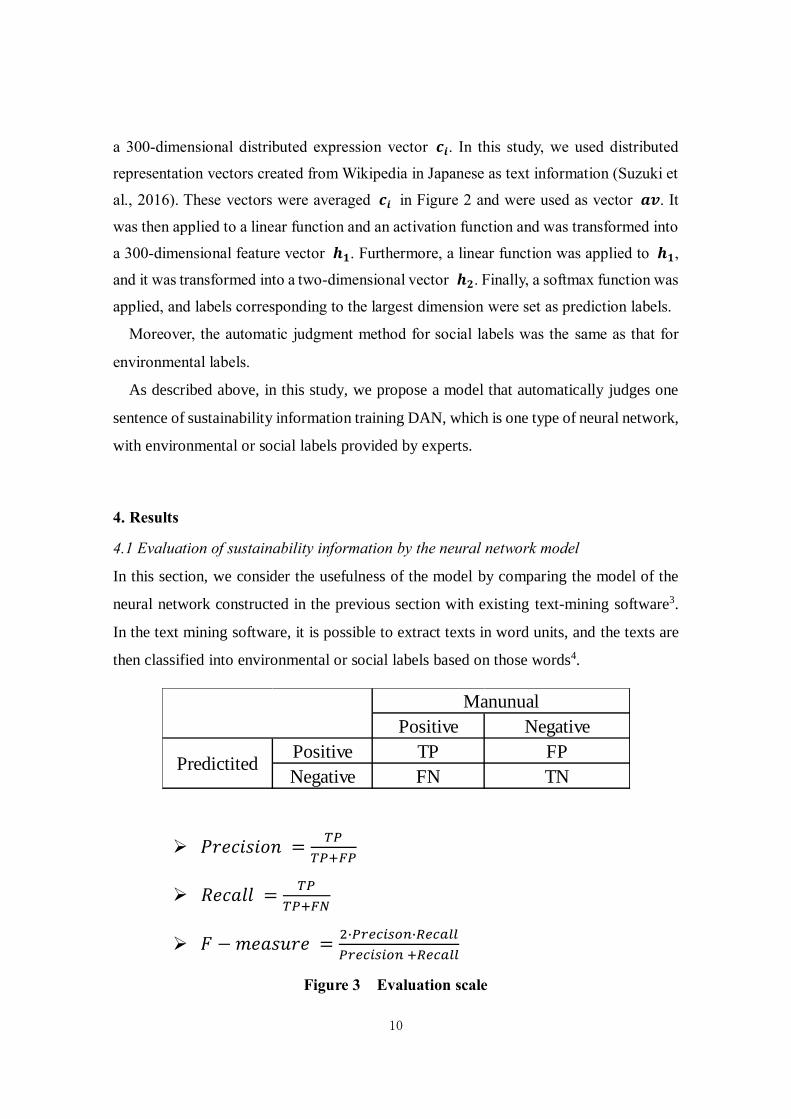
a 300-dimensional distributed expression vector 𝒄𝒊. In this study, we used distributed
representation vectors created from Wikipedia in Japanese as text information (Suzuki et
al., 2016). These vectors were averaged 𝒄𝒊 in Figure 2 and were used as vector 𝒂𝒗. It
was then applied to a linear function and an activation function and was transformed into
a 300-dimensional feature vector 𝒉𝟏. Furthermore, a linear function was applied to 𝒉𝟏,
and it was transformed into a two-dimensional vector 𝒉𝟐. Finally, a softmax function was
applied, and labels corresponding to the largest dimension were set as prediction labels.
Moreover, the automatic judgment method for social labels was the same as that for
environmental labels.
As described above, in this study, we propose a model that automatically judges one
sentence of sustainability information training DAN, which is one type of neural network,
with environmental or social labels provided by experts.
4. Results
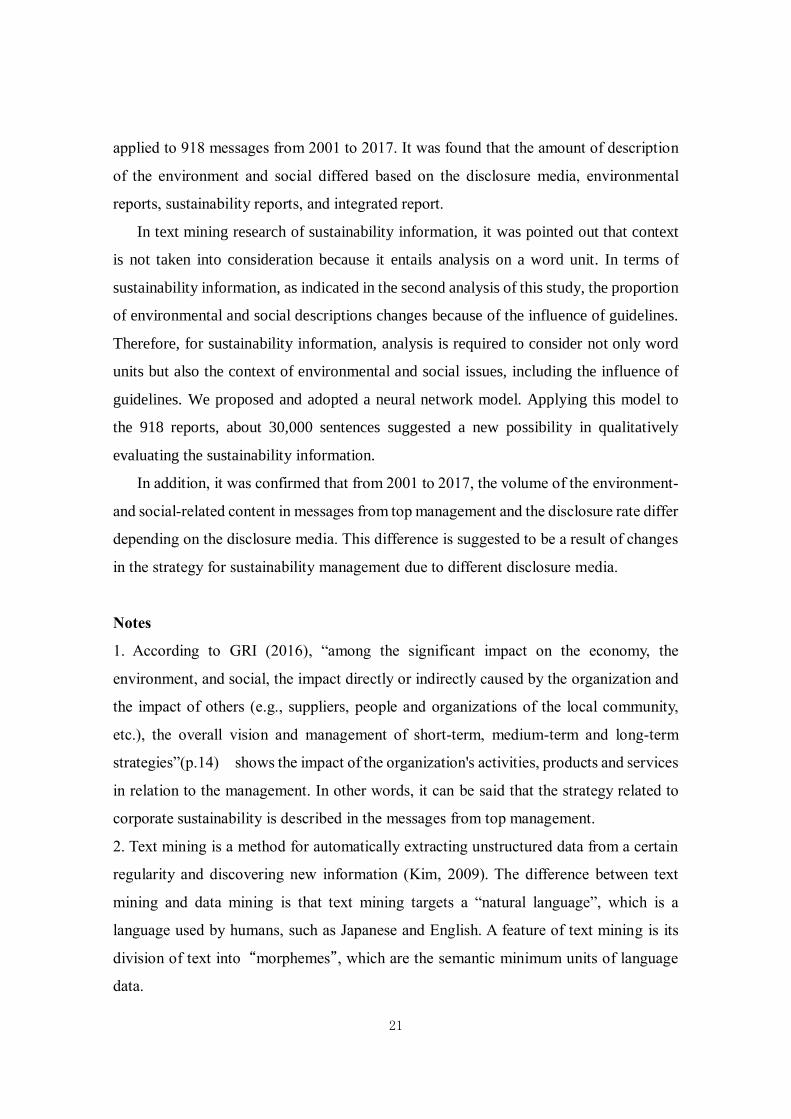
4.1 Evaluation of sustainability information by the neural network model
In this section, we consider the usefulness of the model by comparing the model of the
neural network constructed in the previous section with existing text-mining software3.
In the text mining software, it is possible to extract texts in word units, and the texts are
then classified into environmental or social labels based on those words4.
Figure 3 Evaluation scale
Positive Negative
Positive TP FP
Negative FN TN
Manunual
Predictited

11
In addition, we explain how we evaluated the results of machine learning methods.
Figure 3 shows the evaluation scale. The evaluation scale consists of “precision”
indicating the proportion that it is a correct answer, “recall” indicating the proportion of
the correct answer included in the prediction result. An F-measure indicates “harmonic
mean” of “precision” and “recall”. Then, we conducted a 5-fold cross-validation test.
Table 3 Evaluation of sustainability information:
Comparison of text mining software and neural network
Method Environmental label Social label
Precision Recall F-measure Precision Recall F-measure
Text mining
software 0.819 0.403 0.540 0.699 0.403 0.513
Neural network 0.723 0.702 0.713 0.723 0.691 0.706
The numerical values of each evaluation scale are shown in Table 3. For the
environmental label, the “precision” of the method using text-mining software was 0.819,
which is 0.096 points higher than the method using a neural network. However, the “recall”
of the neural network was 0.229 points, which is higher than that of text mining. This
result implies that the method using the neural network has less leakage in selecting the
environmental label. Since the “recall” was improved through the neural network method,
the F-measure, which is a comprehensive evaluation, could be improved by 0.173 points.
With social labels was more effective than the text-mining method for all evaluation
indices in “precision” “recall,” and “F-measure”. Especially, social labels have shown
high values of “F-measure” by 0.193 points than one. In other words, these results show
that the neural network constructed by expert judgment is more useful than text mining
software.
In the next section, we will take advantage of the characteristics of the neural network,
and apply it to 918 reports and 29,669 sentences. In this study, the evaluation of
approximately 70 reports and 2,000 sentences by experts (manual analysis) took about
two weeks (1-2 hours per day). On the other hand, the subsequent automatic prediction

12
using a neural network model took only a few minutes, which is overwhelmingly
advantageous in terms of speed compared to conventional manual analysis.
4.2 Trends in environmental and social descriptions based on disclosure medium
4.2.1 Changes in the number of sentences in the disclosure medium
In this study, the sustainability information disclosure medium is classified into the
following three.
(1) Environmental Reports (ERs): Reports not including social information affected by
the “Environmental Reporting Guidelines” published by the Ministry of the Environment
before and after the 2000s.
(2) Sustainability Report (SRs): Reports that includes sociality reports including labour,
human rights, and consumer issues of companies affected by international GRI guidelines.
(3) Integrated Report (IRs): In response to the impact of the international integrated
framework, a report that includes annual reports (ARs) in a report that integrates financial
reporting and non-financial reporting on the environment, social, and governance.
Figure 4 Change in disclosure medium: Environmental Reports (ERs),
Sustainability Reports (SRs), and Integrated Report (IRs/ARs): 2001 - 2017
0
10
20
30
40
50
60
年
ERs
SRs
IRs・Ars

13
For the reports of 54 companies covered in this study, it is shown in Figure. Three as a
secular change from 2001 to 2017 for each of the three types of information disclosure
medium. In addition, the 918 total reports from 2001 to 2017 may be categorized as
follows: 187 ERs, 645 SRs, and 86 IRs/ARs of and the total report total are 918.
From Figure 3, although ERs occupied most of the information disclosure medium in
2001, it decreased with the year and was not issued in 2011. Second, as the ERs has
decreased, SRs has increased since 2001. From this, it was recognized that companies
entering the information disclosure medium from ERs to SRs increased. SRs has been on
a downward trend since around 2012 as the number of issues peaked in 2006. Meanwhile,
IRs/ARs appeared in 2008, and since 2012 it has been decreasing to SRs; however, it is
almost increasing trend with the year, but the issue number is less than SRs. In addition,
the degree of reduction of SRs is smaller than the degree of reduction of ER s, and the
degree of increase in IRs/ARs is gentle. For this reason, although an increase in the
number of corporations that move information disclosure media from SRs to IRs/ARs is
recognized, the degree is small. At this time, it can be said that SRs, not IRs/ARs, is the
mainstream of corporate information disclosure media.
4.2.2 Number of environment / social description by disclosure medium
The automatic judgment of environmental and social sentences was done by applying the
neural network model constructed in this study to the total top management message of
sustainability information management messages from 2001 to 2017, 54 companies, total
918, 29,669 sentences.
Table 4 Average number of sentences in the top message of ERs,
SRs and IRs /ARs
Disclosure
medium
Average
number of
sentences
Average
number of
sentences in
environment
Average
number of
sentences in
social
Proportion of
sentences in
environment
Proportion
of sentences
in social
ERs 20.07 11.40 5.16 0.59 0.23
SRs 32.73 13.66 15.22 0.43 0.47
IRs/ARs 55.83 10.40 16.73 0.22 0.35

14
Table 4 shows the average number of sentences in the top message of ERs, SRs and
IRs/ARs, the number of sentences in the environment and social, and their proportion.
The “number of sentences” in the second column of Table 3 is not the subject of automatic
judgment in the neural network which is the text of the top management message to be
analysed. Of the sentences, they show the average value of the number of sentences in
the environment automatically determined by the model of the neural network, the
number of sentences in social, and the proportion of both the number of sentences in the
environment and the number of sentences in social to the number of sentences per
company as the denominator.
From Table 4, the average number of sentences in top messages of ERs, SRs, and
IRs/ARs has increased to 20.07, 32.73 and 55.83 respectively. In particular, IRs/ARs has
increased to over 2.5 times the ERs. It is thought that it led to an increase in the volume
of sentences due to the position of the report that includes the financial report in addition
to the conventional environment/social.
A comparison of the number of sentences in the environment with the number in social
shows that the average number of sentences in the environment of ERs is 11.40, whereas
the number of sentences in social is 5.16; moreover, ERs has more descriptions of the
environment than in social. In SRs, the average number of documents in the environment
is 13.66, the number of sentences in social is 15.22, and the number of sentences in social
and the environment is comparable. In IRs/ARs, the average number of sentences in the
environment is 10.40, the number of sentences in social is 16.73, and the number of
sentences in social is larger than that in the environment.
These trends are also remarkably reflected in the proportion of sentences in the
environment and in social. That is, the proportion of environmental sentences in ERs
reaches 0.59, and the number of sentences in social is 0.23. In SR, the percentage of
sentences in the environment and those in social are 0.43 and 0.47, respectively, which
are quite similar. In IRs/ARs the proportion of environmental sentences is 0.22, the
number of sentences in social is 0.35, and the proportion of sentences in social is large.
However, IRs/ARs features a large number of sentences including financial reports;
therefore, the value itself of the proportion of environmental and social texts is low overall.
Next, Figure 5 through Figure 7 show the distribution with scattering diagrams of

15
environmental and social proportion in the top messages of ERs, SRs and IRs/ARs,
respectively. In each figure, a regression equation of data and a dashed line at 45 degrees
from the origin are described.
Figure 5 Environmental proportion and social proportion of ERs (2001 - 2017)
Figure 5 indicates that although the data variation is large in the ERs, the proportion of
sentences concerning the environment as a whole is large as well. Next, Figure 6 shows
that although the proportion of sentences in the environment and social varies greatly in
SRs, many data gather in the centre. Although many corporations describe with emphasis
on either the environment or social, this indicates that there are many companies that
describe both the environment and social in a well-balanced manner. In addition, as shown
in Figure 7, although data variations are still recognized in IRs/ARs, the percentage of
y = -0.0075x + 0.2357
0
0.1
0.2
0.3
0.4
0.5
0.6
0.7
0.8
0.9
1
0 0.1 0.2 0.3 0.4 0.5 0.6 0.7 0.8 0.9 1
Proportion of environment
Proportion of social

16
social's description is large overall.
Figure 6 Environment proportion and social proportion of SRs (2001 - 2017)
y = -0.0518x + 0.491
0
0.1
0.2
0.3
0.4
0.5
0.6
0.7
0.8
0.9
1
0 0.1 0.2 0.3 0.4 0.5 0.6 0.7 0.8 0.9 1
Proportion of environment
Proportion of social

17
Figure 7 Environment proportion and social proportion of IRs/ARs (2001 - 2017)
4.2.3 Long-term change in the proportion of environment and social description by
disclosure medium
It shows the secular change of the proportion of sentences of environment and social in
each disclosure medium. As shown in Figure 3, the number of issuing companies has
decreased sharply since 2006. Figure 8 shows the trends of the proportion of the number
of sentences in the environment and social in the ERs from 2001 to 2005 when the number
y = 0.7069x + 0.1882
0
0.1
0.2
0.3
0.4
0.5
0.6
0.7
0.8
0.9
1
0 0.1 0.2 0.3 0.4 0.5 0.6 0.7 0.8 0.9 1
Proportion of environment
Proportion of social

18
of data is large. According to Figure 8, in the ERs, the proportion of sentences in the
environment is almost 60%, but from the proportion of social sentences 17% to 37%. This
is considered to be due to an increase in the description requirement on social as a result
of the revision of the “Environmental Reporting Guidelines” in 2003 and the
dissemination of GRI guidelines, the description on social increased.
Figure 8 Trends of the proportion of average number of sentences in the
environment and social in the ERs from 2001 to 2005
Next, concerning SRs, the trends of the proportion of sentences of the environment and
social from 2001 to 2017 is shown in the figure. As shown in Figure 9, the proportion of
sentences in the environment in SRs, as in ERs, exceeded the proportion of sentences in
social until 2004; from 2006 to 2010, however, the proportion of sentences in the
environment and social were almost the same, in 2011. The sentence of social exceeds
the proportion of sentences in the environment. Again, along with the spread of GRI,
0
0.1
0.2
0.3
0.4
0.5
0.6
0.7
Proportion ofenvironment
Proportion ofsocial

19
which is a guideline for SRs, it is considered that the disclosure proportion on social
increased over time.
Figure 9 Trends of the proportion of average number of sentences in the
environment and social in the SRs from 2001 to 2017
In IRs/ARs, the number of issuing companies has increased since 2012, as shown in
Figure 9 shows the secular change in the proportion of the number of sentences in the
environment and in social at IR/AR from 2012 to 2017 when the number of data is large.
Figure 10 shows that in IR/AR, the proportion of sentences in social exceeds the
proportion of sentences in the environment. This is considered to be strongly influenced
by international integrated claim work which emphasizes the description on social.

20
Figure 10 Trends of the proportion of average number of sentences in the
environment and social in the IRs/ARs from 2012 to 2017
As described above, the disclosure of environmental and social information in each
information disclosure medium is influenced by the transition of the guidelines to be
referred to; moreover, the proportion of sentences is changed with the passage of time for
the neural network model of this study.
Therefore, this approach was clarified by automatic judgment. From this, it can be said
that the model constructed in this article has high utility in application to text analysis.
5. Conclusion
We applied the neural network to analyse text concerning sustainability information in
the messages of top management. We compared the model trained with expert data that
had judged environment and social texts with the conventional text mining method. The
constructed model exhibited better evaluation abilities. The constructed model was
0
0.1
0.2
0.3
0.4
0.5
0.6
0.7
Proportion ofenvironment
Proportion ofsocial
21
applied to 918 messages from 2001 to 2017. It was found that the amount of description
of the environment and social differed based on the disclosure media, environmental
reports, sustainability reports, and integrated report.
In text mining research of sustainability information, it was pointed out that context
is not taken into consideration because it entails analysis on a word unit. In terms of
sustainability information, as indicated in the second analysis of this study, the proportion
of environmental and social descriptions changes because of the influence of guidelines.
Therefore, for sustainability information, analysis is required to consider not only word
units but also the context of environmental and social issues, including the influence of
guidelines. We proposed and adopted a neural network model. Applying this model to
the 918 reports, about 30,000 sentences suggested a new possibility in qualitatively
evaluating the sustainability information.
In addition, it was confirmed that from 2001 to 2017, the volume of the environment-
and social-related content in messages from top management and the disclosure rate differ
depending on the disclosure media. This difference is suggested to be a result of changes
in the strategy for sustainability management due to different disclosure media.
Notes
1. According to GRI (2016), “among the significant impact on the economy, the
environment, and social, the impact directly or indirectly caused by the organization and
the impact of others (e.g., suppliers, people and organizations of the local community,
etc.), the overall vision and management of short-term, medium-term and long-term
strategies”(p.14) shows the impact of the organization's activities, products and services
in relation to the management. In other words, it can be said that the strategy related to
corporate sustainability is described in the messages from top management.
2. Text mining is a method for automatically extracting unstructured data from a certain
regularity and discovering new information (Kim, 2009). The difference between text
mining and data mining is that text mining targets a “natural language”, which is a
language used by humans, such as Japanese and English. A feature of text mining is its
division of text into “morphemes”, which are the semantic minimum units of language
data.

22
3. In this study, IBM SPSS Text Analytics was used for Surveys 4.0, which is widely used
in academia.
4. The number of words classified in the environment and social categories that were
extracted using text mining software are 533 and 115, respectively. The words
corresponding to both are 115.
References
Amel-Zadeh, A. and Serafeim, G. (2017), “Why and how investors use ESG information:
Evidence from a global survey,” working paper, Harvard Business
School Accounting & Management Unit, July. Available at
https://ssrn.com/abstract=2925310 or http://dx.doi.org/10.2139/ssrn.2925310
Arena, C., Bozzolan, S. and Michelon, G. (2015) , “Environmental Reporting:
Transparency to Stakeholders or Stakeholder Manipulation? An Analysis of
Disclosure Tone and the Role of the Board of Directors,” Corporate Social
Responsibility and Environmental Management, Vol. 22, No. 6, pp. 346-361.
Barkemeyer, R., Comyns, B., Figge, F., and Napolitano, G. (2014), “ CEO statements in
sustainability reports: substantive information or background noise?,” Accounting
Forum, Vol.38, No.4,pp. 241–257.
Cho, H. G., Roberts, R. W. and Patten, D. M. (2010) , “The Language of US Corporate
Environmental Disclosure,” Accounting Organizations and Society, Vol. 35, No. 4,
pp. 431-443.
Cong, Y., M, Freedman. and Park, D. (2014) , “Tone at the Top: CEO Environmental
Rhetoric and Environmental Performance,” Advances in Accounting, Vol. 30, No. 2,
pp. 322-27.
GRI (Global Reporting Initiative) (2016) Consolidated Set of GRI Sustainability
Reporting Standards.
Hahn, R. and Kühnen, M. (2013), “Determinants of sustainability reporting: a review of
results, trends, theory, and opportunities in an expanding field of research,” Jounal of
Cleaner Production, No.59, pp. 5–21.
Harimoto, S., Ueno., S. and Ouchi, K. (2017), “Quantitative analysis of CSR activity by
text mining analysis of relationship between CSR activities based on analysis and
financial performance,” Management Information Society National Studies
Announcement Competition Summary, pp. 131 – 134 (in Japanese).
Hummel, K., Mittelbach-Hoermanseder, S., Cho,. H. and M., D. (2017) Implicit Versus
Explicit Corporate Social Responsibility Disclosure: A Textual Analysis (December
20, 2017). Available at SSRN: https://ssrn.com/abstract=3090976 or

23
http://dx.doi.org/10.2139/ssrn.3090976
Idowu, S., Dragu, I.M.,Tiron-Tudor, A., and Farcas, T.V. (2016), “From CSR and
Sustainability to Integrated Reporting,” Inderscience Enterprises, Vol. 4. No.2,
pp.134-151.
IIRC(nternational Integrated Reporting Council) (2013) Consultation draft of the
international < IR > framework.
Inoue, N. (2017), “Genealogies of transition from environmental management to
sustainable management,”Bulletin of Kobe Yamate University, No. 19, pp. 11-47. (in
Japanese).
Iyyer, M., Manjunatha, V., Boyd-Graber, J. and Daumé III, H. (2015), “Deep unordered
composition rivals syntactic methods for text classification”, in Proceedings of the
53rd Annual Meeting of the Association for Computational Linguistics and the 7th
International Joint Conference on Natural Language Processing, 2015, Vol. 1, pp.
1681-1691.
Kawakami, N., Nakajo, Y., Park, Ginzaku. and Maeda, T. (2013), “Environmental cost by
text mining time-series analysis of factors for expenditure,” Summary of the National
Association of Management Information Society Conference, pp. 173-176(in
Japanese).
Kim, M. (2009), Introduction to statistical science of text data. Tokyo:Iwanami Shoten.
(in Japanese).
Komoda, F. and Nasukawa,.T. (2014), Text mining as a technology strategy to make use
of big data, Tokyo:Chuo Keizai Press (in Japanese).
KPMG(2017) Corporate responsibility (CR) reporting survey.
https://home.kpmg/xx/en/home/insights/2017/10/the-kpmg-survey-of-corporate-
responsibility-reporting-2017.htmlAccessed 10 Feb 2019.
Omori, O. (2014), "A Study on Practice Method of Knowledge Discovery in Corporations
and Organizations: Discovery of Knowledge by Integrating Text Mining and
Structuralization Theory of Knowledge," Saitama University Ph.D. thesis 94, 2014-
03-24(in Japanese).
Otsubo, S. and Huang, H. (2017), “Attempts to categorize non-financial reports” German
cooperative economy, No. 100, pp. 93-99 (in Japanese).
MOE (the Ministry of the Environment) (2018) Environmental Report Guidelines” (in
Japanese).
Nakatsu, Y., Takabayashi, T. Oka, Y., Yamamoto, Hisashi. and Maruyama, Y. (2015),
“Text mining One indicator of corporate / industry type analysis using - the case of
environmental report in 2010 and 2012,” horizontal stem, Vol. 9, No. 2, pp. 95-103(in

24
Japanese).
Suzuki, M., Matsuda, K. Sekine, S,. Okazaki,N. and Kiyoshi, K.(2016), “Multiple
granting of extended named expression labels in description of Wikipedia,” The 22nd
Annual Conference of the Society of Language Processing (NLP2016), March 2016.
Tengblad, S., and Ohlsson, C. (2009), “The framing of corporate social responsibility and
the globalization of national business systems: a longitudinal case study,” Journal of
Business Ethics, Vol.93, No.4, 653–669.