Embed Size (px)
Citation preview

1
INTERNATIONAL PERSPECTIVES ON STUDENT ASSESSMENT
Using a measurement paradigm to guide classroom assessment processes
Lecture presented by Dr Sandy Heldsinger, University of Western Australia
Winter 2008 lecture series, co‐sponsored by the University of Calgary and the University of Alberta Much of our work in educational assessment sets up dichotomies. We make a distinction between criterion‐and norm‐ referenced assessment. We talk about summative as opposed to formative judgements. Pen and paper tests are set up in contrast to performance tasks. We value teacher judgement but are often hostile towards standardized testing. Perhaps the starkest dichotomy we create is the one between curriculum and assessment. Are these dichotomies fundamental or are they merely a matter of emphasis? I would like to explore this question with you and in doing so I hope to consolidate our understandings of the purpose and value of student assessment, be it as classroom teachers or as test developers. I will begin this lecture with a discussion of concepts inherent to a measurement paradigm and I will show a short video clip of a classroom activity which I hope will contextualise these concepts. I will then show how these concepts apply to tests that consist of questions and answers and how they apply to marking rubrics. My overarching intention in this lecture is to show why teacher observation is at the heart of all our work in assessment. We are all familiar with physical measurement, having measured and used measurements of such things as length, temperature and mass in every day life. In such contexts however, we generally have no involvement in the construction of measuring instruments. Consequently, in these contexts we are users of measuring instruments, and measurement is merely an act in which an already constructed instrument is used to obtain measurement of an attribute such as length.

2
In education we have to construct our measuring instruments. Obtaining measurement, in the classical definition of the term, requires specialist knowledge and teachers do not necessarily have either the expertise or the time to devise assessments that provide measurement. I however want to draw on concepts inherent to a measurement paradigm, to show how teachers can refine their assessment processes to obtain good information about student growth. The concept of a continuum is central to a measurement paradigm and we need to examine this concept in the context of student development. The other concept which is important and which I will discuss is that of latent and manifest ability. The Collins English Dictionary defines a continuum as ‘a continuous series or whole, no part of which is perceptibly different from the adjacent parts.’ The emphasis needs to be on perceptibly. The adjacent parts on a continuum are different. Perceiving those differences at a very fine grained level is however difficult. Consider the passage of time. Although time has passed in the last few days, it is difficult to discern changes in the quality of light. But after a longer period of time has passed, the changes in light are more discernible. We can easily distinguish between a winter day and a spring day. A teacher reaching the end of a year of teaching is acutely aware of how much progress her students have made, particularly when contemplating starting the next year with a new cohort of students. The progress made on a daily or weekly basis, however is harder to discern. This is further complicated by the sense that students do not continually go forward, but that they sometimes appear to regress. Standing back, it is easy to appreciate the development made from the time a student starts school to the time that they leave. Appreciating the development that takes place on a daily basis is more complex. Although development or growth is conceptualised in many different ways, a general feature of the concept of development is that it is the process by which an individual builds upon previous learning in a progressive fashion. That is, growth is inherently cumulative which is the basic feature of any quantitative attribute. It is stressed that this does not imply growth is simply a process of cumulative addition of skills and factual knowledge; however it

3
implies learning builds upon the product of prior learning to form a greater cognitive capacity. Increasingly the terms developmental and continuum are used in education but it has been my experience that we do not very often stop to consider the concepts from which the terms arise. I contend that when we use the term developmental continuum in education we are referring to the very fine changes in student ability that occur as students build upon the products of prior learning to form a greater cognitive ability. We now need to consider the concept of latent and manifest ability. I would like you to imagine Roger Federer in a situation where he is working on behalf of UNICEF. I do not think anybody would deny that at that point in time Federer has tennis ability, it is just that his ability can not be observed ‐ it is latent. Now imagine watching Federer in a grand slam match. In this context his tennis ability is clearly observable – it is manifest. Teachers continually place students in situations that allow them to observe students’ ability ‐ make their ability manifest. They use a broad range of techniques from simply talking with their students to questioning and probing their students, from providing short tasks or extended project work to administering standardised tests. Let us now look at the concepts of a developmental continuum and manifest and latent ability in action in a classroom. This video clip is of a teacher who has a mixed group of students who are in pre‐primary, the year before compulsory schooling in Western Australia and year 1, the first year of compulsory schooling. The video recording of the teacher was made over two days and an analysis of her teaching practices is part of a much larger study of student growth. This brief extract shows a period in the day when the teacher has just finished one activity and is waiting to start the next and she is using the time to quiz her students. She asks her students to distinguish between short and long words, to say a word omitting its initial sound or its middle sound, to construct compound words and to distinguish between sounds. There is nothing arbitrary about the game the teacher is playing with the students. In my analysis of the activity I would say she has a very good understanding of the latent developmental continuum. She appreciates which skills and understandings precede others and she is using the game as an

4
opportunity to check where students are in relation to these skills and understandings. She understands the relationships between skills. When a student drops a phoneme when constructing a compound word, she turns what is essentially an assessment exercise into a teaching opportunity. Consider the concept of a continuum and the concept of latent and manifest ability in relation to the range of documents we use in education and the range of assessment processes we use. Syllabus documents describe what students need to be taught to move them further along the developmental continuum. Outcomes frameworks describe what learning looks like at points or stages along the developmental continuum. Assessments, the full range of assessments that teachers use from observations to standardised tests are all attempts to understand a student’s ability relative to the latent developmental continuum. I imagine that our curriculum documents have largely arisen from teachers observing which skills and understandings precede others and by analysing how learning builds on the products of prior learning. I would however add the caution that we do not have the language to capture the fine changes that happen in student development and that no matter how carefully crafted our curriculum documents are, they can only provide coarse grained information. This is a point I will pick up on later. When we view our work in education from the perspective of the latent developmental continuum, it becomes apparent that the dichotomy between curriculum and assessment is not a fundamental one. Similarly, whilst the distinctions we make between teacher assessments and standardised testing and between multiple choice questions and performance assessment help us understand the different features of the assessment types, all assessments share a common purpose – to elicit information about students’ positions on the underlying developmental continuum. I would now like to look in detail at the more formal assessments we construct. I hope to show that if we conceptualise student ability in terms of a continuum, and we devise assessment processes to replicate as far as possible the ordering of the underlying developmental continuum, we will obtain good information about student growth.

5
I will firstly take you through a idealised test of numeracy skills – the type of pen and paper test that we are all familiar with. I will then look at the assessment of written performances. In both instances my overarching question is, ‘How can teachers refine their assessment processes to obtain deeper understandings of the nature of student development and growth?’ The idealised numeracy test (slide 1) consists of five questions. In devising the test, the teacher would be aware of the skill assessed by each item, and would be able to describe those skills (slide 2). Slide 1
Stylised Stylised numeracynumeracy testtest
Slide 2
Skills assessedSkills assessed
Q1. Subtraction of one digit numbers
Q2. Reduction of a fraction by a factor of two
Q3. Multiplication of two digits by one digit
Q4. Addition of two digit numbers, with carrying
Q5. Addition of two digit numbers, with no carrying
Let’s say the teacher administers the test to five students and calculates their total scores (slide 3). The general accepted interpretation of total scores is that the student with the highest total score is the most able, and the student with the lowest total score is the least able. The teacher arranges the test results to reflect this (slide 4). On this test Tim is the weakest student. Clare is the strongest. Slide 3
Student results Student results –– total scores calculatedtotal scores calculated
Slide 4
Student results ordered from least able to Student results ordered from least able to most ablemost able

6
To obtain a better understanding of what the total score means in relation to the skills needed to obtain that total score, the teacher arranges the questions from the easiest question (the question most students answered correctly) to the hardest question (the question the least students answered correctly). She then inserts into the data matrix the descriptions of the skills needed to answer the question correctly (slide 5 and 6). Slide 5
Student results ordered from easiest Student results ordered from easiest question to hardest questionquestion to hardest question
Slide 6 H ave students met the criteria? H ave students met the criteria?
H ow far into the sequence have they H ow far into the sequence have they moved?moved?
In arranging the test results in this way it becomes apparent that Tim can subtract one digit numbers, but he can not as yet add two digit numbers. Clare on the other hand demonstrated that she has mastered all the skills including the most difficult which required her to reduce fractions by a factor of two. Obviously this test is highly idealised and it is unlikely that a test would assess such a breadth of development, nor that a teacher would have the hardest question in the test as the second question. This example is however useful in demonstrating how a test can be constructed to reveal information about the underlying developmental continuum and information about students’ ability in relation to that developmental continuum. The example also highlights that the dichotomies of formative and summative assessments; and of criterion‐ and norm‐referenced assessment, are in fact simply a matter of emphasis. The teacher knows where Tim is at that point in time, but also has information about what needs to be taught next. The teacher could generate normative information such as the mean score, but she also has information about the skills the students demonstrated in order to obtain total scores. ‘How can teachers refine their assessment processes to obtain deeper understandings of the nature of student development and growth?’ My answer to the question in
7
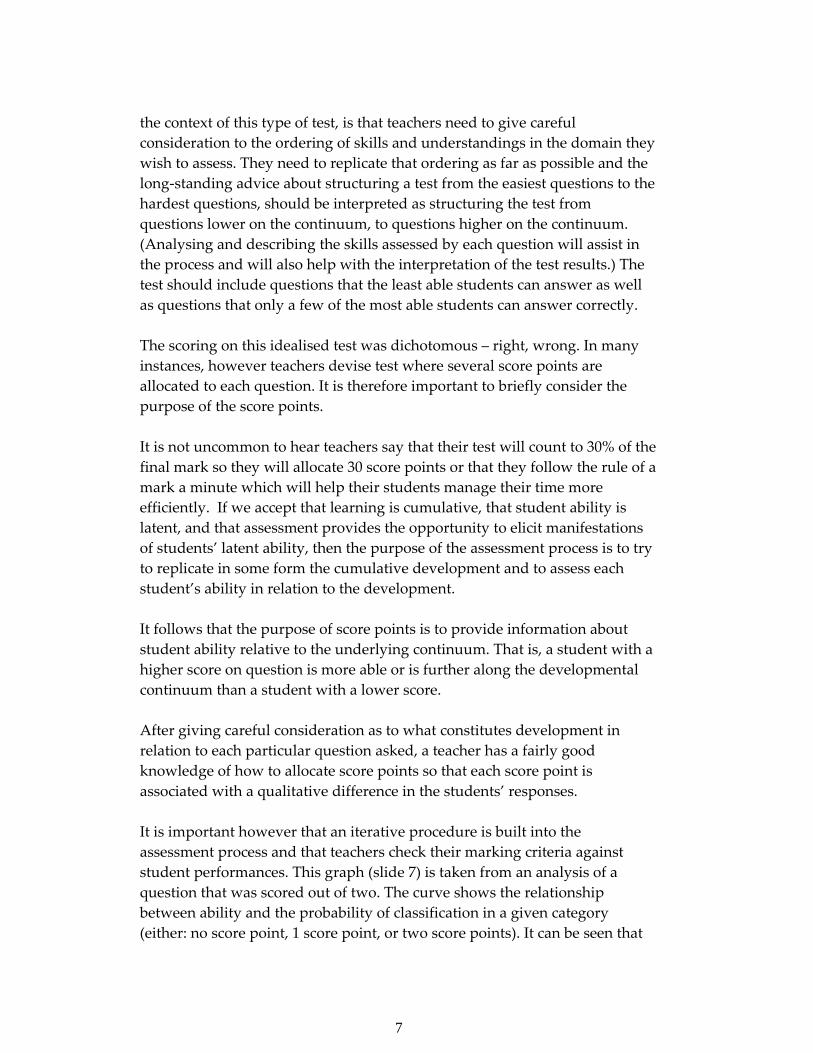
the context of this type of test, is that teachers need to give careful consideration to the ordering of skills and understandings in the domain they wish to assess. They need to replicate that ordering as far as possible and the long‐standing advice about structuring a test from the easiest questions to the hardest questions, should be interpreted as structuring the test from questions lower on the continuum, to questions higher on the continuum. (Analysing and describing the skills assessed by each question will assist in the process and will also help with the interpretation of the test results.) The test should include questions that the least able students can answer as well as questions that only a few of the most able students can answer correctly. The scoring on this idealised test was dichotomous – right, wrong. In many instances, however teachers devise test where several score points are allocated to each question. It is therefore important to briefly consider the purpose of the score points. It is not uncommon to hear teachers say that their test will count to 30% of the final mark so they will allocate 30 score points or that they follow the rule of a mark a minute which will help their students manage their time more efficiently. If we accept that learning is cumulative, that student ability is latent, and that assessment provides the opportunity to elicit manifestations of students’ latent ability, then the purpose of the assessment process is to try to replicate in some form the cumulative development and to assess each student’s ability in relation to the development. It follows that the purpose of score points is to provide information about student ability relative to the underlying continuum. That is, a student with a higher score on question is more able or is further along the developmental continuum than a student with a lower score. After giving careful consideration as to what constitutes development in relation to each particular question asked, a teacher has a fairly good knowledge of how to allocate score points so that each score point is associated with a qualitative difference in the students’ responses. It is important however that an iterative procedure is built into the assessment process and that teachers check their marking criteria against student performances. This graph (slide 7) is taken from an analysis of a question that was scored out of two. The curve shows the relationship between ability and the probability of classification in a given category (either: no score point, 1 score point, or two score points). It can be seen that

8
in the lower range of ability, there is a higher probability of being scored 0, than 1 or 2, in the middle ability range there is a higher probability of being scored 1, over 0 or 2, and in the top ability range, there is a higher probability of being scored 2 over 0 or 1. This is an example of a question in which each score point provides meaningful information about students’ development. That is the thresholds are ordered. Slide 7
PolytomouslyPolytomously scored items in which each scored items in which each score point contributes meaningful score point contributes meaningful
informationinformation
Slide 8 PolytomouslyPolytomously scored item in which each scored item in which each score point does not provide meaningful score point does not provide meaningful
information information
Figure 4.11: Example of disordered thresholds
This figure (Slide 8) shows a question in which thresholds are disordered, in that there is no region in the ability range that students have a higher probability of being scored score 1 over either a score of 0 or 2. In this instance the score point of 1 is not providing any meaningful information. A range of factors may result in disordered thresholds, including the arbitrary allocation of score points, an incorrect hypothesis of qualitative differences, or problematic marking. The type of analysis and the resultant displays described here will not be possible for most teacher devised assessments. However, much can be achieved by careful consideration of what constitutes a higher order response. From my experience as a test developer, I would argue that all marking keys and rubrics can only be developed after careful scrutiny of students’ answers. I may begin the marking process with a hypothesis of what constitutes a qualitatively better answer, and will therefore be scored more highly, but I need to check this hypothesis against the student answers. If marking guides are developed in this way, then it is highly likely that all or nearly all score points provide meaningful information about student growth.

9
I began this lecture by explaining that student development is the process by which an individual builds upon previous learning in a progressive fashion. I went on to explain that this development is latent and teachers use a breadth of techniques to make manifest that ability. The idealised test I have just taken you through is illustrative of one of the more formal ways teachers try to observe student ability. If short answer tests are to provide good information about student ability in relation to the underlying developmental continuum, then it is important that the test, including the scoring, replicates as far as possible the ordering of performances that are a manifestation of underlying student ability on the latent continuum. I would now like to look more closely at rubrics. Rubrics are an extension of this work as they articulate why one performance is better than another (which implies a student is further along the developmental continuum). In recent years much has been published about the use of rubrics and there are strong advocates for the use of rubrics. They are seen as a quick and efficient way of assessing students and that they provide accountability for the allocation of grades. It is important at this stage I recount research my colleague, Dr Stephen Humphry, and I conducted into the assessment of narrative writing. Our findings are central to the assessment of all performances, be they of written performances, performances in motion such as drama or sport, or of products such as a works of art. I will speak in some detail about a series research studies as it is important I explain why I can say so confidently rubrics are not necessarily the panacea of all our assessment challenges. Importantly our research shows why rubrics should not be developed from our abstracted notions of student development. The research arises from the full‐cohort testing program that was introduced in Western Australia in 1999 following a decision from the state and federal ministers of education that all students aged approximately 7, 9 and 11 would be assessed in reading, writing, numeracy and spelling. It was also agreed that the tests would be the responsibility of each of the eight states or territories. Western Australia has a mandated Curriculum Framework which includes an Outcomes and Standards Framework often referred to as the OSF. The OSF describes the typical progress students make in eight leaning areas. Learning

10
in these areas is described in terms of eight stages, referred to as eight levels. With the introduction of full‐cohort testing, a rubric for the assessment of writing was created. This rubric consisted of eight criteria, spelling, vocabulary, punctuation, sentence control, the narrative form of writing, text organisation, subject matter and purpose and audience. In addition markers were required to make an on‐balance judgement as to the level of the performance. The category descriptions within each criterion were derived directly from the OSF. That is the description used to determine a score of 2 in spelling, was taken directly from the description of level 2 in the OSF, the description for a score of 3 for was taken directly from the level 3 description in the OSF, and so on. (Slide 9) Slide 9
This marking rubric was very much liked by the approximately 300 teachers who meet each year at a central location to mark the students’ narrative writing. When the marking rubric was presented at teachers’ professional development seminars it was well received. Steve however identified issues relating to the psychometric properties of the data obtained from this assessment, the most tangible being the distribution of student raw scores. (Slide 10) This graph shows the raw score distribution of year 3, 5 and 7 students in 2001, 2003 and 2004. It can be seen firstly that the distributions remained relatively stable over the period. This stability was achieved through the

11
training of markers and in particular through the use of exemplar scripts, rather than by statistical means. Slide 10
StudentStudent rawraw--score score distributiondistributions under existing approach to Writing s under existing approach to Writing assessmentassessment
0
1000
2000
3000
4000
5000
6000
7000
8000
1 4 7 10 13 16 19 22 25 28 31 34 37 40 43 46 49 52 55 58
Raw score
Freq
uenc
y
W ALNA 2001W ALNA 2003W ALNA 2004
Notice that although there is a large range of possible score points, the distribution clusters mainly on a relatively small subset of these.
An example of the implications of this is that in one large school, approximately 40% of students fell with in a range of four score points (25-29) in Year 7 Writing, 2004.
Secondly and most importantly the graph shows that although there is a large range of possible score points, the distribution clusters on a relatively small subset of these. In effect we were classifying students into three broad groups, as the predominant scoring pattern was all 2s, or all 3s, or all 4s across the nine criteria. I would like you to reflect on whether you have seen a similar pattern in your students’ results when you have used a rubric to assess performances? Have you noticed a tendency for your students to cluster on a small subset of score points? Initially we were uncertain if the issue of clustering of performances related to the nature of writing development, itself, or if it was related to artificial consistencies introduced by the guide. To better understand this, we set up a series of studies in which we tested several hypothesises. The first hypothesis was that the marking of all aspects of a piece of writing by a single marker generated a halo‐effect. For example, weak spelling influenced the judgements on all other criteria. The second hypothesis was that the structure of the rubric itself led to artificial consistencies in the marking. The third hypothesis was that the descriptions of the qualitative differences, as captured in the categories for each criterion, were relatively crude. We found that all three factors contributed to the clustering on a small subset of score points, and that these factors were interrelated. I will now

12
discuss each of the research studies we carried out, as the work we did may alert you to issues with your own rubrics. As I said, the first hypothesis was that the marking of all aspects of a piece of writing by a single marker generated a halo‐effect, especially in the context of the on‐balance judgement of the level of performance. That is, that the same judge would tend to give the same level on all aspects more than would different judges if they each marked a separate aspect. This hypothesis was tested by having each marker mark only one aspect of a performance (for example, only spelling, or only sentence control) and not allowing them to see how the other aspects of the performance were marked. The results of this study showed that a halo‐effect did to some extent cause artificial consistency in the marking. Having removed the halo‐effect, yet still observing artificial consistency we concentrated our studies on analysing the rubric itself and it became apparent that aspects of the rubric overlapped logically and semantically. This is an extract taken from the guide (Slide 12) and you can see that a student who writes a story with a beginning and a complication would be scored two for the criterion, form of writing. This student will necessarily have demonstrated some internal consistency of ideas (category 2, subject matter). Similarly if a story has a beginning and a complication it necessarily will contain two or more related connected ideas (category 2, text organisation). Slide 12
Structural alignmentStructural alignment Category 1 Category 2 Form of writing Demonstrates a beginning
sense of story structure, for example opening may establish a sense of narrative
Writes a story with a beginning and a complication. Two or more events in sequence. May attempt an ending.
Subject matter Includes few ideas on conventional subject matter, which may lack internal consistency.
Has some internal consistency of ideas. Narrative is predictable. Ideas are few, maybe disjointed and are not elaborated.
Text organisation Attempts sequencing, although inconsistencies are apparent.
Writes a text with two or more connected ideas. For longer texts, overall coherence is not observable.
Based on this work, the marking rubric was refined by removing all semantic overlap. The results from this second series of studies showed that the

13
semantic overlap did also to some extent cause artificial consistency in the marking. A third source of artificial consistency was investigated – that of the relative crudeness of classification. As I explained earlier the marking rubric was derived directly from the levels of performance described in the Outcomes and Statements Framework or OSF. The rhetoric that accompanied the introduction of the OSF was that the average student would take approximately 18 months to progress through a level. The levels therefore do not describe fine changes in student development. Slide 13
WALNA categories when there is prescribed and explicit alignmentWALNA categories when there is prescribed and explicit alignmentbetween categoriesbetween categories
The statistical analysis of the data provides the opportunity to examine the relationship between levels (as depicted in the marking rubric) and student ability. This display (slide 13) is taken from the analysis of the writing data and shows that within a wide ability range, a student would have a high probability of being scored similarly on each criterion. For example, students within the ability range of ‐3 to +1 would have a high probability of scoring all 3s, whereas students in the ability range of +1 to +6 would have a high probability of scoring all 4s. These ability ranges equate to approximately two years of schooling. Although the marking rubric contained many criteria, and therefore many score points, it only provided relatively few thresholds, or points of discrimination. Essentially all the information about student performance was obtained from the first judgement, the on‐balance judgement of the student’s level. All other judgements were replications of that first judgement.

14
This graph (slide 14) provides another way of looking at the data. The graph shows the distribution of students in relation to the thresholds (or points of discrimination) provided in the rubric. The horizontal axis shows the distribution of persons (above) the distribution of thresholds (below) on the same scale. You will notice that where there is a gap between thresholds, the student distribution tends to cluster. Slide 14
PersonPerson--threshold distribution with prescribed and explicit alignment bethreshold distribution with prescribed and explicit alignment between categoriestween categories
2nd
thresh
3rd thresh
2s
4th thresh
3s
5th thresh
4s
6th thresh
5s
Lack of precision
An analogy to timing a long distance race may help in explaining this phenomenon. Imagine that you are timing students as they come across the finish line but that your stop watch only records in minutes and not in seconds. Although students cross the line at varying times, you can only record that they took 3 minutes, 4 minutes, 5 minutes and so on. This is what was happening with the rubric. Over and above the issues related to the halo effect and the semantic overlap, the marking rubric did not capture the fine changes that can be observed in student writing development. Although there were qualitative differences between the students written performances, our markers could only classify the students into three or four crude groupings.

15
Before I go on to show how we addressed these issues, I think it is important that we reflect on our findings in relation to the concept of a continuum and the concept of latent and manifest ability. You will remember that I gave the definition of a continuum as ‘a continuous series or whole, no part of which is perceptibly different from the adjacent parts’, and explained that although the adjacent parts are different, it is difficult to perceive those differences. The student performances are a manifestation of underlying student ability on the latent developmental continuum. The findings from our studies showed that the marking rubric only provided coarse descriptions of that latent continuum. As a result student performances could only be classified into 3 or 4 broad groups. Having established this we were still uncertain as to whether this finding was particular to writing development. Did writing ability only manifest as broad or wide qualitative changes in performance? Based an analysis of our findings, we hypothesised that the general level of description in the framework of how student learning develops did not provide the level of detail we needed for a marking rubric of students’ narrative writing. The framework makes no mention of character and setting for example, and it does not articulate in fine detail of how students’ sentence level punctuation or punctuation within sentences develops. To test if this was in fact the case and that it was possible to devise a rubric that captured finer gradations in performance, we devised a new guide. The new guide emerged from a close scrutiny of approximately one hundred exemplars. These were exemplars we knew very well as they had been central in the training of markers on the old guide. We compared the exemplars, trying to determine whether or not there were qualitative differences between them and trying to articulate the differences that we observed. Not all of the criteria we trialled worked as we had intended. For example in weaker performances we identified a difference between those performances that had an oral register and those performances that had a written register. This qualitative difference however was not borne out by the trial data. We found it very difficult to adequately describe development in students’ control and structuring of sentences. We classify sentences as simple, compound and complex, but we found that this classification does not represent the qualitative differences between students’ use of sentences. Immature writers may attempt to use complex sentences but they make

16
errors. More mature writers may use simple sentences to effect. We conducted a separate study to determine the underlying developmental continuum in relation to students’ structuring and control of sentences. I want to re‐iterate that the students’ performances are manifestations of the underlying developmental continuum. The rubric emerged from the scrutiny of these performances and the descriptions of qualitative differences between the performances. As we had no preconceived notion of how many qualitative differences there would be for each criterion, or that there would necessarily be the same number of qualitative differences for all criteria, it emerged that the number of categories for each criterion varied depending on the number of qualitative differences we could discern. For example, in vocabulary and sentence structure there are seven categories because in a representative range of student performances from years 3 to 7, seven qualitative differences could be distinguished and described. In paragraphing however, only 3 qualitative differences could be distinguished so there are only three categories. The threshold locations from the new guide are shown in this display (slide 15). You can see that a student, who was assessed in the on‐balance judgement as being level 2, has a probability of being scored 3, 4 or 5 for spelling, or being scored as either 2 or 3 for vocabulary and so on. As the rubric has categories which were not aligned we had removed the issues associated with the halo‐effect. More importantly as each category describes an empirical qualitative difference in performance, each score point provides meaningful information about student development. SLIDE 15
Thresholds when categories are derived from the Thresholds when categories are derived from the qualitative differences observed in student performancesqualitative differences observed in student performances
• Along the bottom is the student location, which is determined by their raw score. The coloured and numbered bands indicate the most likely score for a student in the corresponding region of the developmental continuum.

17
The person/item distribution generated from marking with the new guide illustrates this point (slide 16). You will notice that the thresholds are distributed more evenly across the continuum and as a result the person distribution is more continuously distributed without the same peaks as shown previously. The more even distribution of thresholds from the different aspects, which arose from the careful scrutiny and articulation of the qualitative differences between the student performances, provides precision of assessment along the continuum. SLIDE 16
Person/threshold distribution Person/threshold distribution when categories are when categories are derived from the qualitative differences observed in derived from the qualitative differences observed in
student performancesstudent performances
It may look like we have created a more complex and more time consuming way of marking. The opposite is in fact the case. The marking has become far quicker, less training is required and there is greater reliability in the marking. After training, all markers are required to mark the same set of twenty scripts. The analysis of this marking shows that 85% of markers have correlations of over 0.90. It appears that because we have captured well the way in which narrative writing develops, the decision making process involved in assessing a performance has become considerably easier. ‘How can teachers refine their assessment processes to obtain deeper understandings of the nature of student development and growth?’ Earlier I said that in developing marking criteria for polytomously scored questions (questions with several score points), I may begin the process with a hypothesis of what constitutes a qualitatively better answer, and will therefore be scored more highly, but that I would check this hypothesis against the students’ answers. The same applies in developing rubrics. It is

18
also important that teachers examine their marking to see if any performances which are significantly qualitatively different have been given the same score point. This may indicate that their rubric has not been able to distinguish between performances at a fine‐grained level. SLIDE 17
A team leaderA team leader’’s essay marking in 2006s essay marking in 2006
A set of 20 practice scripts was marked by 200 markers in the WALNA marking centre
The graph shows the correlation between a team leader’s scores and the averagescores for the scripts across the centre
r = 0.99
Correlations >0.9 for 85% of markers
y = 1.01x + 0.88R2 = 0.97
0
5
10
15
20
25
30
35
0 5 10 15 20 25 30 35
Team leader's scores for practice scripts
Mea
n sc
ore
acro
ss th
e m
arki
ng c
entr
e
I began this lecture by posing the question, ‘Are the dichotomies we describe in education fundamental or are they merely a matter of emphasis?’ I hope that by drawing on concepts inherent in the measurement paradigm, the concept of a continuum and the concept of latent and manifest ability, I have demonstrated that all our work in education has a shared purpose – to understand what it means to be more able so that we can help all students’ progress. I have discussed the concept of a continuum and the concept of latent and manifest ability in relation to two common assessment processes. In devising assessment processes that use question and answer formats, it is important that teacher’s give careful consideration to the ordering of skills and understandings in the domain they are assessing and that they try as far as possible to replicate the latent developmental continuum in the ordering of questions. This principle of replicating the latent developmental continuum also applies to the scoring of student answers. It is important that each score point is associated with a qualitatively better answer.

19
Similarly in devising a rubric, it is important that the rubric describes the qualitative differences between student performances. Many rubrics may do this in a crude way, but if the assessment process is to provide valuable information about what students need to do, to make small improvements, which will eventually lead to large improvements, then it is important that the rubric provides fine‐grained information. I hope that in drawing on concepts inherent in a measurement paradigm and in applying these concepts to assessment processes we commonly use, I have achieved my stated purpose, that of consolidating our understandings of the purpose and value of student assessment. Or at least I hope that I have alerted you to issues that may also apply to your assessment processes. ACKNOWLEDGEMENTS I would like to acknowledge the contribution of my colleagues at the Graduate School of Education, UWA, in shaping my thinking on assessment processes and in particular I would like to acknowledge the central contribution of Dr Stephen Humphry. UWA is committed to marshalling resources to establish a major, internationally recognised centre in the field of psychometrics and a team of seven has recently been established under the leadership of Professor David Andrich. Much of the material I have presented is this lecture is taken from a newly established Masters program in Assessment, Measurement and Evaluation. REFERENCES Andrich, D. (1988). Rasch models for measurement. Beverly Hills: Sage Publications. Andrich, D. (2006). A report to the Curriculum Council of Western Australia regarding assessment for tertiary selection. Report to the Curriculum Council of Western Australia. Andrich, D., Sheridan, B. & Luo, G. (1997-2007). RUMM2020. RUMM Laboratory, Perth, Australia. Griffin, P., (2007). The comfort of competence and the uncertainty of assessment. Studies in Educational Evaluation, 33(1), 87-89

20
Thurstone, L.L. (1927). A law of comparative judgement. Psychological Review, 34, 278-286. Rasch, G. (1960/1980). Probabilistic models for some intelligence and attainment tests. (Copenhagen, Danish Institute for Educational Research), expanded edition (1980) with foreword and afterword by B.D. Wright. Chicago: The University of Chicago Press. Wilson, M. (2005). Constructing Measures: An Item Response Modeling Approach. Mahwah, NJ: Erlbaum.