Embed Size (px)
Citation preview
Ecological Economics 102 (2014) 94–104
Contents lists available at ScienceDirect
Ecological Economics
j ou r na l ho m ep ag e : w w w .e l sev i e r . co m/ loca t e / eco l e c o n
Methodological and Ideological Options
Using a coupled behavior-economic model to reduce uncertainty and assess fishery management in a data-limited, small-scale fisheryLiam M. Carr ⁎, William D. Heyman 1
LGL Ecological Research Associates, Inc., 4103 S. Texas Ave., Suite 211, Bryan, TX 77802, United States
a r t i c l e i n f o
Article history:Received 12 October 2013Received in revised form 17 February 2014Accepted 19 March 2014Available online 22 April 2014
Keywords:Fisher ecological knowledge Social–ecological systems Fishery modelingU.S. Virgin Islands
a b s t r a c t
This paper examines how fishers' ecological knowledge (FEK) and the analysis of their decision-making process can be used to help managers anticipate fisher behavior and thus be able to efficiently allocate scarce resources for monitoring and enforcement. To examine determinants of fisher behaviors, this study develops a coupled behavior-economic model examining how physical, market, and regulatory forces affect commercial fishers' choice of fishing grounds in a small-scale fishery (SSF) in St. Croix, U.S. Virgin Islands. The model estimates that fishing operations land $396 ± 110 per trip (mean ± 1 SD; n = 427 trips), with the highest value in landings arriving from Lang Bank. The model explains 62% of the variation in fishers' choice to fish at Lang Bank, the mostproductive, yet farthest fishing grounds. The coupled behavioral–economic model is focused on the small tempo-ral and spatial scales of fishing effort and FEK in an SSF. Therefore the model can be used to predict how a range of physical and regulatory conditions and changes in demand will drive overall (fleet) fishing effort allocation in space and time. By illustrating and quantifying these social–ecological causes and effects, the model can assistmanagers to efficiently allocate limited monitoring and enforcement resources.
© 2014 Elsevier B.V. All rights reserved.
1. Introduction
1.1. Social–Ecological Systems and Uncertainty in Small-scale Fisheries
Fisheries have long been described as poorly understood systems from both socioeconomic (Gordon, 1954; Ross, 1896) and ecological (Hilborn and Walters, 1992; Hobday et al., 2011) perspectives. In re- sponse, the management of fisheries has historically focused on reduc- ing risk of overfishing and succeeding despite uncertainty in how afishery responds to fishing effort (Hilborn, 1987; Peterson and Smith,1982) through a coordinated quantitative scientific approach (Hilborn and Walters, 1992). This was attempted by developing intense studies that monitored fishery functions and responses to environmental andfishing-related pressures (Sissenwine and Shepherd, 1987), data collec- tion on fishing effort and catch (Walters, 1975), modeling and predic- tion efforts (Bockstael and Opaluch, 1983; Mangel and Clark, 1983), and refinement of fisheries policies to respond to concerns of over- exploitation (Hilborn, 1979).
Despite these best efforts, successful management of fisheries, as defined by sustainability indicators, remains a hard-to-achieve objective (Hilborn et al., 2003; Worm et al., 2009). There is the
⁎ Corresponding author. Tel.: + 1 843 819 8169.E-mail addresses: [email protected] (L.M. Carr), [email protected]
(W.D. Heyman).1 Tel.: + 1 301 335 3230.
recognition that “the key to successful fisheries management is not
better science, better reference points, or more precautionary ap- proaches but rather implementing systems of marine governance that provide incentives for individual fishermen, scientists, and managers to make decisions in their own interest that contribute to societalgoals” (Hilborn, 2002, 403). This is not to say that high-quality, long-term quantitative data is not important in fishery management. Instead, it is the recognition that management must move toward societally- shared sustainability goals despite data limitations, without robust quantitative methods and models, and while juggling the oftentimes competing short-term economic motivations of the fishery with thelong-term ecological needs of the resource. In short, a lack of “suitable”data cannot be an excuse for the mismanagement of the fishery resource.
Today, an alternative approach views fishery management not as working with predictable systems that can be reduced via rich datasets into simple components or curves, but as complex social–ecologicalsystems (Holling et al., 1998; Mahon et al., 2008) built upon the often- hidden interactions of ecological, social, and economic drivers (Rice,2011). Successful fishery management requires balancing these drivers and developing scale-appropriate tools and policies that work in concert with these drivers to support sustainable outcomes within the fishery. And rather than using separate methods and criteria to examine the ecology and socioeconomic faces of the fishery in isolation, this ap- proach encourages a common framework (Ostrom, 2009) where avail- able ecological and socioeconomic information is brought in and
http://dx.doi.org/10.1016/j.ecolecon.2014.03.0110921-8009/© 2014 Elsevier B.V. All rights reserved.
L.M. Carr, W.D. Heyman / Ecological Economics 102 (2014) 94–104 9
considered together in the development of management tools and policies. In doing so, potential data limitations in one area are offset by the information gleaned in other areas, leading to a greater sum accumulation of knowledge, reduction in uncertainty, and strength- ened ability to successfully pursue management goals.
While a certain level of uncertainty can be expected in fisheries of all sizes, the problem may be most pronounced in small-scale fisheries (SSFs). Owing to limited size, economic value, and management re- sources, SSFs are often data-limited (Berkes et al., 2001a). They are characterized by fishing effort that is highly opportunistic, employing a variety of gears in targeting multiple stocks on any given trip, making SSFs problematic for quantitative scientific efforts like single-stock assessments and monitoring (Johannes, 1998). Management of SSFsmay benefit from an approach that focuses on “facilitating socio-ecological processes rather than primarily promoting a high level of quantitative science and implementing findings” (McClanahan et al.,2009, 33). Socio-economic information can be used to begin making linkages with the missing or insufficient ecological data (Cinner et al.,2009). And perhaps the most readily available data source in SSFs is human behavior (Fulton et al., 2011). Where, how, and what a fisher chooses to fish, and what the market chooses to buy, have important ecological and socioeconomic implications for SSFs. As a result, fishing behavior may be the crucial link between the ecology and socioeco- nomics of a SSF, and, once understood, may provide insights for man- agement that might not be attained in any other way (Bundy et al.,2008).
1.2. Reducing Uncertainty through Modeling Fishing Behavior
This paper uses field-collected data from a tropical nearshore reeffish SSF in the United States Virgin Islands to examine relationships between FEK, fishery economics, and regulations. To examine physical, market, and regulatory forces in concert, this study uses a probability model to predict fisher behavior, measured as a choice in fishing grounds. To evaluate the economic consequences of those choices, the study develops an economic model to estimate the value of fishing (or not fishing) those grounds. The models are then coupled into a behavior-economic model that can then be used to evaluate relation- ships between behaviors, economics, and the consequences of vari- ous regulations on those relationships. Finally, the coupled model's utility in managing fishing effort and maintaining sustainable stocks is evaluated.
Successful fishery management depends on understanding risk (Hobday et al., 2011) and developing suitable tools despite uncer- tainty concerns, be they physical or biological (Ludwig et al., 1993), socioeconomic or political (Rosenberg, 2007). In situations with suf-ficient data quantifying relevant components of a fishery's dynamics, robust stock assessment methods and modeling efforts may be ap- plied (Hilborn and Walters, 1992). For fisheries with data limita- tions, which include many SSFs (Berkes et al., 2001b), the need for a precautionary, risk-averse approach remains (Johannes, 1998). And while quantitative data may be absent or insufficient, fisheries of all scales have their own basic characteristics that can begin to, at least qualitatively, describe the fishery in terms useful for manage- ment. Chief among these characteristics is fishing behavior.
In data-limited SSFs, fisher behavior represents a valuable source of information that can be used to reduce uncertainty and foster sus- tainable practices (Armitage et al., 2009; Johannes, 1998; Johannes et al., 2000). Ecological information like habitat health, water condi- tions and quality, and community composition can be qualitatively described by fishers or gleaned from detailed fisheries dependent data, e.g. monitoring where and how they fish, as well as what they land and sell. Furthermore, monitoring changes in fishing behavior can help reveal the underlying knowledge of a fisher who relies on their experience in responding to the same set of basic information available to them to make a successful fishing trip. Expanded to the
scale of the fishery, fishing behavior offers a more complete and pre- dictable understanding of how data-limited SSFs work. By introduc- ing a level of predictability in fishing ground selection and resulting catch composition and size, basic models can be developed to begin describing SSFs, providing managers with an improved ability to manage proactively and adaptively.
1.3. From Knowledge to Behavior to Improved Management of SSFs
SSFs are characterized by small fishing fleets and small numbers of fishers, low capital investments, opportunistic targeting of multi- ple species with multiple gears each trip (Béné and Tewfik, 2001; Berkes, 2003; Berkes et al., 2001a), and small spatial concentration of directed effort (Salas et al., 2007). And while individual SSF opera- tions may have a limited impact on the marine resource, together, the scope and size of fishing effort has led to difficulties in fishery manage- ment. Collectively, SSFs represent about 90% of the world's 34 million active fishers (Béné and Tewfik, 2001; FAO, 2010), responsible forlanding contribution 25–33% of the annual global marine catch(Chuenpagdee et al., 2006). SSFs are tremendously important, and their successful management is critical for the long-term health and productivity of marine resources and the communities depen- dent upon them for food, employment, and other ecological goods and services.
A reason that fisher behavior can serve as a starting point for managing SSFs stems from the nature of the fishery itself. Fishers in SSFs often retain several characteristics of the artisanal fisher, de-scribed by Johannes et al. (2000) as “fishers' ecological knowledge”or FEK. In SSFs, where gathering ecological information, routine data collection, or quantitative stock assessments may not be possi- ble, political will fractured or non-existent, and the economic alter- natives for food and employment stark (Béné, 2009; Bentley and Stokes, 2009; Cochrane et al., 2011), fishing behavior and landings may represent the sum descriptive total of the fishery both ecologi- cally and economically.
Examining behavior and landings data offers a glimpse into the knowledge and experience – their FEK – that allows a fisher to be economically successful. Monitoring landings over time allows man-agers to identify effort and market trends. By coupling landings tofisher behavior, managers can track changes in relative productivity and preference of selected fishing grounds, identify how existing regulations affect fishing behavior, effort, and landings composition.In short, examining the measurable outcomes of FEK – behavior andmarket trends – provides a greater ability to understand and de-scribe SSFs. For fisheries with little or no other information to guide managers, anticipating how FEK will be expressed is important for meeting management objectives. Taken further, management deci- sions based in an understanding of FEK can help bridge the gap cre- ated by the numerous areas of uncertainty, allowing managers to understand local perspectives of the fishery's ecology and socioeco- nomics, and developing behavioral-based regulations that reflectthis reality. In doing so, management would answer the call to “man-age people, not fish” (Berkes et al., 2001a, 12).
2. Site Description
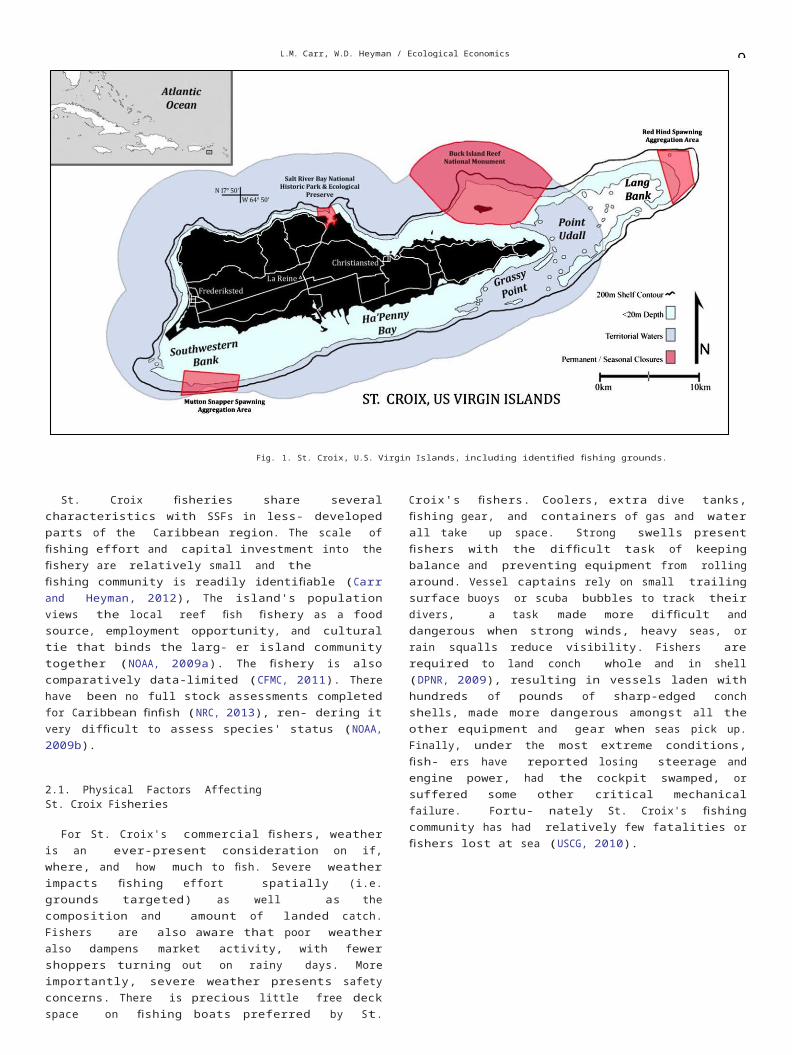
The study was conducted in St. Croix, United States Virgin Islands (17°45′N 61°45′W), the largest of the three major U.S. Virgin Islands. St. Croix is 215 km2 in size and lies 60 km to the south of St. Thomasand St. John, separated by the 4,685-m deep Virgin Islands Trench (Fig. 1). Territorial fisheries (0–3 nautical miles) are managed by the Virgin Islands Department of Planning and Natural Resources (DPNR), while United States Caribbean fisheries (3–200 nautical miles) are managed federally through the National Oceanic and At-mospheric Administration (NOAA) by the Caribbean Fishery Man- agement Council (CFMC).
9 L.M. Carr, W.D. Heyman / Ecological Economics 102 (2014) 94–104
Fig. 1. St. Croix, U.S. Virgin Islands, including identified fishing grounds.
St. Croix fisheries share several characteristics with SSFs in less- developed parts of the Caribbean region. The scale of fishing effort and capital investment into the fishery are relatively small and thefishing community is readily identifiable (Carr and Heyman, 2012), The island's population views the local reef fish fishery as a food source, employment opportunity, and cultural tie that binds the larg- er island community together (NOAA, 2009a). The fishery is also comparatively data-limited (CFMC, 2011). There have been no full stock assessments completed for Caribbean finfish (NRC, 2013), ren- dering it very difficult to assess species' status (NOAA, 2009b).
2.1. Physical Factors Affecting St. Croix Fisheries
For St. Croix's commercial fishers, weather is an ever-present consideration on if, where, and how much to fish. Severe weather impacts fishing effort spatially (i.e. grounds targeted) as well as the composition and amount of landed catch. Fishers are also aware that poor weather also dampens market activity, with fewer shoppers turning out on rainy days. More importantly, severe weather presents safety concerns. There is precious little free deck space on fishing boats preferred by St. Croix's fishers. Coolers, extra dive tanks, fishing gear, and containers of gas and water all take up space. Strong swells present fishers with the difficult task of keeping balance and preventing equipment from rolling around. Vessel captains rely on small trailing surface buoys or scuba bubbles to track their divers, a task made more difficult and dangerous when strong winds, heavy seas, or rain squalls reduce visibility. Fishers are required to land conch whole and in shell (DPNR, 2009), resulting in vessels laden with hundreds of pounds of sharp-edged conch shells, made more dangerous amongst all the other equipment and gear when seas pick up. Finally, under the most extreme conditions, fish- ers have reported losing steerage and engine power, had the cockpit swamped, or suffered some other critical mechanical failure. Fortu- nately St. Croix's fishing community has had relatively few fatalities or fishers lost at sea (USCG, 2010).
2.2. Fishery Market Forces Affecting St. Croix Fisheries
Overriding regulatory instruments, market forces play a large role in dictating fishing effort and targeted stocks by St. Croix's fishers.Crucian fishers consider their “high season” to coincide with theopening of the queen conch fishery season on November 1, marked by an uptick in demand generated by both the local population and tourism industry's American Thanksgiving (late November) to Easter(late March to mid-April) “high season”. During the winter months, inaddition to an increased demand for locally-popular parrotfish (Family Scaridae), a relative increase in demand for high-value stocks like conch ($7 per pound), spiny lobster ($8 per pound), mahi mahi (Coryphaena hippurus) and other pelagics ($6 per pound), and snappers (FamilyLutjanidae) and hinds ($6 per pound) can be seen. The “low season”,generally considered to be the summer and early autumn months, is identified by both the closing of conch season and the slowdown in tourist arrivals. Low season is characterized by the unsettled tropical weather of hurricane season, less frequent, shorter fishing trips by com- mercial fishers, smaller landings by weight, decreased demand for fishgenerally and a transition to inexpensive “potfish” — parrotfish, grunt(Family Haemulidae), doctorfish (Family Acanthuridae), and other small reef fish that sell for $4 per pound. Annually, parrotfish represent nearly 33%, by landed weight, of the 550,000 kg fishery (NOAA, 2010).
St. Croix has 143 registered full-time commercial fishers.2 They usesmall (6.3 ± 1.6 m) open-cockpit fishing vessels and launch primarily from three locations. The selection of where to launch is determined each morning depending on where the fisher intends to fish, what stocks they are targeting that day, weather conditions, and regulatory forces. The fishers are opportunistic, targeting multiple species on any particular day. Unique in the U.S. Caribbean, the majority of St. Croixfishers employ spearguns and scuba-aided hand collection as their pri- mary means of fishing, although other gear types, particularly weighted
L.M. Carr, W.D. Heyman / Ecological Economics 102 (2014) 94–104 9
2 Unpublished data from a 2010 census update for the commercial fishing communities of the U.S. Virgin Islands. This value updates a 2004 census report of 220 licensed fishers working from St. Croix (Kojis, 2004).
9 L.M. Carr, W.D. Heyman / Ecological Economics 102 (2014) 94–104
traps and hand lines, are also employed (Kojis, 2004). Catch is sold at well-known road-side stands across the island, as well as a larger, open-air market in the center of the island at Estate Villa La Reine. Nearly all fish caught locally is consumed locally (NOAA, 2009a), re- inforcing the economic and cultural importance of SSF-style fishing to St. Croix. The La Reine market is open Monday through Saturday, beginning at 6 am. Demand typically increases through the week. Saturdays are the island's market day, with many bustling roadside stands appearing only for that day. On Saturdays, the La Reine mar- ket shares space with a government-sponsored farmer's market, drawing in additional customers.
2.3. Regulatory Structure of Fishery Management in St. Croix, USVI
St. Croix's fisheries are managed by a mix of territorial and federal regulations. While the majority of St. Croix's nearshore and shelf- edge reef habitat occur in territorial waters, two areas that stretch into federal waters are particularly important for St. Croix's commer- cial fishery: Lang Bank to the east and a small shelf-edge elbow along the Southwestern Bank, both sites for seasonal no-take closed areas. The Red Hind Spawning Aggregation Area (RHSAA) is located entire- ly in federal waters at the eastern terminus of Lang Bank (Fig. 1). Allfishing activity is prohibited there each year from 1 December to 28February, coinciding with the red hind's (Epinephelus guttatus) peak spawning period (Nemeth et al., 2007). The Mutton Snapper Spawning Aggregation Area (MSSAA) (Fig. 1), protects a known mutton snapper (Lutjanus analis) spawning aggregation site (Kojis and Quinn, 2011) from 1 March to 30 June. From 1 April to 30 June, a no possession rule for mutton snapper is in place in all territorial and federal waters (DPNR, 2009). Additionally, there are two perma- nent no-take closures: Buck Island National Marine Refuge and Salt River Bay National Historic Park and Ecological Preserve (Fig. 1). Al- though both fall completely inside territorial waters, they are feder- ally protected and managed by the National Park Service. Other territorial and federal fishery regulations include seasonal and per- manent no-possession regulations for a number of stocks, minimum size limits for Caribbean spiny lobster (Panulirus argus) and queen conch (Strombus gigas), and daily and seasonal quotas for a number of reef fishes (DPNR, 2009; NOAA, 2011). The regulatory framework for queen conch is highly germane to this study.
Queen conch is managed via a series of daily and seasonal quotas that begins in both territorial and federal waters on November 1. Each commercial fishing vessel can collect 200 conch per day in territorial waters, while the federal bag limit for commercial fishers is 150 conch per day per fisher, rather than vessel. For St. Croix, reaching the territory's 50,000 lb (22,680 kg) annual quota sets off a no-possession regulation and closes the season both commercially and for recreationalfishers in federal waters (DPNR, 2009). The no-possession regulation does not apply to conch caught, cleaned, and stored during the open season, meaning that conch can be sold throughout the closed season (12 VIC § 316). In 2013, the CFMC passed a motion that would harmo- nize federal commercial regulations with the territorial regulation of200 conch per day per vessel (CFMC, 2013).
3. Methodology
This research examines how physical, market and regulatory forces affect fishers' choice of fishing grounds and their gross landings. Physi-cal forces are represented by daily weather information — wind direc-tion and strength, sea conditions, and rainfall. Market forces are based on customer demand over multiple time frames – day to day, week to week, and season to season – and represented by the relative portion of fish, conch, and lobster in each fisher's landed catch. Regulatory forcesinclude seasonal and area closures. We developed a coupled
behavior- economic model to reflect the underlying FEK, and predicts where afisher decides to fish, and how much they can be expected to catch.
Wind speed Wave height Rainfall Condition
0–8 m/s 0–1.1 m None CalmN 8 m/s 0–1.1 m None Calm0–8 m/s N 1.1 m None Calm0–8 m/s 0–1.1 m Rain CalmN 8 m/s N 1.1 m None SevereN 8 m/s 0–1.1 m Rain Severe0–8 m/s N 1.1 m Rain SevereN 8 m/s N 1.1 m Rain Severe
L.M. Carr, W.D. Heyman / Ecological Economics 102 (2014) 94–104 9More broadly, the model's results also provide a qualitative
assessment of the SSF productivity, health, and management effectiveness at rele- vant spatial and temporal scales, which is more than what is possible from landings or economic data alone.
3.1. Analyses of Physical Forces
Wind direction, speed, sea direction, and sea height data were compiled from 21 January to 3 September 2010, from NOAA's National Data Buoy at Salt River (Station SRBV3). The original datafiles included wind speed and direction measured every six minutes and a wave height every thirty minutes, barring instrument or data transfer failure, and then hourly means were calculated. Daily weather conditions were defined from statistical summaries of wind and wave records during the period from six hours prior to local sunrise to 13:00 local time, each day. Wind speed, direction, and frequency of direction was plotted in wind compass plots using MatLab software (MatLab, v7.0), grouped into ten 36° wind direction bins, beginning at true north (0º) and proceeding clockwise. Mean and standard deviation for wind speed and wave height were calcu- lated and used to test model parameters. Measurable rainfall was also reported.
Taken together, these physical parameters describe the weather conditions under which fishers must decide if and where to fish. Forpurposes of this study, weather data was aggregated into ‘severe’ or‘calm’ conditions. Severe weather was defined to be any day where atleast two of the three factors existed (Table 1): daily mean wind speed exceeding 8 m/s, daily mean wave height above 1.1 m, and mea- surable rainfall. Above 8 m/s (F5 on the Beaufort Scale), white caps and wind-driven waves build, and conditions begin to deteriorate, makingfishing increasingly difficult, if not unsafe. High winds and rain can ob- scure divers' bubbles and also pushes fishing boats off station and downwind. Higher waves and rough seas increase fishers' risk of injury, temporary loss of divers, and vessel damage.
Finally, weather conditions were correlated with choice of fishing grounds under four scenarios: 1) fishing grounds selected during ex- tended periods of calm weather; 2) fishing grounds selected one or two days before severe weather arrived; 3) fishing grounds selected during severe weather conditions, and; 4) fishing grounds selected one or two days after severe weather, as calm conditions returned. The model examines how weather impacts SSF productivity by compar- ing landings from these scenarios. These scenarios also provide an opportunity to more directly measure behavior as the observable ex- pression of FEK as a fisher draws on their own experiences, knowledge, and understanding of how changing weather impacts preferred grounds as they go through their decision-making routine.
3.2. Analyses of Market Landings
Landings and market sampling was conducted for a period of225 days between 21 January and 3 September 2010 (n = 427 market stall samples). Prior to being included into the sample population,
Table 1Weather conditions matrix.
1 L.M. Carr, W.D. Heyman / Ecological Economics 102 (2014) 94–104
each fishing operation was approached and research aims explained. Participating operations, their owners, captains, sellers, boat hands, and other associated fishers gave verbal and written approvals of their anonymous participation in the study, following established institution- al standards. For each fishing operation on each day of observation, the weight of total landings was estimated, grouped by demersal fishes, conch, and lobster. When and where possible, estimations were validat- ed by direct reporting of weights of fish and lobster sold. Value of landed catch was then calculated based on established market prices: $4 per
3.3. Regression Model of Predicted Ground Selection by Conditions
With St. Croix fishers identifying Lang Bank as the most produc- tive and profitable fishing grounds, a multiple variable regression model was proposed that would evaluate the relative effects of vari- ous conditions on the choice of fishing there. Following preliminary tests of model fit with statistical software (SPSS) a logistic binomial linear regression model was selected, following the form:
pound of demersal fish, $7 per pound for knocked and cleaned conch f z1
1meat (in $20 bags), and $8 per pound for spiny lobster. Values calculat- ed for demersal fish represent low-end estimations, as commercialfishers sell both $4 ‘potfish’ and $6 ‘reef fish’ throughout the year,with some even selling ‘mixed bags’ at $5 per pound. Researchersinterviewed fishers on any direct sales and added them to the market sample when they provided figures. If none were provided or fishers de- clined to respond to the question, it was assumed that the operation had no direct sales that day. Pelagic fishes were only observed sporadically so were dropped from the dataset.
Fourteen landings censuses were conducted opportunistically, to verify landings estimations. These censuses calculated the upper range for daily, scuba-assisted catch per fishing operation to be 122 ± 26 de- mersal fishes, weighing 49 ± 8.2 kg (106 ± 18 lb). Lobsters were indi- vidually weighed when possible. Otherwise, total lobster weight was estimated by multiplying the number of landed, un-weighed, live lob- sters by 2.4 ± .4 lb (1.1 ± 0.2 kg), the mean wet weight from all mea- sured individuals. This weight is similar to a reported mean weight of2.58 lb (1.2 kg) by Castillo-Barahona (1981), and near the sampled mean length-weight ratio reported from 1986 through 2003 (NOAA,2005). Simultaneous records were kept detailing running sales totals, and were incorporated into the final value determination for observed operations as a correcting factor, particularly when higher-value fishes were the primary sale.
Fishing ground selection data was collected by interviewing fishers either as they departed a particular launch site in the morning, returned to the launch site, or at the market. Fishing grounds were loosely demar- cated from existing maps (DPNR, 2005; Valiulis and Messineo, 2005), and confirmed through interviews. Five major grounds were identified (from east to west): Lang Bank, Point Udall and northeast St. Croix, Grassy Point, Ha'Penny Bay, and the Southwestern Bank (Fig. 1). During interviews, fishers described Lang Bank as being the most productive St. Croix fishing ground. Fishing ground selections were aggregated by site and date for frequency analysis to examine changes in site selection be- havior as functions of daily physical conditions on one hand and regula- tory conditions on the other. For each of the five identified grounds, recorded landings data were separated and presented as a function of seasonal regulatory conditions (Table 2). A two-tailed, two-sample t- test (p ≤ 0.05) was completed to compare landings from each of the four sites to the landings from Lang Bank.
ð Þ ¼ 1 þ e−z ð Þ
where f(z) is the logistic probability that a fisher will either not select (f(z) ≈ 0) or select (f(z) ≈ 1) to fish at Lang Bank on any given day, given a set of physical (e.g. wind speed, wind direction, wave height, rainfall), behavioral (e.g. fishing ground selection), and regulatory (e.g. closed areas and/or seasons) conditions. This probability is built on a summation of the log-odds independent variable z, which is com- posed of odds ratio coefficients αi and explanatory dummy variables xi, such that:
z ¼ a1 x1 þ a2 xx þ K ak xk ð2Þ
where xk represent those physical, behavioral, and regulatory condi- tions identified as significant for strengthening the predictive abili- ties of the model through a step-wise process. The model was run for all combinations of all records. For each model iteration, the step-wise addition of a variable resulted in a percent change in predic- tive ability. Coefficients with significant values (p ≤ 0.05) were keptand the final model was tested for goodness-of-fit (Hosmer–LemeshowTest; HL ≥ 0.05). The final model is reported, including Nagelkerke's pseudo-r2, Hosmer–Lemeshow value, and predictive strength values along the continuum from zero (no predictive power) to one (perfectcorrelation).
3.4. Economic Model of Expected Landings Value by Grounds
Fishing ground selection data and market value calculations were used to develop an economic model predicting daily gross landed value by fishing operation, based on physical, behavioral, and regulatory conditions. Records were identified by operation, fishing grounds se- lected, and recorded market landings and then assembled into a larger dataset for model development using the software SPSS. Variables were tested for normality, covariance, and heteroskedasticity. The basic regression model takes the form:
V ¼ f ðv; w; xÞ ð3Þ
Table 2Total fishing trips recorded for targeted grounds, by season and regulations.(Two-tailed t-test in parentheses comparing other ground selection to Lang Bank, at p ≤ 0.05).
Lang Bank Pt. Udall Grassy Pt. Ha'Penny Southwest
Conch season open 1 Jan–28 Feb 44 17 5 0 10(RHSAA closure) (0.005)* (0.000)* – (0.000)*n = 19 days sampled1 Mar–30 Apr 24 16 10 1 22(MSSAA closure) (0.22) (0.026)* – (0.81)n = 22 days sampled
Conch season closed 1 May–30 June 56 32 30 5 4(MSSAA closure) (0.016)* (0.005)* (0.000)* (0.000)*n = 24 days sampled1 July–10 Sep 49 26 16 10 50n = 30 days sampled (0.029)* (0.002)* (0.000)* (0.93)
L.M. Carr, W.D. Heyman / Ecological Economics 102 (2014) 94–104 1Asterisk indicates two-tailed t-test that are statistically significant at p≤0.05.
1 L.M. Carr, W.D. Heyman / Ecological Economics 102 (2014) 94–104
where predicted gross value, in dollars, of landed catch (V) is a function of physical, behavioral, and regulatory conditions made observable as weather (v), fishing ground selection (w), and relevant regulations (x). Following tests of model fit, a standard linear model using dummy variables {v, w, x} was selected, taking the form:
i j k
V ¼ X
βi vi þ X
β j v j þ X
βk xk : ð4Þ
gross landed value per trip to the Southwestern Bank, in the relative- ly protected lee of the island, are statistically similar with Lang Bank (Fig. 3c and d).
4.2. Regression Model of Predicted Ground Selection by Conditions
The final model for predicting if a fisher would opt to fish LangBank is:
i¼1 j¼1 k¼1
1The linear model is forced through the origin (β0 = 0),
representing the condition that gross landings value cannot be generated with-
f ðzÞ ¼ 1 þ e−z ð5Þ
out fishing. Regression coefficients (β), in units of dollars, were calculated for each of the model's conditional variables. Two- tailed t-tests (p ≤ 0.05) were reported for each coefficient.
4. Results
4.1. Analyses of Physical Forces
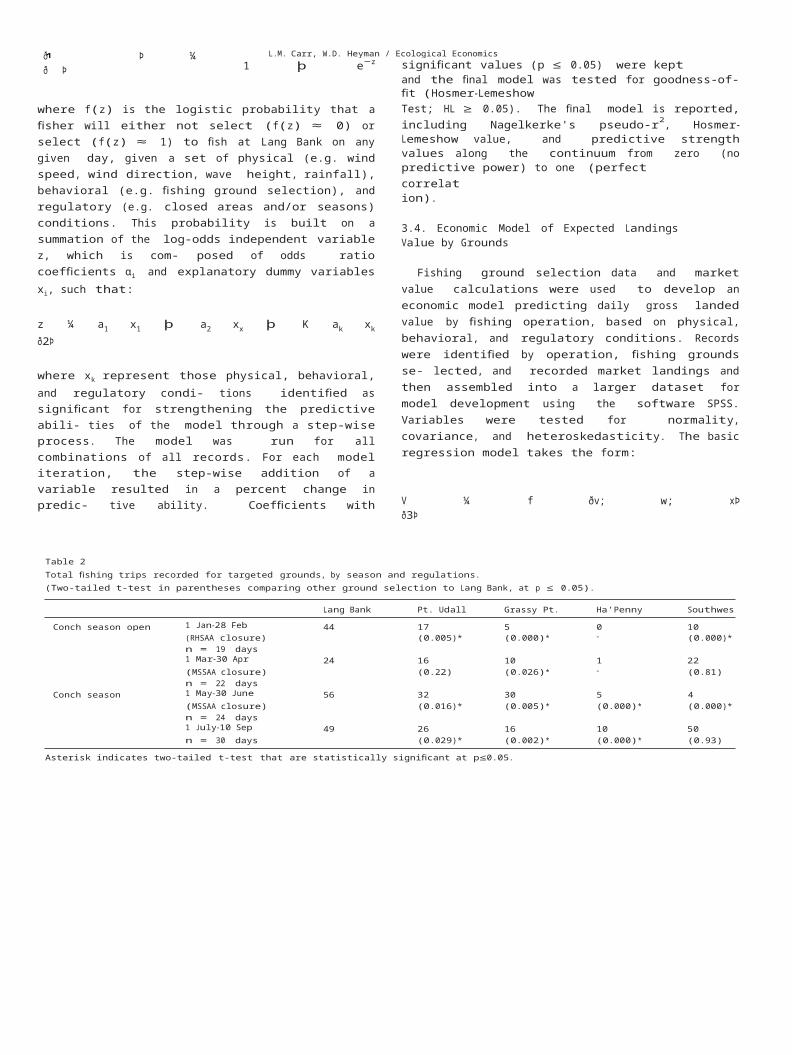
The wind dataset had 4,715 data points, collected inclusively be- tween 0:00 AST (− 4:00 GMT) 21 January 2010 and 23:00 AST on 3September 2010. During this period, wind direction was generally east-southeasterly, with a mean of 118 ± 41°. Mean wind speed was 5.7 ± 2.5 m/s (11.1 ± 4.9 knots). Daily wave heights had a mean of 0.81 ± 0.29 m. These data support Caselle and Warner's (1996) description of the southeastern shelf and coastline of St. Croix as the windward side of the island. Fully 55% of wind recordsfell within the east-southeasterly 72–144° bin, and when incorporat-ing all ‘windward ’ bins between 72 and 180°, this frequency rises tonearly 70% (Fig. 2).
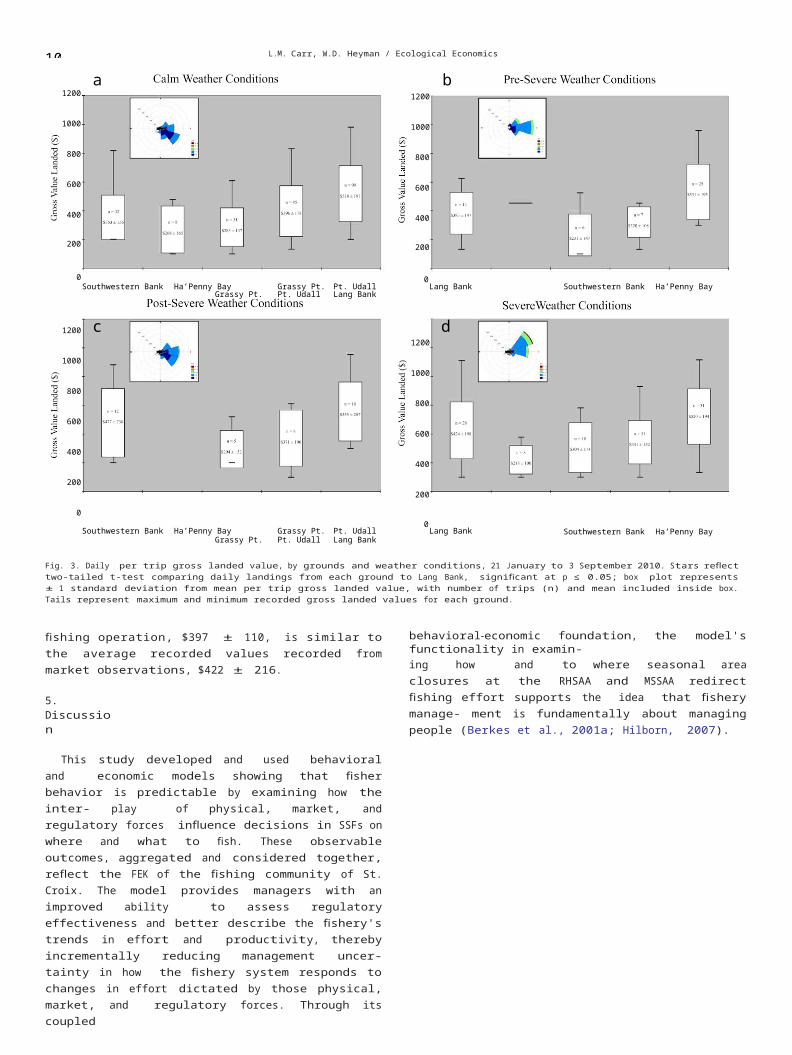
Fig. 3a–d presents gross landed value, by targeted fishing grounds, for the range of weather conditions: calm, pre-severe, severe, andpost-severe weather conditions, as defined in the methodology. Under all weather condition categories, Lang Bank yielded the greatest daily landed value of the fishing grounds considered. In good weather(i.e. ‘calm’ and ‘pre-severe’ conditions), landings from Lang Bank weresignificantly higher (p ≤ 0.05) than from any other grounds, regardless of weather conditions (Fig. 3a–d). Southwestern Bank, was the only grounds nearly as productive as Lang Bank. During and after bad weather (i.e. ‘severe ’ and ‘post-severe ’ conditions), daily mean
Fig. 2. Mean wind speed (m/s), by direction and frequency, from 21 January to 10September 2010.
(Source: NOAA National Data Buoy Center — Station SRBV3)
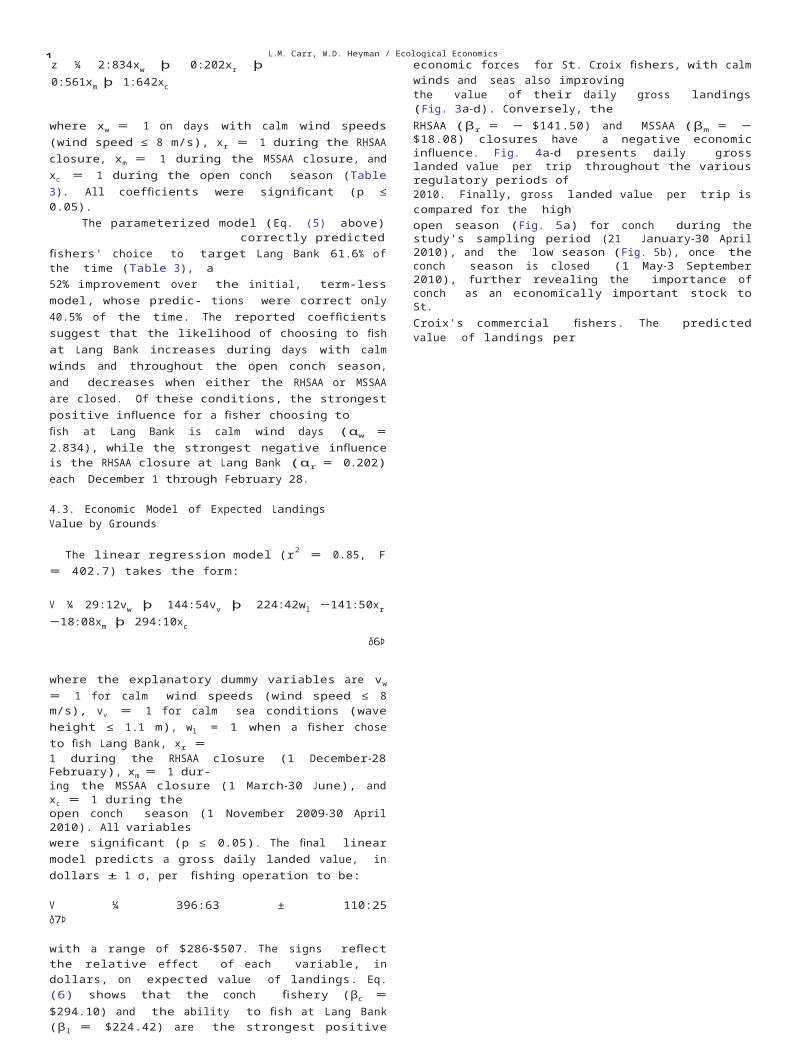
L.M. Carr, W.D. Heyman / Ecological Economics 102 (2014) 94–104 1z ¼ 2:834xw þ 0:202xr þ 0:561xm þ
1:642xc
where xw = 1 on days with calm wind speeds (wind speed ≤ 8 m/s), xr = 1 during the RHSAA closure, xm = 1 during the MSSAA closure, and xc = 1 during the open conch season (Table 3). All coefficients were significant (p ≤ 0.05).
The parameterized model (Eq. (5) above) correctly predictedfishers' choice to target Lang Bank 61.6% of the time (Table 3), a52% improvement over the initial, term-less model, whose predic- tions were correct only 40.5% of the time. The reported coefficients suggest that the likelihood of choosing to fish at Lang Bank increases during days with calm winds and throughout the open conch season, and decreases when either the RHSAA or MSSAA are closed. Of these conditions, the strongest positive influence for a fisher choosing tofish at Lang Bank is calm wind days (αw = 2.834), while the strongest negative influence is the RHSAA closure at Lang Bank (αr
= 0.202) each December 1 through February 28.
4.3. Economic Model of Expected Landings Value by Grounds
The linear regression model (r2 = 0.85, F = 402.7) takes the form:
V ¼ 29:12vw þ 144:54vv þ 224:42wl −141:50xr −18:08xm þ 294:10xc
ð6Þ
where the explanatory dummy variables are vw = 1 for calm wind speeds (wind speed ≤ 8 m/s), vv = 1 for calm sea conditions (wave height ≤ 1.1 m), wl = 1 when a fisher chose to fish Lang Bank, xr =1 during the RHSAA closure (1 December–28 February), xm = 1 dur-ing the MSSAA closure (1 March–30 June), and xc = 1 during theopen conch season (1 November 2009–30 April 2010). All variableswere significant (p ≤ 0.05). The final linear model predicts a gross daily landed value, in dollars ± 1 σ, per fishing operation to be:
V ¼ 396:63 ± 110:25 ð7Þ
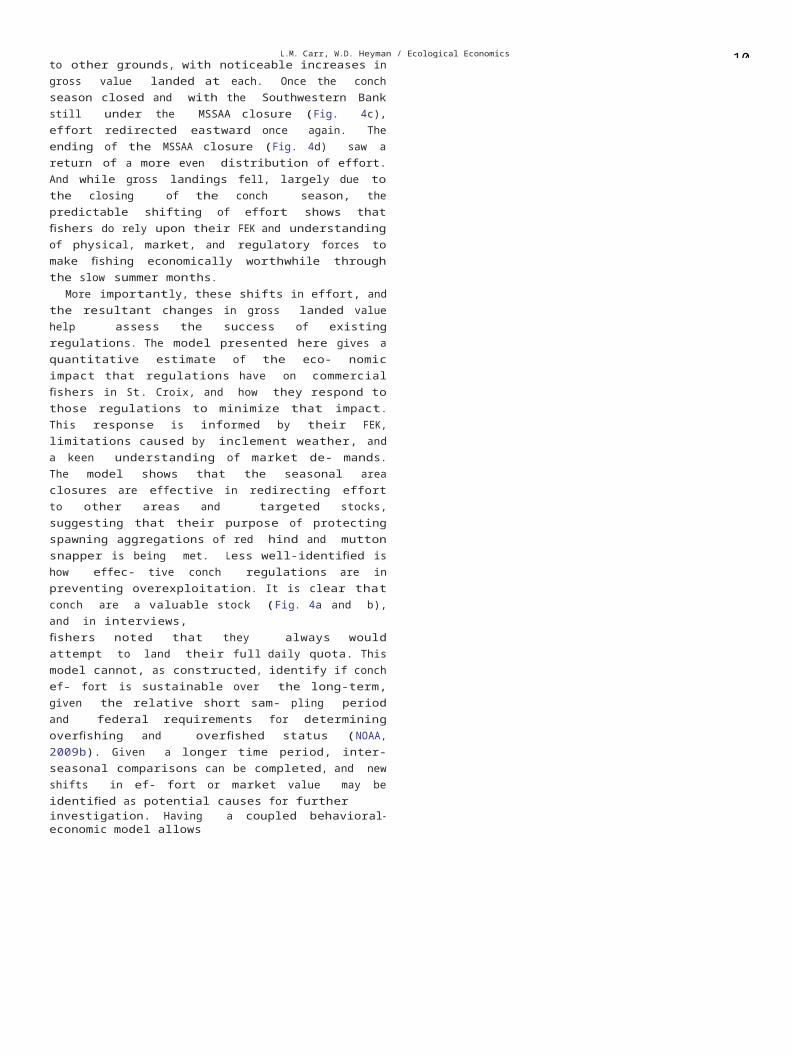
with a range of $286–$507. The signs reflect the relative effect of each variable, in dollars, on expected value of landings. Eq. (6) shows that the conch fishery (βc = $294.10) and the ability to fish at Lang Bank (βl = $224.42) are the strongest positive economic forces for St. Croix fishers, with calm winds and seas also improvingthe value of their daily gross landings (Fig. 3a–d). Conversely, theRHSAA (βr = − $141.50) and MSSAA (βm = − $18.08) closures have a negative economic influence. Fig. 4a–d presents daily gross landed value per trip throughout the various regulatory periods of2010. Finally, gross landed value per trip is compared for the ‘high’open season (Fig. 5a) for conch during the study's sampling period (21 January–30 April 2010), and the ‘low’ season (Fig. 5b), once the conch season is closed (1 May–3 September 2010), further revealing the importance of conch as an economically important stock to St.Croix's commercial fishers. The predicted value of landings per
10 L.M. Carr, W.D. Heyman / Ecological Economics 102 (2014) 94–104
1200
1000
800
600
400
200
a b1200
1000
800
600
400
200
0
1200
1000
800
600
400
200
0
0Southwestern Bank Ha’Penny Bay Grassy Pt. Pt. Udall Lang Bank Southwestern Bank Ha’Penny Bay Grassy Pt. Pt. Udall Lang Bank
c d1200
1000
800
600
400
200
0Southwestern Bank Ha’Penny Bay Grassy Pt. Pt. Udall Lang Bank Southwestern Bank Ha’Penny Bay Grassy Pt. Pt. Udall Lang Bank
Fig. 3. Daily per trip gross landed value, by grounds and weather conditions, 21 January to 3 September 2010. Stars reflect two-tailed t-test comparing daily landings from each ground to Lang Bank, significant at p ≤ 0.05; box plot represents ± 1 standard deviation from mean per trip gross landed value, with number of trips (n) and mean included inside box. Tails represent maximum and minimum recorded gross landed values for each ground.
fishing operation, $397 ± 110, is similar to the average recorded values recorded from market observations, $422 ± 216.
5. Discussion
This study developed and used behavioral and economic models showing that fisher behavior is predictable by examining how the inter- play of physical, market, and regulatory forces influence decisions in SSFs on where and what to fish. These observable outcomes, aggregated and considered together, reflect the FEK of the fishing community of St. Croix. The model provides managers with an improved ability to assess regulatory effectiveness and better describe the fishery's trends in effort and productivity, thereby incrementally reducing management uncer- tainty in how the fishery system responds to changes in effort dictated by those physical, market, and regulatory forces. Through its coupledbehavioral–economic foundation, the model's functionality in examin-ing how and to where seasonal area closures at the RHSAA and MSSAA redirect fishing effort supports the idea that fishery manage- ment is fundamentally about managing people (Berkes et al., 2001a; Hilborn, 2007).
5.1. Coupling Fisher Behavior to Economic Outcomes
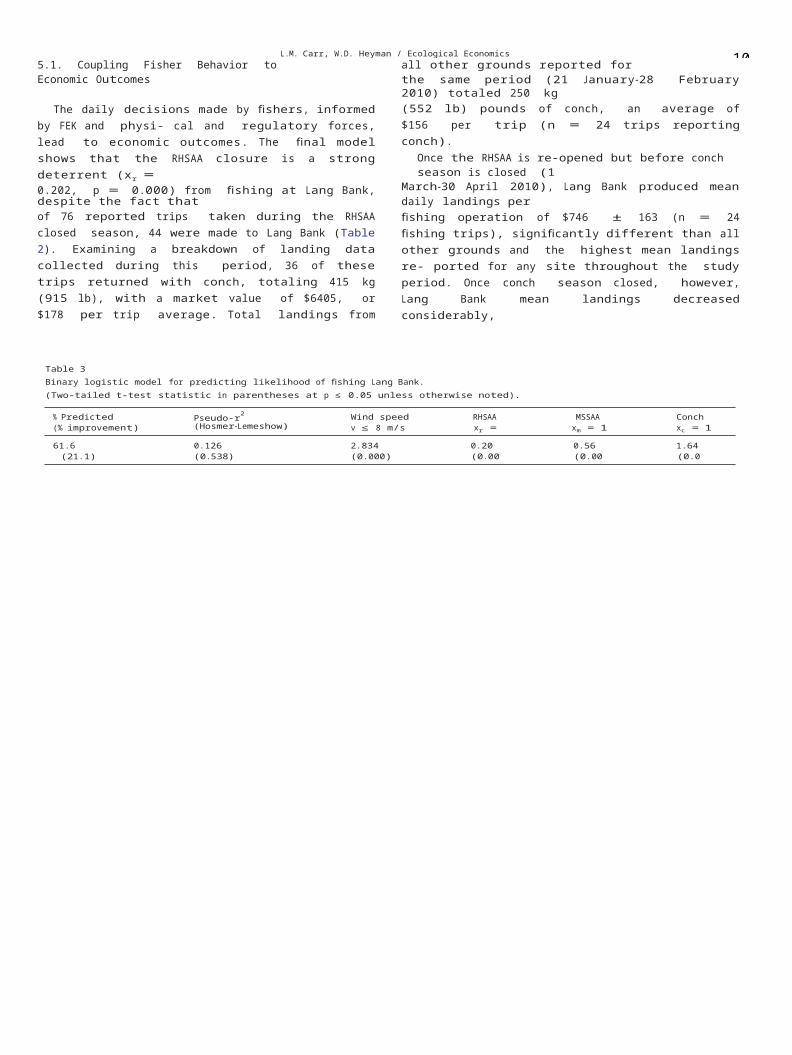
The daily decisions made by fishers, informed by FEK and physi- cal and regulatory forces, lead to economic outcomes. The final model shows that the RHSAA closure is a strong deterrent (xr =0.202, p = 0.000) from fishing at Lang Bank, despite the fact thatof 76 reported trips taken during the RHSAA closed season, 44 were made to Lang Bank (Table 2). Examining a breakdown of landing data collected during this period, 36 of these trips returned with conch, totaling 415 kg (915 lb), with a market value of $6405, or $178 per trip average. Total landings from all other grounds reported forthe same period (21 January–28 February 2010) totaled 250 kg(552 lb) pounds of conch, an average of $156 per trip (n = 24 trips reporting conch).
Once the RHSAA is re-opened but before conch season is closed (1March–30 April 2010), Lang Bank produced mean daily landings perfishing operation of $746 ± 163 (n = 24 fishing trips), significantly different than all other grounds and the highest mean landings re- ported for any site throughout the study period. Once conch season closed, however, Lang Bank mean landings decreased considerably,
Table 3Binary logistic model for predicting likelihood of fishing Lang Bank.(Two-tailed t-test statistic in parentheses at p ≤ 0.05 unless otherwise noted).
% Predicted Pseudo-r2 Wind speed RHSAA MSSAA Conch season(% improvement) (Hosmer–Lemeshow) v ≤ 8 m/s xr = 1 xm = 1 xc = 1
61.6 0.126 2.834 0.202 0.561 1.642(21.1) (0.538) (0.000) (0.000) (0.004) (0.05)
L.M. Carr, W.D. Heyman / Ecological Economics 102 (2014) 94–104 10
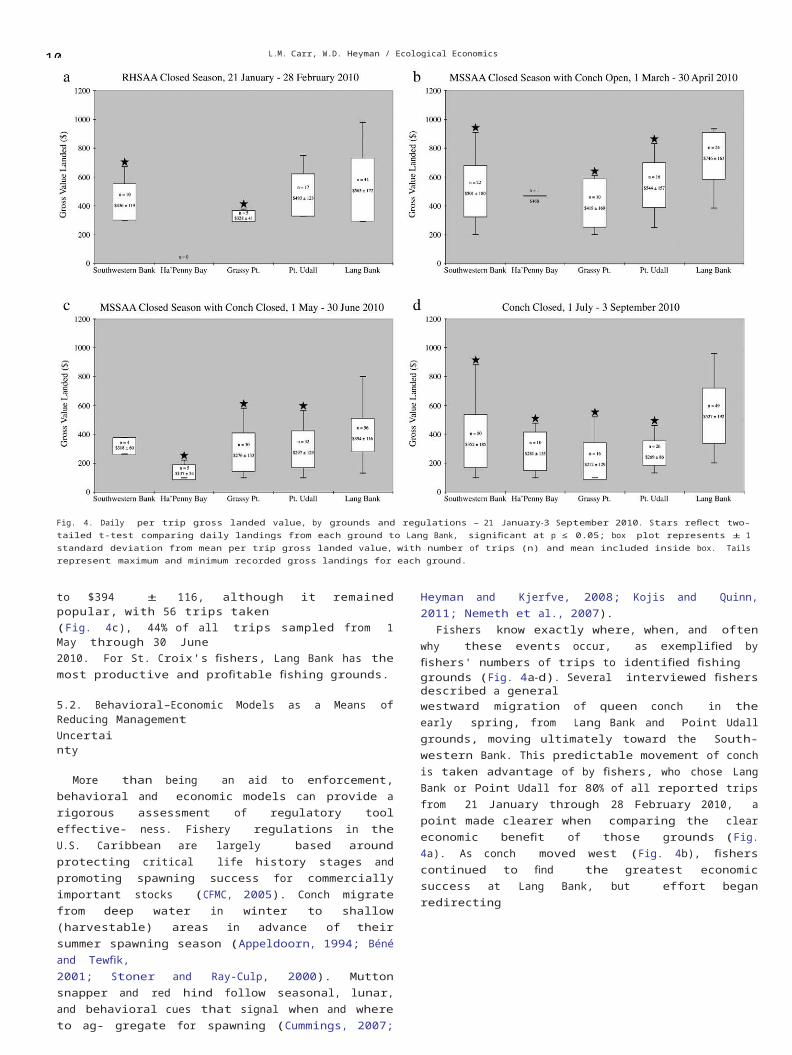
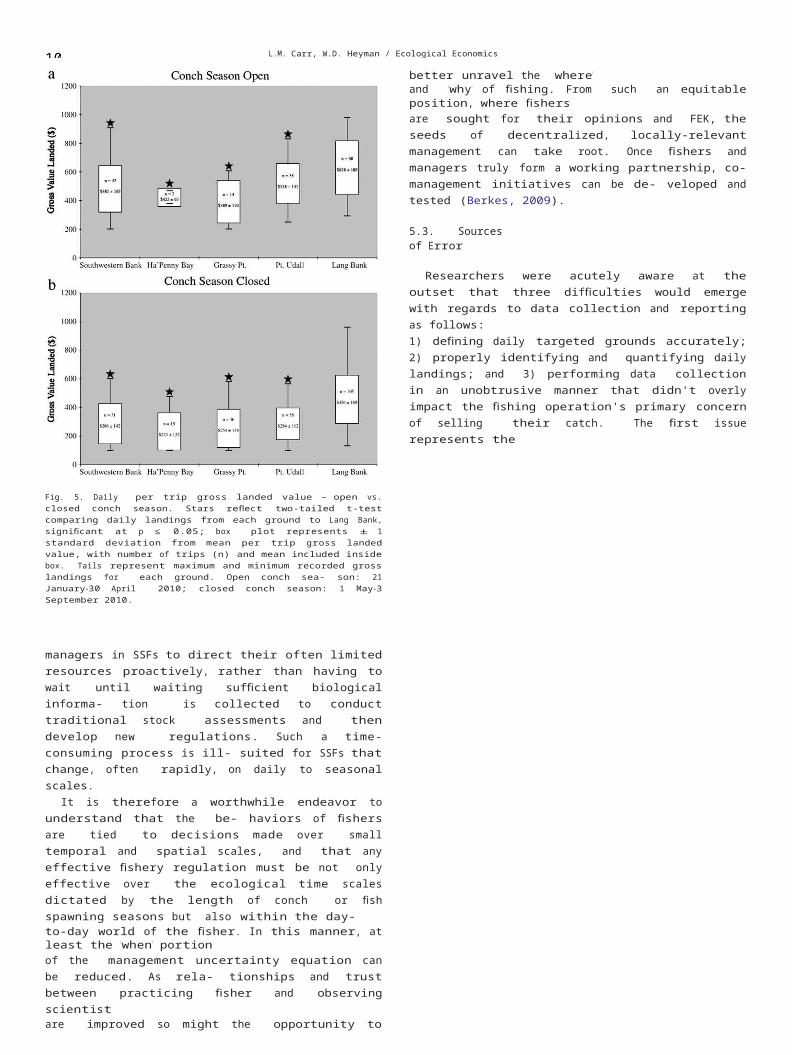
Fig. 4. Daily per trip gross landed value, by grounds and regulations — 21 January–3 September 2010. Stars reflect two-tailed t-test comparing daily landings from each ground to Lang Bank, significant at p ≤ 0.05; box plot represents ± 1 standard deviation from mean per trip gross landed value, with number of trips (n) and mean included inside box. Tails represent maximum and minimum recorded gross landings for each ground.
to $394 ± 116, although it remained popular, with 56 trips taken(Fig. 4c), 44% of all trips sampled from 1 May through 30 June2010. For St. Croix's fishers, Lang Bank has the most productive and profitable fishing grounds.
5.2. Behavioral–Economic Models as a Means of Reducing ManagementUncertainty
More than being an aid to enforcement, behavioral and economic models can provide a rigorous assessment of regulatory tool effective- ness. Fishery regulations in the U.S. Caribbean are largely based around protecting critical life history stages and promoting spawning success for commercially important stocks (CFMC, 2005). Conch migrate from deep water in winter to shallow (harvestable) areas in advance of their summer spawning season (Appeldoorn, 1994; Béné and Tewfik,2001; Stoner and Ray-Culp, 2000). Mutton snapper and red hind follow seasonal, lunar, and behavioral cues that signal when and where to ag- gregate for spawning (Cummings, 2007; Heyman and Kjerfve, 2008; Kojis and Quinn, 2011; Nemeth et al., 2007).
Fishers know exactly where, when, and often why these events occur, as exemplified by fishers' numbers of trips to identified fishinggrounds (Fig. 4a–d). Several interviewed fishers described a generalwestward migration of queen conch in the early spring, from Lang Bank and Point Udall grounds, moving ultimately toward the South- western Bank. This predictable movement of conch is taken advantage of by fishers, who chose Lang Bank or Point Udall for 80% of all reported trips from 21 January through 28 February 2010, a point made clearer when comparing the clear economic benefit of those grounds (Fig. 4a). As conch moved west (Fig. 4b), fishers continued to find the greatest economic success at Lang Bank, but effort began redirecting
to other grounds, with noticeable increases in gross value landed at each. Once the conch season closed and with the Southwestern Bank still under the MSSAA closure (Fig. 4c), effort redirected eastward once again. The ending of the MSSAA closure (Fig. 4d) saw a return of a more even distribution of effort. And while gross landings fell, largely due to the closing of the conch season, the predictable shifting of effort shows that fishers do rely upon their FEK and understanding of physical, market, and regulatory forces to make fishing economically worthwhile through the slow summer months.
More importantly, these shifts in effort, and the resultant changes in gross landed value help assess the success of existing regulations. The model presented here gives a quantitative estimate of the eco- nomic impact that regulations have on commercial fishers in St. Croix, and how they respond to those regulations to minimize that impact. This response is informed by their FEK, limitations caused by inclement weather, and a keen understanding of market de- mands. The model shows that the seasonal area closures are effective in redirecting effort to other areas and targeted stocks, suggesting that their purpose of protecting spawning aggregations of red hind and mutton snapper is being met. Less well-identified is how effec- tive conch regulations are in preventing overexploitation. It is clear that conch are a valuable stock (Fig. 4a and b), and in interviews,fishers noted that they always would attempt to land their full daily quota. This model cannot, as constructed, identify if conch ef- fort is sustainable over the long-term, given the relative short sam- pling period and federal requirements for determining overfishing and overfished status (NOAA, 2009b). Given a longer time period, inter-seasonal comparisons can be completed, and new shifts in ef- fort or market value may be identified as potential causes for furtherinvestigation. Having a coupled behavioral–economic model allows
10 L.M. Carr, W.D. Heyman / Ecological Economics 102 (2014) 94–104
Fig. 5. Daily per trip gross landed value — open vs. closed conch season. Stars reflect two-tailed t-test comparing daily landings from each ground to Lang Bank, significant at p ≤ 0.05; box plot represents ± 1 standard deviation from mean per trip gross landed value, with number of trips (n) and mean included inside box. Tails represent maximum and minimum recorded gross landings for each ground. Open conch sea- son: 21 January–30 April 2010; closed conch season: 1 May–3 September 2010.
managers in SSFs to direct their often limited resources proactively, rather than having to wait until waiting sufficient biological informa- tion is collected to conduct traditional stock assessments and then develop new regulations. Such a time-consuming process is ill- suited for SSFs that change, often rapidly, on daily to seasonal scales.
It is therefore a worthwhile endeavor to understand that the be- haviors of fishers are tied to decisions made over small temporal and spatial scales, and that any effective fishery regulation must be not only effective over the ecological time scales dictated by the length of conch or fish spawning seasons but also within the day-to-day world of the fisher. In this manner, at least the ‘when’ portionof the management uncertainty equation can be reduced. As rela- tionships and trust between practicing fisher and observing scientistare improved so might the opportunity to better unravel the ‘where’and ‘why’ of fishing. From such an equitable position, where fishersare sought for their opinions and FEK, the seeds of decentralized, locally-relevant management can take root. Once fishers and managers truly form a working partnership, co-management initiatives can be de- veloped and tested (Berkes, 2009).
5.3. Sources of Error
Researchers were acutely aware at the outset that three difficulties would emerge with regards to data collection and reporting as follows:1) defining daily targeted grounds accurately; 2) properly identifying and quantifying daily landings; and 3) performing data collection in an unobtrusive manner that didn't overly impact the fishing operation's primary concern of selling their catch. The first issue represents the
greatest potential source of error. As a guide, grounds were best defined by a series of corroborating data being collected, namely grounds de- scribed by the interviewed fisher, contemporaneous launch site data re- ports collected by the researchers based on observed departures, arrivals, and boat trailers of fishers. When this was not possible, re- searchers relied on whichever piece of information they had more con-fidence in reporting.
More vexing from the point of ‘defining’ a targeted fishing ground, many fishers actually fish across several grounds, particularly duringconch season. For example, fishers may opt to conduct two or three dives at Lang Bank and stop in Point Udall's conch grounds on the way home. This routine is highly predictable, suggesting it may be valuable from a behavior-based analysis to combine Lang Bank with Point Udall, while from an ecosystem perspective, the two grounds are dis- similar (NOAA, 2008). Fishers stated in interviews that, due to the conch quota and specter of an approaching end to the season, they al- most always landed their daily limit, regardless of that particular day's market demand. Most fishers have deep freezers that allow them to store unsold catch for a period. In the case of queen conch, there are no prohibitions against possession or sale of conch outside of the season, provided that the conch was caught in-season. This provides difficulties to both sampling work and regulatory effectiveness. Unless it was clearthat a bag of conch sold during the open season (21 January–30 April2010) was previously frozen, researchers included the weight and sale into the dataset. Conch sold after 30 April 2010 were excluded from the analysis, as verifying the behavioral side of the model on where the conch was originally caught was not possible or had been previously sampled at an early market date.
Successfully completing a fisheries study that focuses largely on the daily income of fishers requires tremendous amounts of trust and communication between participating fishers and researchers (Conway and Pomeroy, 2006; Johannes et al., 2000; Johnson and van Densen, 2007). While this study reports on fishing behavior and market trends over 225 days in 2010, researchers began building relationships with several key fishing community leaders as far back as 2004. Even so, fishers consider their favorite fishing grounds and techniques to be privileged information, and they are naturally pro- tective of their knowledge. Great care was taken by researchers to validate all information obtained through interviews and market ob- servations by follow-on conversations. Ultimately, however, trust between fisher and researcher cannot be tested or verified. That is the nature of highly cooperative fisheries research (Kaplan and McCay, 2004). The datasets relied upon here, the researchers trust, are an accurate a reflection of St. Croix's commercial reef fish fishery. The researchers further recognize that there exists some level of ille- gal and unreported fishing effort, with interviewed fishers sharing their own reports and experiences of seeing illegal activity near their own boat or market stall (Carr and Heyman, 2012). The scope of work is not designed to include illegal fishing, but given the be- havioral responses of licensed commercial fishers included in the study, there is a level of compliance that positively supports the value and appropriateness of seasonal area closures for managing St. Croix's nearshore fisheries.
The sample population includes nine fishing operations representing42 individual licensed fishers, or 32% of the entire full-time com- mercial fishing community in St. Croix. The population size is suffi- ciently large enough to be modeled within a behavioral study (Eden et al., 2005), and the results can be used to describe St. Croix's com- mercial fishing community. Previous work in St. Croix has shown that the commercial fishing community is readily identifiable through a set of shared characteristics, and the sample pool is rep- resentative of the larger commercial fishing community (Carr and Heyman, 2012). The methodology is robust enough to be tested in other similarly sized commercial Caribbean fishing communities, recognizing that a different coupled behavior-economic model will result.
L.M. Carr, W.D. Heyman / Ecological Economics 102 (2014) 94–104 10
6. Conclusion
This research presents a novel, cooperative approach for assessing the effectiveness of SSFs management through the daily decisions and behavior of fishers, and the economic outcomes of those decisions. For data-limited fisheries where management resources may be scarce, as many SSFs are, behavioral data of fishers, shared cooperatively by fish- ers, can be used to describe the fishery and reduce areas of uncertaintythat hinder successful management. With careful social–ecological sys-tems analysis, behavioral data can reveal important ecological and so- cioeconomic patterns, identifying productive grounds, at the scale of the fisher and their fishery, and how productivity shifts over time. For protected areas like fish spawning aggregations, behavioral and eco- nomic data can be used to model the impact of regulations on the fish- ery, as well as how the fishing community responds to management. Anticipating fishing behavior can help managers direct limited re- sources efficiently. In short, examining and modeling fisher behavior begin to reveal their FEK, which provides a greatly underutilized infor- mation source for describing and managing data-limited SSFs, and assessing the effectiveness of those regulations established to achievefishery goals. Fisher behavior is the key.
References
Appeldoorn, R.S., 1994. Queen Conch Management and Research: Status, Needs and Pri- orities. Queen Conch Biology, Fisheries and Mariculture. Fundacíon Cientifica Los Roques, Caracas, Venezuela.
Armitage, D.R., Plummer, R., Berkes, F., Arthur, R.I., Charles, A.T., Davidson-Hunt, I.J., Diduck, A.P., Doubleday, N.C., Johnson, D.S., Marschke, M., McConney, P., Pinkerton, E.W., Wollenberg, E.K., 2009. Adaptive co-management for social–ecological com-plexity. Front. Ecol. Evol. 7, 95–102.
Béné, C., 2009. Are fishers poor or vulnerable? Assessing economic vulnerability in small- scale fishing communities. J. Dev. Stud. 45, 911–933.
Béné, C., Tewfik, A., 2001. Fishing effort allocation and fishermen's decision making pro- cess in a multi-species small-scale fishery: analysis of the conch and lobster fisheryin Turks and Caicos Islands. Hum. Ecol. 29, 157–186.
Bentley, N., Stokes, K., 2009. Contrasting paradigms for fisheries management decision making: how well do they serve data-poor fisheries? Mar. Coast. Fish. 1, 391–401.
Berkes, F., 2003. Alternatives to conventional management: lessons from small-scale fish- eries. Environments 31, 5–19.
Berkes, F., 2009. Evolution of co-management: role of knowledge generation, bridging or- ganizations and social learning. J. Environ. Manag. 90, 1692–1702.
Berkes, F., Mahon, R., McConney, P., Pollnac, R., Pomeroy, R., 2001a. Managing Small-scale Fisheries: Alternative Directions and Methods. International Development Research Centre, Ottawa, Canada.
Berkes, F., Mahon, R., McConney, P., Pollnac, R., Pomeroy, R., 2001b. New Directions: A Vi- sion for Small-scale Fisheries. Managing Small-scale Fisheries: Alternative Directions and Methods. Ottawa, Canada, International Development Research Centre.
Bockstael, N.E., Opaluch, J.J., 1983. Discrete modelling of supply response under uncertain- ty: the case of the fishery. J. Environ. Econ. Manag. 10, 125–137.
Bundy, A., Chuenpagdee, R., Jentoft, S., Mahon, R., 2008. If science is not the answer, what is? An alternative governance model for the world's fisheries. Front. Ecol. Evol. 6,152–155.
Carr, L.M., Heyman, W.D., 2012. “It's about seeing what's actually out there”: quantifying
fishers' ecological knowledge and biases in a small-scale commercial fishery as a path toward co-management. Ocean Coast. Manag. 69, 118–132.
Caselle, J.E., Warner, R.R., 1996. Variability in recruitment of coral reef fishes: the impor- tance of habitat at two spatial scales. Ecology 77, 2488–2504.
Castillo-Barahona, F., 1981. Composition of the commercial catch of spiny lobster inPuerto Rico and the U.S. Virgin Islands. Proc. Gulf Caribb. Fish. Inst. 33, 267–270. CFMC,
2005. Comprehensive Amendment to the Fishery Management Plans (FMPs) ofthe U.S. Caribbean to Address Required Provisions of the Magnuson-Stevens Fishery Conservation and Management Act. San Juan. Caribbean Fishery Management Coun- cil, Puerto Rico.
CFMC, 2011. Report of the CFMC Science and Statistical Committee. Caribbean FisheryManagement Council, San Juan, PR.
CFMC, 2013. Regulatory Amendment 2 to the Fishery Management Plan for Queen Conch Resources of Puerto Rico and the U.S. Virgin Islands. Caribbean Fishery Management Council, San Juan, PR.
Chuenpagdee, R., Liguori, L., Palomares, M.L.D., Pauly, D., 2006. Bottom-up, Global Esti- mates of Small-scale Marine Fisheries Catches. Fisheries Centre Research Reports. University of British Columbia, Vancouver, BC.
Cinner, J.E., McClanahan, T.R., Daw, T.M., Graham, N.A.J., Maina, J., Wilson, S.K., Hughes, T.P.,
2009. Linking social and ecological systems to sustain coral reef fisheries. Curr. Biol.
19,206–212.
Cochrane, K.L., Andrew, N.L., Parma, A.M., 2011. Primary fisheries management: a mini- mum requirement for provision of sustainable human benefits in small-scale fisher-ies. Fish Fish. 12, 275–288.
10 L.M. Carr, W.D. Heyman / Ecological Economics 102 (2014) 94–104Conway, F.D.L., Pomeroy, C., 2006. Evaluating the human – as well as the biological –
objectives of cooperative fisheries research. Fisheries 31, 447–454.
Cummings, N.J., 2007. Important Aspects of the Life History of Mutton Snapper, Lutjanus analis, with Emphasis on Populations in the Caribbean. NOAA, Silver Spring, MD.
DPNR, 2005. United States Virgin Islands Marine Resource and Fisheries Strategic and Comprehensive Conservation Plan. Department of Planning and Natural Resources, Division of Fish and Wildlife, Charlotte Amalie, USVI.
DPNR, 2009. United States Virgin Islands Commercial and Recreational Fisher's Informa- tion Booklet. Department of Planning and Natural Resources, Division of Fish and Wildlife, Charlotte Amalie, USVI.
Eden, S., Donaldson, A., Walker, G., 2005. Structuring subjectivities? Using Q methodology in human geography. Area 37, 413–422.
FAO, 2010. The State of World Fisheries and Aquaculture - 2010. Food and Agriculture Or- ganization of the United Nations, Rome, Italy.
Fulton, E.A., Smith, A.D.M., Smith, D.C., van Putten, I.E., 2011. Human behaviour: the key source of uncertainty in fisheries management. Fish Fish. 12, 2–17.
Gordon, H.S., 1954. The economic theory of a common-property resource: the fishery.J. Polit. Econ. 62, 124–142.
Heyman, W.D., Kjerfve, B., 2008. Characterization of transient multi-species reef fish spawning aggregations at Gladden Spit, Belize. Bull. Mar. Sci. 83, 531–551.
Hilborn, R., 1979. Comparison of fisheries control systems that utilize catch and effort data. J. Fish. Board Can. 36, 1477–1489.
Hilborn, R., 1987. Living with uncertainty in resource management. N. Am. J. Fish Manag.7, 1–5.
Hilborn, R., 2002. The dark side of reference points. Bull. Mar. Sci. 70, 403–408.Hilborn, R., 2007. Managing fisheries is managing people: what has been learned? Fish
Fish. 8, 285–296.Hilborn, R., Branch, T.A., Ernst, B., Magnusson, A., Minte-Vera, C.V., Scheuerell, M.D.,
Valero, J.L., 2003. State of the world's fisheries. Annu. Rev. Environ. Resour. 28,359–399.
Hilborn, R., Walters, C.J., 1992. Quantitative Fisheries Stock Assessment: Choice, Dynamics and Uncertainty. Chapman & Hall, London, UK.
Hobday, A.J., Smith, A.D.M., Stobutzki, I.C., Bulman, C., Daley, R., Dambacher, J.M.,Deng, R.A., Dowdney, J., Fuller, M., Furlani, D., Griffiths, S.P., Johnson, D., Kenyon, R., Knuckey, I.A., Ling, S.D., Pitcher, R., Sainsbury, K.J., Sporcic, M., Smith, T., Turnbull, C., Walker, T.I., Wayte, S.E., Webb, H., Williams, A., Wise, B.S., Zhou, S., 2011. Ecological risk assessment for the effects of fishing. Fish.Res. 108, 372–384.
Holling, C.S., Berkes, F., Folke, C., 1998. Science, sustainability and resource management.In: Berkes, F., Folke, C. (Eds.), Linking Social and Ecological Systems: Management Practices and Social Mechanisms for Building Resilience. Cambridge University Press, Cambridge, UK.
Johannes, R.E., 1998. The case for data-less marine resource management: examples from tropical nearshore finfisheries. Trends Ecol. Evol. 13, 243–246.
Johannes, R.E., Freeman, M.M.R., Hamilton, R.J., 2000. Ignore fishers' knowledge and miss the boat. Fish Fish. 1, 257–271.
Johnson, T.R., van Densen, W.L.T., 2007. Benefits and organization of cooperative research for fisheries management. ICES J. Mar. Sci. 64, 834–840.
Kaplan, I.M., McCay, B.J., 2004. Cooperative research, co-management and the social di- mension of fisheries science and management. Mar. Policy 28, 257–258.
Kojis, B., 2004. Census of the Marine Commercial Fishers of the U.S. Virgin Islands. Carib- bean Fisheries Management Council, San Juan, PR.
Kojis, B., Quinn, N.J., 2011. Validation of a Spawning Aggregation of Mutton Snapper and Characterization of the Benthic Habitats and Fish in the Mutton Snapper Seasonal Closed Area, St. Croix, U.S. Virgin Islands. Caribbean Fisheries Management Council, San Juan, PR.
Ludwig, D., Hilborn, R., Walters, C., 1993. Uncertainty, Resource Exploitation, and Conser- vation: Lessons from History. Science 260, 17.
Mahon, R., McConney, P., Roy, R.N., 2008. Governing fisheries as complex adaptive sys- tems. Mar. Policy 32, 104–112.
Mangel, M., Clark, C.W., 1983. Uncertainty, search, and information in fisheries. J. Conseil.41, 93–103.
MatLab. v7.0. Natick, MA: The MathWorks, Inc.McClanahan, T.R., Castilla, J.C., White, A.T., Defeo, O., 2009. Healing small-scale fisheries
by facilitating complex socio-ecological systems. Rev. Fish Biol. Fish. 19, 33–47.Nemeth, R.S., Blondeau, J., Herzlieb, S., Kadison, E., 2007. Spatial and temporal patterns
of movement and migration at spawning aggregations of red hind, Epinephelus guttatus, in the U.S. Virgin Islands. Environ. Biol. Fish 78, 365–381.
NOAA, 2005. Preliminary Application of a State-space Age-structured Production Model to the Spiny Lobster (Panulirus argus) Fishery of the U.S. Caribbean. NOAA, Miami, FL.
NOAA, 2008. Benthic Habitats of Puerto Rico and the U.S. Virgin Islands. Center for Coastal
Monitoring and Assessment, Silver Spring, MD.
NOAA, 2009a. In: NOAA (Ed.), Can an Island be a Fishing Community: An Examination ofSt. Croix and its Fisheries (Miami, FL).
NOAA, 2009b. Magnuson–Stevens Act — National Standard 1. National Oceanic and At- mospheric Administration, Washington, DC.
NOAA, 2010. In: National Oceanic and Atmospheric Administration (Ed.), CommercialFishery Landings — St. Croix, U.S. Virgin Islands, 2000–2009 (Miami, FL).
NOAA, 2011. Fisheries of the Caribbean, Gulf, and South Atlantic. National Marine Fisher- ies Service, Silver Spring, MD.
NRC, 2013. Evaluating the Effectiveness of Fish Stock Rebuilding Plans in the UnitedStates. National Research Council, Washington, DC.
Ostrom, E., 2009. A general framework for analyzing sustainability of social–ecological systems. Science 325, 419–422.
L.M. Carr, W.D. Heyman / Ecological Economics 102 (2014) 94–104 10
Peterson, S., Smith, L.J., 1982. Risk reduction in fisheries management. Ocean Man- age. 8, 65–79.
Rice, J., 2011. Managing fisheries well: delivering the promise of an ecosystem approach.
Fish Fish. 12, 209–231.Rosenberg, A.A., 2007. Fishing for certainty. Nature 449, 989.Ross, E.A., 1896. Uncertainty as a factor in production. Am. Acad. Political Soc. Sci. 183,
304–331.Salas, S., Chuenpagdee, R., Seijo, J.C., Charles, A., 2007. Challenges in the assessment
and management of small-scale fisheries in Latin America and the Caribbean. Fish. Res.87, 5–16.
Sissenwine, M.P., Shepherd, J.G., 1987. An alternative perspective on recruitment overfishing and biological reference points. Can. J. Fish. Aquat. Sci. 44, 913–918.
SPSS. v17.0. Armonk, NY: IBM.Stoner, A.W., Ray-Culp, M., 2000. Evidence for Allee effects in an over-harvested
marine gastropod: density-dependent mating and egg production. Mar. Ecol. Prog. Ser. 202,297–302.
USCG, 2010. Coast Guard Recovers Missing Diver in St. Croix, U.S. Virgin Islands. UnitedStates Coast Guard, San Juan, PR.
Valiulis, J., Messineo, J., 2005. Compilation of Fishing Area Maps Used in Commer- cial Catch Reporting in the U.S. Virgin Islands (1974/75 to 2004/05) Including Subarea Conversion Factors Between Maps. DPNR, Charlotte Amalie, St. Thomas USVI.
Walters, C.J., 1975. Optimal harvest strategies for salmon in relation to environ- mental variability and uncertain production parameters. J. Fish. Board Can.32, 1777–1784.
Worm, B., Hilborn, R., Baum, J.K., Branch, T.A., Collie, J.S., Costello, C., Fogarty, M.J., Fulton, E.A., Hutchings, J.A., Jennings, S., Jensen, O.P., Lotze, H.K., Mace, P.M., McClanahan, T.R., Minto, C., Palumbi, S.R., Parma, A.M., Ricard, D., Rosenberg, A.A., Watson, R., Zeller, D.,2009. Rebuilding global fisheries. Science 325, 578–585.


![1. INTRODUCTION - sfu.caheaps/hetfish/fisherso.pdf1. INTRODUCTION Johnson and Libecap [7] stressed the heterogeneity of the fishers, particularly in fishing skills, in their study](https://img.pdfslide.us/doc/110x75/5d17e0fc88c993d0098bcbe6/1-introduction-sfuca-heapshetfish-introduction-johnson-and-libecap-7-stressed.jpg)