Embed Size (px)
Citation preview

PNNL-20948
Prepared for the U.S. Department of Energy under Contract DE-AC05-76RL01830
User’s Guide to Pre-Processing Data in Universal Translator 2 for the Energy Charting and Metrics Tool (ECAM) D Taasevigen November 2011
PNNL-20948
User’s Guide to Pre-Processing Data in Universal Translator 2 for the Energy Charting and Metrics Tool (ECAM)
D Taasevigen November 2011 Prepared for U.S. Department of Energy Under Contract DE-AC05-76RL01830 Pacific Northwest National Laboratory Richland, Washington 99352


iii
Executive Summary
This user guide was generated to help pre-process data with the intention of utilizing the Energy
Charting and Metrics (ECAM) tool to improve building operational efficiency. There are
numerous occasions when the metered data that is received from the building automation system
(BAS) isn’t in the right format acceptable for ECAM. This includes, but isn’t limited to, cases
such as inconsistent time-stamps for the trends (e.g., each trend has its own time-stamp), data
with holes (e.g., some time-stamps have data and others are missing data), each point in the BAS
is trended and exported into an individual .csv or .txt file, the time-stamp is unrecognizable by
ECAM, etc. After reading through this user guide, the user should be able to pre-process all data
files and be ready to use this data in ECAM to improve their building operational efficiency.
iv
CONTENTS
Executive Summary……………………………………………………………………… .............. iii
1.0 Introduction ................................................................................................................................ 1
1.1 UT2 Installation........................................................................................................................... 1
32-BIT Windows Users: ......................................................................................................... 1
64-BIT Windows Users: ......................................................................................................... 2
1.2 Preparing Raw Data for Import ................................................................................................... 2
1.3 Importing Data ............................................................................................................................ 4
1.4 Merging Data and Creating a Test .............................................................................................. 6
1.5 Exporting Data ............................................................................................................................ 8
v
FIGURES Figure 1: Raw data as a text file (.txt) ................................................................................................. 2
Figure 2: File extension changed to .csv and then opened in Excel for editing .................................. 3
Figure 3: Formatting the date/time stamp in excel.............................................................................. 4
Figure 4: Universal Translator 2 front screen. .................................................................................... 5
Figure 5: Importing data first step in UT2. ......................................................................................... 5
Figure 6: Inputting the channel descriptions and date/time format in UT2. ....................................... 6
Figure 7: Channel properties window opened in UT2. ....................................................................... 7
Figure 8: Creating a test and adding project channels to the test in U2. ............................................. 8
Figure 9: Exporting data window in UT2. .......................................................................................... 8

1
1.0 Introduction
The Energy Charting and Metrics (ECAM) tool is intended to facilitate the examination of
energy information from buildings, reducing the time spent analyzing trend and utility meter
data. In addition to being easy-to-use, this tool is also flexible. Key features of ECAM include
the following:
Data processing to attach schedule and day-type information to time-series data;
Filtering by day-type, occupancy schedule, binned weather data, month/year, pre/post, etc;
Normalization of data based on user-entered information;
Creation of standard charts for the points selected by the user; and
Calculation of normalized metrics for the points selected by the user.
The user’s original data is not modified in the process of using ECAM, but is copied into a new
workbook automatically. The tool makes extensive use of Excel
PivotTables to facilitate
summarization and filtering of the data. It goes beyond normal PivotTables and PivotCharts,
however, by automating the creation of scatter charts based on PivotTable data.
This document describes the use of the Universal Translator (UT2) to modify data that cannot be
processed in ECAM directly (e.g., non-uniform time-stamp, missing data, multiple .csv files for
end-use data).
1.1 UT2 Installation The Universal Translator is a program that assists in processing and merging data that has
non-uniform time intervals or is stored in multiple files. The Universal Translator can
offer meaningful calculations despite inconsistent data. To install the application, go to
www.utonline.org and create a free account. Follow the instructions to enter your
information and setup a password. Once created, log into your account and click on the
downloads tab and download UT2 Version 2.5.115. The website also offers a printable
tutorial from the same page, which should be downloaded and read before installing.
32-BIT Windows Users:
To determine your computer’s operating system details, go to start>control panel> system.
If the system is a 32-bit operating system, click on Version 2.5.115 and scroll down to the
bottom of the next page until you see Attachment ut_setup_2_5_115.exe. Click the
attachment and select run. Before UT2 can be installed, SQL Server Express must be
installed on your computer. The installer will automatically guide you through this
process. If reboot is required, do so when prompted, and the computer will finish the UT2
installation on re-boot.
2
64-BIT Windows Users:
Some 64 BIT Windows users have had problems installing UT2 and have reported a run-
time error. To avoid this error, a manual install of SQL Server is required. After clicking
on Version 2.5.115, scroll down to the bottom of the page and instead of choosing the
attachment, click on the READ THIS for 64 BIT Windows Users. Open the PDF
attachment from the next page and read the instructions. The document will tell you to
download “SQLEXPR32.EXE” (36.5 MB) and save it to your machine. Don’t download
this version, download “SQLEXPR.EXE” (55.4 MB). After you manually install SQL
Server and follow all directions from the PDF attachment, run the UT 2.5.115 installer
from www.utonline.org. This time the SQL install step will be skipped and UT2 will be
installed properly. If you get a run-time error when opening UT2, try running it as an
administrator by right clicking on the Universal Translator 2 and selecting “Run as
Administrator.” After UT2 has been installed, you must find where it is located. It will
be put in the PEC folder under PEC/UniversalTranslator/utprogramfiles/utGUI.exe.
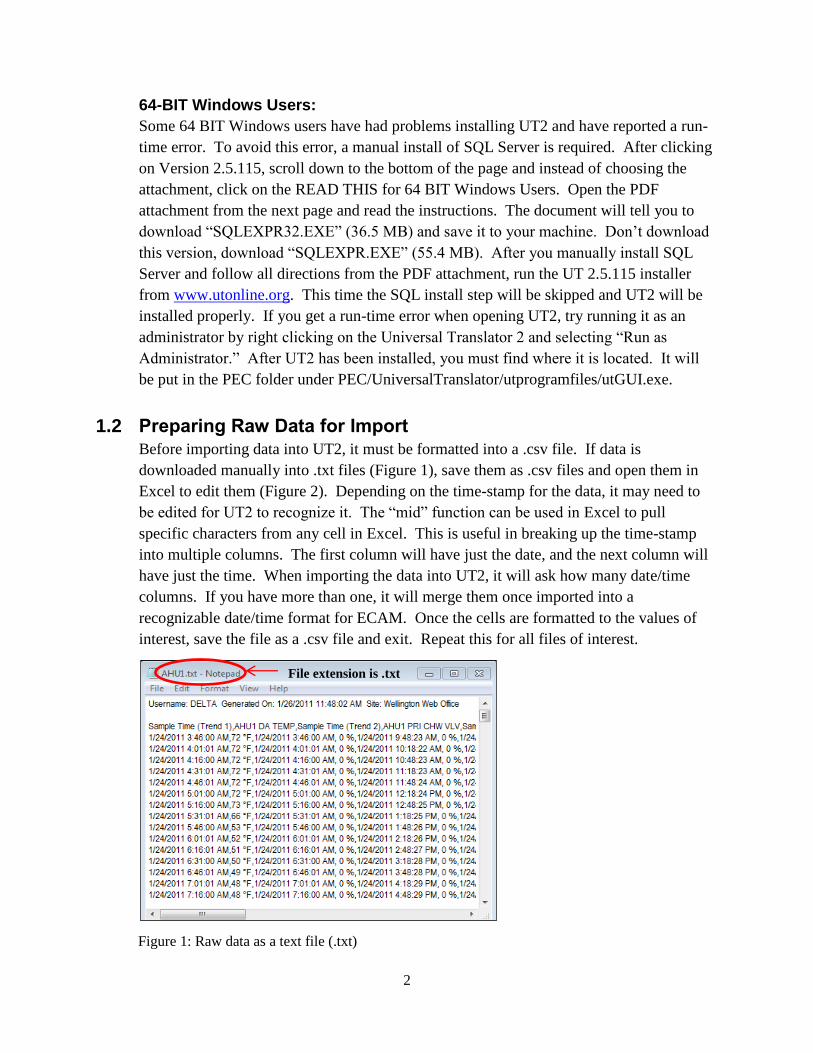
1.2 Preparing Raw Data for Import
Before importing data into UT2, it must be formatted into a .csv file. If data is
downloaded manually into .txt files (Figure 1), save them as .csv files and open them in
Excel to edit them (Figure 2). Depending on the time-stamp for the data, it may need to
be edited for UT2 to recognize it. The “mid” function can be used in Excel to pull
specific characters from any cell in Excel. This is useful in breaking up the time-stamp
into multiple columns. The first column will have just the date, and the next column will
have just the time. When importing the data into UT2, it will ask how many date/time
columns. If you have more than one, it will merge them once imported into a
recognizable date/time format for ECAM. Once the cells are formatted to the values of
interest, save the file as a .csv file and exit. Repeat this for all files of interest.
Figure 1: Raw data as a text file (.txt)
File extension is .txt
3
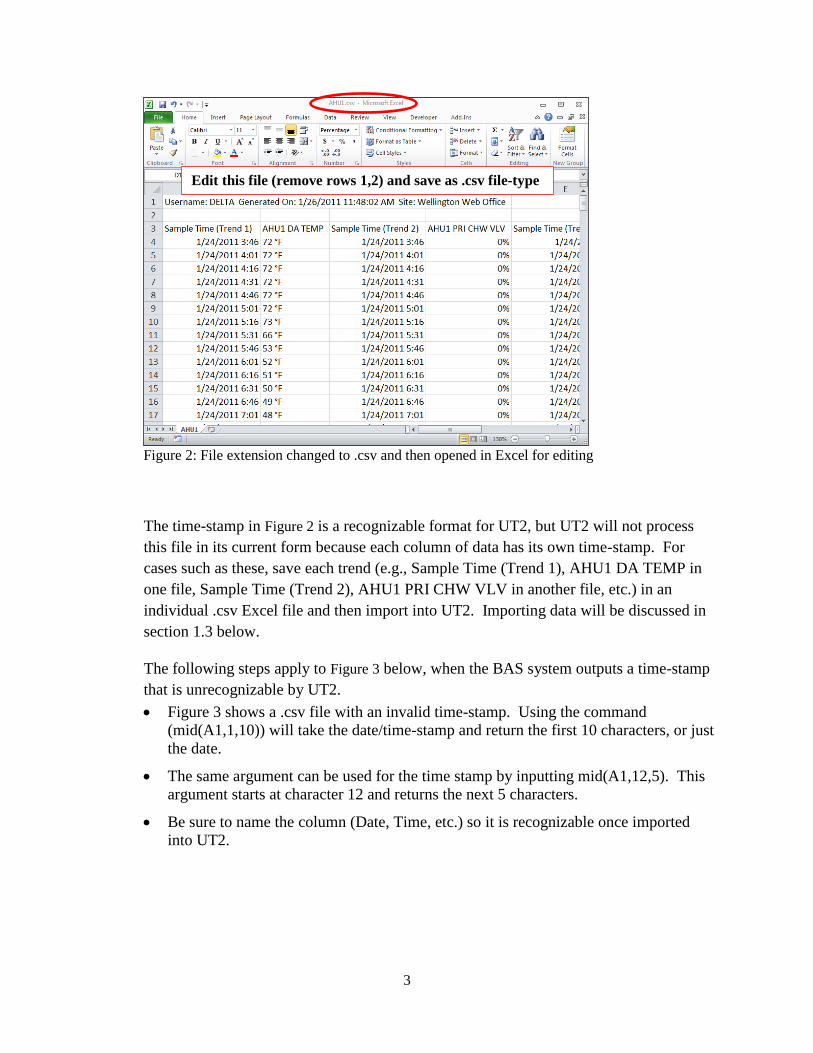
Figure 2: File extension changed to .csv and then opened in Excel for editing
The time-stamp in Figure 2 is a recognizable format for UT2, but UT2 will not process
this file in its current form because each column of data has its own time-stamp. For
cases such as these, save each trend (e.g., Sample Time (Trend 1), AHU1 DA TEMP in
one file, Sample Time (Trend 2), AHU1 PRI CHW VLV in another file, etc.) in an
individual .csv Excel file and then import into UT2. Importing data will be discussed in
section 1.3 below.
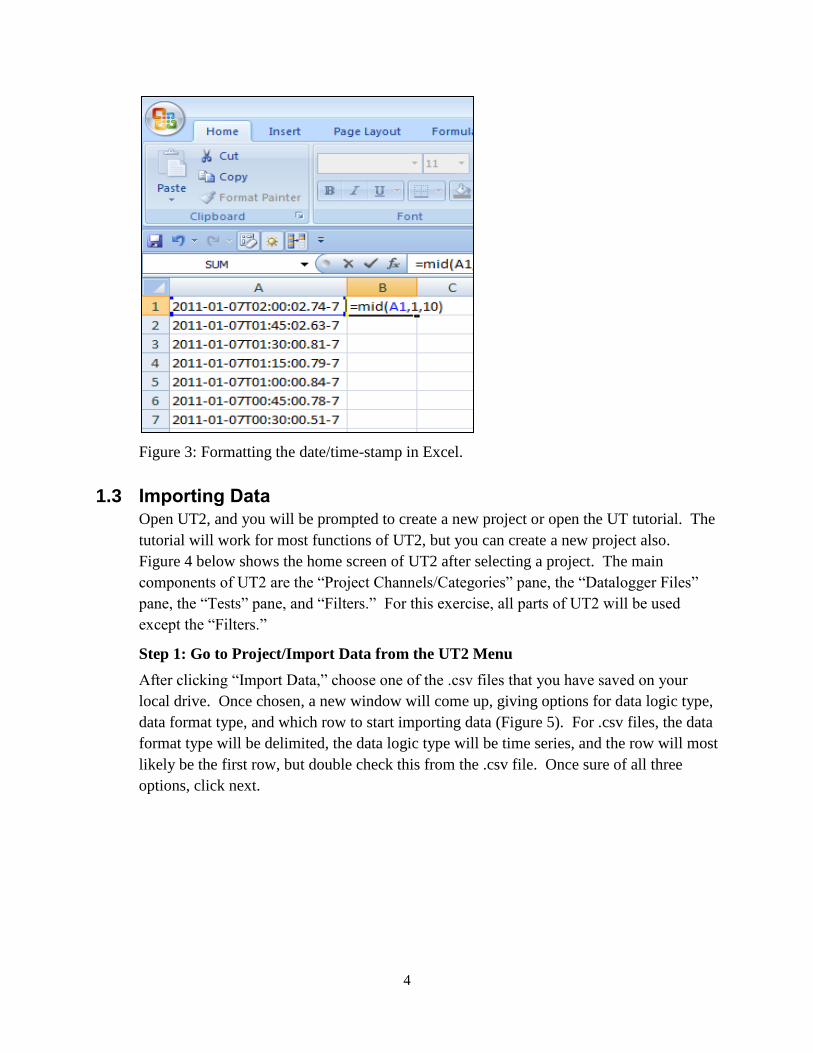
The following steps apply to Figure 3 below, when the BAS system outputs a time-stamp
that is unrecognizable by UT2.
Figure 3 shows a .csv file with an invalid time-stamp. Using the command
(mid(A1,1,10)) will take the date/time-stamp and return the first 10 characters, or just
the date.
The same argument can be used for the time stamp by inputting mid(A1,12,5). This
argument starts at character 12 and returns the next 5 characters.
Be sure to name the column (Date, Time, etc.) so it is recognizable once imported
into UT2.
Edit this file (remove rows 1,2) and save as .csv file-type
4
Figure 3: Formatting the date/time-stamp in Excel.
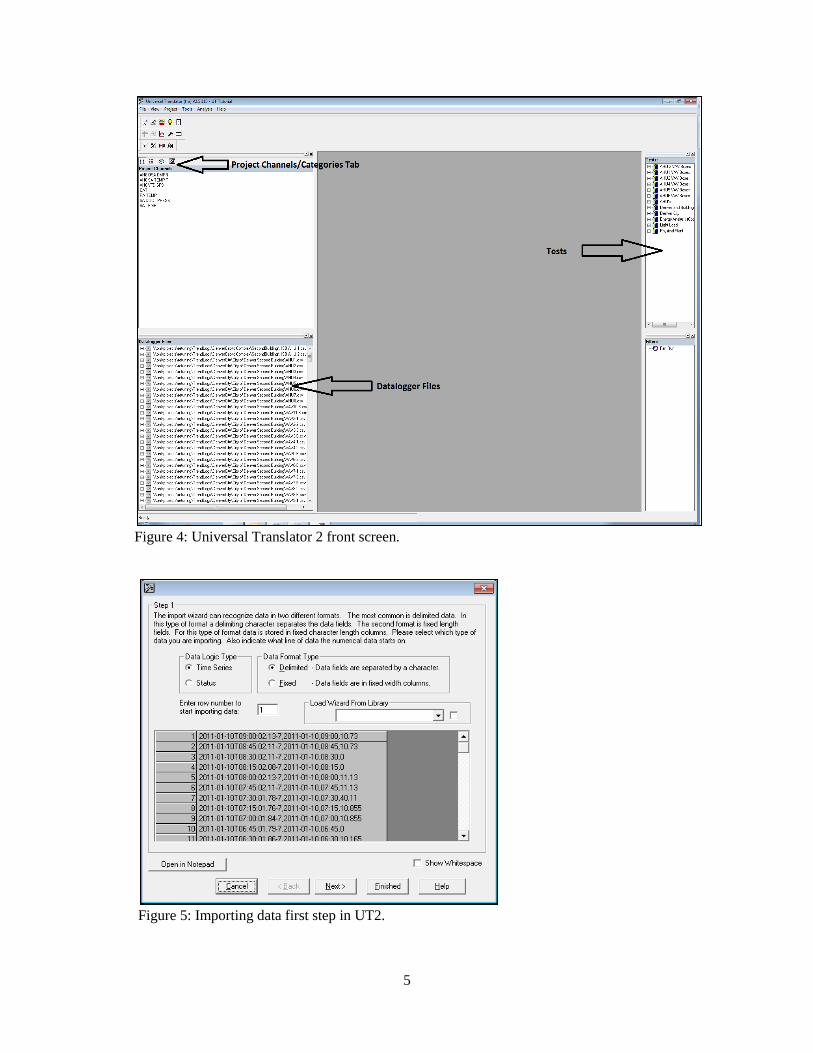
1.3 Importing Data Open UT2, and you will be prompted to create a new project or open the UT tutorial. The
tutorial will work for most functions of UT2, but you can create a new project also.
Figure 4 below shows the home screen of UT2 after selecting a project. The main
components of UT2 are the “Project Channels/Categories” pane, the “Datalogger Files”
pane, the “Tests” pane, and “Filters.” For this exercise, all parts of UT2 will be used
except the “Filters.”
Step 1: Go to Project/Import Data from the UT2 Menu
After clicking “Import Data,” choose one of the .csv files that you have saved on your
local drive. Once chosen, a new window will come up, giving options for data logic type,
data format type, and which row to start importing data (Figure 5). For .csv files, the data
format type will be delimited, the data logic type will be time series, and the row will most
likely be the first row, but double check this from the .csv file. Once sure of all three
options, click next.
5
Figure 4: Universal Translator 2 front screen.
Figure 5: Importing data first step in UT2.
6
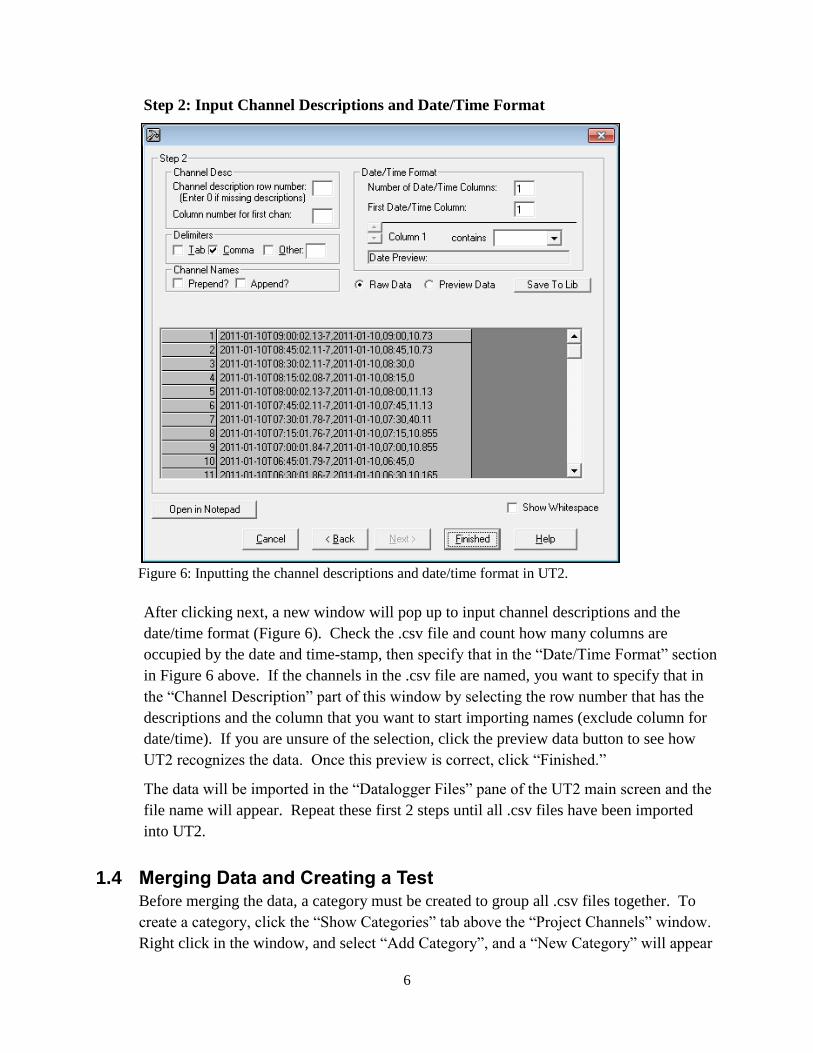
Step 2: Input Channel Descriptions and Date/Time Format
Figure 6: Inputting the channel descriptions and date/time format in UT2.
After clicking next, a new window will pop up to input channel descriptions and the
date/time format (Figure 6). Check the .csv file and count how many columns are
occupied by the date and time-stamp, then specify that in the “Date/Time Format” section
in Figure 6 above. If the channels in the .csv file are named, you want to specify that in
the “Channel Description” part of this window by selecting the row number that has the
descriptions and the column that you want to start importing names (exclude column for
date/time). If you are unsure of the selection, click the preview data button to see how
UT2 recognizes the data. Once this preview is correct, click “Finished.”
The data will be imported in the “Datalogger Files” pane of the UT2 main screen and the
file name will appear. Repeat these first 2 steps until all .csv files have been imported
into UT2.
1.4 Merging Data and Creating a Test
Before merging the data, a category must be created to group all .csv files together. To
create a category, click the “Show Categories” tab above the “Project Channels” window.
Right click in the window, and select “Add Category”, and a “New Category” will appear
7
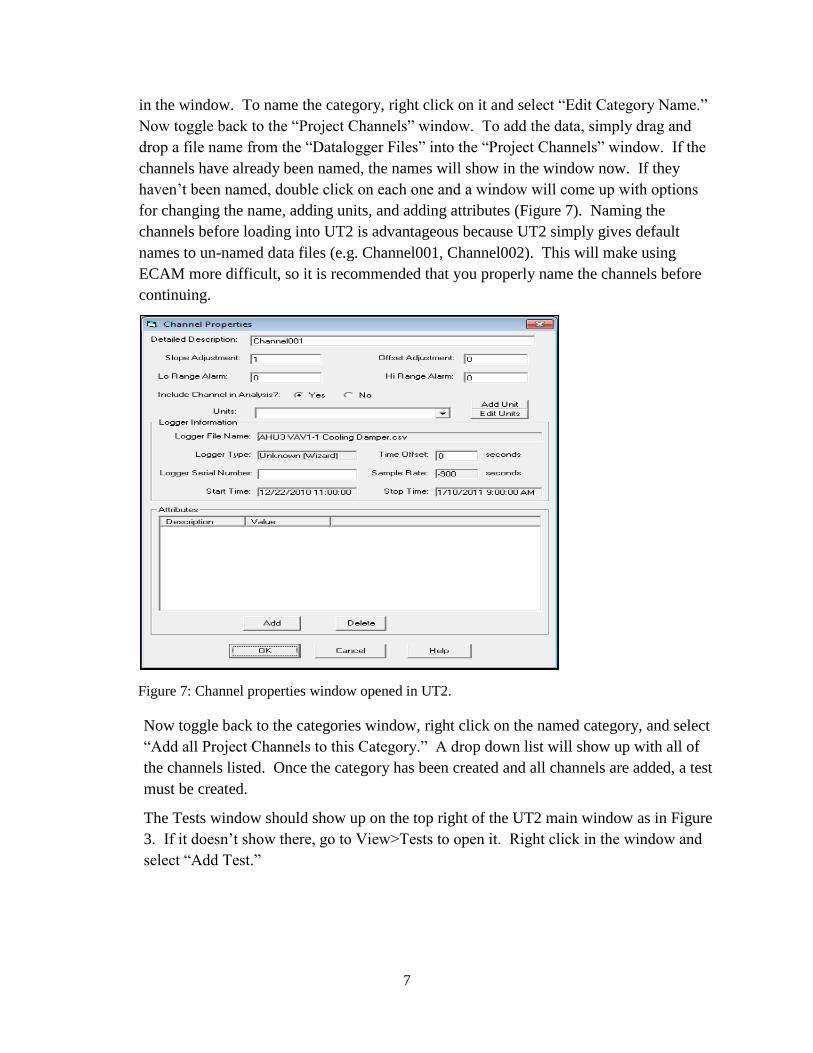
in the window. To name the category, right click on it and select “Edit Category Name.”
Now toggle back to the “Project Channels” window. To add the data, simply drag and
drop a file name from the “Datalogger Files” into the “Project Channels” window. If the
channels have already been named, the names will show in the window now. If they
haven’t been named, double click on each one and a window will come up with options
for changing the name, adding units, and adding attributes (Figure 7). Naming the
channels before loading into UT2 is advantageous because UT2 simply gives default
names to un-named data files (e.g. Channel001, Channel002). This will make using
ECAM more difficult, so it is recommended that you properly name the channels before
continuing.
Figure 7: Channel properties window opened in UT2.
Now toggle back to the categories window, right click on the named category, and select
“Add all Project Channels to this Category.” A drop down list will show up with all of
the channels listed. Once the category has been created and all channels are added, a test
must be created.
The Tests window should show up on the top right of the UT2 main window as in Figure
3. If it doesn’t show there, go to View>Tests to open it. Right click in the window and
select “Add Test.”
8
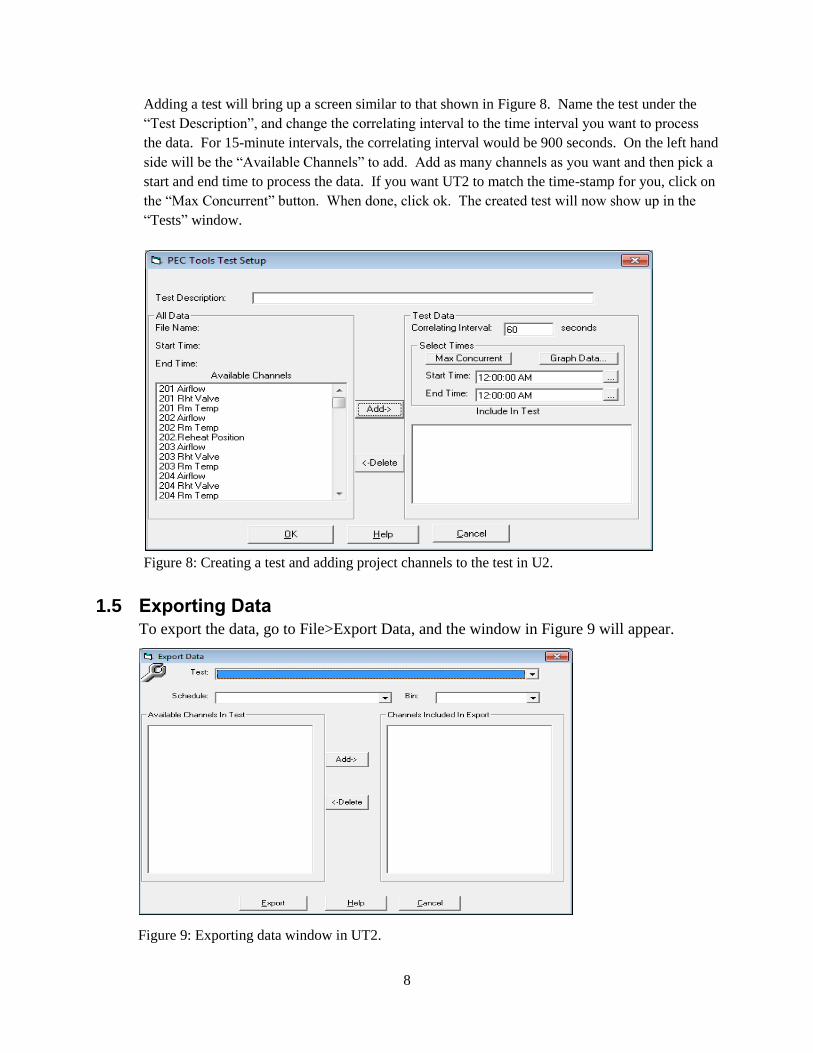
Adding a test will bring up a screen similar to that shown in Figure 8. Name the test under the
“Test Description”, and change the correlating interval to the time interval you want to process
the data. For 15-minute intervals, the correlating interval would be 900 seconds. On the left hand
side will be the “Available Channels” to add. Add as many channels as you want and then pick a
start and end time to process the data. If you want UT2 to match the time-stamp for you, click on
the “Max Concurrent” button. When done, click ok. The created test will now show up in the
“Tests” window.
Figure 8: Creating a test and adding project channels to the test in U2.
1.5 Exporting Data
To export the data, go to File>Export Data, and the window in Figure 9 will appear.
Figure 9: Exporting data window in UT2.

9
From the drop down menu, choose the appropriate test according to the name you gave it
in the previous step. All of the available channels within that test will show on the left
hand side of Figure 9. Select them all and click the “Add” button to add them in the
“Channels Included in Export” window. Now let UT2 process the data. If there are any
duplicates in time stamps or data is missing from the .csv files, UT2 will prompt the user
of these instances and give options for skipping those data points. Once the data is done
processing, click “Export.” The file extension from UT2 is .UTF, and this file type is
compatible with Microsoft Excel. Open the file in Excel; delete rows 1,2, and 4; and then
re-name the first column as “Date” or “Time.” Once finished, save this file as a .csv file
and you are now ready to use ECAM on this data set.
Note: the default value for missing or “No Data” fields in UT2 is 0. Also, if there is data
that has command values such as “Yes” or “No”, UT2 will convert “Yes” to 1 and “No”
to 0 when processing the data.

10