Embed Size (px)
Citation preview
SHRP 2 Renewal Project R09
User’s Guide for Microsoft Excel Workbook Template for
Conducting Simplified Risk Management Planning for Rapid
Renewal Projects
SHRP 2 Renewal Project R09
User’s Guide for Microsoft Excel Workbook Template for Conducting Simplified Risk Management Planning for Rapid Renewal
Projects
TRANSPORTATION RESEARCH BOARD Washington, D.C.
2014 www.TRB.org

© 2014 National Academy of Sciences. All rights reserved. ACKNOWLEDGMENT This work was sponsored by the Federal Highway Administration in cooperation with the American Association of State Highway and Transportation Officials. It was conducted in the second Strategic Highway Research Program, which is administered by the Transportation Research Board of the National Academies. COPYRIGHT INFORMATION Authors herein are responsible for the authenticity of their materials and for obtaining written permissions from publishers or persons who own the copyright to any previously published or copyrighted material used herein. The second Strategic Highway Research Program grants permission to reproduce material in this publication for classroom and not-for-profit purposes. Permission is given with the understanding that none of the material will be used to imply TRB, AASHTO, or FHWA endorsement of a particular product, method, or practice. It is expected that those reproducing material in this document for educational and not-for-profit purposes will give appropriate acknowledgment of the source of any reprinted or reproduced material. For other uses of the material, request permission from SHRP 2. NOTICE The project that is the subject of this document was a part of the second Strategic Highway Research Program, conducted by the Transportation Research Board with the approval of the Governing Board of the National Research Council. The Transportation Research Board of the National Academies, the National Research Council, and the sponsors of the second Strategic Highway Research Program do not endorse products or manufacturers. Trade or manufacturers’ names appear herein solely because they are considered essential to the object of the report. DISCLAIMER The opinions and conclusions expressed or implied in this document are those of the researchers who performed the research. They are not necessarily those of the second Strategic Highway Research Program, the Transportation Research Board, the National Research Council, or the program sponsors. The information contained in this document was taken directly from the submission of the authors. This material has not been edited by the Transportation Research Board. SPECIAL NOTE: This document IS NOT an official publication of the second Strategic Highway Research Program, the Transportation Research Board, the National Research Council, or the National Academies.

The National Academy of Sciences is a private, nonprofit, self-perpetuating society of distinguished scholars engaged in scientific and engineering research, dedicated to the furtherance of science and technology and to their use for the general welfare. On the authority of the charter granted to it by Congress in 1863, the Academy has a mandate that requires it to advise the federal government on scientific and technical matters. Dr. Ralph J. Cicerone is president of the National Academy of Sciences.
The National Academy of Engineering was established in 1964, under the charter of the National Academy of Sciences, as a parallel organization of outstanding engineers. It is autonomous in its administration and in the selection of its members, sharing with the National Academy of Sciences the responsibility for advising the federal government. The National Academy of Engineering also sponsors engineering programs aimed at meeting national needs, encourages education and research, and recognizes the superior achievements of engineers. Dr. Charles M. Vest is president of the National Academy of Engineering.
The Institute of Medicine was established in 1970 by the National Academy of Sciences to secure the services of eminent members of appropriate professions in the examination of policy matters pertaining to the health of the public. The Institute acts under the responsibility given to the National Academy of Sciences by its congressional charter to be an adviser to the federal government and, upon its own initiative, to identify issues of medical care, research, and education. Dr. Harvey V. Fineberg is president of the Institute of Medicine.
The National Research Council was organized by the National Academy of Sciences in 1916 to associate the broad community of science and technology with the Academy’s purposes of furthering knowledge and advising the federal government. Functioning in accordance with general policies determined by the Academy, the Council has become the principal operating agency of both the National Academy of Sciences and the National Academy of Engineering in providing services to the government, the public, and the scientific and engineering communities. The Council is administered jointly by both Academies and the Institute of Medicine. Dr. Ralph J. Cicerone and Dr. Charles M. Vest are chair and vice chair, respectively, of the National Research Council. The Transportation Research Board is one of six major divisions of the National Research Council. The mission of the Transportation Research Board is to provide leadership in transportation innovation and progress through research and information exchange, conducted within a setting that is objective, interdisciplinary, and multimodal. The Board’s varied activities annually engage about 7,000 engineers, scientists, and other transportation researchers and practitioners from the public and private sectors and academia, all of whom contribute their expertise in the public interest. The program is supported by state transportation departments, federal agencies including the component administrations of the U.S. Department of Transportation, and other organizations and individuals interested in the development of transportation. www.TRB.org
www.national-academies.org
User’s Guide to the Template for Risk Management Planning for Rapid Renewal Projects
i
User’s Guide for Microsoft Excel Workbook Template for Conducting Simplified Risk Management Planning for Rapid Renewal Projects
Contents 1. Introduction ............................................................................................................................................. 1
1.1 Purpose and Objectives ..................................................................................................................... 1
1.2 Background and Limitations............................................................................................................... 1
1.3 General Guidance ............................................................................................................................... 1
1.4 Organization ....................................................................................................................................... 3
2. “Base” Project Information and Performance Analysis: <1.Base Project Info> ....................................... 5
2.1 Inputs ................................................................................................................................................. 5
2.2 Outputs .............................................................................................................................................. 6
3. Unmitigated Risk Identification and Assessment: <2a.Initial Risks (Brainstorm)>, <2b.Risks by Category>, <3a.Rating Scales>, and <3b.Unmitigated Risk Assess> ............................................................. 9
3.1 Inputs ................................................................................................................................................. 9
3.2 Outputs ............................................................................................................................................ 10
4. Unmitigated Risk Analysis: <4a.Unmitigated Risk Results>, <4b.Unmitigated Risk Ranking>, and <4c.Unmitig. Risk Ranking Plots> ................................................................................................................ 15
5. Risk Reduction Planning: <5a.Risk Reduction Evaluation> and <5b.Risk Reduction Plan> .................... 19
5.1 Inputs ............................................................................................................................................... 19
5.2 Outputs ............................................................................................................................................ 20
6. Mitigated Risk Analysis: <6a.Mitigated Risk Assess>, <6b.Mitigated Risk Results>, <6c.Mitigated Risk Ranking> and <6d.Mitigated Risk Ranking Plots> ....................................................................................... 23

User’s Guide to the Template for Risk Management Planning for Rapid Renewal Projects
1
1. Introduction
1.1 Purpose and Objectives • Facilitate simplified risk management planning (in terms of proactive risk reduction, but not
contingency or recovery management) for relatively simple rapid renewal projects. • Optimize key rapid renewal project performance objectives (measures):
o Minimize project schedule in terms of project construction completion (operations start) date;
o Minimize project cost in terms of total inflated cost (through construction); o Minimize project disruption, in terms of total user impacts (through construction); and o Maximize project longevity in terms of combination of schedule, cost, and disruption
postconstruction (i.e., considering operations and replacement). • Optimize by minimizing combined project performance in terms of combination of project
schedule (through construction), inflated project cost (through construction), project disruption (through construction), and project longevity (postconstruction).
1.2 Background and Limitations • Refer to SHRP 2 R09, Guide for the Process of Managing Risk on Rapid Renewal Projects (Guide)
and related training materials— for more discussion and examples. • Uncertainty (or range) in project performance is not evaluated, only mean values which, by
themselves, would not be sufficient to establish budgets or milestones. • Template was developed by Golder Associates Inc. (Golder) for its own use. This is a Beta version
(dated June 30, 2010) and, as such, is still under development and might contain some "bugs." Please contact Golder if bugs are discovered so that they can be fixed in future versions. Golder provides this version solely as a courtesy, but does not warrant that the results are correct and cannot warrant that either the user-specified inputs are appropriate or the results will be interpreted correctly by the user, both of which are outside of Golder's control. In using this template, users acknowledges that they do so at their own risk, and that Golder has no liability for such use.
1.3 General Guidance • Project performance components are separated (refer to Chapter 2 in the Guide):
o “Activities” (pieces of project) versus “project” (combination of all activities). o “Base” (without risk or contingency/float) versus “risk” (complementary to “base,”
which is intended to be covered by contingency/float), where “risk” includes opportunities (i.e., simply negative risks). “Total” is the combination of “base” and “risk.”
o “Unmitigated” (before additional risk reduction actions) versus “mitigated” (with additional risk reduction actions).
o “Mean” (probability-weighted average value) versus “uncertainty/range” (likelihoods of various possible values). This template does not include assessment and determination
User’s Guide to the Template for Risk Management Planning for Rapid Renewal Projects
2
of full uncertainty/range, only mean values (which by themselves would not be sufficient for establishing budgets and milestones).
• Proactive risk reduction process (refer to Chapter 2 in the Guide): o Unmitigated (before additional risk reduction actions)
• Unmitigated “base” assessment and performance analysis • Unmitigated “risk” identification and assessments • Unmitigated “total” performance analysis
o Mitigated (with additional risk reduction actions) • Mitigation identification (focusing on key risks), implementation and
effectiveness assessments, cost-effectiveness evaluation, and subsequent selection
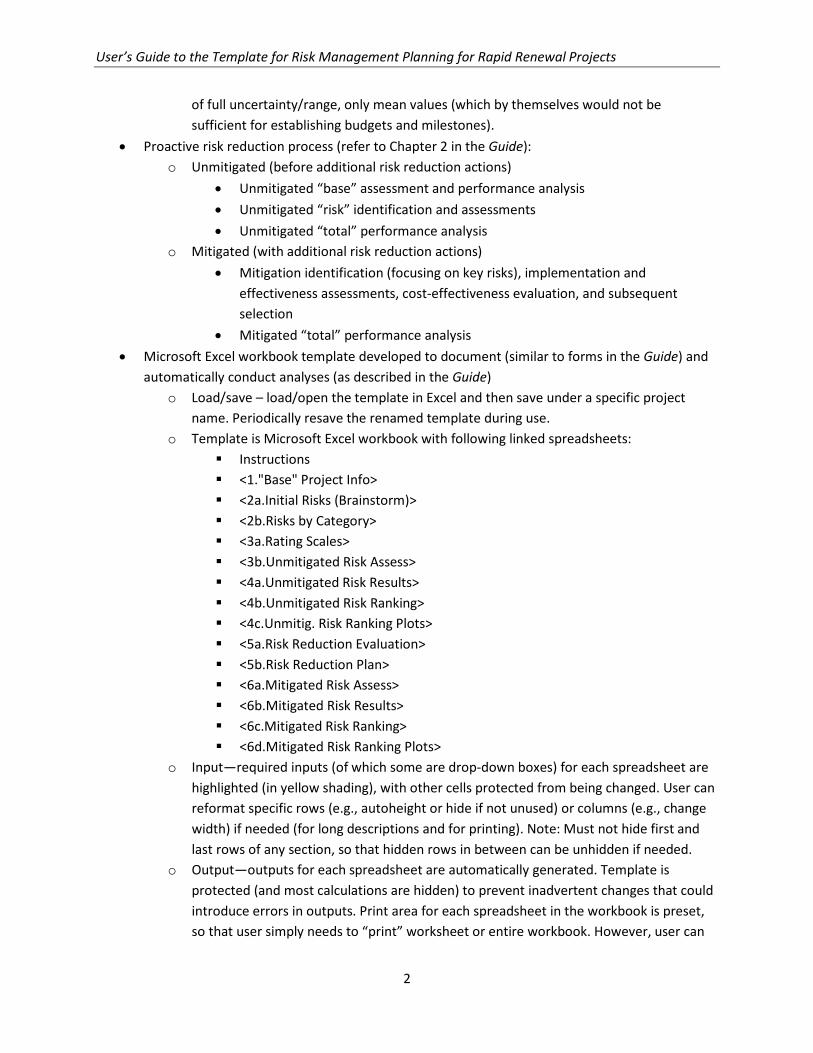
• Mitigated “total” performance analysis • Microsoft Excel workbook template developed to document (similar to forms in the Guide) and
automatically conduct analyses (as described in the Guide) o Load/save – load/open the template in Excel and then save under a specific project
name. Periodically resave the renamed template during use. o Template is Microsoft Excel workbook with following linked spreadsheets:
Instructions <1."Base" Project Info> <2a.Initial Risks (Brainstorm)> <2b.Risks by Category> <3a.Rating Scales> <3b.Unmitigated Risk Assess> <4a.Unmitigated Risk Results> <4b.Unmitigated Risk Ranking> <4c.Unmitig. Risk Ranking Plots> <5a.Risk Reduction Evaluation> <5b.Risk Reduction Plan> <6a.Mitigated Risk Assess> <6b.Mitigated Risk Results> <6c.Mitigated Risk Ranking> <6d.Mitigated Risk Ranking Plots>
o Input—required inputs (of which some are drop-down boxes) for each spreadsheet are highlighted (in yellow shading), with other cells protected from being changed. User can reformat specific rows (e.g., autoheight or hide if not unused) or columns (e.g., change width) if needed (for long descriptions and for printing). Note: Must not hide first and last rows of any section, so that hidden rows in between can be unhidden if needed.
o Output—outputs for each spreadsheet are automatically generated. Template is protected (and most calculations are hidden) to prevent inadvertent changes that could introduce errors in outputs. Print area for each spreadsheet in the workbook is preset, so that user simply needs to “print” worksheet or entire workbook. However, user can
User’s Guide to the Template for Risk Management Planning for Rapid Renewal Projects
3
reformat specific rows (e.g., autoheight or hide if not used) or columns (e.g., change width) if needed (for long descriptions).
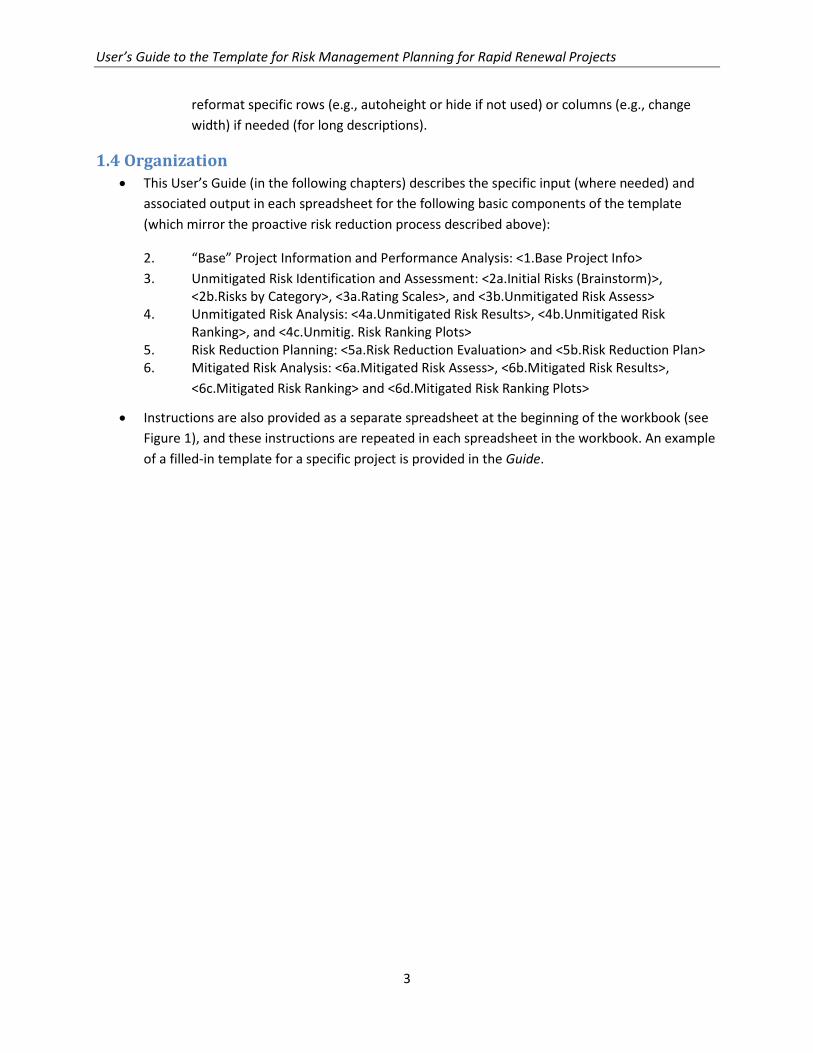
1.4 Organization • This User’s Guide (in the following chapters) describes the specific input (where needed) and
associated output in each spreadsheet for the following basic components of the template (which mirror the proactive risk reduction process described above):
2. “Base” Project Information and Performance Analysis: <1.Base Project Info> 3. Unmitigated Risk Identification and Assessment: <2a.Initial Risks (Brainstorm)>,
<2b.Risks by Category>, <3a.Rating Scales>, and <3b.Unmitigated Risk Assess> 4. Unmitigated Risk Analysis: <4a.Unmitigated Risk Results>, <4b.Unmitigated Risk
Ranking>, and <4c.Unmitig. Risk Ranking Plots> 5. Risk Reduction Planning: <5a.Risk Reduction Evaluation> and <5b.Risk Reduction Plan> 6. Mitigated Risk Analysis: <6a.Mitigated Risk Assess>, <6b.Mitigated Risk Results>,
<6c.Mitigated Risk Ranking> and <6d.Mitigated Risk Ranking Plots>
• Instructions are also provided as a separate spreadsheet at the beginning of the workbook (see Figure 1), and these instructions are repeated in each spreadsheet in the workbook. An example of a filled-in template for a specific project is provided in the Guide.

User’s Guide to the Template for Risk Management Planning for Rapid Renewal Projects
4
Figure 1. <Instructions>.

User’s Guide to the Template for Risk Management Planning for Rapid Renewal Projects
5
2. “Base” Project Information and Performance Analysis: <1.Base Project Info>
• Refer to Chapter 4 in the Guide • Spreadsheet <1.Base Project Info> (Figure 2)
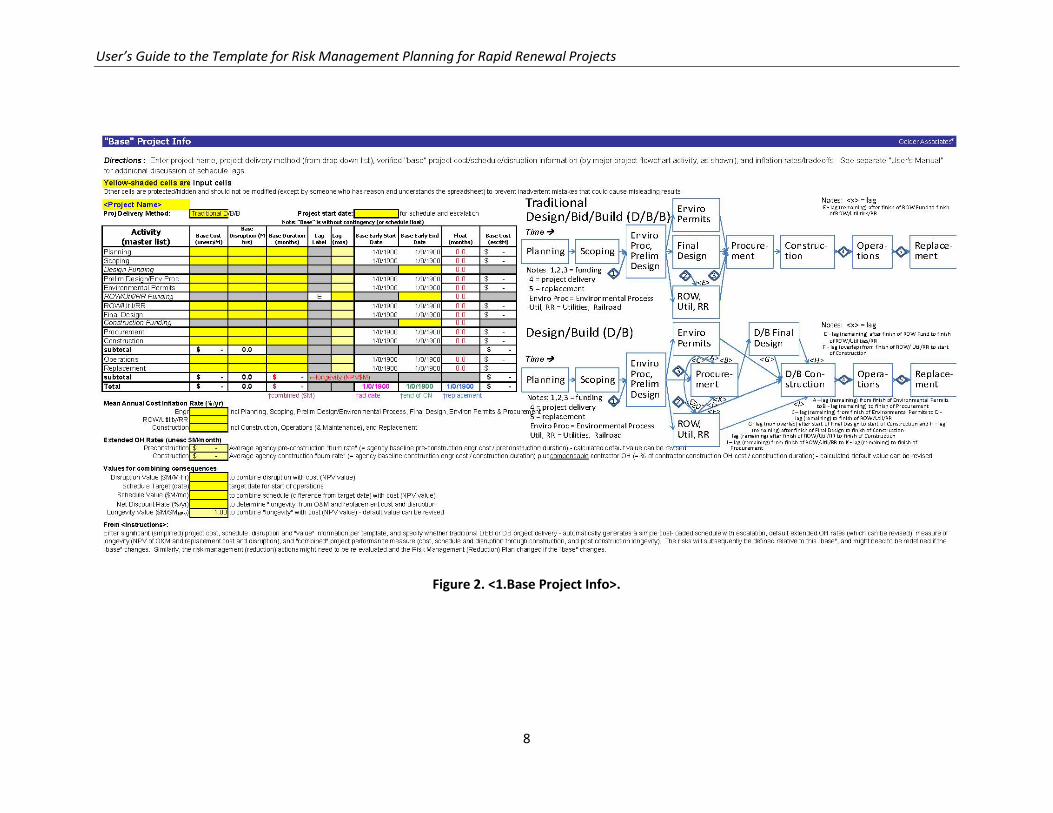
2.1 Inputs In spreadsheet <1.Base Project Info> (Figure 2):
• Enter <project name> and select <project delivery method, either Traditional Design/Bid/Build (D/B/B) or Design/Build (D/B), from drop-down box>. Each project delivery method subsequently references a different simplified flowchart, as shown in Figure 2, which is carried throughout the rest of the analysis. Each project is divided into the following activities (regardless of project delivery method, which only affects the sequence of these activities):
o Planning o Scoping o Design funding o Preliminary design/environmental process o Environmental permits o ROW/utility/RR funding o ROW/utilities/RR o Final design o Construction funding o Procurement o Construction o Operations o Replacement
• Enter project base schedule factors: o <mean durations in months or mean milestone dates> for each activity in relevant
simplified flowchart (note that funding activities are expressed as milestones, whereas the other activities are expressed as durations)
o <lags, in months> for specific activities, depending on which flowchart is relevant Traditional D-B-B, which tends to be linear/sequential
− E – lag (remaining) after finish of ROW Fund to finish of ROW/Utilities/RR
Design–Build, which tends to overlap/accelerate − A – lag (remaining) from finish of Environmental Permits to B − lag
(remaining) to finish of Procurement − C – lag (remaining) from finish of Environmental Permits to D − lag
(remaining) to finish of ROW/Utilities/RR − E − lag (remaining) after finish of ROW Fund to finish of
ROW/Utilities/RR − F − lag (overlap) from finish of ROW/Utilities/RR to start of Construction
User’s Guide to the Template for Risk Management Planning for Rapid Renewal Projects
6
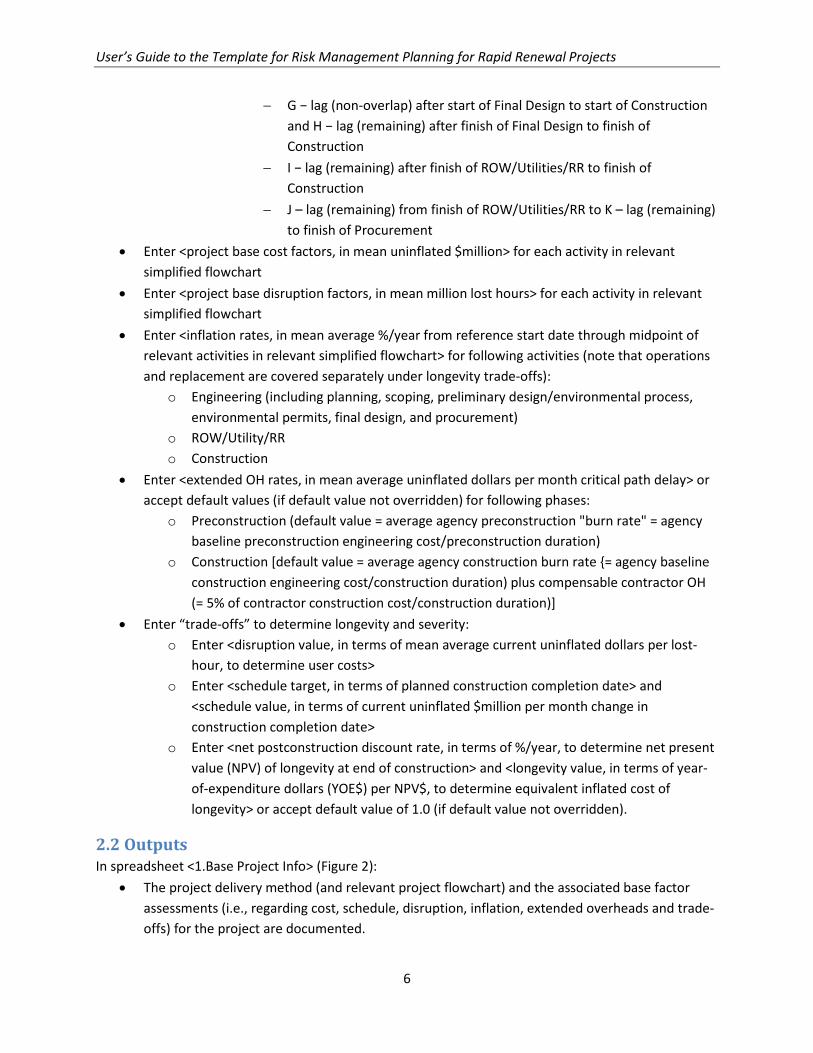
− G − lag (non-overlap) after start of Final Design to start of Construction and H − lag (remaining) after finish of Final Design to finish of Construction
− I − lag (remaining) after finish of ROW/Utilities/RR to finish of Construction
− J – lag (remaining) from finish of ROW/Utilities/RR to K – lag (remaining) to finish of Procurement
• Enter <project base cost factors, in mean uninflated $million> for each activity in relevant simplified flowchart
• Enter <project base disruption factors, in mean million lost hours> for each activity in relevant simplified flowchart
• Enter <inflation rates, in mean average %/year from reference start date through midpoint of relevant activities in relevant simplified flowchart> for following activities (note that operations and replacement are covered separately under longevity trade-offs):
o Engineering (including planning, scoping, preliminary design/environmental process, environmental permits, final design, and procurement)
o ROW/Utility/RR o Construction
• Enter <extended OH rates, in mean average uninflated dollars per month critical path delay> or accept default values (if default value not overridden) for following phases:
o Preconstruction (default value = average agency preconstruction "burn rate" = agency baseline preconstruction engineering cost/preconstruction duration)
o Construction [default value = average agency construction burn rate {= agency baseline construction engineering cost/construction duration) plus compensable contractor OH (= 5% of contractor construction cost/construction duration)]
• Enter “trade-offs” to determine longevity and severity: o Enter <disruption value, in terms of mean average current uninflated dollars per lost-
hour, to determine user costs> o Enter <schedule target, in terms of planned construction completion date> and
<schedule value, in terms of current uninflated $million per month change in construction completion date>
o Enter <net postconstruction discount rate, in terms of %/year, to determine net present value (NPV) of longevity at end of construction> and <longevity value, in terms of year-of-expenditure dollars (YOE$) per NPV$, to determine equivalent inflated cost of longevity> or accept default value of 1.0 (if default value not overridden).
2.2 Outputs In spreadsheet <1.Base Project Info> (Figure 2):
• The project delivery method (and relevant project flowchart) and the associated base factor assessments (i.e., regarding cost, schedule, disruption, inflation, extended overheads and trade-offs) for the project are documented.

User’s Guide to the Template for Risk Management Planning for Rapid Renewal Projects
7
• The base project performance is automatically determined: o Project base schedule, in terms of mean early start and end dates and float (in months)
for each activity in relevant simplified flowchart, and key project base mean milestone dates (i.e., for advertisement, end of construction, and replacement)
o Project base cost, in terms of both mean uninflated and inflated millions of dollars, through construction and postconstruction
o Project base disruption, in terms of mean million lost hours, through construction and postconstruction
o Project base longevity (i.e., combination via specified trade-offs of mean postconstruction schedule, cost, and disruption), in terms of mean NPV millions of dollars at end of construction
o Project base combined performance (i.e., combination via specified trade-offs of mean schedule, cost, and disruption through construction, and mean longevity), in terms of mean equivalent inflated millions of dollars.
User’s Guide to the Template for Risk Management Planning for Rapid Renewal Projects
8
Figure 2. <1.Base Project Info>.

User’s Guide to the Template for Risk Management Planning for Rapid Renewal Projects
9
3. Unmitigated Risk Identification and Assessment: <2a.Initial Risks (Brainstorm)>, <2b.Risks by Category>, <3a.Rating Scales>, and <3b.Unmitigated Risk Assess>
• Refer to Chapters 5 and 6 in the Guide • Spreadsheets <2a.Initial Risks (Brainstorm)> (Figure 3), <2b.Risks by Category> (Figure 4),
<3a.Rating Scales> (Figure 5), and <3b.Unmitigated Risk Assess> (Figure 6)
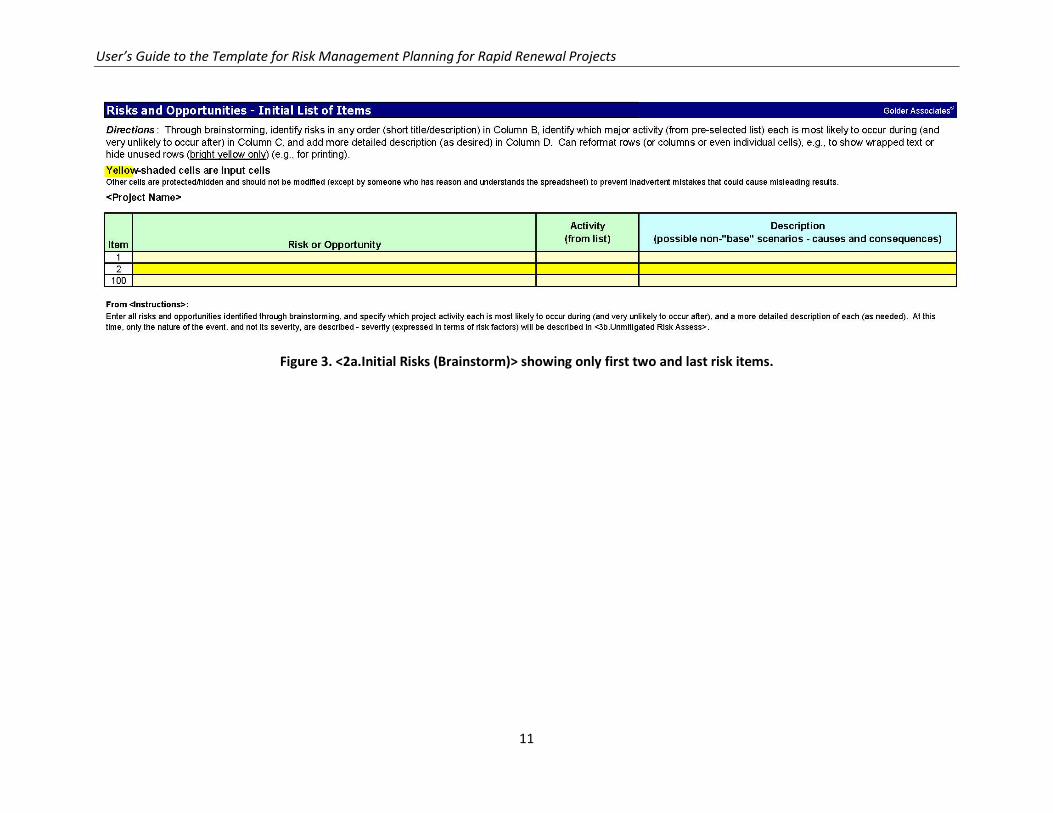
3.1 Inputs • In <2a.Initial Risks (Brainstorm)> (Figure 3), enter <descriptive title> and <description> for each
risk (up to 100, identified through brainstorming, considering current plans without additional risk management) in random order, and then enter their “category” (select <flowchart activity, from drop-down box> during which they are most likely to occur and unlikely to occur after). Unused rows (except the last) can be hidden.
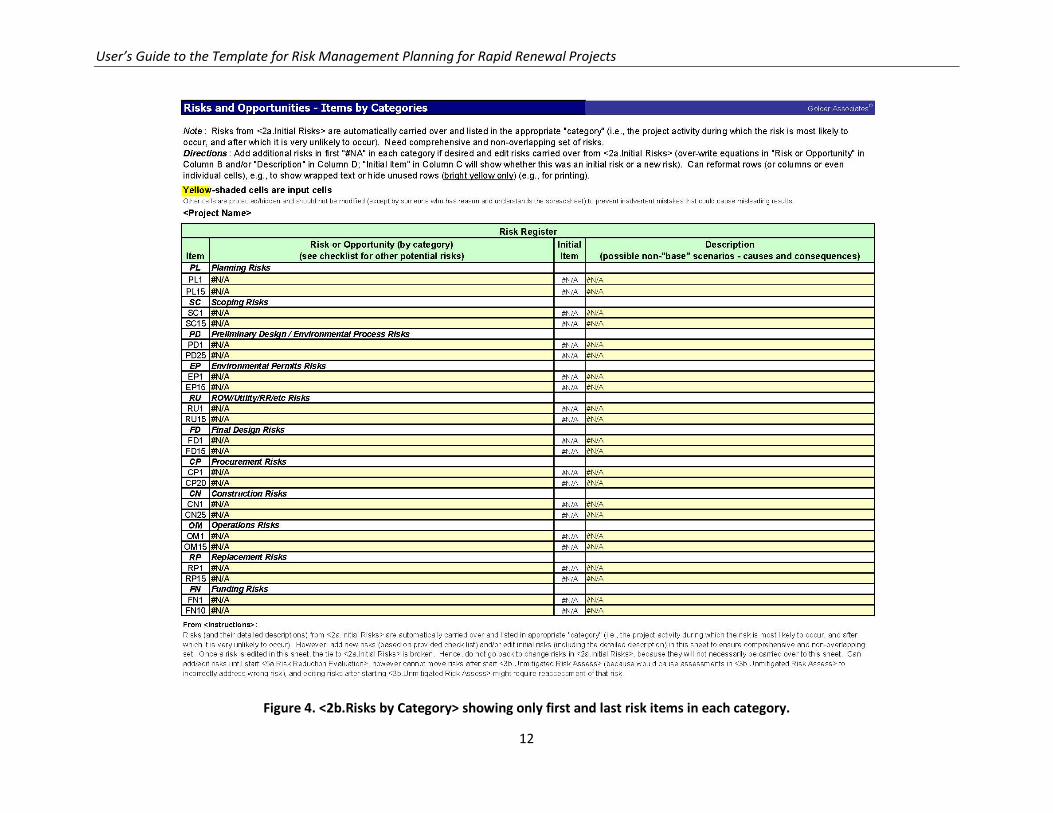
• In <2b.Risks by Category> ( Figure 4), edit categorized risks, which have been automatically carried over from <2a.Initial Risks (Brainstorm)>, for example, by comparing with checklist in the Guide, to ensure comprehensive and nonoverlapping set in each category (up to maximum number per category, for example, 15 for most categories, 20 for Procurement, 25 for Construction, and 10 for Funding). Can edit <descriptive title> and/or <description>, by either simply typing over or first copying and pasting special (values); however, such editing breaks the link with <2a.Initial Risks (Brainstorm)>. Can also add risks by simply typing <descriptive title> and <description>, overriding the equations that carry them over from <2a.Initial Risks (Brainstorm)>. Similarly, can delete risks by simply deleting <descriptive title> and <description>, although unless replaced there will be a gap in the risk numbering. All changes in <descriptive title> and/or <description> must be made in this sheet; these are carried forward throughout the rest of the workbook (by item number, e.g., PL1).
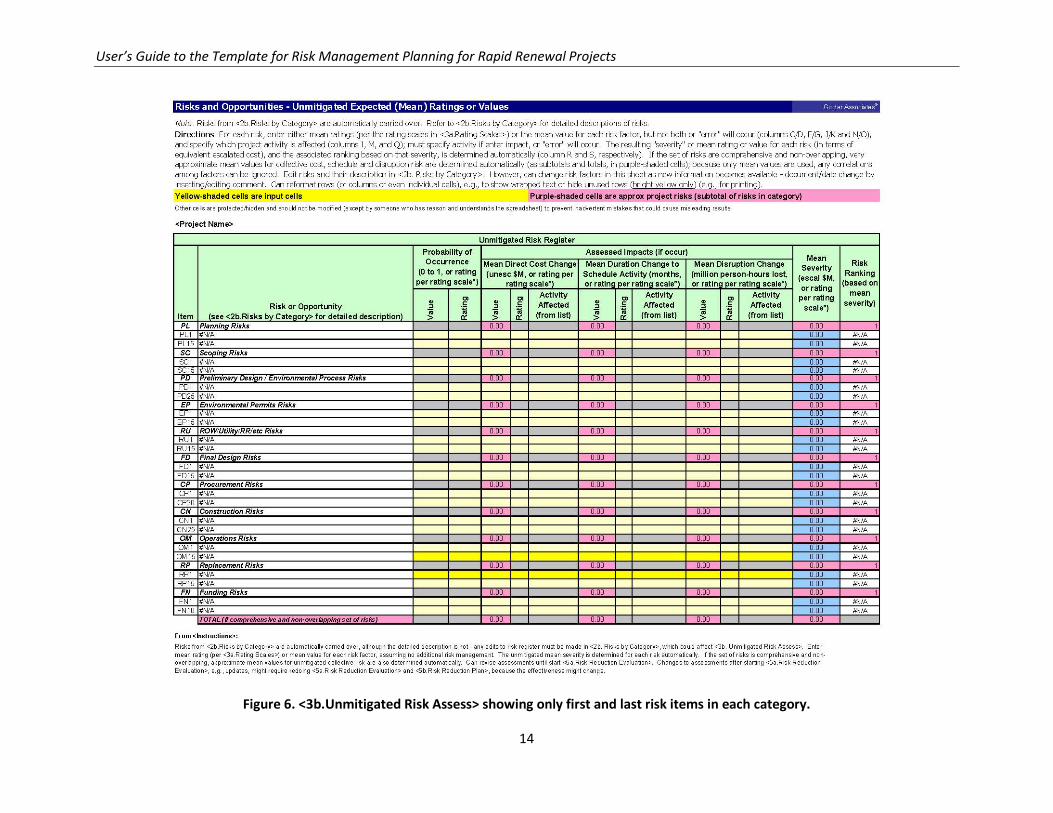
• In <3b.Unmitigated Risk Assess> (Figure 6), for each risk (which have been automatically carried over from <2b.Risks by Category>), enter risk factor assessments (either <mean values> or <ratings, from drop-down box>, per predefined rating scales in <3a.Rating Scales> (Figure 5), and <affected activity, from drop-down box>) before any additional risk management:
o Unmitigated probability of that risk event occurring o Unmitigated mean cost impact (and affected project activity) if that risk event occurs, in
terms of uninflated millions of dollars o Unmitigated mean schedule impact (and affected project activity) if that risk event
occurs, in terms of months of delay in affected activity (regardless of whether it is on critical path)
o Unmitigated mean disruption impact (and affected project activity) if that risk event occurs, in terms of million lost hours
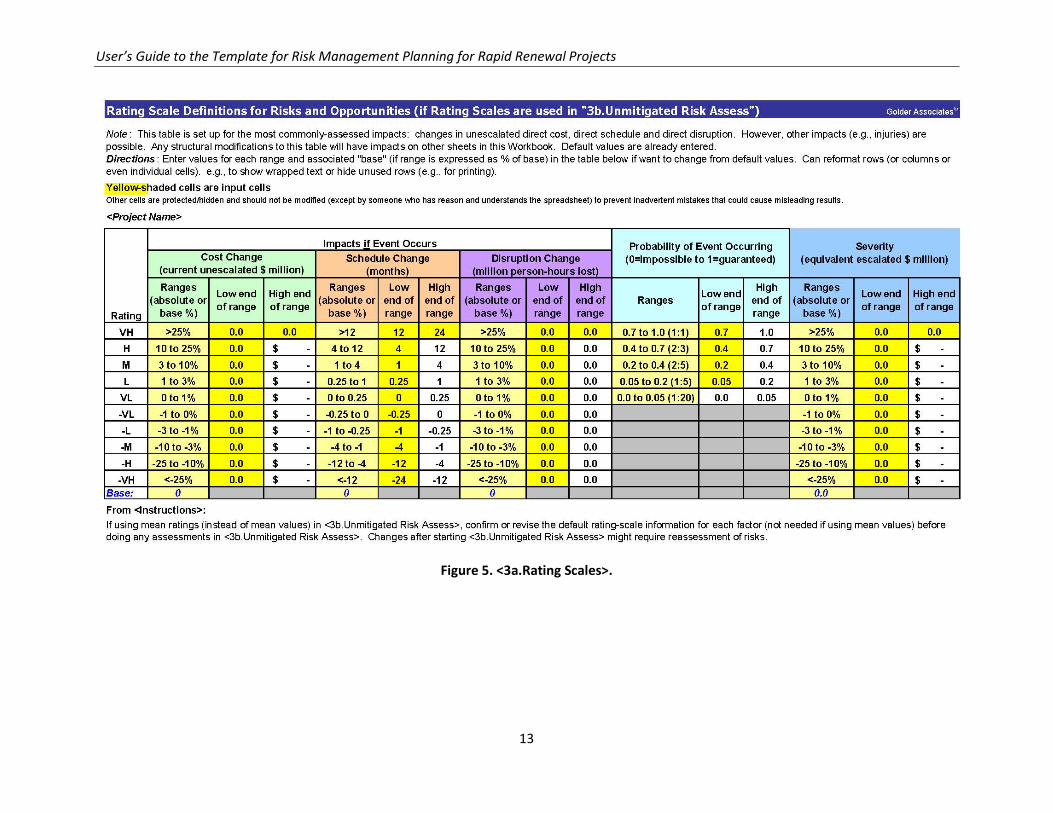
• In <3a.Rating Scales> (Figure 5), if rating scales are used in <3b.Unmitigated Risk Assess> (Figure 6), enter <value> in appropriate units for each unique range end point. For cost impact, disruption impact, and severity, default values are tied (as specified percentages) to base costs,

User’s Guide to the Template for Risk Management Planning for Rapid Renewal Projects
10
base disruption and base severity (actually combined performance), either from <1.Base Project Info> (Figure 2) or overridden; however, these can be overridden by simply typing in specific values (although this breaks the link to those base values). Common default values are also provided for schedule impacts and probabilities; these default values can also be overridden by simply typing in specific values.
3.2 Outputs • In <2b.Risks by Category> (Figure 4), the risks (by category) are documented. Unused rows
(except first and last in each category) can be hidden. • In <3b.Unmitigated Risk Assess> (Figure 6):
o The unmitigated risk factor assessments (in either mean values or ratings, per predefined rating scales in <3a.Rating Scales> (Figure 5) for each identified risk are documented
o The unmitigated mean change in combined project performance or “severity” (mean values or ratings, per predefined rating scales in <3a.Rating Scales> (Figure 5, in terms of equivalent inflated millions of dollars) is automatically determined for each identified risk (ratings are used if any of the risk factors are expressed as ratings), and the identified risks are ranked on that basis
o The sums (over all risks) of the mean performance measures (e.g., direct cost) are also determined automatically for each category, as well as over all categories (note that although informative, these sums would not be adequate to establish budgets/milestones/contingencies)
o Unused rows (except first and last in each category) can be hidden.
User’s Guide to the Template for Risk Management Planning for Rapid Renewal Projects
11
Figure 3. <2a.Initial Risks (Brainstorm)> showing only first two and last risk items.
User’s Guide to the Template for Risk Management Planning for Rapid Renewal Projects
12
Figure 4. <2b.Risks by Category> showing only first and last risk items in each category.
User’s Guide to the Template for Risk Management Planning for Rapid Renewal Projects
13
Figure 5. <3a.Rating Scales>.
User’s Guide to the Template for Risk Management Planning for Rapid Renewal Projects
14
Figure 6. <3b.Unmitigated Risk Assess> showing only first and last risk items in each category.
User’s Guide to the Template for Risk Management Planning for Rapid Renewal Projects
15
4. Unmitigated Risk Analysis: <4a.Unmitigated Risk Results>, <4b.Unmitigated Risk Ranking>, and <4c.Unmitig. Risk Ranking Plots>
• Refer to Chapters 6 and 7 in the Guide • Spreadsheets <4a.Unmitigated Risk Results> (Figure 7), <4b.Unmitigated Risk Ranking> (Figure
8), and <4c.Unmitig. Risk Ranking Plots> (Figure 9)
No inputs; only the following outputs: • In <4b.Unmitigated Risk Ranking> (Figure 8), the unmitigated identified risks are automatically
presented in rank order (based on mean severity from <3b.Unmitigated Risk Assess> (Figure 6), separately for risks and for opportunities. Unused rows (except the last) can be hidden.
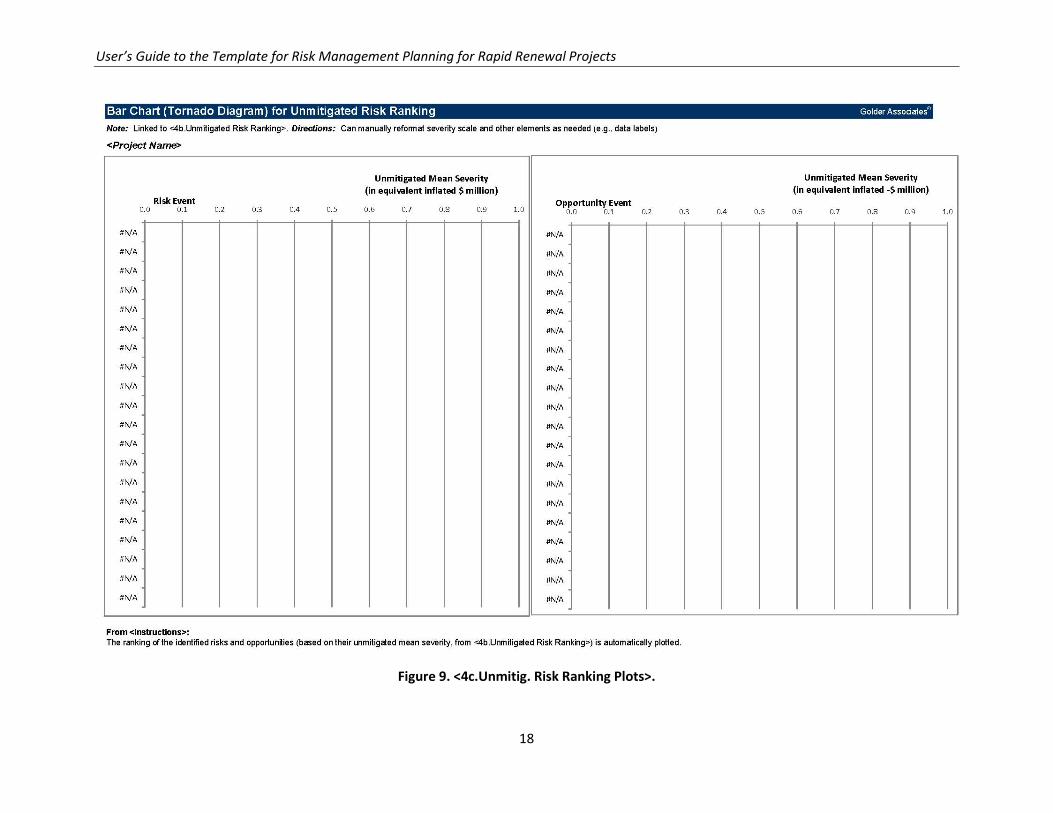
• In <4c.Unmitig. Risk Ranking Plots> (Figure 9), the top 20 unmitigated identified risks are automatically plotted in rank order (based on mean severity from <3b.Unmitigated Risk Assess>; see Figure 6), separately for risks and for opportunities.
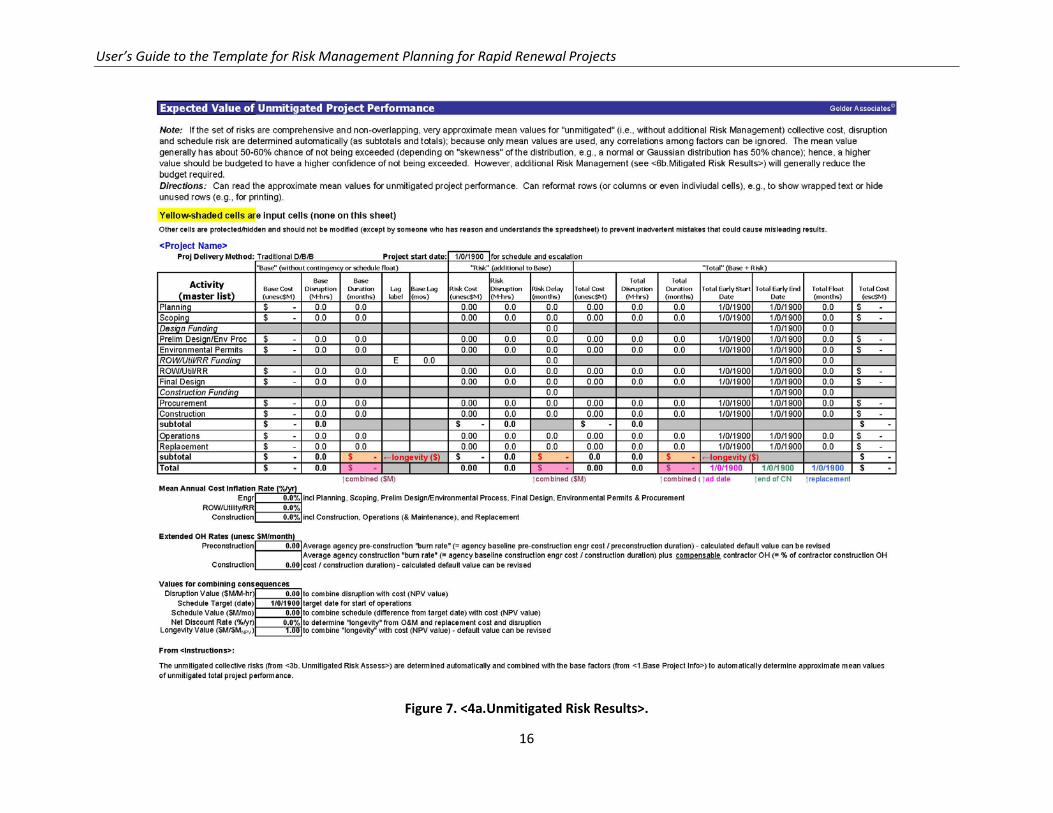
• In <4a.Unmitigated Risk Results> (Figure 7), the unmitigated mean project performance is automatically determined (based on the unmitigated risk factor assessments in <3b.Unmitigated Risk Assess> (Figure 6) and on the base factor assessments in <1.Base Project Info> (Figure 2) in similar terms as for the base mean project performance (in <1.Base Project Info>; see Figure 2): o Project unmitigated “total” schedule, in terms of mean early start and end dates and float
(in months) for each activity in relevant simplified flowchart, and key project unmitigated total mean milestone dates (i.e., for advertisement, end of construction, and replacement)
o Project unmitigated total cost, in terms of both mean uninflated and inflated millions of dollars, through construction and postconstruction
o Project unmitigated total disruption, in terms of mean million lost hours, through construction and postconstruction
o Project unmitigated total longevity (i.e., combination via specified trade-offs of mean postconstruction schedule, cost, and disruption), in terms of mean NPV millions of dollars at end of construction
o Project unmitigated total combined performance (i.e., combination via specified trade-offs of mean schedule, cost, and disruption through construction, and mean longevity), in terms of mean equivalent inflated millions of dollars
Note: Mean total project performance is approximate, depending on whether the risk register is comprehensive and nonoverlapping, and should not be used to establish budgets/milestones/contingencies.
User’s Guide to the Template for Risk Management Planning for Rapid Renewal Projects
16
Figure 7. <4a.Unmitigated Risk Results>.

User’s Guide to the Template for Risk Management Planning for Rapid Renewal Projects
17
Figure 8. <4b.Unmitigated Risk Ranking> showing only first and last ranked risk items.
User’s Guide to the Template for Risk Management Planning for Rapid Renewal Projects
18
Figure 9. <4c.Unmitig. Risk Ranking Plots>.
User’s Guide to the Template for Risk Management Planning for Rapid Renewal Projects
19
5. Risk Reduction Planning: <5a.Risk Reduction Evaluation> and <5b.Risk Reduction Plan>
• Refer to Chapters 8 and 9 in the Guide • Spreadsheets <5a.Risk Reduction Evaluation> (Figure 10) and <5b.Risk Reduction Plan> (Figure
11)
5.1 Inputs • In <5a.Risk Reduction Evaluation> (Figure 10)
o Enter <key risk item#>, which have been automatically carried over in rank order from <4b.Unmitigated Risk Ranking> (Figure 8).
o Enter <potential risk reduction actions> that have been identified for each critical risk, and categorize (select <action category>, that is, avoid, mitigate, transfer, or accept, from drop-down box).
o Enter risk reduction factor assessments for each listed risk reduction action (except for “no action”): Implementation (note that if an action addresses more than one risk, allocate its
implementation impacts to the affected risks) − <mean uninflated cost to implement, in terms of uninflated millions of
dollars> and <affected activity>, from drop-down box − <mean delay to implement, in terms of months> and <affected activity>,
from drop-down box − <mean disruption to implement, in terms of million lost hours> and
<affected activity>, from drop-down box Effectiveness [note that for reference, the unmitigated risk factor assessments
for each critical risk have been carried over from <3b.Unmitigated Risk Assess> (Figure 6)]
− <mean effectiveness, %, in reducing risk (or increasing opportunity, for which negative % is used) probability if implemented; note that +100% effectiveness reduces probability of risk to 0, whereas −100% effectiveness increases probability of opportunity to 1, and 0% effectiveness means no change>
− <mean effectiveness, %, in reducing risk (or increasing opportunity, for which negative % is used) cost impact if implemented; note that +100% effectiveness reduces risk impact to 0, whereas −100% effectiveness doubles impact of opportunity, and 0% effectiveness means no change>
− <mean effectiveness, %, in reducing risk (or increasing opportunity, for which negative % is used) delay if implemented; note that +100% effectiveness reduces risk impact to 0, whereas −100% effectiveness doubles impact of opportunity, and 0% effectiveness means no change>
User’s Guide to the Template for Risk Management Planning for Rapid Renewal Projects
20
− <mean effectiveness, %, in reducing risk (or increasing opportunity, for
which negative % is used) disruption impact if implemented; note: 100%
effectiveness reduces risk impact to 0, whereas -100% effectiveness
doubles impact of opportunity, and 0% effectiveness means no
change>>
o Select (enter <1>) risk reduction actions (based on their cost-effectiveness—see output) (note that if an action that addresses more than one risk is selected, it must be selected for all affected risks)
• In <5b.Risk Reduction Plan> (Figure 11), enter <selected risk reduction action #> (based on information carried over from <5a.Risk Reduction Evaluation> (Figure 10) and then enter implementation plan logistics for that action:
o <name of person responsible for implementing that action> o <schedule/milestone date for completing that action> o <comments regarding implementing that action>.
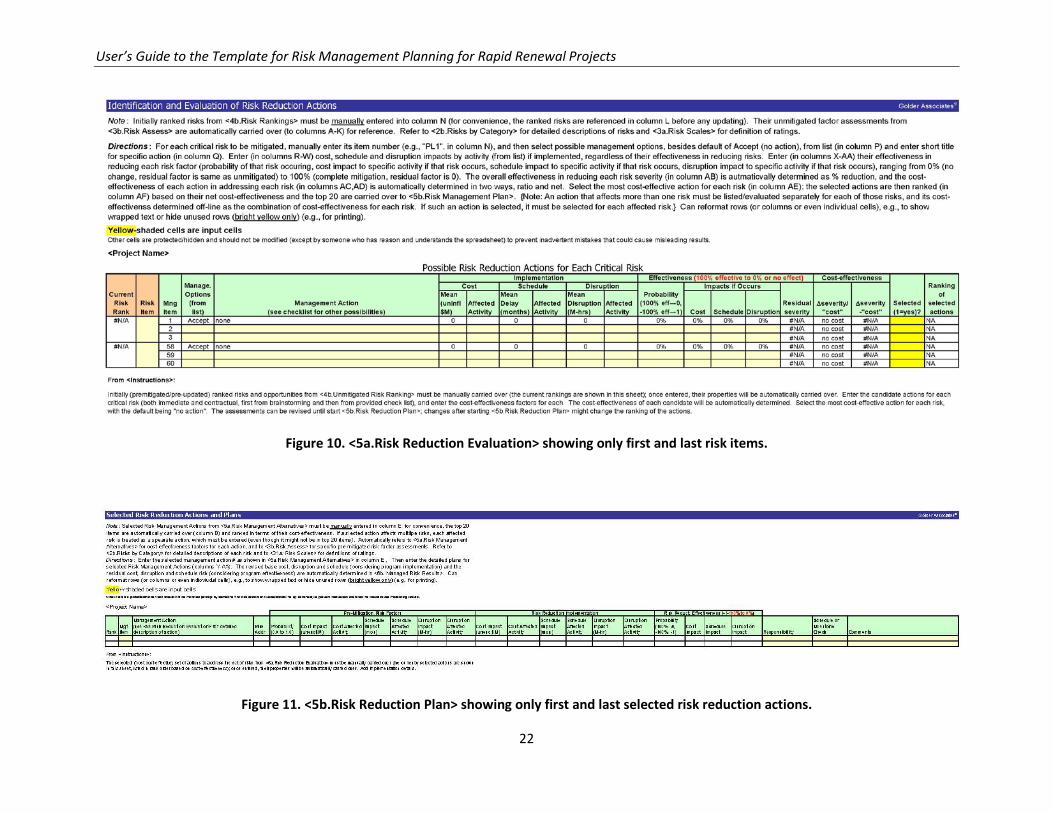
5.2 Outputs • In <5a.Risk Reduction Evaluation> (Figure 10):
o The potential risk reduction actions identified for each critical risk are documented (note that an action that affects more than one risk must be entered separately for each affected risk)
o The risk reduction factor assessments (in mean values) for each identified potential risk reduction action for each critical risk are documented
o The effectiveness of each identified potential risk reduction action is automatically determined, in terms of mean % effectiveness in reducing each risk (or increasing opportunity) severity
o The cost-effectiveness of each identified potential risk reduction action is automatically determined, both in terms of mean ratio (i.e., mean change in risk severity over mean change in combined performance for implementation) and mean net (i.e., mean change in risk severity minus mean change in combined performance for implementation, in equivalent inflated millions of dollars) (note that if an action affects more than one risk, the cost-effectiveness of that action is the combination of the cost-effectiveness in addressing each risk)
o The selection of risk reduction actions (presumably based on their cost-effectiveness) is documented, and the selected actions are automatically ranked on the basis of their cost-effectiveness (i.e., mean net) in addressing each risk separately (note that if an action that addresses more than one risk is selected, it must be selected for all affected risks)
o Unused rows (except first and last) can be hidden. • In <5b.Risk Reduction Plan> (Figure 11):
User’s Guide to the Template for Risk Management Planning for Rapid Renewal Projects
21
o The selected proactive risk reduction actions are presented (in rank order of their cost-effectiveness) and summarized (in terms of their implementation and effectiveness factor assessments and their resulting cost-effectiveness)
o The implementation plan (i.e., responsibility, schedule/milestone, and comments) for each selected risk reduction action is documented
o Unused rows (except first and last) can be hidden
User’s Guide to the Template for Risk Management Planning for Rapid Renewal Projects
22
Figure 10. <5a.Risk Reduction Evaluation> showing only first and last risk items.
Figure 11. <5b.Risk Reduction Plan> showing only first and last selected risk reduction actions.
User’s Guide to the Template for Risk Management Planning for Rapid Renewal Projects
23
6. Mitigated Risk Analysis: <6a.Mitigated Risk Assess>, <6b.Mitigated Risk Results>, <6c.Mitigated Risk Ranking> and <6d.Mitigated Risk Ranking Plots>
• Refer to Chapters 6, 7, and 8 in the Guide • Spreadsheets <6a.Mitigated Risk Assess> (Figure 12, <6b.Mitigated Risk Results> (Figure 13),
<6c.Mitigated Risk Ranking> (Figure 14) and <6d.Mitigated Risk Ranking Plots> (Figure 15)
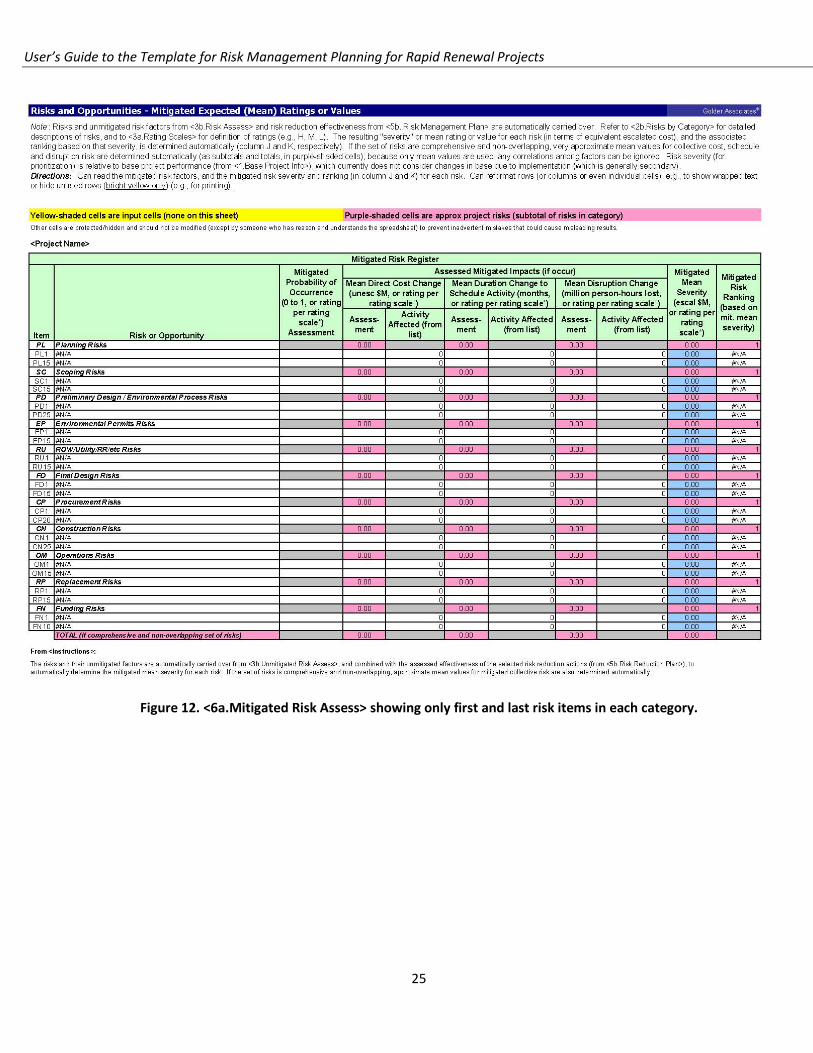
No inputs; only following outputs: • In <6a.Mitigated Risk Assess> (Figure 12), in the same way as in <3b.Unmitigated Risk Assess>
(Figure 6): o The mitigated risk factor assessments (either in mean values or ratings, per predefined
rating scales in <3a.Rating Scales> (Figure 5) are summarized o The mitigated mean severity (mean values or ratings, per predefined rating scales in
<3a.Rating Scales> (Figure 5), in terms of equivalent inflated millions of dollars) is automatically determined for each risk (ratings are used if any of the risk factors are expressed as ratings), and the risks are ranked on that basis
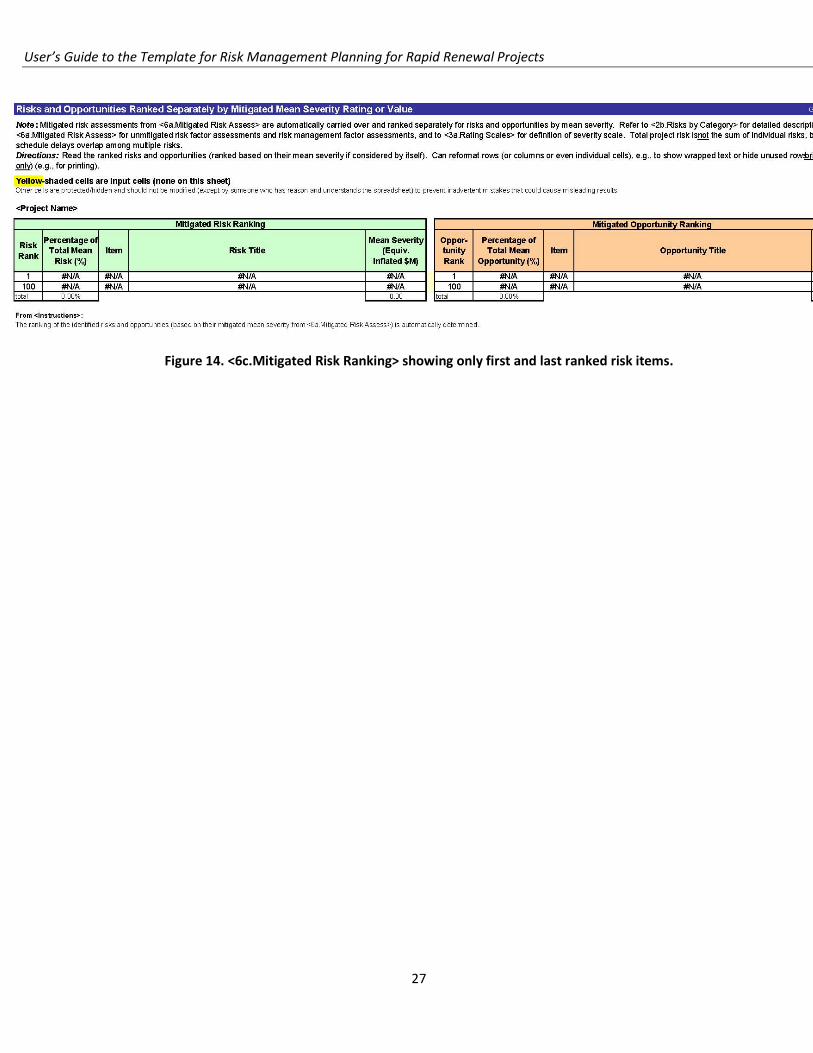
o Unused rows (except first and last in each category) can be hidden. • In <6c.Mitigated Risk Ranking> (Figure 14), in the same way as in <4b.Unmitigated Risk Ranking>
(Figure 8), the mitigated risks are automatically presented in rank order (based on mean severity from <6a.Mitigated Risk Assess> (Figure 12), separately for risks and for opportunities; unused rows (except the last) can be hidden
• In <6d.Mitigated Risk Ranking Plots> (Figure 15), in the same way as in <4c.Unmitig. Risk Ranking Plots> (Figure 9), the top 20 mitigated risks are automatically plotted in rank order (based on mean severity from <6a.Mitigated Risk Assess> (Figure 12), separately for risks and for opportunities
• In <6b.Mitigated Risk Results> (Figure 13), the mitigated mean project performance is automatically determined [based on the mitigated risk factor assessments in <6a.Mitigated Risk Assess> - (Figure 12) and on the base factor assessments in <1.Base Project Info>- (Figure 2)] in similar terms as for the base mean project performance [in <1.Base Project Info> - (Figure 2)] and the unmitigated mean project performance [in 4a.Unmitigated Risk Results> (Figure 7)]:
o Project mitigated total schedule, in terms of mean early start and end dates and float (in months) for each activity in relevant simplified flowchart, and mean key project mitigated total” milestone dates (i.e., for advertisement, end of construction, and replacement)
o Project mitigated total cost, in terms of both mean uninflated and inflated millions of dollars, through construction and postconstruction
o Project mitigated total” disruption, in terms of mean million lost hours, through construction and postconstruction
User’s Guide to the Template for Risk Management Planning for Rapid Renewal Projects
24
o Project mitigated total longevity (i.e., combination via specified trade-offs of mean postconstruction schedule, cost, and disruption), in terms of mean NPV millions of dollars at end of construction
o Project mitigated total combined performance (i.e., combination via specified trade-offs of mean schedule, cost, and disruption through construction, and mean longevity), in terms of mean equivalent inflated millions of dollars
Note: Same as for <4a. Unmitigated Risk Results>, mean total project performance is approximate, depending on whether the risk register is comprehensive and nonoverlapping, and should not be used to establish budgets/milestones/contingencies.
User’s Guide to the Template for Risk Management Planning for Rapid Renewal Projects
25
Figure 12. <6a.Mitigated Risk Assess> showing only first and last risk items in each category.

User’s Guide to the Template for Risk Management Planning for Rapid Renewal Projects
26
Figure 13. <6b.Mitigated Risk Results>.
User’s Guide to the Template for Risk Management Planning for Rapid Renewal Projects
27
Figure 14. <6c.Mitigated Risk Ranking> showing only first and last ranked risk items.

User’s Guide to the Template for Risk Management Planning for Rapid Renewal Projects
28
Figure 15. <6d.Mitigated Risk Ranking Plots>.