Embed Size (px)
Citation preview
User Manual
SLM Software for PCE-428 / 430 / 432
Post-process software of Sound Level Meter

SLM Software for PCE-428 / 430 / 432 User Manual
V2.0
Copyright © 2017 PCE Instruments

Product functional specifications are subject to change without noitice
www.pce-instruments.com
August, 2017


SLM PCE Software PCE Instruments
1
THIS MATERIAL, INCLUDING DOCUMENTATION AND ANY RELATED COMPUTER
PROGRAMS, IS PROTECTED BY COPYRIGHT CONTROLLED BY PCE INSTRUMENTS.
ALL RIGHTS ARE RESERVED. COPYING, INCLUDING REPRODUCING, STORING,
ADAPTING OR TRANSLATING, ANY OR ALL OF THIS MATERIAL REQUIRES THE
PRIOR WRITTEN CONSENT OF PCE INSTRUMENTS. THIS MATERIAL ALSO
CONTAINS CONFIDENTIAL INFORMATION, WHICH MAY NOT BE DISCLOSED TO
OTHERS WITHOUT THE PRIOR WRITTEN CONSENT OF PCE INSTRUMENTS.
PCE INSTRUMENTS and its Logo are registered trademarks of PCE Instruments, and other
products or company names mentioned in this article are trademarks or trade names of their
respective owners.
This manual does not have any form of security, position or other implied. If there is any loss
of data or benefit due to the information referred to in this manual or in respect of the
information, PCE INSTRUMENTS and its staff will not be liable for any responsibility. PCE
INSTRUMENTS reserve the right of final interpretation of this manual.

Post-process software of Sound Level Meter PCE Instruments
2
Contents
1. Introduction .................................................................................................................... 3
1.1 About this manual ....................................................................................................... 3
1.2 About VA series software ............................................................................................ 3
1.3 General ...................................................................................................................... 3
2. Suitable Objects ............................................................................................................. 4
3. Install & license .............................................................................................................. 5
3.1 Hardware Requirements ............................................................................................ 5
3.2 Installation .................................................................................................................. 5
3.3 License management ................................................................................................. 5
4. Interface of SLM ............................................................................................................. 6
5. Function ......................................................................................................................... 7
5.1 How to Point to a new Path ........................................................................................ 7
5.2 How to Load the data file ............................................................................................ 8
5.3 Read the CSD file ....................................................................................................... 9
5.4 Read the SWN file .................................................................................................... 11
5.4.1 The OPTIONS of data postprocessing ............................................................. 12
5.4.2 Average of the SWN Data ................................................................................. 13
5.4.3 WECPNL calculation .......................................................................................... 15
5.4.4 Calculate Ld & Ln .............................................................................................. 16
5.5 Read the OCT file ..................................................................................................... 17
5.5.1 Overall Average ................................................................................................. 18
5.5.2 Average as time slice......................................................................................... 20
6. Others .......................................................................................................................... 21

SLM PCE Software PCE Instruments
3
1. Introduction
1.1 About this manual
This user’s manual describes the process of using SLM.
This user’s manual presents the software version named 1.6 and the object files are the
saved files by PCE INSTRUMENTS sound lever meter PCE-428 / 430 / 432 whose version is
3.01 and above. The succeeding software versions (marked with the bigger numbers) can
slightly change the view of some interfaces presented in the text of the manual.
1.2 About SLM PCE software
SLM PCE series software is acoustical measurement software. SLM PCE takes the
advantage of computer power and performs all signal analysis within the computer. With PCE
INSTRUMENTS Data Acquisition Hardware and Microphones, SLM PCE represents the
most cost-effective solution for all your needs in acoustic measurement and analysis.
SLM PCE is developed based on the international standards. SLM PCE has module design
with the special applications according to ISO standard requirements, such as Sound Power,
Sound Insulation, and Impedance tube Measurements. SLM PCE is specially designed for
the saved files by PCE-428/430/432. The saved noise time history data can be analyzed and
handled by SLM PCE.
1.3 General
Thanks
Thanks for purchasing SLM PCE software. May this software satisfy your diversified
requirements.

Post-process software of Sound Level Meter PCE Instruments
4
Support
PCE INSTRUMENTS product support and service is only provided to valid, registered users.
If any problems, please feel free to contact PCE INSTRUMENTS for help via send email to
UPDATE
PCE INSTRUMENTS may create, from time to time, update versions of this software. PCE
INSTRUMENTS reserves the right to make changes to the software or its documentation
without notice. At its option, PCE INSTRUMENTS will make such updates available to
registered users.
2. Suitable Objects
The files that the SLM can handle are only the saved files recorded by PCE-428/430/432.
1. CSD file
Current data file of sound level meter, which record the data shown on the sound level
meter at the saving time, under the mode of Level Meter or Octave.
2. SWN file
Time history data by sound level meter on the mode of Level Meter, which record 3
profiles’ result in a period of time.
3. OCT file
Time history data by sound level meter on the mode of Octave, which record 1/1 OCT or
1/3 OCT spectrum results in a period of time.

SLM PCE Software PCE Instruments
5
3. Installation & license
3.1 Hardware Requirements
The hardware listings below are not to be viewed as the minimal configuration, but as a
configuration enabling professional to work. SLM can be run under Windows2000 /NT/XP or
Windows 7.
Towards the high end there are no limits except economics and availability.
PC: Pentium 2G Hz or higher if available Core Duo processors
Operating system: Windows NT 4.0, Windows 2000, Windows XP or Vista
RAM memory: ≥ 512 MB
Hard disk: ≥ 60 GB
Minimum resolution: 1024*768
3.2 Installation
The first installation of SLM can be finished with a CD. Find and run “setup.exe” in the
installer folder. Then open the file “SLM from PCE INSTRUMENTS.exe” in the setup path to
run the software.
Hint: Before installing a new version, older version should be uninstalled. Or, cover the old
execute file with the new one. The latter operation is recommended on this occasion.
3.3 License management
The software is only useful for the specified files, and is used with the hardware. There is no
limit to install or to run SLM.
Post-process software of Sound Level Meter PCE Instruments
6
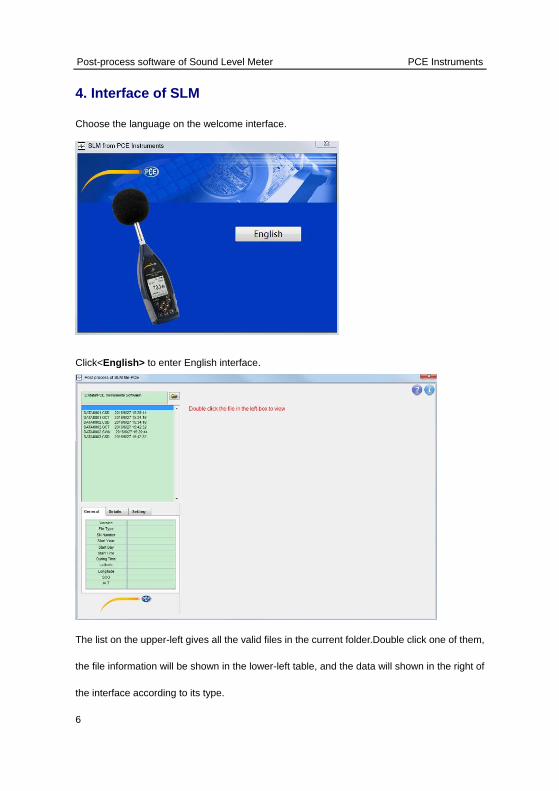
4. Interface of SLM
Choose the language on the welcome interface.
Click<English> to enter English interface.
The list on the upper-left gives all the valid files in the current folder.Double click one of them,
the file information will be shown in the lower-left table, and the data will shown in the right of
the interface according to its type.

SLM PCE Software PCE Instruments
7
5. Function Description
5.1 How to Point to a new Path
SLM will generate a folder named “SLMDATA” as the default folder on the first time you run
the software. This folder is on the same path as the EXE file. If the object files are copied to
this folder, these files will be shown in list on the upper-left of the main interface.
If the object files are in the other folder, Click to modify the default path. The
following window will be shown after clicking.
As the graph above, Find the folder needed, and double click to enter this folder, then Click
<Select Cur Dir> to back the main interface. The path on the top-left will point to the selected
folder, and the list on the upper-left will show “ …”, all the folders inside, and all the valid
data files whose suffix are “CSD”, “SWN”, or “OCT”.
Click “…” to up one level, click <XXX> to enter the folder named “XXX”, This is another
method to find the path of the data files.

Post-process software of Sound Level Meter PCE Instruments
8
5.2 How to load the data file
Only the files saved by PCE-428/430/432 sound level meter will be shown in the List. Double
click to open the chosen file on the upper-left of the main interface. The display modes of the
three kind of file are different, the different window will be opened after double click.
In the data file, the validity of the sound level at each time are recorded synchronously. The
software will judge if the data are out of the limit while reading. As shown in the red frame
below, the software can choose the data in the valid range only by checking the box options.

SLM PCE Software PCE Instruments
9
5.3 Read the CSD file
Double click the .CSD file in the list to open the CSD format file.
CSD file is the current saved file by sound level meter. There are two modes in sound level
meter PCE-428/430/432: Level Meter & OCTAVE. Then there will be two interfaces to show
the results of the CSD files.
The figure above is the Level Meter display mode of CSD file. The CSD files save 14 acoustic
parameters at each time point. All these 14 parameters of chosen time are shown in the table
below. Move the cursor of the graph can change the chosen time. The default curve’s
amplitude shown on the graph is the first defined acoustic parameter. Click the other row of
table can change to the other acoustic paramter.

Post-process software of Sound Level Meter PCE Instruments
10
The Figure above is the OCTAVE display mode of CSD file. The CSD files save the spectrum
of 1/1 OCTAVE or 1/3 OCTAVE at each time point. The values of the spectrum on the first
time point are shown in the table on the right side, and the graph of the spectrum is shown in
the middle.Click the key <←> or <→> to choose the other time point and the graph and the
table will be changed accordingly.
Note 1: the OVLD value in the last row of table gives the validity of the data on the chosen
time point, 0: valid; 1: under the floor level, and 2: exceed the upper limit.
Note 2: the CSD data are the current process results of sound level meter under the
appointed setting, that has no sense of stastics.

SLM PCE Software PCE Instruments
11
5.4 Read the SWN file
Double click the .SWN file in the list to open the SWN format file.
SWN files record the time history data of 3 profiles on the Level Meter mode.
After the SWN file is read, the time curves will be shown in the graph, and the cursors will be
fixed on both sides of the curve at first. The column” Value” in the table under the graph will
show the reading of the blue cursor. Move the blue cursor to get the reading of the other time.
Make sure that the blue cursor is earlier than the red cursor if you want to deal with the data
between the two cursors.

Post-process software of Sound Level Meter PCE Instruments
12
5.4.1 The OPTIONS of data postprocessing
The options include:
Linear mean: gives the arithmetic mean of the data between the two cursors, namely, ∑ aini=1
n,
and the integrated time.
Exp mean: gives the exponential mean of the data between the two cursors, namely, 10 ∗
lg(∑ 100.1∗aini=1
n),and the integrated time.
Maximum: Gives the maximum of the data between the two cursors, and the time of the
maximum value.
Minimum: Gives the minimum of the data between the two cursors, and the time of the
minimum value.
LN: Cumulative statistical sound level, the LN value is the level just exceeded for N% of the
time, and the integrated time, N should be defined in advance.
The keys above are to change the display mode of the curve. If you want to check the details
of a period of time, move the cursor to the both sides of the period of time frame, be sure that
the blue cursor is earlier than the red cursor, and then click <Enlarge> to magnify the curve.
And click <Return>, the curve will return to the initial situation. <AutoScale> is to change the
range of Y axis to make the curves shown in the middle.

SLM PCE Software PCE Instruments
13
5.4.2 Average of the SWN data
<Average> is to average the data between the two cursors according to the setting of time
slice. The average window will be shown after click.
For the different acoustic parameters the average mode would be different. As shown in the
red frame above, the options of the average mode could be: Exp. Mean, Lin. Mean, Maximum,
and Minimum.
The average time slice is defined by Interval(s), which can be input directly, or chosen by the
Int. Point. The use of time slice has two ways: On the point of Time or not.
As the figure above, Interval(s) is 60. If the “On the point of time” is NOT checked, the
average will be done every data number of Interval(s) / time step (Time Step is the samping
interval of the raw data in file). As the figure below, after averaging, the first result will be on
15:16:12, and the second result will be on 15:17:12…

Post-process software of Sound Level Meter PCE Instruments
14
And if the “On the point of time” is checked, the average will be given when the time is the
integral point. As the figure shown below, afert averaging the first result will be in 15:16:00,
and the second result will be in 15:17:00…
Note 1: Click <Average> to do the calculation base on the raw data every time.
Note 2: If the “On the point of time” is checked, the average time of first result and the last
one may less then the definition of Interval(s).

SLM PCE Software PCE Instruments
15
5.4.3 WECPNL calculation
If the raw data is the monitoring result around an airport, the WECPNL of airport can be
calculated according to the approximation method. To do this calcualation, the MAX value
should be recorded, and check the box in the left of the relevant profile.
Note: Choose and only choose one profile to calculate WECPNL, the software will not
recognize whether or not the MAX Profile is chosen.
Click <Airport Noise> to enter the calculation window. As shown below.
After the Threshold (dB) is set, Click <Find Fight Event> to find all the time and level
exceed the value defined. In general, it is the first step to find the fight event. Then according
to the fight information to delete the unreasonable data by using <Delete the Wrong Event>.

Post-process software of Sound Level Meter PCE Instruments
16
After the time interval of the day, evening, and night are affirmed, Click <Calculation> to
obtain the fighting number and the average EPNL of the 3 time intervals, then the WECPNL
5.4.4 Calculate Ld & Ln
If the raw data is the monitoring result of a whole day, and the LEQ (RMS) MAX value are
recorded, Click <Ldn> to calculate the value of Ld, Ln and Ldn.
Note 1: if one of the time interval has no data, the result of that time interval will shown “NaN”,
so the Ldn.
Note 2: The software will give the value of Ld or Ln as long as there is a period of data. In fact,
the result is valid only when data acquisition rate satisfy the requirement of Standard.

SLM PCE Software PCE Instruments
17
5.5 Read the OCT file
Double click the .OCT file in the list to open the OCT format file.
OCT files record the time history data of 1/1 Octave or 1/3 Octave on the OCTAVE mode.
After the OCT file is read, the time curves of total SPL of A-weighting, B-weighting,
C-weighting, Z-weighting and chosen frequency will be shown in the upper-middle graph, and
the cursors will be fixed on both sides of the curve at first. The lower-middle graph gives the
spectrum at the position of blue cursor and the values of the spectrum are shown in the
lower-right table. Move the blue cursor to get the spectrum of the other time. Make sure that
the blue cursor is earlier then the red cursor if you want to deal with the data between the two
cursors.
The display of curves in the upper-midde graph can be controlled by the checking the □ in
the right side. The first four are the overall sound level of different filter, and the fifth is the

Post-process software of Sound Level Meter PCE Instruments
18
filter of the spectrum data.
If you want to check the details of a period of time, move the cursor to the both sides of the
curve, be sure that the blue cursor is earlier then the red cursor, and then click <Enlarge> to
magnify the curve. And click <Return>, the curve will return to the initial situation.
<AutoScale> is to change the range of Y axis to make the curve shown in the middle.
5.5.1 Overall average
<Aver. All> is to average the all data between the two cursors. Click this key to enter the
average window. As the figure below, the left is the graph show of the average result, and the
right is the result table of average. Both of them can be exported to the files.
The average mode of the overall sound level and the spectrum can be set respectively. The
graph and the table will be rewritten automatically according to the average mode.The

SLM PCE Software PCE Instruments
19
options of the average mode include: Exp. Mean, Lin. Mean, Maximum, and Minimum.
If the spectrum is the indoor structure borne noise, click <Emission Judge> to judge the noise
situation in the room.
As shown above, the average spectrum of 31.5Hz to 500Hz will be input to the upper-left
table, Click <Judge> after the Functional area is affirmed, Software will evaluate the structure
borne noise inside according to GB12348-2008.
Note1: For 1/1 Octave, the 5 values of 31.5Hz to 500Hz will be obtained from spectrum
directly. For 1/3 Octave, the 5 values will be obtained by energetical sum the adjacent 3
frequency band
Note 2: Might as well click <Load> to read the saved file of average spectrum.

Post-process software of Sound Level Meter PCE Instruments
20
5.5.2 Average as time slice
<Average> is to average the data between the two cursors according to the setting of Time
Slice. Click this key to enter the average window. As shown blew, the average spectrum is
shown in the left graph, the average value are shown in the middle table, the display mode
and the setting of average mode are in the right side.
As described in 5.4.2, the average time slice is defined by Interval(s), which can be input
directly, or chosen by the Int. Point. The use of time slice has two ways: On the point of
Time or not. The average mode of the overall sound level and the spectrum can be set
respectively. The options of the average mode could be: Exp. Mean, Lin. Mean, Maximum,
and Minimum.
SLM PCE Software PCE Instruments
21
The display of curves in the upper-left graph can be controlled by the checking the □ in the
right side. The first four are the overall sound level of difference filter, and the fifth is the curve
of one appointed frequency, “Z” means the filter of the spectrum.
Click <Save> after <Average>, the average result will be saved to the specified file.
6. Others
The logo of PCE INSTRUMENTS, Click it to view the information of PCE
INSTRUMENTS
User Manual, PDF format, Click to open
License information of SLM

PCE Instruments PCE Americas Inc. 711 Commerce Way Suite 8 Jupiter FL-33458 USA From outside US: +1 Tel: (561) 320-9162 Fax: (561) 320-9176 [email protected]
PCE Instruments UK Ltd. Units 12/13
Southpoint Business Park Ensign way
Hampshire / Southampton United Kingdom, SO31 4RF
From outside UK: +44 Tel: (0) 2380 98703 0
Fax: (0) 2380 98703 9 [email protected]
www.pce-instruments.com/english www.pce-instruments.com