Embed Size (px)
Citation preview
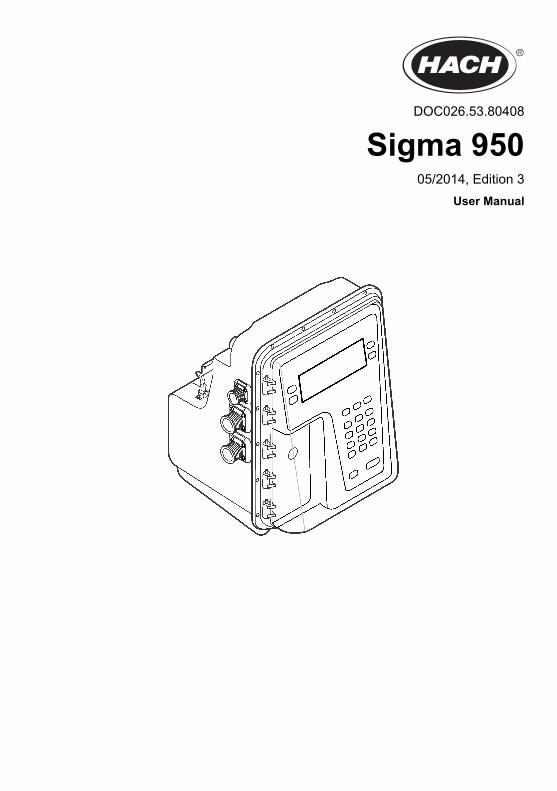
DOC026.53.80408
Sigma 95005/2014, Edition 3
User Manual

Table of ContentsSpecifications ..............................................................................................................5
Factory installed options..............................................................................................6
General information ................................................................................................10Safety information......................................................................................................11
Use of hazard information..................................................................................11Precautionary labels ...........................................................................................11Confined space precautions...............................................................................12Certification.........................................................................................................12FCC requirements ..............................................................................................13
Product overview.......................................................................................................14
Installation ...................................................................................................................14Installation requirements for CE marked instruments ................................................14Installation guidelines................................................................................................15Install a power supply (optional) ................................................................................15Mechanical installation...............................................................................................16
Wall mounting (optional) .....................................................................................16Suspension harness mounting (optional) ...........................................................17Manhole rung hanger mounting (optional) ..........................................................17
Electrical installation..................................................................................................17Connector ports ..................................................................................................17Connect to power ...............................................................................................18Connect to a sampler (optional) .........................................................................18Connect to sensors .............................................................................................18
Connect a submerged area/velocity bare-lead sensor cable to ajunction box.................................................................................................19Connect an ultrasonic bare-lead sensor cable to a junction box.................21
Connect to a bubbler area/velocity sensor (optional) .........................................21Optional device wiring........................................................................................21
Connect a rain gauge (optional) ..................................................................21Connect a pH probe (optional) ....................................................................22Connect an ORP probe (optional) ...............................................................22
Make communications connections (optional) ....................................................22Plumbing....................................................................................................................24
Install the bubbler line tubing..............................................................................24
User interface .............................................................................................................24
Operation .....................................................................................................................26Basic configuration....................................................................................................26
Set the date, time and language.........................................................................26Enable the screen saver (optional) .....................................................................26Select the level sensor .......................................................................................26Configure the program settings..........................................................................26Configure data logging.......................................................................................29
Advanced configuration.............................................................................................30Communications.................................................................................................30
Configure RS232 communications..............................................................30
1
Configure the modem..................................................................................30Configure the 4–20 mA outputs ...................................................................31Configure the alarm relays..........................................................................31
Configure the flow totalizer .................................................................................31Configure set point sampling (optional) ..............................................................32Configure the stormwater program (optional) .....................................................33
Calibration..................................................................................................................33Calibrate the ultrasonic depth sensor (standard or in-pipe) ................................33Calibrate the submerged area/velocity sensor ...................................................35Calibrate the low profile velocity-only sensor .....................................................35Calibrate the submerged depth-only sensor .......................................................35Calibrate the bubbler ..........................................................................................37Calibrate the pH probe.......................................................................................37Calibrate the ORP probe....................................................................................38Calibrate the 4-20 mA output ..............................................................................38
Start or stop a program..............................................................................................39Show the data log......................................................................................................40
Maintenance ...............................................................................................................40Clean the instrument ..................................................................................................40Replace the bubbler desiccant ..................................................................................41Remove the moisture from the desiccant (optional) ..................................................41
Troubleshooting .......................................................................................................41General ......................................................................................................................41Bubble depth sensor ..................................................................................................42Submerged area/velocity sensor ...............................................................................43Submerged depth-only sensor ...................................................................................44Ultrasonic sensor .......................................................................................................44Low profile velocity-only sensor .................................................................................45pH probe....................................................................................................................45Alarm codes...............................................................................................................47Do a diagnostic test ...................................................................................................49
Appendix ......................................................................................................................50Primary device and head measurement locations.....................................................50Manning roughness coefficients ................................................................................52Batteries .....................................................................................................................54SCADA-Modbus® system guidelines.........................................................................55
Introduction to SCADA-Modbus communications..............................................55ASCII transmission mode...................................................................................55Address field .......................................................................................................56Function field ......................................................................................................56Data field ............................................................................................................56LRC field .............................................................................................................56Communication parameters ...............................................................................56User memory customization...............................................................................56Modbus ASCII function codes supported...........................................................57
Query...........................................................................................................59Response....................................................................................................59
Table of Contents
2

Instrument response time............................................................................60Complications with floating point values.............................................................60Port expanders and protocol converters .............................................................61Other reference material .....................................................................................61SCADA-Modbus troubleshooting........................................................................62
Replacement parts and accessories ...............................................................63
Table of Contents
3

Table of Contents
4
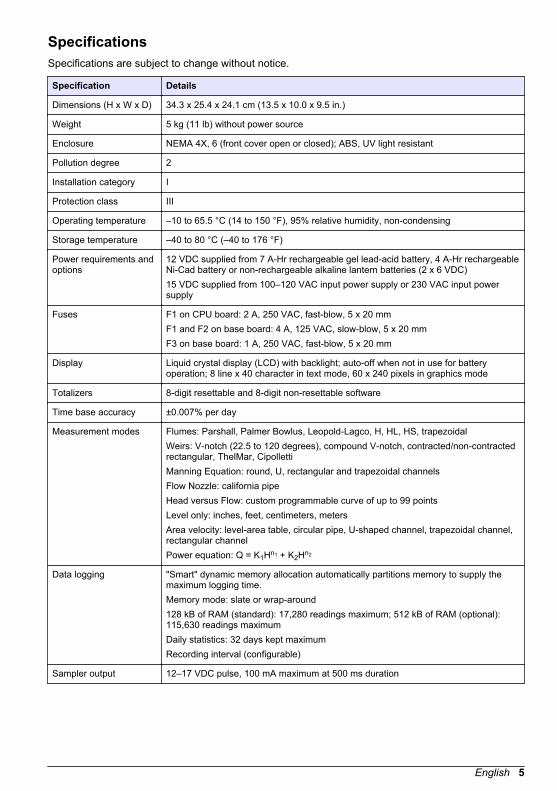
SpecificationsSpecifications are subject to change without notice.
Specification Details
Dimensions (H x W x D) 34.3 x 25.4 x 24.1 cm (13.5 x 10.0 x 9.5 in.)
Weight 5 kg (11 lb) without power source
Enclosure NEMA 4X, 6 (front cover open or closed); ABS, UV light resistant
Pollution degree 2
Installation category I
Protection class III
Operating temperature –10 to 65.5 °C (14 to 150 °F), 95% relative humidity, non-condensing
Storage temperature –40 to 80 °C (–40 to 176 °F)
Power requirements andoptions
12 VDC supplied from 7 A-Hr rechargeable gel lead-acid battery, 4 A-Hr rechargeableNi-Cad battery or non-rechargeable alkaline lantern batteries (2 x 6 VDC)15 VDC supplied from 100–120 VAC input power supply or 230 VAC input powersupply
Fuses F1 on CPU board: 2 A, 250 VAC, fast-blow, 5 x 20 mmF1 and F2 on base board: 4 A, 125 VAC, slow-blow, 5 x 20 mmF3 on base board: 1 A, 250 VAC, fast-blow, 5 x 20 mm
Display Liquid crystal display (LCD) with backlight; auto-off when not in use for batteryoperation; 8 line x 40 character in text mode, 60 x 240 pixels in graphics mode
Totalizers 8-digit resettable and 8-digit non-resettable software
Time base accuracy ±0.007% per day
Measurement modes Flumes: Parshall, Palmer Bowlus, Leopold-Lagco, H, HL, HS, trapezoidalWeirs: V-notch (22.5 to 120 degrees), compound V-notch, contracted/non-contractedrectangular, ThelMar, CipollettiManning Equation: round, U, rectangular and trapezoidal channelsFlow Nozzle: california pipeHead versus Flow: custom programmable curve of up to 99 pointsLevel only: inches, feet, centimeters, metersArea velocity: level-area table, circular pipe, U-shaped channel, trapezoidal channel,rectangular channelPower equation: Q = K1Hn1 + K2Hn2
Data logging "Smart" dynamic memory allocation automatically partitions memory to supply themaximum logging time.Memory mode: slate or wrap-around128 kB of RAM (standard): 17,280 readings maximum; 512 kB of RAM (optional):115,630 readings maximumDaily statistics: 32 days kept maximumRecording interval (configurable)
Sampler output 12–17 VDC pulse, 100 mA maximum at 500 ms duration
English 5
Specification Details
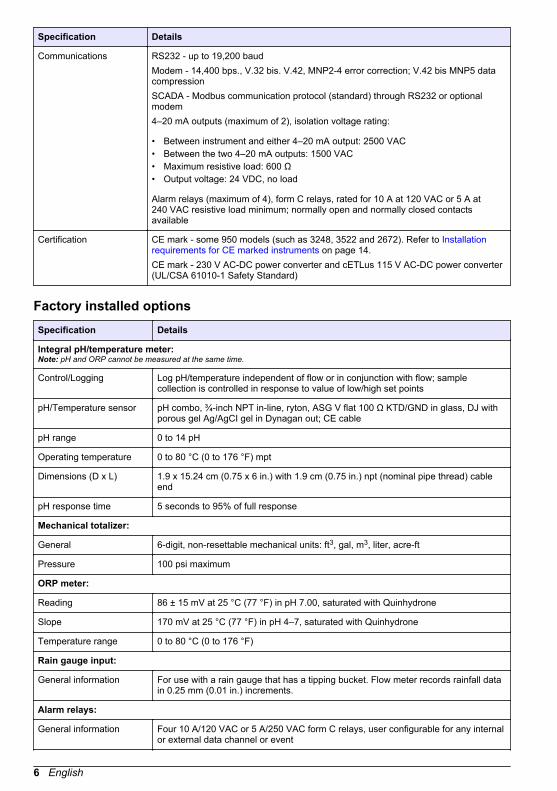
Communications RS232 - up to 19,200 baudModem - 14,400 bps., V.32 bis. V.42, MNP2-4 error correction; V.42 bis MNP5 datacompressionSCADA - Modbus communication protocol (standard) through RS232 or optionalmodem4–20 mA outputs (maximum of 2), isolation voltage rating:
• Between instrument and either 4–20 mA output: 2500 VAC• Between the two 4–20 mA outputs: 1500 VAC• Maximum resistive load: 600 Ω• Output voltage: 24 VDC, no load
Alarm relays (maximum of 4), form C relays, rated for 10 A at 120 VAC or 5 A at240 VAC resistive load minimum; normally open and normally closed contactsavailable
Certification CE mark - some 950 models (such as 3248, 3522 and 2672). Refer to Installationrequirements for CE marked instruments on page 14.CE mark - 230 V AC-DC power converter and cETLus 115 V AC-DC power converter(UL/CSA 61010-1 Safety Standard)
Factory installed optionsSpecification Details
Integral pH/temperature meter:Note: pH and ORP cannot be measured at the same time.
Control/Logging Log pH/temperature independent of flow or in conjunction with flow; samplecollection is controlled in response to value of low/high set points
pH/Temperature sensor pH combo, ¾-inch NPT in-line, ryton, ASG V flat 100 Ω KTD/GND in glass, DJ withporous gel Ag/AgCI gel in Dynagan out; CE cable
pH range 0 to 14 pH
Operating temperature 0 to 80 °C (0 to 176 °F) mpt
Dimensions (D x L) 1.9 x 15.24 cm (0.75 x 6 in.) with 1.9 cm (0.75 in.) npt (nominal pipe thread) cableend
pH response time 5 seconds to 95% of full response
Mechanical totalizer:
General 6-digit, non-resettable mechanical units: ft3, gal, m3, liter, acre-ft
Pressure 100 psi maximum
ORP meter:
Reading 86 ± 15 mV at 25 °C (77 °F) in pH 7.00, saturated with Quinhydrone
Slope 170 mV at 25 °C (77 °F) in pH 4–7, saturated with Quinhydrone
Temperature range 0 to 80 °C (0 to 176 °F)
Rain gauge input:
General information For use with a rain gauge that has a tipping bucket. Flow meter records rainfall datain 0.25 mm (0.01 in.) increments.
Alarm relays:
General information Four 10 A/120 VAC or 5 A/250 VAC form C relays, user configurable for any internalor external data channel or event
6 English
Specification Details
4–20 mA output:
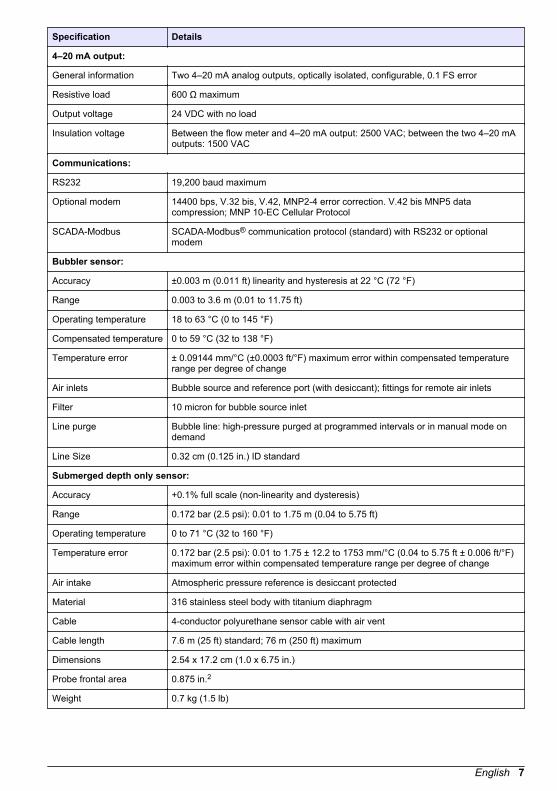
General information Two 4–20 mA analog outputs, optically isolated, configurable, 0.1 FS error
Resistive load 600 Ω maximum
Output voltage 24 VDC with no load
Insulation voltage Between the flow meter and 4–20 mA output: 2500 VAC; between the two 4–20 mAoutputs: 1500 VAC
Communications:
RS232 19,200 baud maximum
Optional modem 14400 bps, V.32 bis, V.42, MNP2-4 error correction. V.42 bis MNP5 datacompression; MNP 10-EC Cellular Protocol
SCADA-Modbus SCADA-Modbus® communication protocol (standard) with RS232 or optionalmodem
Bubbler sensor:
Accuracy ±0.003 m (0.011 ft) linearity and hysteresis at 22 °C (72 °F)
Range 0.003 to 3.6 m (0.01 to 11.75 ft)
Operating temperature 18 to 63 °C (0 to 145 °F)
Compensated temperature 0 to 59 °C (32 to 138 °F)
Temperature error ± 0.09144 mm/°C (±0.0003 ft/°F) maximum error within compensated temperaturerange per degree of change
Air inlets Bubble source and reference port (with desiccant); fittings for remote air inlets
Filter 10 micron for bubble source inlet
Line purge Bubble line: high-pressure purged at programmed intervals or in manual mode ondemand
Line Size 0.32 cm (0.125 in.) ID standard
Submerged depth only sensor:
Accuracy +0.1% full scale (non-linearity and dysteresis)
Range 0.172 bar (2.5 psi): 0.01 to 1.75 m (0.04 to 5.75 ft)
Operating temperature 0 to 71 °C (32 to 160 °F)
Temperature error 0.172 bar (2.5 psi): 0.01 to 1.75 ± 12.2 to 1753 mm/°C (0.04 to 5.75 ft ± 0.006 ft/°F)maximum error within compensated temperature range per degree of change
Air intake Atmospheric pressure reference is desiccant protected
Material 316 stainless steel body with titanium diaphragm
Cable 4-conductor polyurethane sensor cable with air vent
Cable length 7.6 m (25 ft) standard; 76 m (250 ft) maximum
Dimensions 2.54 x 17.2 cm (1.0 x 6.75 in.)
Probe frontal area 0.875 in.2
Weight 0.7 kg (1.5 lb)
English 7
Specification Details
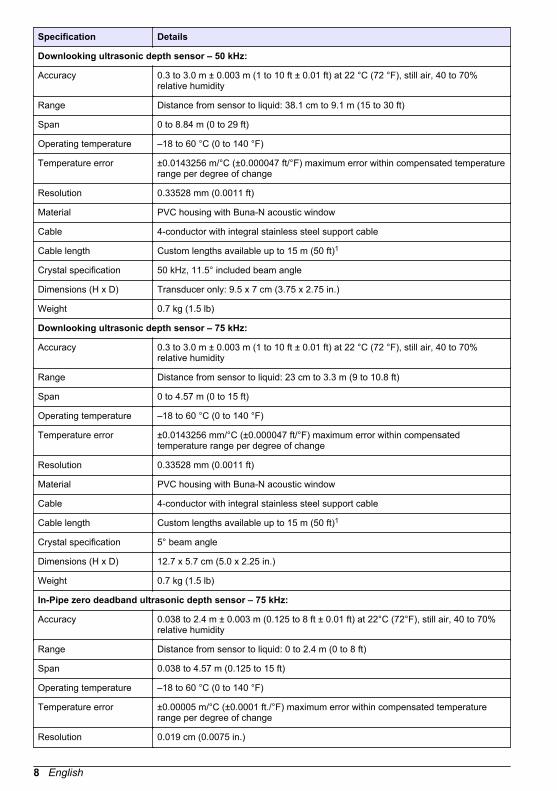
Downlooking ultrasonic depth sensor – 50 kHz:
Accuracy 0.3 to 3.0 m ± 0.003 m (1 to 10 ft ± 0.01 ft) at 22 °C (72 °F), still air, 40 to 70%relative humidity
Range Distance from sensor to liquid: 38.1 cm to 9.1 m (15 to 30 ft)
Span 0 to 8.84 m (0 to 29 ft)
Operating temperature –18 to 60 °C (0 to 140 °F)
Temperature error ±0.0143256 m/°C (±0.000047 ft/°F) maximum error within compensated temperaturerange per degree of change
Resolution 0.33528 mm (0.0011 ft)
Material PVC housing with Buna-N acoustic window
Cable 4-conductor with integral stainless steel support cable
Cable length Custom lengths available up to 15 m (50 ft)1
Crystal specification 50 kHz, 11.5° included beam angle
Dimensions (H x D) Transducer only: 9.5 x 7 cm (3.75 x 2.75 in.)
Weight 0.7 kg (1.5 lb)
Downlooking ultrasonic depth sensor – 75 kHz:
Accuracy 0.3 to 3.0 m ± 0.003 m (1 to 10 ft ± 0.01 ft) at 22 °C (72 °F), still air, 40 to 70%relative humidity
Range Distance from sensor to liquid: 23 cm to 3.3 m (9 to 10.8 ft)
Span 0 to 4.57 m (0 to 15 ft)
Operating temperature –18 to 60 °C (0 to 140 °F)
Temperature error ±0.0143256 mm/°C (±0.000047 ft/°F) maximum error within compensatedtemperature range per degree of change
Resolution 0.33528 mm (0.0011 ft)
Material PVC housing with Buna-N acoustic window
Cable 4-conductor with integral stainless steel support cable
Cable length Custom lengths available up to 15 m (50 ft)1
Crystal specification 5° beam angle
Dimensions (H x D) 12.7 x 5.7 cm (5.0 x 2.25 in.)
Weight 0.7 kg (1.5 lb)
In-Pipe zero deadband ultrasonic depth sensor – 75 kHz:
Accuracy 0.038 to 2.4 m ± 0.003 m (0.125 to 8 ft ± 0.01 ft) at 22°C (72°F), still air, 40 to 70%relative humidity
Range Distance from sensor to liquid: 0 to 2.4 m (0 to 8 ft)
Span 0.038 to 4.57 m (0.125 to 15 ft)
Operating temperature –18 to 60 °C (0 to 140 °F)
Temperature error ±0.00005 m/°C (±0.0001 ft./°F) maximum error within compensated temperaturerange per degree of change
Resolution 0.019 cm (0.0075 in.)
8 English
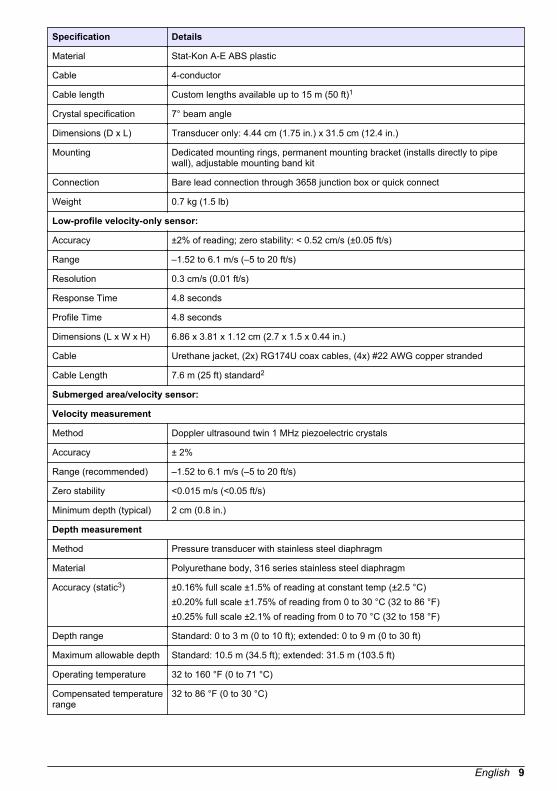
Specification Details
Material Stat-Kon A-E ABS plastic
Cable 4-conductor
Cable length Custom lengths available up to 15 m (50 ft)1
Crystal specification 7° beam angle
Dimensions (D x L) Transducer only: 4.44 cm (1.75 in.) x 31.5 cm (12.4 in.)
Mounting Dedicated mounting rings, permanent mounting bracket (installs directly to pipewall), adjustable mounting band kit
Connection Bare lead connection through 3658 junction box or quick connect
Weight 0.7 kg (1.5 lb)
Low-profile velocity-only sensor:
Accuracy ±2% of reading; zero stability: < 0.52 cm/s (±0.05 ft/s)
Range –1.52 to 6.1 m/s (–5 to 20 ft/s)
Resolution 0.3 cm/s (0.01 ft/s)
Response Time 4.8 seconds
Profile Time 4.8 seconds
Dimensions (L x W x H) 6.86 x 3.81 x 1.12 cm (2.7 x 1.5 x 0.44 in.)
Cable Urethane jacket, (2x) RG174U coax cables, (4x) #22 AWG copper stranded
Cable Length 7.6 m (25 ft) standard2
Submerged area/velocity sensor:
Velocity measurement
Method Doppler ultrasound twin 1 MHz piezoelectric crystals
Accuracy ± 2%
Range (recommended) –1.52 to 6.1 m/s (–5 to 20 ft/s)
Zero stability <0.015 m/s (<0.05 ft/s)
Minimum depth (typical) 2 cm (0.8 in.)
Depth measurement
Method Pressure transducer with stainless steel diaphragm
Material Polyurethane body, 316 series stainless steel diaphragm
Accuracy (static3) ±0.16% full scale ±1.5% of reading at constant temp (±2.5 °C)±0.20% full scale ±1.75% of reading from 0 to 30 °C (32 to 86 °F)±0.25% full scale ±2.1% of reading from 0 to 70 °C (32 to 158 °F)
Depth range Standard: 0 to 3 m (0 to 10 ft); extended: 0 to 9 m (0 to 30 ft)
Maximum allowable depth Standard: 10.5 m (34.5 ft); extended: 31.5 m (103.5 ft)
Operating temperature 32 to 160 °F (0 to 71 °C)
Compensated temperaturerange
32 to 86 °F (0 to 30 °C)
English 9
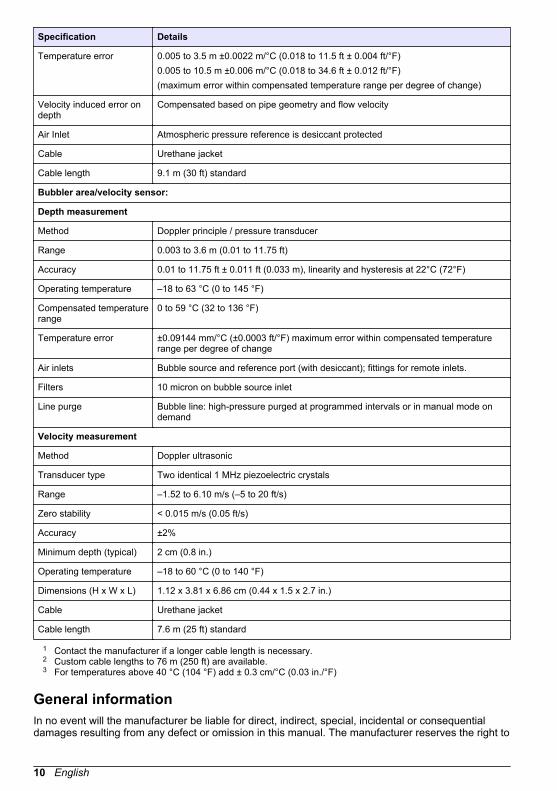
Specification Details
Temperature error 0.005 to 3.5 m ±0.0022 m/°C (0.018 to 11.5 ft ± 0.004 ft/°F)0.005 to 10.5 m ±0.006 m/°C (0.018 to 34.6 ft ± 0.012 ft/°F)(maximum error within compensated temperature range per degree of change)
Velocity induced error ondepth
Compensated based on pipe geometry and flow velocity
Air Inlet Atmospheric pressure reference is desiccant protected
Cable Urethane jacket
Cable length 9.1 m (30 ft) standard
Bubbler area/velocity sensor:
Depth measurement
Method Doppler principle / pressure transducer
Range 0.003 to 3.6 m (0.01 to 11.75 ft)
Accuracy 0.01 to 11.75 ft ± 0.011 ft (0.033 m), linearity and hysteresis at 22°C (72°F)
Operating temperature –18 to 63 °C (0 to 145 °F)
Compensated temperaturerange
0 to 59 °C (32 to 136 °F)
Temperature error ±0.09144 mm/°C (±0.0003 ft/°F) maximum error within compensated temperaturerange per degree of change
Air inlets Bubble source and reference port (with desiccant); fittings for remote inlets.
Filters 10 micron on bubble source inlet
Line purge Bubble line: high-pressure purged at programmed intervals or in manual mode ondemand
Velocity measurement
Method Doppler ultrasonic
Transducer type Two identical 1 MHz piezoelectric crystals
Range –1.52 to 6.10 m/s (–5 to 20 ft/s)
Zero stability < 0.015 m/s (0.05 ft/s)
Accuracy ±2%
Minimum depth (typical) 2 cm (0.8 in.)
Operating temperature –18 to 60 °C (0 to 140 °F)
Dimensions (H x W x L) 1.12 x 3.81 x 6.86 cm (0.44 x 1.5 x 2.7 in.)
Cable Urethane jacket
Cable length 7.6 m (25 ft) standard
1 Contact the manufacturer if a longer cable length is necessary.2 Custom cable lengths to 76 m (250 ft) are available.3 For temperatures above 40 °C (104 °F) add ± 0.3 cm/°C (0.03 in./°F)
General informationIn no event will the manufacturer be liable for direct, indirect, special, incidental or consequentialdamages resulting from any defect or omission in this manual. The manufacturer reserves the right to
10 English
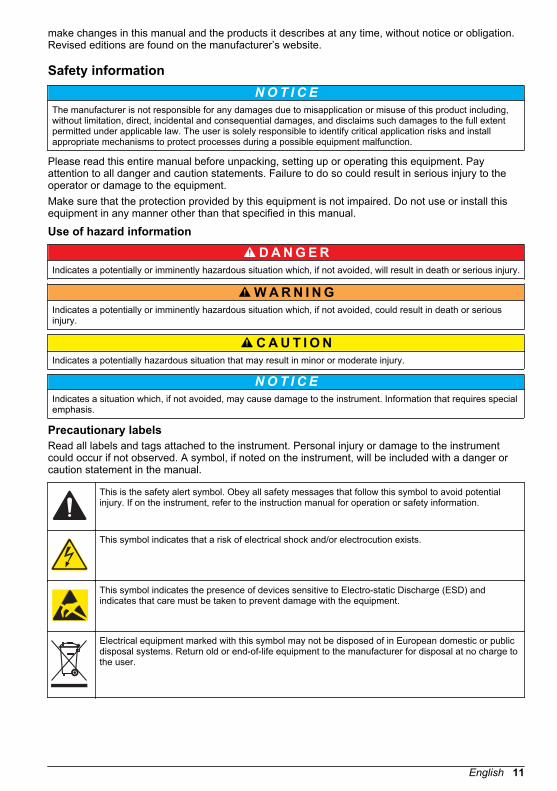
make changes in this manual and the products it describes at any time, without notice or obligation.Revised editions are found on the manufacturer’s website.
Safety informationN O T I C E
The manufacturer is not responsible for any damages due to misapplication or misuse of this product including,without limitation, direct, incidental and consequential damages, and disclaims such damages to the full extentpermitted under applicable law. The user is solely responsible to identify critical application risks and installappropriate mechanisms to protect processes during a possible equipment malfunction.
Please read this entire manual before unpacking, setting up or operating this equipment. Payattention to all danger and caution statements. Failure to do so could result in serious injury to theoperator or damage to the equipment.Make sure that the protection provided by this equipment is not impaired. Do not use or install thisequipment in any manner other than that specified in this manual.
Use of hazard information
D A N G E R Indicates a potentially or imminently hazardous situation which, if not avoided, will result in death or serious injury.
W A R N I N G Indicates a potentially or imminently hazardous situation which, if not avoided, could result in death or seriousinjury.
C A U T I O N Indicates a potentially hazardous situation that may result in minor or moderate injury.
N O T I C E Indicates a situation which, if not avoided, may cause damage to the instrument. Information that requires specialemphasis.
Precautionary labelsRead all labels and tags attached to the instrument. Personal injury or damage to the instrumentcould occur if not observed. A symbol, if noted on the instrument, will be included with a danger orcaution statement in the manual.
This is the safety alert symbol. Obey all safety messages that follow this symbol to avoid potentialinjury. If on the instrument, refer to the instruction manual for operation or safety information.
This symbol indicates that a risk of electrical shock and/or electrocution exists.
This symbol indicates the presence of devices sensitive to Electro-static Discharge (ESD) andindicates that care must be taken to prevent damage with the equipment.
Electrical equipment marked with this symbol may not be disposed of in European domestic or publicdisposal systems. Return old or end-of-life equipment to the manufacturer for disposal at no charge tothe user.
English 11

This symbol, when noted on the product, identifies the location of a fuse or current limiting device.
This symbol indicates that the marked item requires a protective earth connection. If the instrument isnot supplied with a ground plug on a cord, make the protective earth connection to the protectiveconductor terminal.
Confined space precautions
D A N G E R Explosion hazard. Training in pre-entry testing, ventilation, entry procedures, evacuation/rescueprocedures and safety work practices is necessary before entering confined spaces.
The information that follows is supplied to help users understand the dangers and risks that areassociated with entry into confined spaces.On April 15, 1993, OSHA's final ruling on CFR 1910.146, Permit Required Confined Spaces, becamelaw. This standard directly affects more than 250,000 industrial sites in the United States and wascreated to protect the health and safety of workers in confined spaces.Definition of a confined space:A confined space is any location or enclosure that has (or has the immediate potential for) one ormore of the following conditions:
• An atmosphere with an oxygen concentration that is less than 19.5% or more than 23.5% and/or ahydrogen sulfide (H2S) concentration that is more than 10 ppm.
• An atmosphere that can be flammable or explosive due to gases, vapors, mists, dusts or fibers.• Toxic materials which upon contact or inhalation can cause injury, impairment of health or death.
Confined spaces are not designed for human occupancy. Confined spaces have a restricted entryand contain known or potential hazards. Examples of confined spaces include manholes, stacks,pipes, vats, switch vaults and other similar locations.Standard safety procedures must always be obeyed before entry into confined spaces and/orlocations where hazardous gases, vapors, mists, dusts or fibers can be present. Before entry into aconfined space, find and read all procedures that are related to confined space entry.
CertificationCanadian Radio Interference-Causing Equipment Regulation, IECS-003, Class A:Supporting test records reside with the manufacturer.This Class A digital apparatus meets all requirements of the Canadian Interference-CausingEquipment Regulations.Cet appareil numérique de classe A répond à toutes les exigences de la réglementation canadiennesur les équipements provoquant des interférences.FCC Part 15, Class "A" LimitsSupporting test records reside with the manufacturer. The device complies with Part 15 of the FCCRules. Operation is subject to the following conditions:
1. The equipment may not cause harmful interference.2. The equipment must accept any interference received, including interference that may cause
undesired operation.
Changes or modifications to this equipment not expressly approved by the party responsible forcompliance could void the user's authority to operate the equipment. This equipment has been testedand found to comply with the limits for a Class A digital device, pursuant to Part 15 of the FCC rules.These limits are designed to provide reasonable protection against harmful interference when theequipment is operated in a commercial environment. This equipment generates, uses and canradiate radio frequency energy and, if not installed and used in accordance with the instructionmanual, may cause harmful interference to radio communications. Operation of this equipment in a
12 English
residential area is likely to cause harmful interference, in which case the user will be required tocorrect the interference at their expense. The following techniques can be used to reduceinterference problems:
1. Disconnect the equipment from its power source to verify that it is or is not the source of theinterference.
2. If the equipment is connected to the same outlet as the device experiencing interference, connectthe equipment to a different outlet.
3. Move the equipment away from the device receiving the interference.4. Reposition the receiving antenna for the device receiving the interference.5. Try combinations of the above.
FCC requirements
W A R N I N G Multiple hazards. Only qualified personnel must conduct the tasks described in this section of thedocument.
The Federal Communications Commission (FCC) has made rules which let this device be directlyconnected to the telephone network. Standardized jacks are used for these connections. Thisequipment should not be used on party lines or coin lines.If this device is not operating correctly, it can cause damage to the telephone network. Disconnectthis device until the source of the problem is identified and the repair is completed. If this is not done,the telephone company may temporarily disconnect service.The telephone company can make changes in its technical operations and procedure. If suchchanges affect the compatibility or use of this device, the telephone company must give sufficientnotice of the changes.If the telephone company asks for information on the equipment that is connected to their telephonelines, supply them with:
• Telephone number to which the unit is connected• Ringer equivalence number* (1.4B)• USOC jack required (RJ11C)• FCC registration number*
The ringer equivalence number (REN) is used to identify how many devices can be connected to thetelephone line to which the unit is connected. In most areas, the sum of the RENs of all devices onany one line should not be more than five. If too many devices are attached, the devices may notreceive calls correctly.Equipment attachment limitations notice:The Canadian Industry Canada label identifies certified equipment. This certification identifies thatthe equipment is in conformance with specific telecommunications network protective, operationaland safety requirements. The Canadian Industry Canada label does not identify that the equipmentwill operate to the satisfaction of the user.Before this equipment is installed, get the permission of the local telecommunications company toconnect it to the facilities. Use an allowed method of connection. If allowed, increase the length of theinside wiring associated with a single-line individual service as necessary with a certified connectorassembly (telephone extension cord). Be aware that compliance with these conditions may notprevent service degradation in some situations.Repairs to certified equipment should be done by an authorized Canadian maintenance facilityidentified by the supplier. Repairs or equipment changes made by the user or equipmentmalfunctions can give the telecommunications company cause to ask the user to disconnect theequipment. For the protection of the user, make sure that the electrical ground connections of the
* Recorded on the device label
English 13

power utility, telephone lines and internal metallic water pipe system, if present, are connectedtogether. This precaution can be particularly important in rural areas.The load number (LN) given to each terminal device identifies the percentage of the total load thatcan be connected to a telephone loop that is used by the device. If a higher percentage of the totalload is applied, damage to the telephone loop can occur. The termination on a loop can be anycombination of devices whose total load numbers are not more than 100.
Product overviewThis instrument is a portable, waterproof flow meter that is used with an attached sensor to measureand record flow in open channels, full pipes and surcharged lines. This instrument can be used tocontrol a wastewater sampler.The instrument enclosure is waterproof and corrosive gas resistant even with the front cover open.The front cover has two lockable latches to prevent vandalism and unauthorized use of the keypad. Asoftware lock can also be enabled, which locks the keypad.Typically, this instrument is used with a level sensor to measure flow when there is a primarymeasuring device (e.g., flume, weir or pipe) that has a known level-to-flow relationship. The levelsensor measures the level of liquid in a channel that adds to the flow (referred to as the “head”).Then, the instrument calculates the flow rate based on the head-to-flow relationship of the primarydevice. In addition, this instrument can be used with a velocity sensor. The velocity sensor measuresthe average velocity of the flow stream with a Doppler sensor that is under water. Then, theinstrument calculates the flow based on the current depth and the Continuity Equation: Wetted Area× Velocity = Flow.The communication features of this instrument include a standard RS232 port and optional internalmodem. Use the RS232 port for remote data transfer, remote programming and to update internalsoftware using flash memory (RS232 only). The Modbus ASCII protocol is used for SCADAcommunication through the RS232 port.Use InSight data management software to:
• Transmit the data log from the instrument to a PC• Remotely configure the instrument• Do other data manipulation using the RS232 port or the optional internal modem
InstallationD A N G E R
Multiple hazards. Only qualified personnel must conduct the tasks described in this section of thedocument.
Installation requirements for CE marked instrumentsOnly the flow meter models, part numbers and options in Table 1 are approved for use in theEuropean Union (EU) according to the CE mark of the manufacturer.Instruments with a CE mark have use and installation requirements that are subject to the EuropeanUnion’s Notified Body use limitations that follow.
• The Sigma 950 flow meter must be operated underground in sewers, drain pipes and similarunderground locations.
• The Sigma 950 flow meter must be connected to an AC mains source that is only used forunderground service. The AC mains power service cannot be used for residential locations.
If the Sigma 950 flow meter is operated in locations where there are high levels of RF energy or largeelectrical transients, electromagnetic interference can cause performance-related problems.However, these conditions are not typical in underground in sewers, drain pipes and similarunderground locations.
14 English
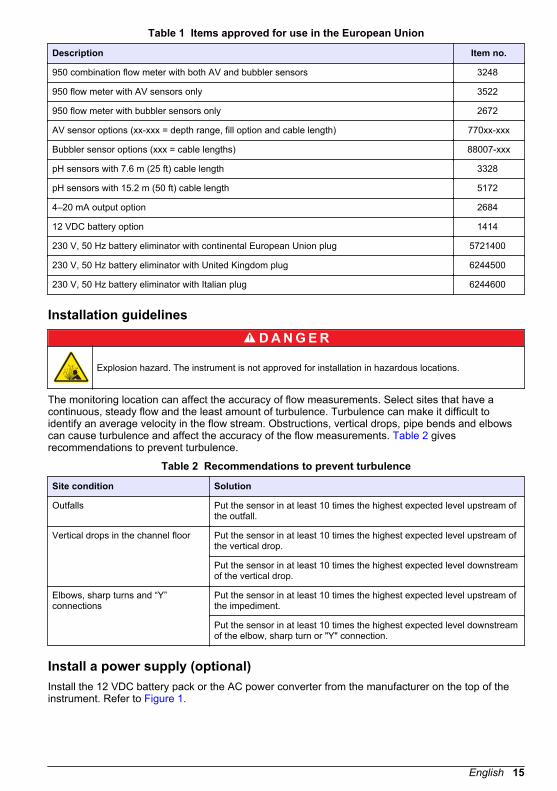
Table 1 Items approved for use in the European Union
Description Item no.
950 combination flow meter with both AV and bubbler sensors 3248
950 flow meter with AV sensors only 3522
950 flow meter with bubbler sensors only 2672
AV sensor options (xx-xxx = depth range, fill option and cable length) 770xx-xxx
Bubbler sensor options (xxx = cable lengths) 88007-xxx
pH sensors with 7.6 m (25 ft) cable length 3328
pH sensors with 15.2 m (50 ft) cable length 5172
4–20 mA output option 2684
12 VDC battery option 1414
230 V, 50 Hz battery eliminator with continental European Union plug 5721400
230 V, 50 Hz battery eliminator with United Kingdom plug 6244500
230 V, 50 Hz battery eliminator with Italian plug 6244600
Installation guidelines
D A N G E R
Explosion hazard. The instrument is not approved for installation in hazardous locations.
The monitoring location can affect the accuracy of flow measurements. Select sites that have acontinuous, steady flow and the least amount of turbulence. Turbulence can make it difficult toidentify an average velocity in the flow stream. Obstructions, vertical drops, pipe bends and elbowscan cause turbulence and affect the accuracy of the flow measurements. Table 2 givesrecommendations to prevent turbulence.
Table 2 Recommendations to prevent turbulence
Site condition Solution
Outfalls Put the sensor in at least 10 times the highest expected level upstream ofthe outfall.
Vertical drops in the channel floor Put the sensor in at least 10 times the highest expected level upstream ofthe vertical drop.
Put the sensor in at least 10 times the highest expected level downstreamof the vertical drop.
Elbows, sharp turns and “Y”connections
Put the sensor in at least 10 times the highest expected level upstream ofthe impediment.
Put the sensor in at least 10 times the highest expected level downstreamof the elbow, sharp turn or "Y" connection.
Install a power supply (optional)Install the 12 VDC battery pack or the AC power converter from the manufacturer on the top of theinstrument. Refer to Figure 1.
English 15
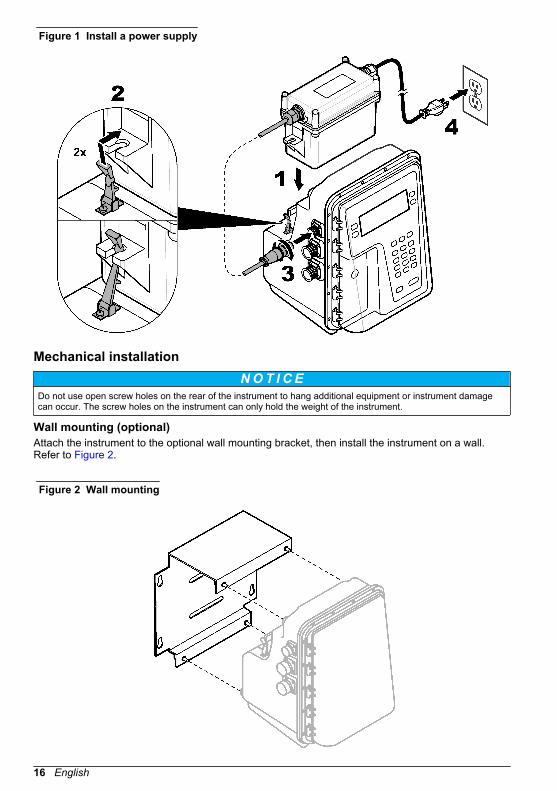
Figure 1 Install a power supply
Mechanical installationN O T I C E
Do not use open screw holes on the rear of the instrument to hang additional equipment or instrument damagecan occur. The screw holes on the instrument can only hold the weight of the instrument.
Wall mounting (optional)Attach the instrument to the optional wall mounting bracket, then install the instrument on a wall.Refer to Figure 2.
Figure 2 Wall mounting
16 English
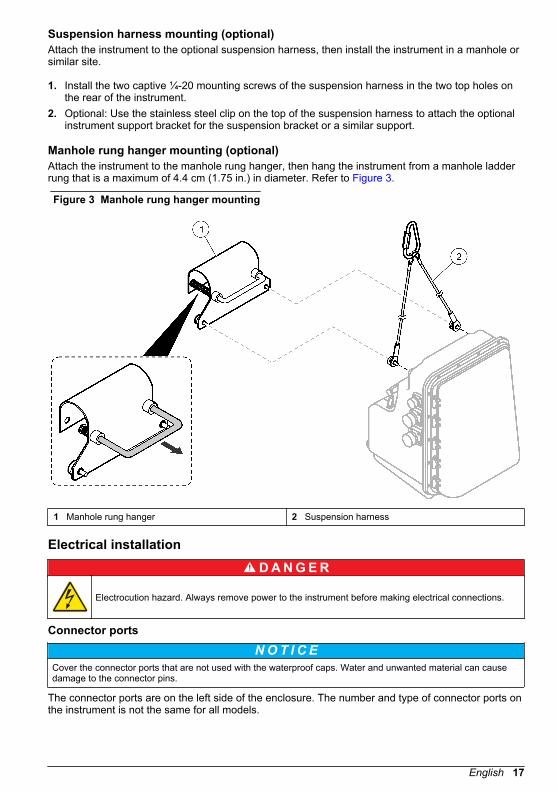
Suspension harness mounting (optional)Attach the instrument to the optional suspension harness, then install the instrument in a manhole orsimilar site.
1. Install the two captive ¼-20 mounting screws of the suspension harness in the two top holes onthe rear of the instrument.
2. Optional: Use the stainless steel clip on the top of the suspension harness to attach the optionalinstrument support bracket for the suspension bracket or a similar support.
Manhole rung hanger mounting (optional)Attach the instrument to the manhole rung hanger, then hang the instrument from a manhole ladderrung that is a maximum of 4.4 cm (1.75 in.) in diameter. Refer to Figure 3.
Figure 3 Manhole rung hanger mounting
1 Manhole rung hanger 2 Suspension harness
Electrical installation
D A N G E R
Electrocution hazard. Always remove power to the instrument before making electrical connections.
Connector ports
N O T I C E Cover the connector ports that are not used with the waterproof caps. Water and unwanted material can causedamage to the connector pins.
The connector ports are on the left side of the enclosure. The number and type of connector ports onthe instrument is not the same for all models.
English 17
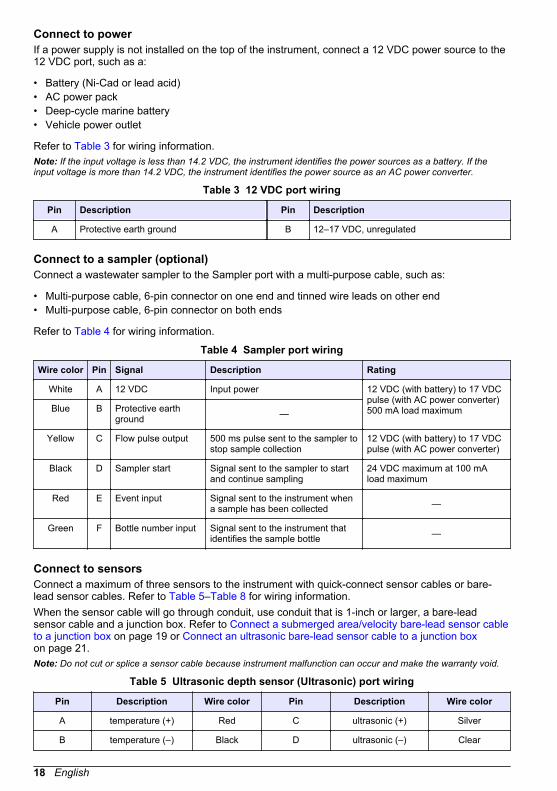
Connect to powerIf a power supply is not installed on the top of the instrument, connect a 12 VDC power source to the12 VDC port, such as a:
• Battery (Ni-Cad or lead acid)• AC power pack• Deep-cycle marine battery• Vehicle power outlet
Refer to Table 3 for wiring information.Note: If the input voltage is less than 14.2 VDC, the instrument identifies the power sources as a battery. If theinput voltage is more than 14.2 VDC, the instrument identifies the power source as an AC power converter.
Table 3 12 VDC port wiring
Pin Description Pin Description
A Protective earth ground B 12–17 VDC, unregulated
Connect to a sampler (optional)Connect a wastewater sampler to the Sampler port with a multi-purpose cable, such as:
• Multi-purpose cable, 6-pin connector on one end and tinned wire leads on other end• Multi-purpose cable, 6-pin connector on both ends
Refer to Table 4 for wiring information.
Table 4 Sampler port wiring
Wire color Pin Signal Description Rating
White A 12 VDC Input power 12 VDC (with battery) to 17 VDCpulse (with AC power converter)500 mA load maximumBlue B Protective earth
ground —
Yellow C Flow pulse output 500 ms pulse sent to the sampler tostop sample collection
12 VDC (with battery) to 17 VDCpulse (with AC power converter)
Black D Sampler start Signal sent to the sampler to startand continue sampling
24 VDC maximum at 100 mAload maximum
Red E Event input Signal sent to the instrument whena sample has been collected —
Green F Bottle number input Signal sent to the instrument thatidentifies the sample bottle —
Connect to sensorsConnect a maximum of three sensors to the instrument with quick-connect sensor cables or bare-lead sensor cables. Refer to Table 5–Table 8 for wiring information.When the sensor cable will go through conduit, use conduit that is 1-inch or larger, a bare-leadsensor cable and a junction box. Refer to Connect a submerged area/velocity bare-lead sensor cableto a junction box on page 19 or Connect an ultrasonic bare-lead sensor cable to a junction boxon page 21.Note: Do not cut or splice a sensor cable because instrument malfunction can occur and make the warranty void.
Table 5 Ultrasonic depth sensor (Ultrasonic) port wiring
Pin Description Wire color Pin Description Wire color
A temperature (+) Red C ultrasonic (+) Silver
B temperature (–) Black D ultrasonic (–) Clear
18 English
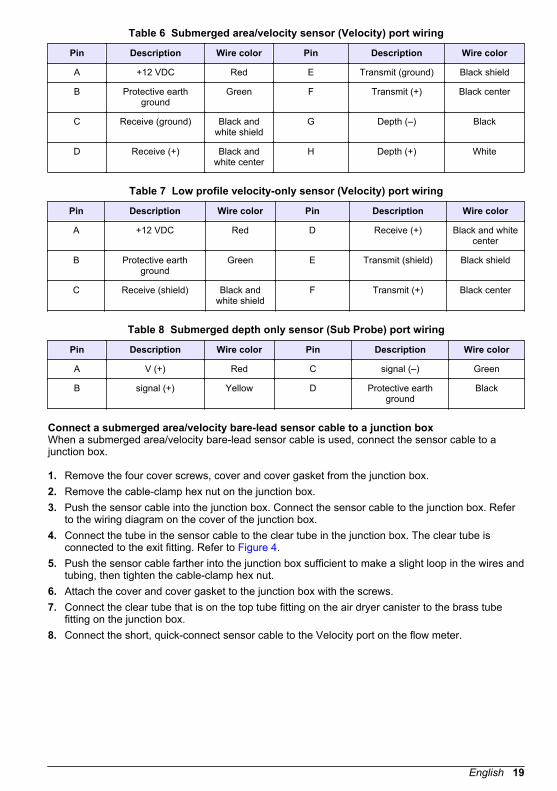
Table 6 Submerged area/velocity sensor (Velocity) port wiring
Pin Description Wire color Pin Description Wire color
A +12 VDC Red E Transmit (ground) Black shield
B Protective earthground
Green F Transmit (+) Black center
C Receive (ground) Black andwhite shield
G Depth (–) Black
D Receive (+) Black andwhite center
H Depth (+) White
Table 7 Low profile velocity-only sensor (Velocity) port wiring
Pin Description Wire color Pin Description Wire color
A +12 VDC Red D Receive (+) Black and whitecenter
B Protective earthground
Green E Transmit (shield) Black shield
C Receive (shield) Black andwhite shield
F Transmit (+) Black center
Table 8 Submerged depth only sensor (Sub Probe) port wiring
Pin Description Wire color Pin Description Wire color
A V (+) Red C signal (–) Green
B signal (+) Yellow D Protective earthground
Black
Connect a submerged area/velocity bare-lead sensor cable to a junction boxWhen a submerged area/velocity bare-lead sensor cable is used, connect the sensor cable to ajunction box.
1. Remove the four cover screws, cover and cover gasket from the junction box.2. Remove the cable-clamp hex nut on the junction box.3. Push the sensor cable into the junction box. Connect the sensor cable to the junction box. Refer
to the wiring diagram on the cover of the junction box.4. Connect the tube in the sensor cable to the clear tube in the junction box. The clear tube is
connected to the exit fitting. Refer to Figure 4.5. Push the sensor cable farther into the junction box sufficient to make a slight loop in the wires and
tubing, then tighten the cable-clamp hex nut.6. Attach the cover and cover gasket to the junction box with the screws.7. Connect the clear tube that is on the top tube fitting on the air dryer canister to the brass tube
fitting on the junction box.8. Connect the short, quick-connect sensor cable to the Velocity port on the flow meter.
English 19
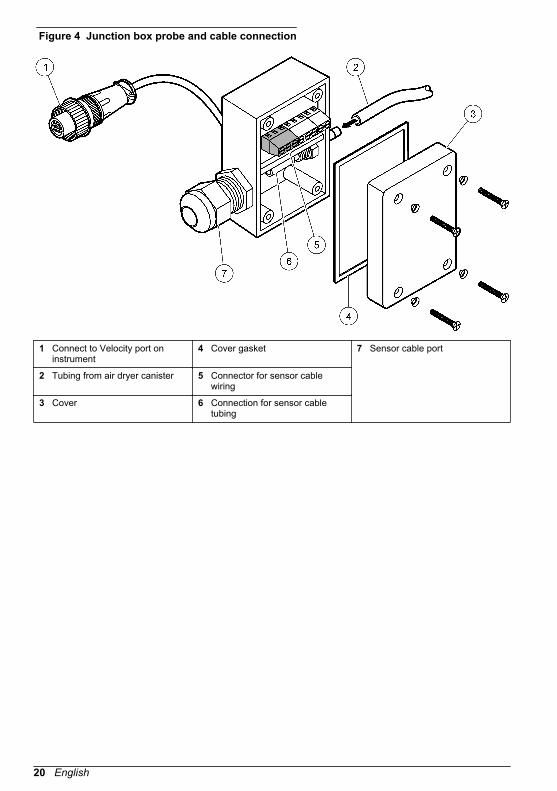
Figure 4 Junction box probe and cable connection
1 Connect to Velocity port oninstrument
4 Cover gasket 7 Sensor cable port
2 Tubing from air dryer canister 5 Connector for sensor cablewiring
3 Cover 6 Connection for sensor cabletubing
20 English
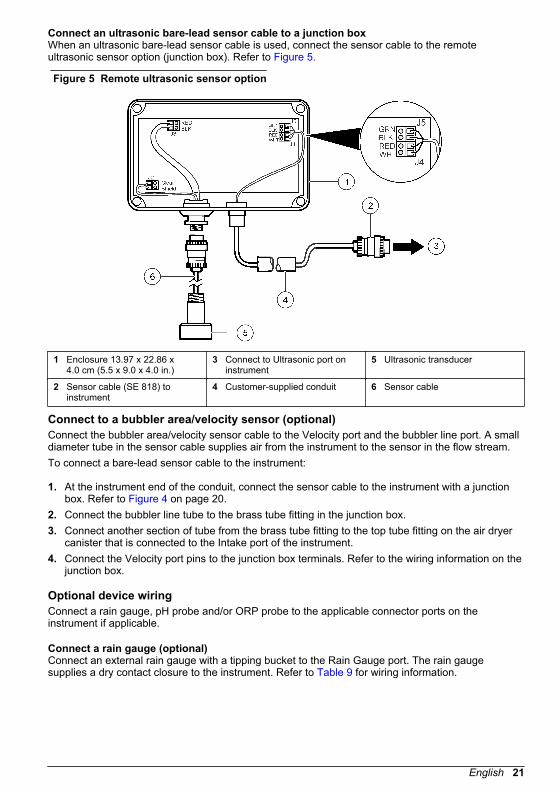
Connect an ultrasonic bare-lead sensor cable to a junction boxWhen an ultrasonic bare-lead sensor cable is used, connect the sensor cable to the remoteultrasonic sensor option (junction box). Refer to Figure 5.
Figure 5 Remote ultrasonic sensor option
1 Enclosure 13.97 x 22.86 x4.0 cm (5.5 x 9.0 x 4.0 in.)
3 Connect to Ultrasonic port oninstrument
5 Ultrasonic transducer
2 Sensor cable (SE 818) toinstrument
4 Customer-supplied conduit 6 Sensor cable
Connect to a bubbler area/velocity sensor (optional)Connect the bubbler area/velocity sensor cable to the Velocity port and the bubbler line port. A smalldiameter tube in the sensor cable supplies air from the instrument to the sensor in the flow stream.To connect a bare-lead sensor cable to the instrument:
1. At the instrument end of the conduit, connect the sensor cable to the instrument with a junctionbox. Refer to Figure 4 on page 20.
2. Connect the bubbler line tube to the brass tube fitting in the junction box.3. Connect another section of tube from the brass tube fitting to the top tube fitting on the air dryer
canister that is connected to the Intake port of the instrument.4. Connect the Velocity port pins to the junction box terminals. Refer to the wiring information on the
junction box.
Optional device wiringConnect a rain gauge, pH probe and/or ORP probe to the applicable connector ports on theinstrument if applicable.
Connect a rain gauge (optional)Connect an external rain gauge with a tipping bucket to the Rain Gauge port. The rain gaugesupplies a dry contact closure to the instrument. Refer to Table 9 for wiring information.
English 21
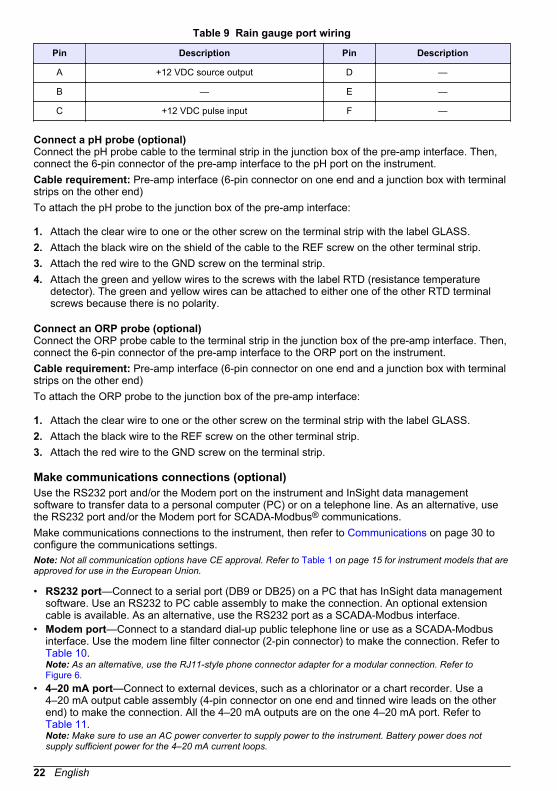
Table 9 Rain gauge port wiring
Pin Description Pin Description
A +12 VDC source output D —
B — E —
C +12 VDC pulse input F —
Connect a pH probe (optional)Connect the pH probe cable to the terminal strip in the junction box of the pre-amp interface. Then,connect the 6-pin connector of the pre-amp interface to the pH port on the instrument.Cable requirement: Pre-amp interface (6-pin connector on one end and a junction box with terminalstrips on the other end)To attach the pH probe to the junction box of the pre-amp interface:
1. Attach the clear wire to one or the other screw on the terminal strip with the label GLASS.2. Attach the black wire on the shield of the cable to the REF screw on the other terminal strip.3. Attach the red wire to the GND screw on the terminal strip.4. Attach the green and yellow wires to the screws with the label RTD (resistance temperature
detector). The green and yellow wires can be attached to either one of the other RTD terminalscrews because there is no polarity.
Connect an ORP probe (optional)Connect the ORP probe cable to the terminal strip in the junction box of the pre-amp interface. Then,connect the 6-pin connector of the pre-amp interface to the ORP port on the instrument.Cable requirement: Pre-amp interface (6-pin connector on one end and a junction box with terminalstrips on the other end)To attach the ORP probe to the junction box of the pre-amp interface:
1. Attach the clear wire to one or the other screw on the terminal strip with the label GLASS.2. Attach the black wire to the REF screw on the other terminal strip.3. Attach the red wire to the GND screw on the terminal strip.
Make communications connections (optional)Use the RS232 port and/or the Modem port on the instrument and InSight data managementsoftware to transfer data to a personal computer (PC) or on a telephone line. As an alternative, usethe RS232 port and/or the Modem port for SCADA-Modbus® communications.Make communications connections to the instrument, then refer to Communications on page 30 toconfigure the communications settings.Note: Not all communication options have CE approval. Refer to Table 1 on page 15 for instrument models that areapproved for use in the European Union.
• RS232 port—Connect to a serial port (DB9 or DB25) on a PC that has InSight data managementsoftware. Use an RS232 to PC cable assembly to make the connection. An optional extensioncable is available. As an alternative, use the RS232 port as a SCADA-Modbus interface.
• Modem port—Connect to a standard dial-up public telephone line or use as a SCADA-Modbusinterface. Use the modem line filter connector (2-pin connector) to make the connection. Refer to Table 10.Note: As an alternative, use the RJ11-style phone connector adapter for a modular connection. Refer to Figure 6.
• 4–20 mA port—Connect to external devices, such as a chlorinator or a chart recorder. Use a4–20 mA output cable assembly (4-pin connector on one end and tinned wire leads on the otherend) to make the connection. All the 4–20 mA outputs are on the one 4–20 mA port. Refer to Table 11.Note: Make sure to use an AC power converter to supply power to the instrument. Battery power does notsupply sufficient power for the 4–20 mA current loops.
22 English
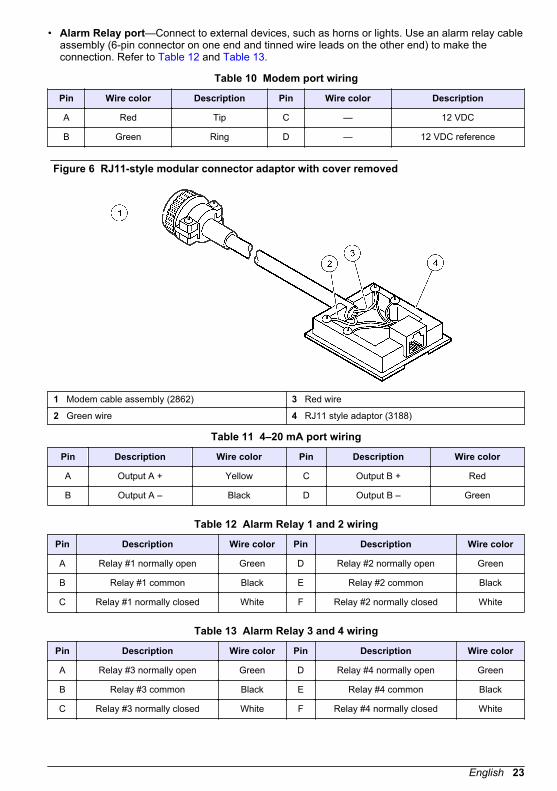
• Alarm Relay port—Connect to external devices, such as horns or lights. Use an alarm relay cableassembly (6-pin connector on one end and tinned wire leads on the other end) to make theconnection. Refer to Table 12 and Table 13.
Table 10 Modem port wiring
Pin Wire color Description Pin Wire color Description
A Red Tip C — 12 VDC
B Green Ring D — 12 VDC reference
Figure 6 RJ11-style modular connector adaptor with cover removed
1 Modem cable assembly (2862) 3 Red wire
2 Green wire 4 RJ11 style adaptor (3188)
Table 11 4–20 mA port wiring
Pin Description Wire color Pin Description Wire color
A Output A + Yellow C Output B + Red
B Output A – Black D Output B – Green
Table 12 Alarm Relay 1 and 2 wiring
Pin Description Wire color Pin Description Wire color
A Relay #1 normally open Green D Relay #2 normally open Green
B Relay #1 common Black E Relay #2 common Black
C Relay #1 normally closed White F Relay #2 normally closed White
Table 13 Alarm Relay 3 and 4 wiring
Pin Description Wire color Pin Description Wire color
A Relay #3 normally open Green D Relay #4 normally open Green
B Relay #3 common Black E Relay #4 common Black
C Relay #3 normally closed White F Relay #4 normally closed White
English 23
PlumbingInstall the bubbler line tubingNote: The bubbler line tubing and the air dryer cartridges on the right side of the instrument are only used for depthmeasurement unless the optional bubbler area/velocity sensor is connected to the Velocity port on the instrument.
1. Push 3.17 mm (1/8-in.) ID vinyl tubing over the Bubbler line port on the instrument. No clamps arenecessary.
2. Put the other end of the bubbler line tubing at the correct head measurement point for thatprimary device. All weirs and flumes come with or can be retrofitted with a connection for thebubbler line tubing.If a bubbler area/velocity sensor is not connected to the Velocity port on the instrument, put theother end of the tubing in the flow stream instead.Note: Stainless steel bubbler tubing line extensions are available. Optional mounting bands with built-in bubblerline tube connections for use in round channels are available.
• Make sure that the bubbler line tubing is lower than the instrument so that condensation in thetubing drains out. Moisture in the bubbler line tubing slow the flow of air and cause incorrectreadings.
• Use the shortest length of bubbler line tubing possible to decrease moisture problems andkinks.
• Use a single continuous length of tubing for the bubbler line tubing with no connections sothere are no air leaks.
• Put the end of the bubbler line tubing perpendicular (at a right angle) to the flow stream.• Make sure that the open end of the bubbler line tubing is 2.5–5 cm (1–2 in.) below the lowest
expected level in the channel. Push LEVEL ADJUST to calibrate the reading shown to theactual level in the channel.
• In a weir or flume, use a stilling well. Silt and sediment collection in a stilling well is not typical.• In round pipes, use the mounting bands from the manufacturer or put the bubbler line tubing
along the wall in a slot or groove and cover it so it does not stick out into the flow stream andcollect unwanted material.
3. If the instrument is in a location where it can be temporary under water:
a. Attach a length of ¼-in. ID tubing to both the Reference port and the Intake port barbedfittings.
b. Put the ends of the reference port tubing and intake port tubing in a location that is alwaysabove water.
c. Attach both air dryer cartridges to the tubing. Make sure that the air dryer cartridge openings(end caps) are down so that moisture, condensation and/or precipitation does not collect inthe vent openings of the air dryer cartridge. If the air dryer cartridge openings are up, damageto the air pump and internal plumbing systems can occur.
Optional: Enable the auto-purge feature to remove unwanted material from the bubbler tube. Whenenabled, a 1-second high pressure air purge occurs at the end of the selected time interval. From theMain Menu, select OPTIONS>ADVANCED OPTIONS>CALIBRATION>BUBBLER>AUTO PURGE.
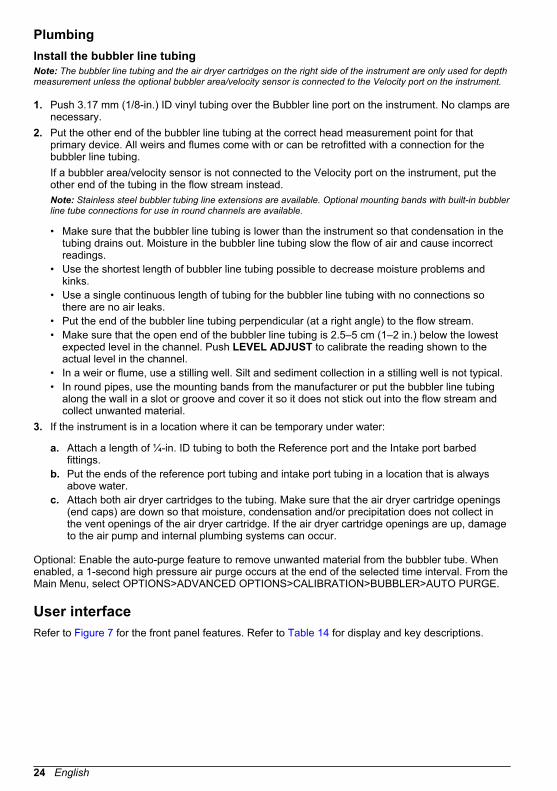
User interfaceRefer to Figure 7 for the front panel features. Refer to Table 14 for display and key descriptions.
24 English
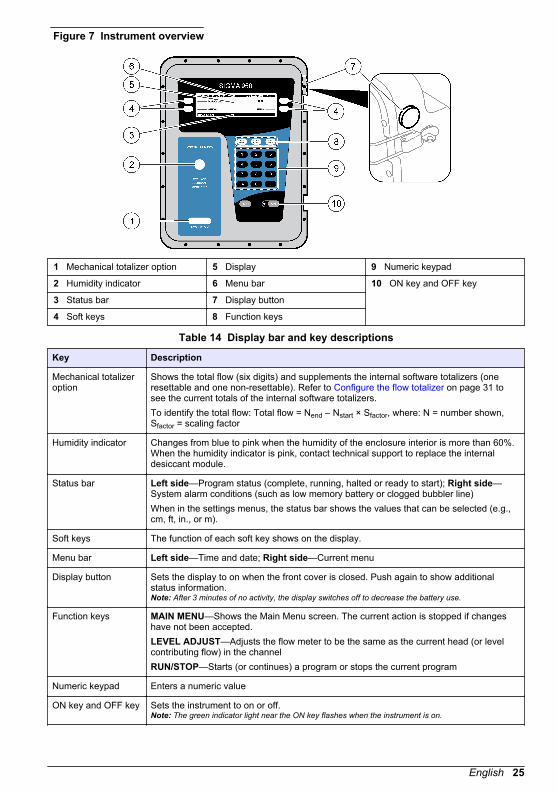
Figure 7 Instrument overview
1 Mechanical totalizer option 5 Display 9 Numeric keypad
2 Humidity indicator 6 Menu bar 10 ON key and OFF key
3 Status bar 7 Display button
4 Soft keys 8 Function keys
Table 14 Display bar and key descriptions
Key Description
Mechanical totalizeroption
Shows the total flow (six digits) and supplements the internal software totalizers (oneresettable and one non-resettable). Refer to Configure the flow totalizer on page 31 tosee the current totals of the internal software totalizers.To identify the total flow: Total flow = Nend – Nstart × Sfactor, where: N = number shown,Sfactor = scaling factor
Humidity indicator Changes from blue to pink when the humidity of the enclosure interior is more than 60%.When the humidity indicator is pink, contact technical support to replace the internaldesiccant module.
Status bar Left side—Program status (complete, running, halted or ready to start); Right side—System alarm conditions (such as low memory battery or clogged bubbler line)When in the settings menus, the status bar shows the values that can be selected (e.g.,cm, ft, in., or m).
Soft keys The function of each soft key shows on the display.
Menu bar Left side—Time and date; Right side—Current menu
Display button Sets the display to on when the front cover is closed. Push again to show additionalstatus information.Note: After 3 minutes of no activity, the display switches off to decrease the battery use.
Function keys MAIN MENU—Shows the Main Menu screen. The current action is stopped if changeshave not been accepted.LEVEL ADJUST—Adjusts the flow meter to be the same as the current head (or levelcontributing flow) in the channelRUN/STOP—Starts (or continues) a program or stops the current program
Numeric keypad Enters a numeric value
ON key and OFF key Sets the instrument to on or off.Note: The green indicator light near the ON key flashes when the instrument is on.
English 25
Operation
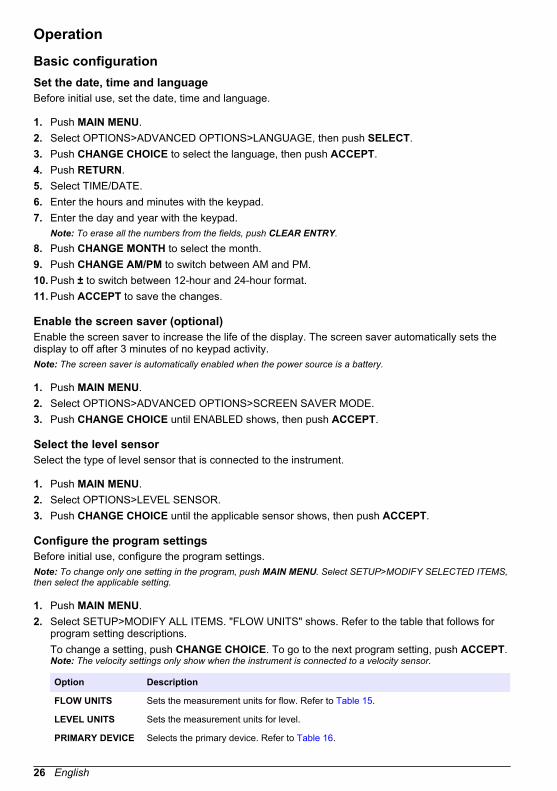
Basic configurationSet the date, time and languageBefore initial use, set the date, time and language.
1. Push MAIN MENU.2. Select OPTIONS>ADVANCED OPTIONS>LANGUAGE, then push SELECT.3. Push CHANGE CHOICE to select the language, then push ACCEPT.4. Push RETURN.5. Select TIME/DATE.6. Enter the hours and minutes with the keypad.7. Enter the day and year with the keypad.
Note: To erase all the numbers from the fields, push CLEAR ENTRY.
8. Push CHANGE MONTH to select the month.9. Push CHANGE AM/PM to switch between AM and PM.10. Push ± to switch between 12-hour and 24-hour format.11. Push ACCEPT to save the changes.
Enable the screen saver (optional)Enable the screen saver to increase the life of the display. The screen saver automatically sets thedisplay to off after 3 minutes of no keypad activity.Note: The screen saver is automatically enabled when the power source is a battery.
1. Push MAIN MENU.2. Select OPTIONS>ADVANCED OPTIONS>SCREEN SAVER MODE.3. Push CHANGE CHOICE until ENABLED shows, then push ACCEPT.
Select the level sensorSelect the type of level sensor that is connected to the instrument.
1. Push MAIN MENU.2. Select OPTIONS>LEVEL SENSOR.3. Push CHANGE CHOICE until the applicable sensor shows, then push ACCEPT.
Configure the program settingsBefore initial use, configure the program settings.Note: To change only one setting in the program, push MAIN MENU. Select SETUP>MODIFY SELECTED ITEMS,then select the applicable setting.
1. Push MAIN MENU.2. Select SETUP>MODIFY ALL ITEMS. "FLOW UNITS" shows. Refer to the table that follows for
program setting descriptions.To change a setting, push CHANGE CHOICE. To go to the next program setting, push ACCEPT.Note: The velocity settings only show when the instrument is connected to a velocity sensor.
Option Description
FLOW UNITS Sets the measurement units for flow. Refer to Table 15.
LEVEL UNITS Sets the measurement units for level.
PRIMARY DEVICE Selects the primary device. Refer to Table 16.
26 English

Option Description
PROGRAM LOCK Enables or disables the program lock. The program lock prevents unauthorized use ofthe keyboard and access via RS232 or modem. The program lock password is9500 and cannot be changed.
SAMPLER PACING Enables or disables sampling. Sets the sample interval. Options: 100 gallons (gal),liters (ltr), cubic meters (m3), acre-feet (af) or cubic feet (cf)
SITE ID Sets the site ID (maximum of 8 digits). The site ID is on all data printouts. Use thisfeature when multiple sites are monitored with a single flow meter or if data readingsfrom multiple flow meters are collected.Note: A text site ID can be set with InSight data management software and anRS232 connection.
TOTAL FLOWUNITS
Sets the measurement units for total flow. Options: gallons (gal), liters (ltr), cubicmeters (m3), acre-feet (af) or cubic feet (cf)
VELOCITYDIRECTION
Sets the direction of velocity. Options: UPSTREAM (NORMAL), DOWNSTREAM orALWAYS POSITIVE
VELOCITY UNITS Sets the measurement units for velocity. Options: ft/s, m/s
VELOCITYCUTOFF
Sets the velocity cutoff. Use when the site has low velocities and frequent lowparticulate concentrations that prevent velocity measurements.Example 1: Velocity cutoff = 0.20 ft/s, Velocity default = 0 ft/sIf the velocity is less than 0.20 ft/s, the meter saves a value of 0 ft/s until the velocityincreases to more than 0.20 ft/s.Example 2: Velocity cutoff = 0.20 ft/s, Velocity default = 0.20 ft/sIf the velocity is less than 0.20 ft/s, the meter saves a value of 0.20 ft/s until the velocityincreases to more than 0.20 ft/s.
VELOCITYDEFAULT
Sets the velocity value that is used when velocity cannot be measured.
Table 15 Flow unit options
Option Description Option Description Option Description
gps Gallons per second mgd Million gallons per day cfd Cubic feet per day
gpm Gallons per minute afd Acre-feet per day cms Cubic meters per second
gph Gallons per hour cfs Cubic feet per second cmm Cubic meters per minute
lps Liters per second cfm Cubic feet per minute cmh Cubic meters per hour
lpm Liters per minute cfh Cubic feet per hour cmd Cubic meters per day
lph Liters per hour
Table 16 Primary device options
Option Description
NONE – LEVELONLY
No primary device is installed. Level measurement only
WEIR Options: COMPOUND, CIPOLLETTI, CONTRACTED RECTANGULAR, NON-CONTRACTED RECTANGULAR, THELMAR, V-NOTCH (22.5-120°) or COMPOUND V-NOTCHSelect an option, then go to Table 17.
FLUME Options: PARSHALL, TRAPEZOIDAL, H-TYPE, HL-TYPE, HS-TYPE, LEOPOLD-LAGCO, or PALMER BOWLUSSelect an option, then go to Table 18.
English 27
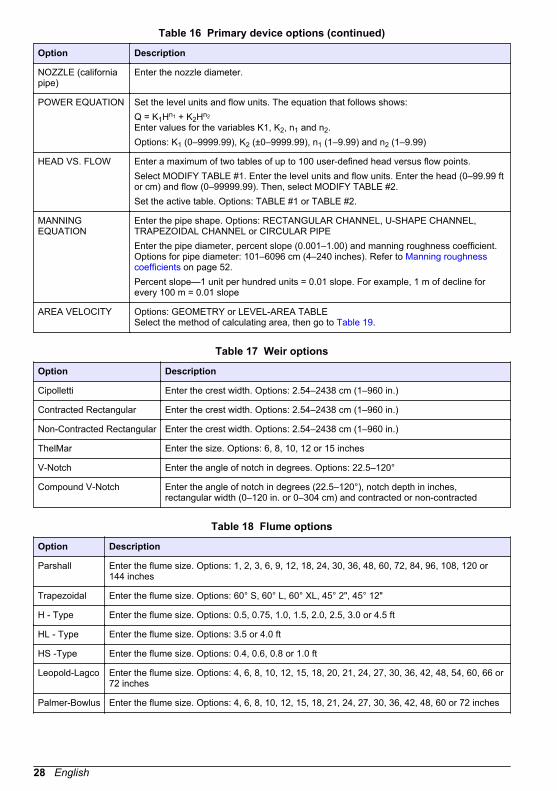
Table 16 Primary device options (continued)
Option Description
NOZZLE (californiapipe)
Enter the nozzle diameter.
POWER EQUATION Set the level units and flow units. The equation that follows shows:Q = K1Hn1 + K2Hn2
Enter values for the variables K1, K2, n1 and n2.Options: K1 (0–9999.99), K2 (±0–9999.99), n1 (1–9.99) and n2 (1–9.99)
HEAD VS. FLOW Enter a maximum of two tables of up to 100 user-defined head versus flow points.Select MODIFY TABLE #1. Enter the level units and flow units. Enter the head (0–99.99 ftor cm) and flow (0–99999.99). Then, select MODIFY TABLE #2.Set the active table. Options: TABLE #1 or TABLE #2.
MANNINGEQUATION
Enter the pipe shape. Options: RECTANGULAR CHANNEL, U-SHAPE CHANNEL,TRAPEZOIDAL CHANNEL or CIRCULAR PIPEEnter the pipe diameter, percent slope (0.001–1.00) and manning roughness coefficient.Options for pipe diameter: 101–6096 cm (4–240 inches). Refer to Manning roughnesscoefficients on page 52.Percent slope—1 unit per hundred units = 0.01 slope. For example, 1 m of decline forevery 100 m = 0.01 slope
AREA VELOCITY Options: GEOMETRY or LEVEL-AREA TABLESelect the method of calculating area, then go to Table 19.
Table 17 Weir options
Option Description
Cipolletti Enter the crest width. Options: 2.54–2438 cm (1–960 in.)
Contracted Rectangular Enter the crest width. Options: 2.54–2438 cm (1–960 in.)
Non-Contracted Rectangular Enter the crest width. Options: 2.54–2438 cm (1–960 in.)
ThelMar Enter the size. Options: 6, 8, 10, 12 or 15 inches
V-Notch Enter the angle of notch in degrees. Options: 22.5–120°
Compound V-Notch Enter the angle of notch in degrees (22.5–120°), notch depth in inches,rectangular width (0–120 in. or 0–304 cm) and contracted or non-contracted
Table 18 Flume options
Option Description
Parshall Enter the flume size. Options: 1, 2, 3, 6, 9, 12, 18, 24, 30, 36, 48, 60, 72, 84, 96, 108, 120 or144 inches
Trapezoidal Enter the flume size. Options: 60° S, 60° L, 60° XL, 45° 2", 45° 12"
H - Type Enter the flume size. Options: 0.5, 0.75, 1.0, 1.5, 2.0, 2.5, 3.0 or 4.5 ft
HL - Type Enter the flume size. Options: 3.5 or 4.0 ft
HS -Type Enter the flume size. Options: 0.4, 0.6, 0.8 or 1.0 ft
Leopold-Lagco Enter the flume size. Options: 4, 6, 8, 10, 12, 15, 18, 20, 21, 24, 27, 30, 36, 42, 48, 54, 60, 66 or72 inches
Palmer-Bowlus Enter the flume size. Options: 4, 6, 8, 10, 12, 15, 18, 21, 24, 27, 30, 36, 42, 48, 60 or 72 inches
28 English
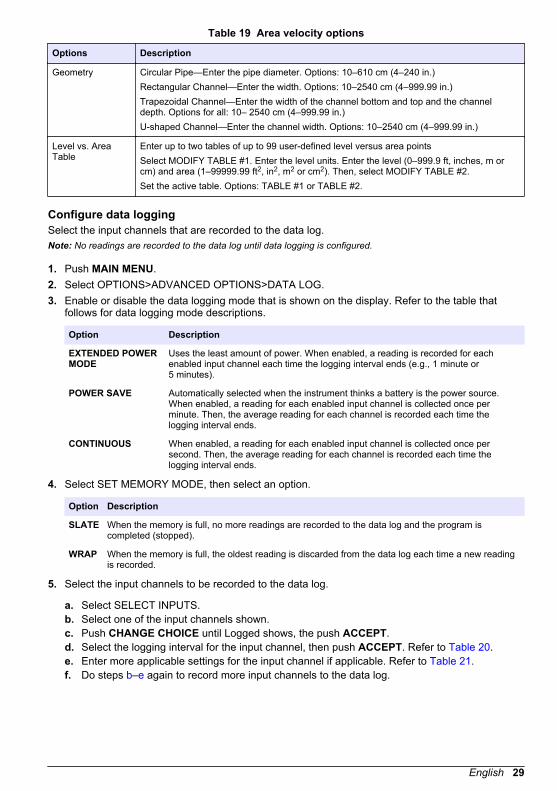
Table 19 Area velocity options
Options Description
Geometry Circular Pipe—Enter the pipe diameter. Options: 10–610 cm (4–240 in.)Rectangular Channel—Enter the width. Options: 10–2540 cm (4–999.99 in.)Trapezoidal Channel—Enter the width of the channel bottom and top and the channeldepth. Options for all: 10– 2540 cm (4–999.99 in.)U-shaped Channel—Enter the channel width. Options: 10–2540 cm (4–999.99 in.)
Level vs. AreaTable
Enter up to two tables of up to 99 user-defined level versus area pointsSelect MODIFY TABLE #1. Enter the level units. Enter the level (0–999.9 ft, inches, m orcm) and area (1–99999.99 ft2, in2, m2 or cm2). Then, select MODIFY TABLE #2.Set the active table. Options: TABLE #1 or TABLE #2.
Configure data loggingSelect the input channels that are recorded to the data log.Note: No readings are recorded to the data log until data logging is configured.
1. Push MAIN MENU.2. Select OPTIONS>ADVANCED OPTIONS>DATA LOG.3. Enable or disable the data logging mode that is shown on the display. Refer to the table that
follows for data logging mode descriptions.
Option Description
EXTENDED POWERMODE
Uses the least amount of power. When enabled, a reading is recorded for eachenabled input channel each time the logging interval ends (e.g., 1 minute or5 minutes).
POWER SAVE Automatically selected when the instrument thinks a battery is the power source.When enabled, a reading for each enabled input channel is collected once perminute. Then, the average reading for each channel is recorded each time thelogging interval ends.
CONTINUOUS When enabled, a reading for each enabled input channel is collected once persecond. Then, the average reading for each channel is recorded each time thelogging interval ends.
4. Select SET MEMORY MODE, then select an option.
Option Description
SLATE When the memory is full, no more readings are recorded to the data log and the program iscompleted (stopped).
WRAP When the memory is full, the oldest reading is discarded from the data log each time a new readingis recorded.
5. Select the input channels to be recorded to the data log.
a. Select SELECT INPUTS.b. Select one of the input channels shown.c. Push CHANGE CHOICE until Logged shows, the push ACCEPT.d. Select the logging interval for the input channel, then push ACCEPT. Refer to Table 20.e. Enter more applicable settings for the input channel if applicable. Refer to Table 21.f. Do steps b–e again to record more input channels to the data log.
English 29
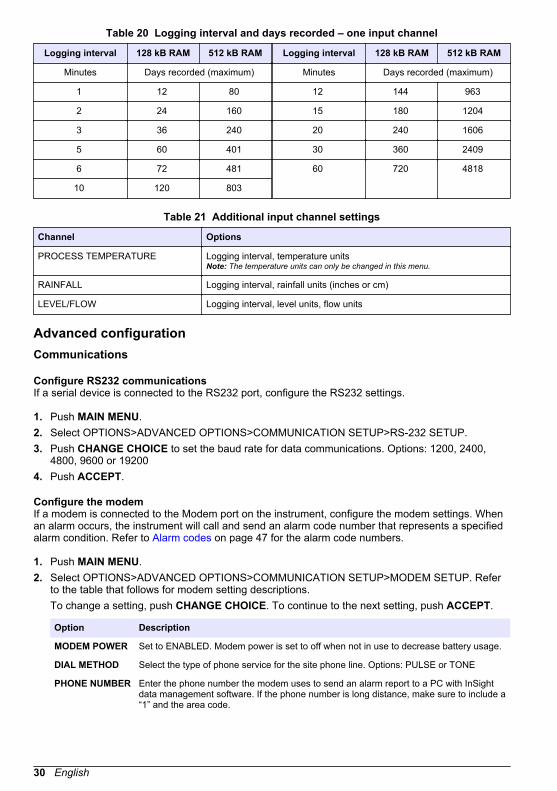
Table 20 Logging interval and days recorded – one input channel
Logging interval 128 kB RAM 512 kB RAM Logging interval 128 kB RAM 512 kB RAM
Minutes Days recorded (maximum) Minutes Days recorded (maximum)
1 12 80 12 144 963
2 24 160 15 180 1204
3 36 240 20 240 1606
5 60 401 30 360 2409
6 72 481 60 720 4818
10 120 803
Table 21 Additional input channel settings
Channel Options
PROCESS TEMPERATURE Logging interval, temperature unitsNote: The temperature units can only be changed in this menu.
RAINFALL Logging interval, rainfall units (inches or cm)
LEVEL/FLOW Logging interval, level units, flow units
Advanced configurationCommunications
Configure RS232 communicationsIf a serial device is connected to the RS232 port, configure the RS232 settings.
1. Push MAIN MENU.2. Select OPTIONS>ADVANCED OPTIONS>COMMUNICATION SETUP>RS-232 SETUP.3. Push CHANGE CHOICE to set the baud rate for data communications. Options: 1200, 2400,
4800, 9600 or 19200 4. Push ACCEPT.
Configure the modemIf a modem is connected to the Modem port on the instrument, configure the modem settings. Whenan alarm occurs, the instrument will call and send an alarm code number that represents a specifiedalarm condition. Refer to Alarm codes on page 47 for the alarm code numbers.
1. Push MAIN MENU.2. Select OPTIONS>ADVANCED OPTIONS>COMMUNICATION SETUP>MODEM SETUP. Refer
to the table that follows for modem setting descriptions.To change a setting, push CHANGE CHOICE. To continue to the next setting, push ACCEPT.
Option Description
MODEM POWER Set to ENABLED. Modem power is set to off when not in use to decrease battery usage.
DIAL METHOD Select the type of phone service for the site phone line. Options: PULSE or TONE
PHONE NUMBER Enter the phone number the modem uses to send an alarm report to a PC with InSightdata management software. If the phone number is long distance, make sure to include a“1” and the area code.
30 English
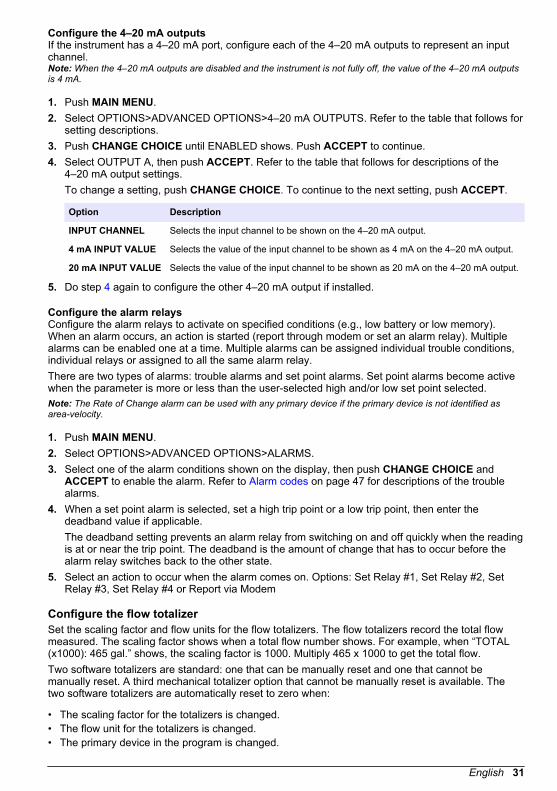
Configure the 4–20 mA outputsIf the instrument has a 4–20 mA port, configure each of the 4–20 mA outputs to represent an inputchannel.Note: When the 4–20 mA outputs are disabled and the instrument is not fully off, the value of the 4–20 mA outputsis 4 mA.
1. Push MAIN MENU.2. Select OPTIONS>ADVANCED OPTIONS>4–20 mA OUTPUTS. Refer to the table that follows for
setting descriptions.3. Push CHANGE CHOICE until ENABLED shows. Push ACCEPT to continue.4. Select OUTPUT A, then push ACCEPT. Refer to the table that follows for descriptions of the
4–20 mA output settings.To change a setting, push CHANGE CHOICE. To continue to the next setting, push ACCEPT.
Option Description
INPUT CHANNEL Selects the input channel to be shown on the 4–20 mA output.
4 mA INPUT VALUE Selects the value of the input channel to be shown as 4 mA on the 4–20 mA output.
20 mA INPUT VALUE Selects the value of the input channel to be shown as 20 mA on the 4–20 mA output.
5. Do step 4 again to configure the other 4–20 mA output if installed.
Configure the alarm relaysConfigure the alarm relays to activate on specified conditions (e.g., low battery or low memory).When an alarm occurs, an action is started (report through modem or set an alarm relay). Multiplealarms can be enabled one at a time. Multiple alarms can be assigned individual trouble conditions,individual relays or assigned to all the same alarm relay.There are two types of alarms: trouble alarms and set point alarms. Set point alarms become activewhen the parameter is more or less than the user-selected high and/or low set point selected.Note: The Rate of Change alarm can be used with any primary device if the primary device is not identified asarea-velocity.
1. Push MAIN MENU.2. Select OPTIONS>ADVANCED OPTIONS>ALARMS.3. Select one of the alarm conditions shown on the display, then push CHANGE CHOICE and
ACCEPT to enable the alarm. Refer to Alarm codes on page 47 for descriptions of the troublealarms.
4. When a set point alarm is selected, set a high trip point or a low trip point, then enter thedeadband value if applicable.The deadband setting prevents an alarm relay from switching on and off quickly when the readingis at or near the trip point. The deadband is the amount of change that has to occur before thealarm relay switches back to the other state.
5. Select an action to occur when the alarm comes on. Options: Set Relay #1, Set Relay #2, SetRelay #3, Set Relay #4 or Report via Modem
Configure the flow totalizerSet the scaling factor and flow units for the flow totalizers. The flow totalizers record the total flowmeasured. The scaling factor shows when a total flow number shows. For example, when “TOTAL(x1000): 465 gal.” shows, the scaling factor is 1000. Multiply 465 x 1000 to get the total flow.Two software totalizers are standard: one that can be manually reset and one that cannot bemanually reset. A third mechanical totalizer option that cannot be manually reset is available. Thetwo software totalizers are automatically reset to zero when:
• The scaling factor for the totalizers is changed.• The flow unit for the totalizers is changed.• The primary device in the program is changed.
English 31
• A new program is started.
1. Push MAIN MENU.2. Select OPTIONS>ADVANCED OPTIONS>FLOW TOTALIZER>MODIFY SETUP.3. Push CHANGE CHOICE to set the scaling factor, then push ACCEPT. Options: X1, X10, X100,
X1000, X10,000, X100,000 or X1,000,000 Select a high scaling factor for applications with high flow rates. Select a low scaling factor forapplications with low flow rates.Note: The scaling factor applies to all the totalizers.
4. Push CHANGE CHOICE to set the measurement units for flow, then push ACCEPT.Note: This setting is independent of the flow units selected in the Setup menu.
5. To reset the totalizer, select RESET, then push YES. Reset the totalizer to get the total flow overa specified period.Note: The other totalizers are not affected when the totalizer is reset.
6. To see the current totals of both the resettable and non-resettable totalizers, select VIEWTOTALS.
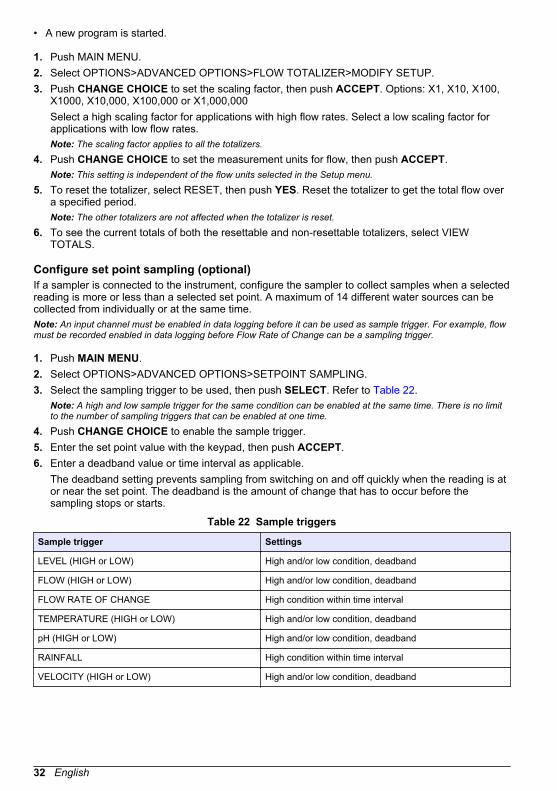
Configure set point sampling (optional)If a sampler is connected to the instrument, configure the sampler to collect samples when a selectedreading is more or less than a selected set point. A maximum of 14 different water sources can becollected from individually or at the same time.Note: An input channel must be enabled in data logging before it can be used as sample trigger. For example, flowmust be recorded enabled in data logging before Flow Rate of Change can be a sampling trigger.
1. Push MAIN MENU.2. Select OPTIONS>ADVANCED OPTIONS>SETPOINT SAMPLING.3. Select the sampling trigger to be used, then push SELECT. Refer to Table 22.
Note: A high and low sample trigger for the same condition can be enabled at the same time. There is no limitto the number of sampling triggers that can be enabled at one time.
4. Push CHANGE CHOICE to enable the sample trigger.5. Enter the set point value with the keypad, then push ACCEPT.6. Enter a deadband value or time interval as applicable.
The deadband setting prevents sampling from switching on and off quickly when the reading is ator near the set point. The deadband is the amount of change that has to occur before thesampling stops or starts.
Table 22 Sample triggers
Sample trigger Settings
LEVEL (HIGH or LOW) High and/or low condition, deadband
FLOW (HIGH or LOW) High and/or low condition, deadband
FLOW RATE OF CHANGE High condition within time interval
TEMPERATURE (HIGH or LOW) High and/or low condition, deadband
pH (HIGH or LOW) High and/or low condition, deadband
RAINFALL High condition within time interval
VELOCITY (HIGH or LOW) High and/or low condition, deadband
32 English
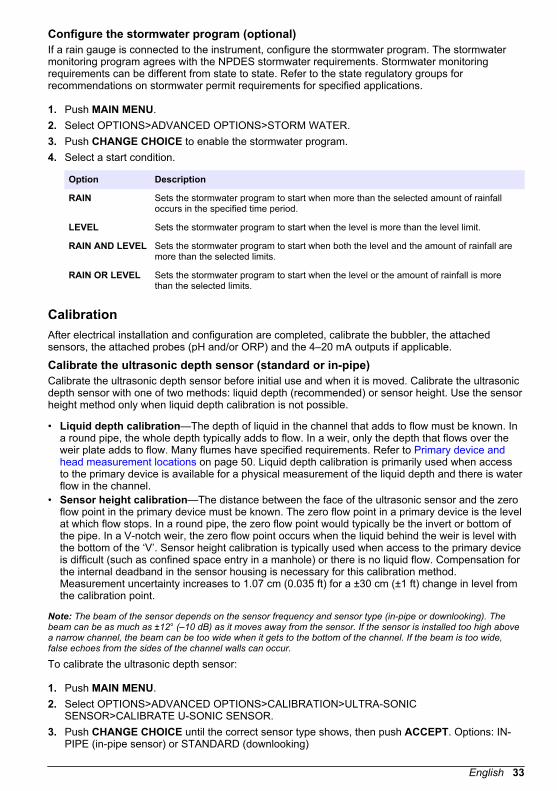
Configure the stormwater program (optional)If a rain gauge is connected to the instrument, configure the stormwater program. The stormwatermonitoring program agrees with the NPDES stormwater requirements. Stormwater monitoringrequirements can be different from state to state. Refer to the state regulatory groups forrecommendations on stormwater permit requirements for specified applications.
1. Push MAIN MENU.2. Select OPTIONS>ADVANCED OPTIONS>STORM WATER.3. Push CHANGE CHOICE to enable the stormwater program.4. Select a start condition.
Option Description
RAIN Sets the stormwater program to start when more than the selected amount of rainfalloccurs in the specified time period.
LEVEL Sets the stormwater program to start when the level is more than the level limit.
RAIN AND LEVEL Sets the stormwater program to start when both the level and the amount of rainfall aremore than the selected limits.
RAIN OR LEVEL Sets the stormwater program to start when the level or the amount of rainfall is morethan the selected limits.
CalibrationAfter electrical installation and configuration are completed, calibrate the bubbler, the attachedsensors, the attached probes (pH and/or ORP) and the 4–20 mA outputs if applicable.
Calibrate the ultrasonic depth sensor (standard or in-pipe)Calibrate the ultrasonic depth sensor before initial use and when it is moved. Calibrate the ultrasonicdepth sensor with one of two methods: liquid depth (recommended) or sensor height. Use the sensorheight method only when liquid depth calibration is not possible.
• Liquid depth calibration—The depth of liquid in the channel that adds to flow must be known. Ina round pipe, the whole depth typically adds to flow. In a weir, only the depth that flows over theweir plate adds to flow. Many flumes have specified requirements. Refer to Primary device andhead measurement locations on page 50. Liquid depth calibration is primarily used when accessto the primary device is available for a physical measurement of the liquid depth and there is waterflow in the channel.
• Sensor height calibration—The distance between the face of the ultrasonic sensor and the zeroflow point in the primary device must be known. The zero flow point in a primary device is the levelat which flow stops. In a round pipe, the zero flow point would typically be the invert or bottom ofthe pipe. In a V-notch weir, the zero flow point occurs when the liquid behind the weir is level withthe bottom of the ‘V’. Sensor height calibration is typically used when access to the primary deviceis difficult (such as confined space entry in a manhole) or there is no liquid flow. Compensation forthe internal deadband in the sensor housing is necessary for this calibration method.Measurement uncertainty increases to 1.07 cm (0.035 ft) for a ±30 cm (±1 ft) change in level fromthe calibration point.
Note: The beam of the sensor depends on the sensor frequency and sensor type (in-pipe or downlooking). Thebeam can be as much as ±12° (–10 dB) as it moves away from the sensor. If the sensor is installed too high abovea narrow channel, the beam can be too wide when it gets to the bottom of the channel. If the beam is too wide,false echoes from the sides of the channel walls can occur.
To calibrate the ultrasonic depth sensor:
1. Push MAIN MENU.2. Select OPTIONS>ADVANCED OPTIONS>CALIBRATION>ULTRA-SONIC
SENSOR>CALIBRATE U-SONIC SENSOR.3. Push CHANGE CHOICE until the correct sensor type shows, then push ACCEPT. Options: IN-
PIPE (in-pipe sensor) or STANDARD (downlooking)
English 33
4. Enter the ambient air temperature at the transducer location.5. For the best results, wait 100 minutes to let the sensor get to the ambient temperature. Make sure
that the sensor is not in direct sunlight.Note: The speed of sound in air changes with the temperature of the air. The ultrasonic sensor hastemperature compensation to help remove the effect of temperature variation under typical site conditions.
6. Push ACCEPT.7. For liquid depth calibration (recommended):
a. Select LIQUID DEPTH.b. Measure the liquid depth (head) of the liquid in the channel and enter the value, then push
ACCEPT.8. For sensor height calibration:
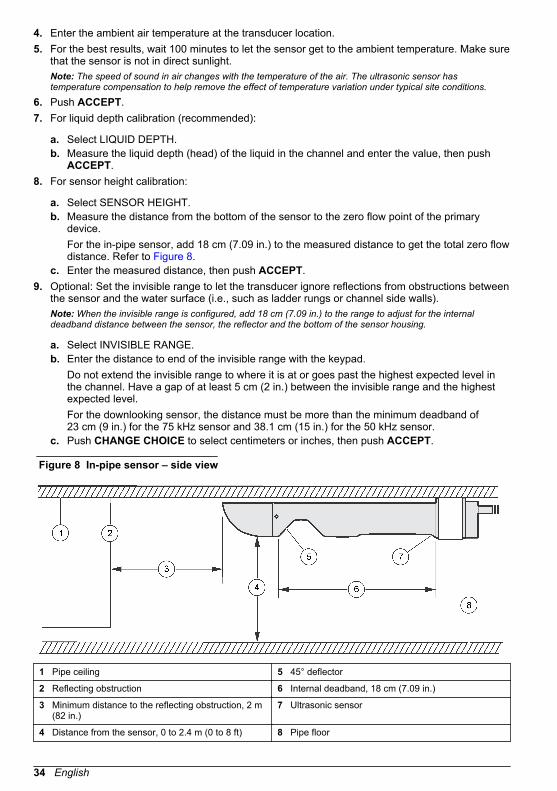
a. Select SENSOR HEIGHT.b. Measure the distance from the bottom of the sensor to the zero flow point of the primary
device.For the in-pipe sensor, add 18 cm (7.09 in.) to the measured distance to get the total zero flowdistance. Refer to Figure 8.
c. Enter the measured distance, then push ACCEPT.9. Optional: Set the invisible range to let the transducer ignore reflections from obstructions between
the sensor and the water surface (i.e., such as ladder rungs or channel side walls).Note: When the invisible range is configured, add 18 cm (7.09 in.) to the range to adjust for the internaldeadband distance between the sensor, the reflector and the bottom of the sensor housing.
a. Select INVISIBLE RANGE.b. Enter the distance to end of the invisible range with the keypad.
Do not extend the invisible range to where it is at or goes past the highest expected level inthe channel. Have a gap of at least 5 cm (2 in.) between the invisible range and the highestexpected level.For the downlooking sensor, the distance must be more than the minimum deadband of23 cm (9 in.) for the 75 kHz sensor and 38.1 cm (15 in.) for the 50 kHz sensor.
c. Push CHANGE CHOICE to select centimeters or inches, then push ACCEPT.
Figure 8 In-pipe sensor – side view
1 Pipe ceiling 5 45° deflector
2 Reflecting obstruction 6 Internal deadband, 18 cm (7.09 in.)
3 Minimum distance to the reflecting obstruction, 2 m(82 in.)
7 Ultrasonic sensor
4 Distance from the sensor, 0 to 2.4 m (0 to 8 ft) 8 Pipe floor
34 English

Calibrate the submerged area/velocity sensorCalibrate the submerged area/velocity sensor before initial use, when it is replaced and when thedifference between the level reading of the instrument and the independent verification(measurement with a dipstick and ruler) is not constant.Note: Differences in site conditions and measurement abilities can cause errors. These errors can cause smallchanges in the difference between the level reading of the instrument and independent verification. These errors donot identify a real change in the difference.
1. Push MAIN MENU.2. Select OPTIONS>ADVANCED OPTIONS>CALIBRATION>SUBMERGED PROBE.3. Put the sensor flat on a table top or floor with the sensor (the plate with holes) down.4. Push any key to continue.
Calibrate the low profile velocity-only sensorCalibration is not necessary for the velocity-only sensor.
Calibrate the submerged depth-only sensorCalibrate the submerged depth-only sensor before initial use, every 6 months and when the sensor isreplaced for the best accuracy. It is not necessary to calibrate the submerged depth-only sensor foreach use.Items to collect:
• Graduated cylinder or bucket with at least 16 cm (6 in.) of water• Ruler
1. Push MAIN MENU.2. Select OPTIONS>ADVANCED OPTIONS>CALIBRATION>SUBMERGED PROBE.3. Push CHANGE CHOICE until the installation orientation (horizontal or vertical) of the sensor
shows, then push ACCEPT.4. With the sensor out of the water, hold the sensor in the air in the orientation the sensor will be
installed in the flow stream, then push ACCEPT. Refer to Figure 9.5. For vertical orientation:
a. Put the sensor under at least 16 cm (6 in.) of water in a vertical orientation. Make sure that thesensor does not move.
b. Push ACCEPT.c. Measure the depth (D1) from the surface of the water to the first weld mark (around the
sensor body) above the breather vent holes. Refer to Figure 10. The weld mark identifies thelocation of the internal diaphragm.
d. Enter the depth (D1) with the numeric keypad, then press ACCEPT.6. For horizontal orientation:
a. Put the sensor under at least 16 cm (6 in.) of water in a horizontal orientation. Make sure thatthe sensor is stable.
b. Push ACCEPT.c. Measure the depth from the bottom of the bucket to the surface of the water (D1). Refer to
Figure 11.d. Enter the depth (D1) with the numeric keypad, then press ACCEPT.
7. Put the sensor back in the flow stream.8. Push LEVEL ADJUST to adjust the level.
English 35
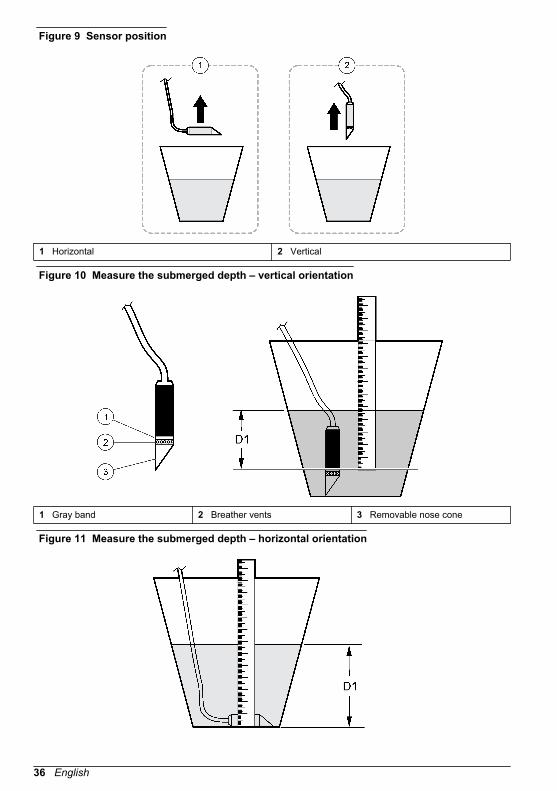
Figure 9 Sensor position
1 Horizontal 2 Vertical
Figure 10 Measure the submerged depth – vertical orientation
1 Gray band 2 Breather vents 3 Removable nose cone
Figure 11 Measure the submerged depth – horizontal orientation
36 English
Calibrate the bubblerCalibrate the bubbler before initial use and at least once a year for the best accuracy.Items to collect:
• Graduated cylinder with at least 16 cm (6 in.) of water• Ruler• 3.17 mm (1/8-in.) ID vinyl tubing, 1 m (3 ft)
1. Push MAIN MENU.2. Select OPTIONS>ADVANCED OPTIONS>CALIBRATION>BUBBLER>SET BUBBLE RATE.3. Enter the bubble rate (1–5) for the bubbler line, then push ACCEPT. One bubble per second is
recommended. A higher bubble rate can increase the level reading because of friction on thebubbler line tubing.When a battery is the power source, set the bubble rate to 1 and auto purge interval to30 minutes or higher to increase the battery life.Note: Use the auto purge feature to keep unwanted material out of the bubbler line tubing instead of a highbubble rate. Select OPTIONS>ADVANCED OPTIONS>CALIBRATION>BUBBLER>AUTO PURGE.
4. Install the 1 m (3 ft) of new bubbler line tubing to the Bubbler line port on the instrument.5. Put the other end of the tubing in the graduated cylinder. Make sure that the tubing cannot move
in the graduated cylinder.6. Select CALIBRATE BUBBLER.7. Carefully measure the depth of the bubbler line with a ruler. Measure from the surface of the
water to the bottom of the bubbler line.8. Enter the measured depth with the numeric keypad, the push ACCEPT.
The current reading is shown for reference.9. Examine the bubble rate in a depth of water that is typical for the installation and adjust if
necessary to get one bubble per second.If the bubble rate is set at a location other than the installation site, use the same inside diameterand length of the bubbler line tubing that will be used at the site.
10. Push LEVEL ADJUST to adjust the level.Note: For the best accuracy, push LEVEL ADJUST each time the bubble rate is changed.
Calibrate the pH probe
N O T I C E The pH probe is an application sensitive device. When used in corrosive environments, the accuracy and the lifeof the probe decreases.
Calibrate the pH probe before initial use and after it is cleaned or replaced. Periodically inspect andcompare the pH probe readings to a hand-held pH meter to identify the optimum cleaning andcalibration schedule for the environment.Items to collect:
• Thermometer• Two pH buffers (4, 7 or 10 pH)
1. Push MAIN MENU.2. Select OPTIONS>ADVANCED OPTIONS>CALIBRATION>ORP.3. Put the probe in one of the pH buffers, then push any key.4. Enter the temperature of the buffer solution with the numeric keypad, then push ACCEPT.5. Push CHANGE CHOICE until the pH value of the buffer solution shows, then push ACCEPT.6. Remove the pH probe from the buffer.7. Rinse the pH probe with distilled water.
English 37
8. Put the probe in the second pH buffer, then push any key.9. Push CHANGE CHOICE until the pH value of the second buffer solution shows, then push
ACCEPT.10. If the error "pH Calibration Failed-Gain And/Or Offset Out of Range, Try Again” shows, do the
calibration again with fresh pH buffers. If the calibration is not successful, replace the pH probe.
Calibrate the ORP probeItem to collect: DC power source (500 to 2000 mV) such as a regulated DC power supply or astandard “C” cell battery (1500 mV)
1. Push MAIN MENU.2. Select OPTIONS>ADVANCED OPTIONS>CALIBRATION>ORP.3. With the ORP junction box connected to the ORP port on the instrument, remove the ORP probe
from the ORP junction box.4. Apply a positive DC reference voltage to the ORP probe terminals in the junction box as follows.
a. Connect the positive terminal of the DC power source to the terminal block screw with thelabel GLASS.
b. Connect the negative terminal of the DC power source to the terminal block screw with thelabel REF.
Calibrate the 4-20 mA outputItem to collect: Multimeter
1. Push MAIN MENU.2. Select OPTIONS>ADVANCED OPTIONS>CALIBRATION>4–20 mA OUTPUTS.3. Connect the multimeter to the 4–20 mA current outputs. Refer to Figure 12 for the acceptable
methods.4. Set the multimeter to 20 mA DC range or higher.5. Select the output to calibrate. Options: OUTPUT A or OUTPUT B6. Push any key to set the output signal to 4.00 mA.7. Measure the current (mA) on the output with the multimeter.8. Enter the measured value (mA) with the keypad, then push ACCEPT.9. Push any key to set the output to 20.00 mA DC.10. Measure the current (mA) on the selected output with the multimeter.11. Enter the measured value (mA) with the keypad, then push ACCEPT.12. Do steps 5–11 again to calibrate the other 4–20 mA output if installed.
38 English
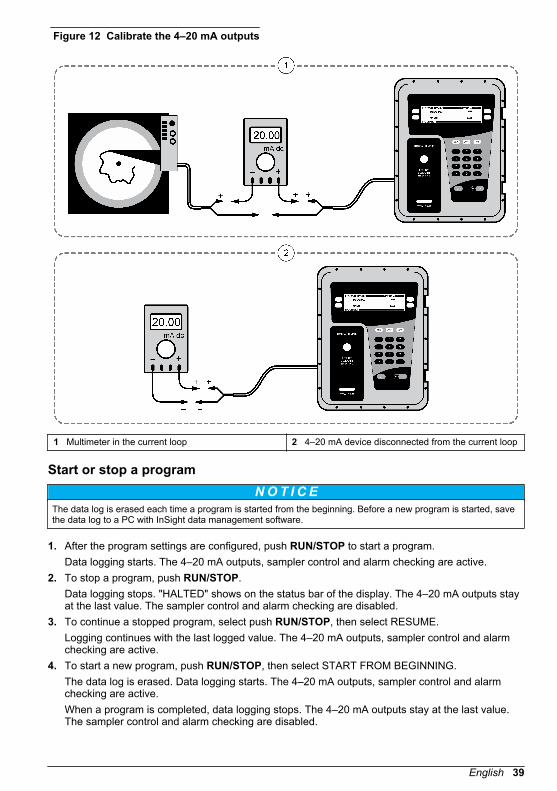
Figure 12 Calibrate the 4–20 mA outputs
1 Multimeter in the current loop 2 4–20 mA device disconnected from the current loop
Start or stop a programN O T I C E
The data log is erased each time a program is started from the beginning. Before a new program is started, savethe data log to a PC with InSight data management software.
1. After the program settings are configured, push RUN/STOP to start a program.Data logging starts. The 4–20 mA outputs, sampler control and alarm checking are active.
2. To stop a program, push RUN/STOP.Data logging stops. "HALTED" shows on the status bar of the display. The 4–20 mA outputs stayat the last value. The sampler control and alarm checking are disabled.
3. To continue a stopped program, select push RUN/STOP, then select RESUME.Logging continues with the last logged value. The 4–20 mA outputs, sampler control and alarmchecking are active.
4. To start a new program, push RUN/STOP, then select START FROM BEGINNING.The data log is erased. Data logging starts. The 4–20 mA outputs, sampler control and alarmchecking are active.When a program is completed, data logging stops. The 4–20 mA outputs stay at the last value.The sampler control and alarm checking are disabled.
English 39
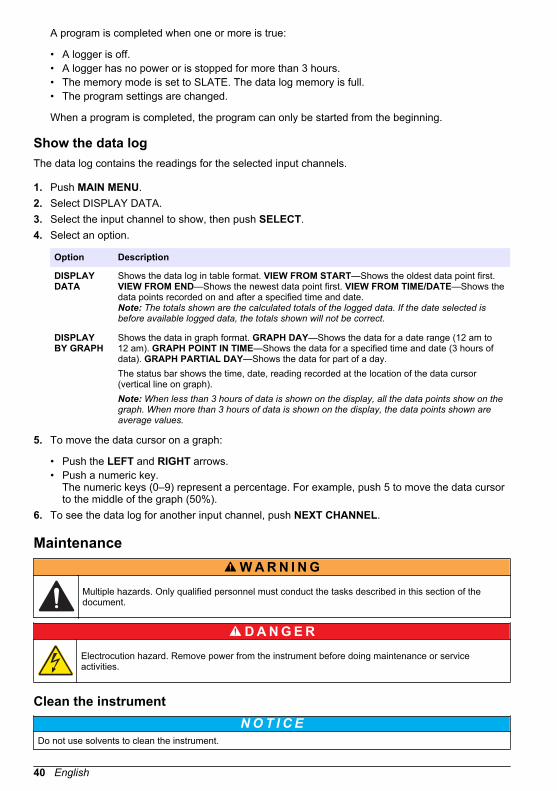
A program is completed when one or more is true:
• A logger is off.• A logger has no power or is stopped for more than 3 hours.• The memory mode is set to SLATE. The data log memory is full.• The program settings are changed.
When a program is completed, the program can only be started from the beginning.
Show the data logThe data log contains the readings for the selected input channels.
1. Push MAIN MENU.2. Select DISPLAY DATA.3. Select the input channel to show, then push SELECT.4. Select an option.
Option Description
DISPLAYDATA
Shows the data log in table format. VIEW FROM START—Shows the oldest data point first.VIEW FROM END—Shows the newest data point first. VIEW FROM TIME/DATE—Shows thedata points recorded on and after a specified time and date.Note: The totals shown are the calculated totals of the logged data. If the date selected isbefore available logged data, the totals shown will not be correct.
DISPLAYBY GRAPH
Shows the data in graph format. GRAPH DAY—Shows the data for a date range (12 am to12 am). GRAPH POINT IN TIME—Shows the data for a specified time and date (3 hours ofdata). GRAPH PARTIAL DAY—Shows the data for part of a day.The status bar shows the time, date, reading recorded at the location of the data cursor(vertical line on graph).Note: When less than 3 hours of data is shown on the display, all the data points show on thegraph. When more than 3 hours of data is shown on the display, the data points shown areaverage values.
5. To move the data cursor on a graph:
• Push the LEFT and RIGHT arrows.• Push a numeric key.
The numeric keys (0–9) represent a percentage. For example, push 5 to move the data cursorto the middle of the graph (50%).
6. To see the data log for another input channel, push NEXT CHANNEL.
MaintenanceW A R N I N G
Multiple hazards. Only qualified personnel must conduct the tasks described in this section of thedocument.
D A N G E R Electrocution hazard. Remove power from the instrument before doing maintenance or serviceactivities.
Clean the instrumentN O T I C E
Do not use solvents to clean the instrument.
40 English
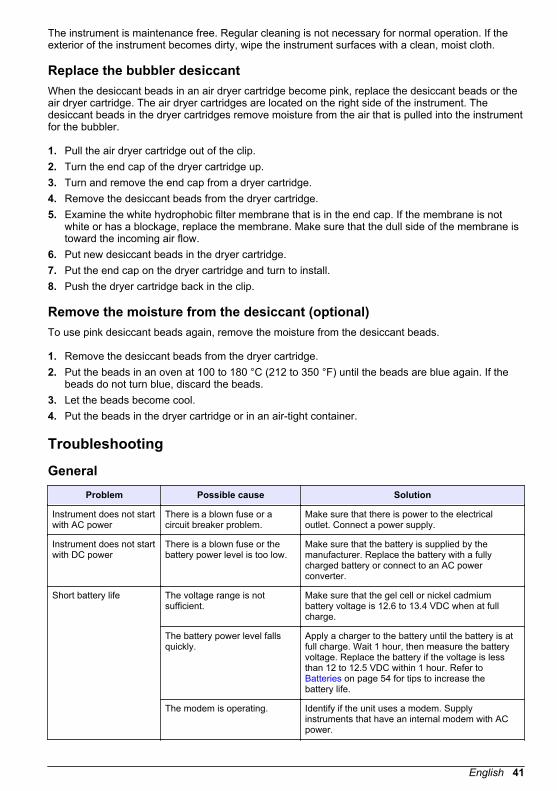
The instrument is maintenance free. Regular cleaning is not necessary for normal operation. If theexterior of the instrument becomes dirty, wipe the instrument surfaces with a clean, moist cloth.
Replace the bubbler desiccantWhen the desiccant beads in an air dryer cartridge become pink, replace the desiccant beads or theair dryer cartridge. The air dryer cartridges are located on the right side of the instrument. Thedesiccant beads in the dryer cartridges remove moisture from the air that is pulled into the instrumentfor the bubbler.
1. Pull the air dryer cartridge out of the clip.2. Turn the end cap of the dryer cartridge up.3. Turn and remove the end cap from a dryer cartridge.4. Remove the desiccant beads from the dryer cartridge.5. Examine the white hydrophobic filter membrane that is in the end cap. If the membrane is not
white or has a blockage, replace the membrane. Make sure that the dull side of the membrane istoward the incoming air flow.
6. Put new desiccant beads in the dryer cartridge.7. Put the end cap on the dryer cartridge and turn to install.8. Push the dryer cartridge back in the clip.
Remove the moisture from the desiccant (optional)To use pink desiccant beads again, remove the moisture from the desiccant beads.
1. Remove the desiccant beads from the dryer cartridge.2. Put the beads in an oven at 100 to 180 °C (212 to 350 °F) until the beads are blue again. If the
beads do not turn blue, discard the beads.3. Let the beads become cool.4. Put the beads in the dryer cartridge or in an air-tight container.
Troubleshooting
GeneralProblem Possible cause Solution
Instrument does not startwith AC power
There is a blown fuse or acircuit breaker problem.
Make sure that there is power to the electricaloutlet. Connect a power supply.
Instrument does not startwith DC power
There is a blown fuse or thebattery power level is too low.
Make sure that the battery is supplied by themanufacturer. Replace the battery with a fullycharged battery or connect to an AC powerconverter.
Short battery life The voltage range is notsufficient.
Make sure that the gel cell or nickel cadmiumbattery voltage is 12.6 to 13.4 VDC when at fullcharge.
The battery power level fallsquickly.
Apply a charger to the battery until the battery is atfull charge. Wait 1 hour, then measure the batteryvoltage. Replace the battery if the voltage is lessthan 12 to 12.5 VDC within 1 hour. Refer to Batteries on page 54 for tips to increase thebattery life.
The modem is operating. Identify if the unit uses a modem. Supplyinstruments that have an internal modem with ACpower.
English 41
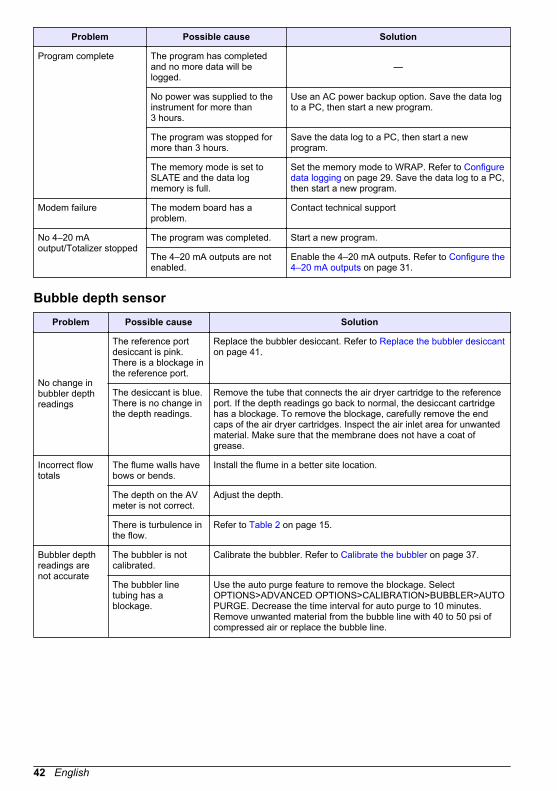
Problem Possible cause Solution
Program complete The program has completedand no more data will belogged.
—
No power was supplied to theinstrument for more than3 hours.
Use an AC power backup option. Save the data logto a PC, then start a new program.
The program was stopped formore than 3 hours.
Save the data log to a PC, then start a newprogram.
The memory mode is set toSLATE and the data logmemory is full.
Set the memory mode to WRAP. Refer to Configuredata logging on page 29. Save the data log to a PC,then start a new program.
Modem failure The modem board has aproblem.
Contact technical support
No 4–20 mAoutput/Totalizer stopped
The program was completed. Start a new program.
The 4–20 mA outputs are notenabled.
Enable the 4–20 mA outputs. Refer to Configure the4–20 mA outputs on page 31.
Bubble depth sensorProblem Possible cause Solution
No change inbubbler depthreadings
The reference portdesiccant is pink.There is a blockage inthe reference port.
Replace the bubbler desiccant. Refer to Replace the bubbler desiccanton page 41.
The desiccant is blue.There is no change inthe depth readings.
Remove the tube that connects the air dryer cartridge to the referenceport. If the depth readings go back to normal, the desiccant cartridgehas a blockage. To remove the blockage, carefully remove the endcaps of the air dryer cartridges. Inspect the air inlet area for unwantedmaterial. Make sure that the membrane does not have a coat ofgrease.
Incorrect flowtotals
The flume walls havebows or bends.
Install the flume in a better site location.
The depth on the AVmeter is not correct.
Adjust the depth.
There is turbulence inthe flow.
Refer to Table 2 on page 15.
Bubbler depthreadings arenot accurate
The bubbler is notcalibrated.
Calibrate the bubbler. Refer to Calibrate the bubbler on page 37.
The bubbler linetubing has ablockage.
Use the auto purge feature to remove the blockage. SelectOPTIONS>ADVANCED OPTIONS>CALIBRATION>BUBBLER>AUTOPURGE. Decrease the time interval for auto purge to 10 minutes.Remove unwanted material from the bubble line with 40 to 50 psi ofcompressed air or replace the bubble line.
42 English
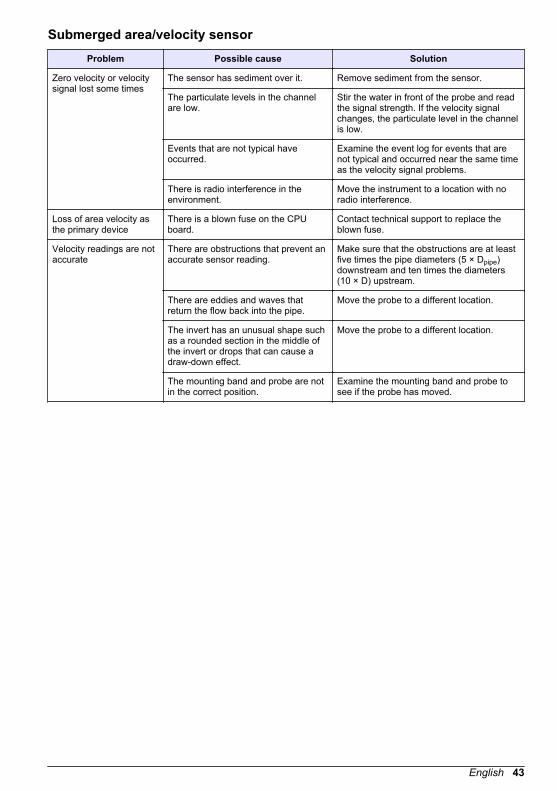
Submerged area/velocity sensorProblem Possible cause Solution
Zero velocity or velocitysignal lost some times
The sensor has sediment over it. Remove sediment from the sensor.
The particulate levels in the channelare low.
Stir the water in front of the probe and readthe signal strength. If the velocity signalchanges, the particulate level in the channelis low.
Events that are not typical haveoccurred.
Examine the event log for events that arenot typical and occurred near the same timeas the velocity signal problems.
There is radio interference in theenvironment.
Move the instrument to a location with noradio interference.
Loss of area velocity asthe primary device
There is a blown fuse on the CPUboard.
Contact technical support to replace theblown fuse.
Velocity readings are notaccurate
There are obstructions that prevent anaccurate sensor reading.
Make sure that the obstructions are at leastfive times the pipe diameters (5 × Dpipe)downstream and ten times the diameters(10 × D) upstream.
There are eddies and waves thatreturn the flow back into the pipe.
Move the probe to a different location.
The invert has an unusual shape suchas a rounded section in the middle ofthe invert or drops that can cause adraw-down effect.
Move the probe to a different location.
The mounting band and probe are notin the correct position.
Examine the mounting band and probe tosee if the probe has moved.
English 43
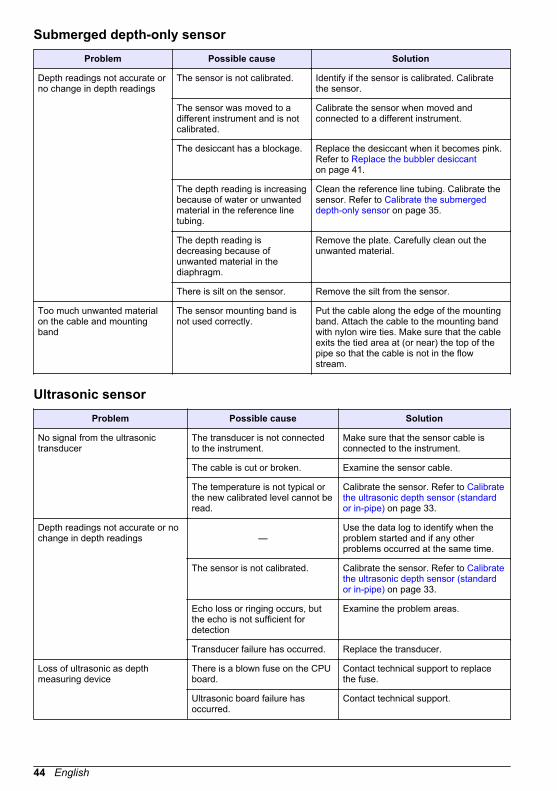
Submerged depth-only sensorProblem Possible cause Solution
Depth readings not accurate orno change in depth readings
The sensor is not calibrated. Identify if the sensor is calibrated. Calibratethe sensor.
The sensor was moved to adifferent instrument and is notcalibrated.
Calibrate the sensor when moved andconnected to a different instrument.
The desiccant has a blockage. Replace the desiccant when it becomes pink.Refer to Replace the bubbler desiccanton page 41.
The depth reading is increasingbecause of water or unwantedmaterial in the reference linetubing.
Clean the reference line tubing. Calibrate thesensor. Refer to Calibrate the submergeddepth-only sensor on page 35.
The depth reading isdecreasing because ofunwanted material in thediaphragm.
Remove the plate. Carefully clean out theunwanted material.
There is silt on the sensor. Remove the silt from the sensor.
Too much unwanted materialon the cable and mountingband
The sensor mounting band isnot used correctly.
Put the cable along the edge of the mountingband. Attach the cable to the mounting bandwith nylon wire ties. Make sure that the cableexits the tied area at (or near) the top of thepipe so that the cable is not in the flowstream.
Ultrasonic sensorProblem Possible cause Solution
No signal from the ultrasonictransducer
The transducer is not connectedto the instrument.
Make sure that the sensor cable isconnected to the instrument.
The cable is cut or broken. Examine the sensor cable.
The temperature is not typical orthe new calibrated level cannot beread.
Calibrate the sensor. Refer to Calibratethe ultrasonic depth sensor (standardor in-pipe) on page 33.
Depth readings not accurate or nochange in depth readings —
Use the data log to identify when theproblem started and if any otherproblems occurred at the same time.
The sensor is not calibrated. Calibrate the sensor. Refer to Calibratethe ultrasonic depth sensor (standardor in-pipe) on page 33.
Echo loss or ringing occurs, butthe echo is not sufficient fordetection
Examine the problem areas.
Transducer failure has occurred. Replace the transducer.
Loss of ultrasonic as depthmeasuring device
There is a blown fuse on the CPUboard.
Contact technical support to replacethe fuse.
Ultrasonic board failure hasoccurred.
Contact technical support.
44 English
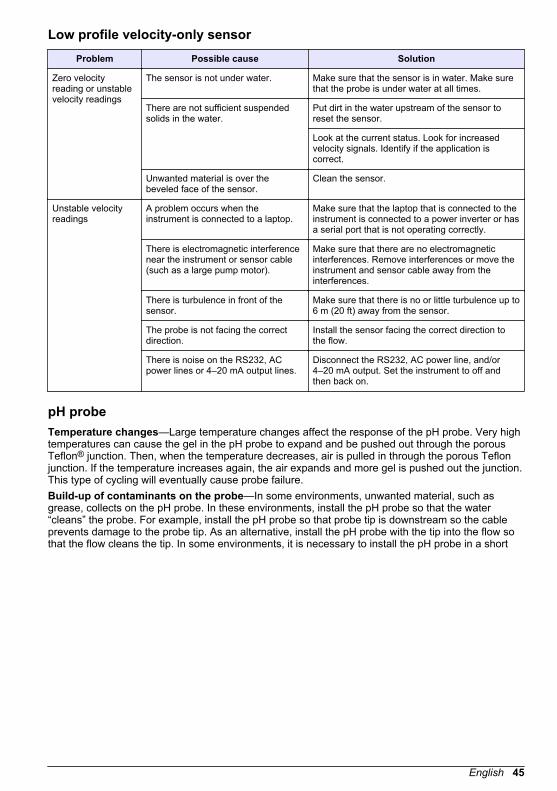
Low profile velocity-only sensorProblem Possible cause Solution
Zero velocityreading or unstablevelocity readings
The sensor is not under water. Make sure that the sensor is in water. Make surethat the probe is under water at all times.
There are not sufficient suspendedsolids in the water.
Put dirt in the water upstream of the sensor toreset the sensor.
Look at the current status. Look for increasedvelocity signals. Identify if the application iscorrect.
Unwanted material is over thebeveled face of the sensor.
Clean the sensor.
Unstable velocityreadings
A problem occurs when theinstrument is connected to a laptop.
Make sure that the laptop that is connected to theinstrument is connected to a power inverter or hasa serial port that is not operating correctly.
There is electromagnetic interferencenear the instrument or sensor cable(such as a large pump motor).
Make sure that there are no electromagneticinterferences. Remove interferences or move theinstrument and sensor cable away from theinterferences.
There is turbulence in front of thesensor.
Make sure that there is no or little turbulence up to6 m (20 ft) away from the sensor.
The probe is not facing the correctdirection.
Install the sensor facing the correct direction tothe flow.
There is noise on the RS232, ACpower lines or 4–20 mA output lines.
Disconnect the RS232, AC power line, and/or4–20 mA output. Set the instrument to off andthen back on.
pH probeTemperature changes—Large temperature changes affect the response of the pH probe. Very hightemperatures can cause the gel in the pH probe to expand and be pushed out through the porousTeflon® junction. Then, when the temperature decreases, air is pulled in through the porous Teflonjunction. If the temperature increases again, the air expands and more gel is pushed out the junction.This type of cycling will eventually cause probe failure.Build-up of contaminants on the probe—In some environments, unwanted material, such asgrease, collects on the pH probe. In these environments, install the pH probe so that the water“cleans” the probe. For example, install the pH probe so that probe tip is downstream so the cableprevents damage to the probe tip. As an alternative, install the pH probe with the tip into the flow sothat the flow cleans the tip. In some environments, it is necessary to install the pH probe in a short
English 45
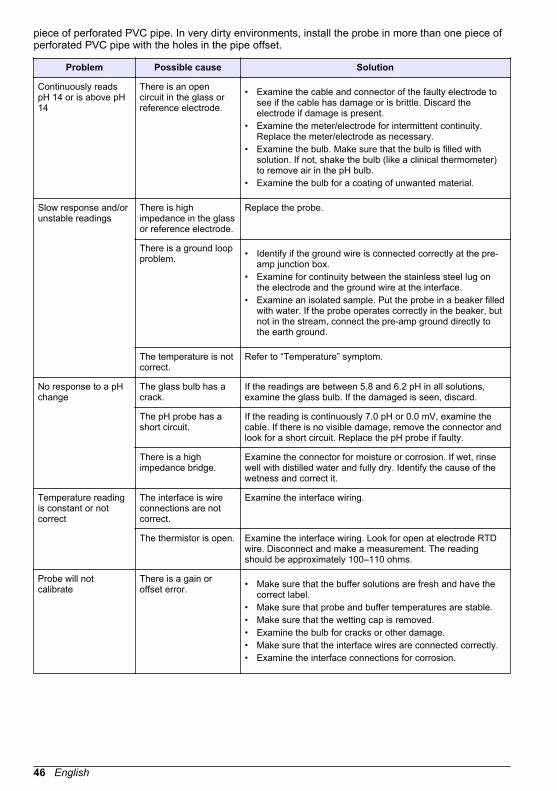
piece of perforated PVC pipe. In very dirty environments, install the probe in more than one piece ofperforated PVC pipe with the holes in the pipe offset.
Problem Possible cause Solution
Continuously readspH 14 or is above pH14
There is an opencircuit in the glass orreference electrode.
• Examine the cable and connector of the faulty electrode tosee if the cable has damage or is brittle. Discard theelectrode if damage is present.
• Examine the meter/electrode for intermittent continuity.Replace the meter/electrode as necessary.
• Examine the bulb. Make sure that the bulb is filled withsolution. If not, shake the bulb (like a clinical thermometer)to remove air in the pH bulb.
• Examine the bulb for a coating of unwanted material.
Slow response and/orunstable readings
There is highimpedance in the glassor reference electrode.
Replace the probe.
There is a ground loopproblem. • Identify if the ground wire is connected correctly at the pre-
amp junction box.• Examine for continuity between the stainless steel lug on
the electrode and the ground wire at the interface.• Examine an isolated sample. Put the probe in a beaker filled
with water. If the probe operates correctly in the beaker, butnot in the stream, connect the pre-amp ground directly tothe earth ground.
The temperature is notcorrect.
Refer to “Temperature” symptom.
No response to a pHchange
The glass bulb has acrack.
If the readings are between 5.8 and 6.2 pH in all solutions,examine the glass bulb. If the damaged is seen, discard.
The pH probe has ashort circuit.
If the reading is continuously 7.0 pH or 0.0 mV, examine thecable. If there is no visible damage, remove the connector andlook for a short circuit. Replace the pH probe if faulty.
There is a highimpedance bridge.
Examine the connector for moisture or corrosion. If wet, rinsewell with distilled water and fully dry. Identify the cause of thewetness and correct it.
Temperature readingis constant or notcorrect
The interface is wireconnections are notcorrect.
Examine the interface wiring.
The thermistor is open. Examine the interface wiring. Look for open at electrode RTDwire. Disconnect and make a measurement. The readingshould be approximately 100–110 ohms.
Probe will notcalibrate
There is a gain oroffset error. • Make sure that the buffer solutions are fresh and have the
correct label.• Make sure that probe and buffer temperatures are stable.• Make sure that the wetting cap is removed.• Examine the bulb for cracks or other damage.• Make sure that the interface wires are connected correctly.• Examine the interface connections for corrosion.
46 English
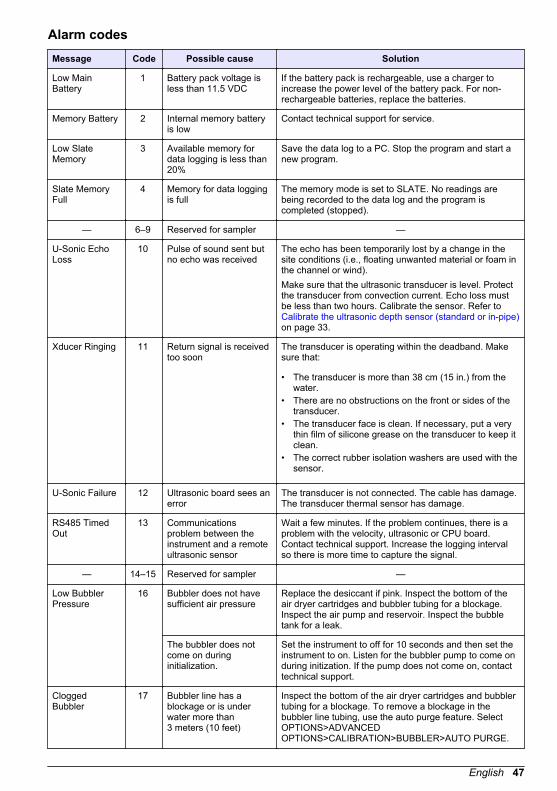
Alarm codesMessage Code Possible cause Solution
Low MainBattery
1 Battery pack voltage isless than 11.5 VDC
If the battery pack is rechargeable, use a charger toincrease the power level of the battery pack. For non-rechargeable batteries, replace the batteries.
Memory Battery 2 Internal memory batteryis low
Contact technical support for service.
Low SlateMemory
3 Available memory fordata logging is less than20%
Save the data log to a PC. Stop the program and start anew program.
Slate MemoryFull
4 Memory for data loggingis full
The memory mode is set to SLATE. No readings arebeing recorded to the data log and the program iscompleted (stopped).
— 6–9 Reserved for sampler —
U-Sonic EchoLoss
10 Pulse of sound sent butno echo was received
The echo has been temporarily lost by a change in thesite conditions (i.e., floating unwanted material or foam inthe channel or wind).Make sure that the ultrasonic transducer is level. Protectthe transducer from convection current. Echo loss mustbe less than two hours. Calibrate the sensor. Refer to Calibrate the ultrasonic depth sensor (standard or in-pipe)on page 33.
Xducer Ringing 11 Return signal is receivedtoo soon
The transducer is operating within the deadband. Makesure that:
• The transducer is more than 38 cm (15 in.) from thewater.
• There are no obstructions on the front or sides of thetransducer.
• The transducer face is clean. If necessary, put a verythin film of silicone grease on the transducer to keep itclean.
• The correct rubber isolation washers are used with thesensor.
U-Sonic Failure 12 Ultrasonic board sees anerror
The transducer is not connected. The cable has damage.The transducer thermal sensor has damage.
RS485 TimedOut
13 Communicationsproblem between theinstrument and a remoteultrasonic sensor
Wait a few minutes. If the problem continues, there is aproblem with the velocity, ultrasonic or CPU board.Contact technical support. Increase the logging intervalso there is more time to capture the signal.
— 14–15 Reserved for sampler —
Low BubblerPressure
16 Bubbler does not havesufficient air pressure
Replace the desiccant if pink. Inspect the bottom of theair dryer cartridges and bubbler tubing for a blockage.Inspect the air pump and reservoir. Inspect the bubbletank for a leak.
The bubbler does notcome on duringinitialization.
Set the instrument to off for 10 seconds and then set theinstrument to on. Listen for the bubbler pump to come onduring initization. If the pump does not come on, contacttechnical support.
CloggedBubbler
17 Bubbler line has ablockage or is underwater more than3 meters (10 feet)
Inspect the bottom of the air dryer cartridges and bubblertubing for a blockage. To remove a blockage in thebubbler line tubing, use the auto purge feature. SelectOPTIONS>ADVANCEDOPTIONS>CALIBRATION>BUBBLER>AUTO PURGE.
English 47
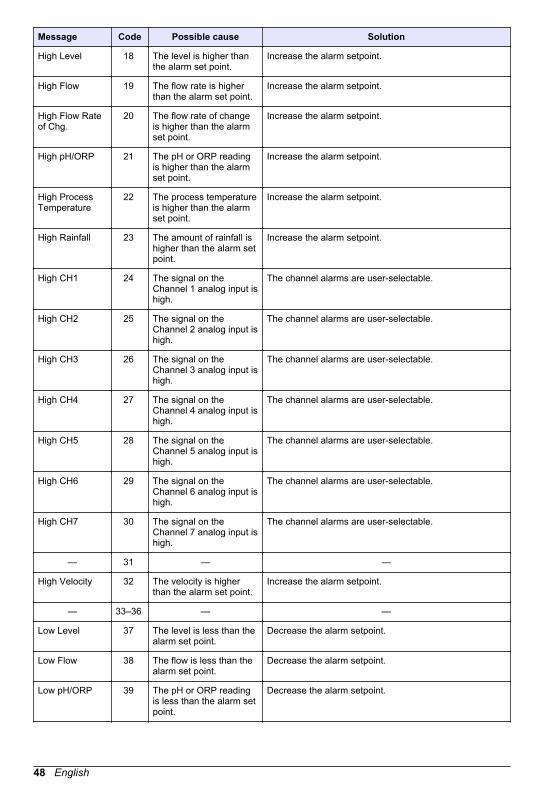
Message Code Possible cause Solution
High Level 18 The level is higher thanthe alarm set point.
Increase the alarm setpoint.
High Flow 19 The flow rate is higherthan the alarm set point.
Increase the alarm setpoint.
High Flow Rateof Chg.
20 The flow rate of changeis higher than the alarmset point.
Increase the alarm setpoint.
High pH/ORP 21 The pH or ORP readingis higher than the alarmset point.
Increase the alarm setpoint.
High ProcessTemperature
22 The process temperatureis higher than the alarmset point.
Increase the alarm setpoint.
High Rainfall 23 The amount of rainfall ishigher than the alarm setpoint.
Increase the alarm setpoint.
High CH1 24 The signal on theChannel 1 analog input ishigh.
The channel alarms are user-selectable.
High CH2 25 The signal on theChannel 2 analog input ishigh.
The channel alarms are user-selectable.
High CH3 26 The signal on theChannel 3 analog input ishigh.
The channel alarms are user-selectable.
High CH4 27 The signal on theChannel 4 analog input ishigh.
The channel alarms are user-selectable.
High CH5 28 The signal on theChannel 5 analog input ishigh.
The channel alarms are user-selectable.
High CH6 29 The signal on theChannel 6 analog input ishigh.
The channel alarms are user-selectable.
High CH7 30 The signal on theChannel 7 analog input ishigh.
The channel alarms are user-selectable.
— 31 — —
High Velocity 32 The velocity is higherthan the alarm set point.
Increase the alarm setpoint.
— 33–36 — —
Low Level 37 The level is less than thealarm set point.
Decrease the alarm setpoint.
Low Flow 38 The flow is less than thealarm set point.
Decrease the alarm setpoint.
Low pH/ORP 39 The pH or ORP readingis less than the alarm setpoint.
Decrease the alarm setpoint.
48 English
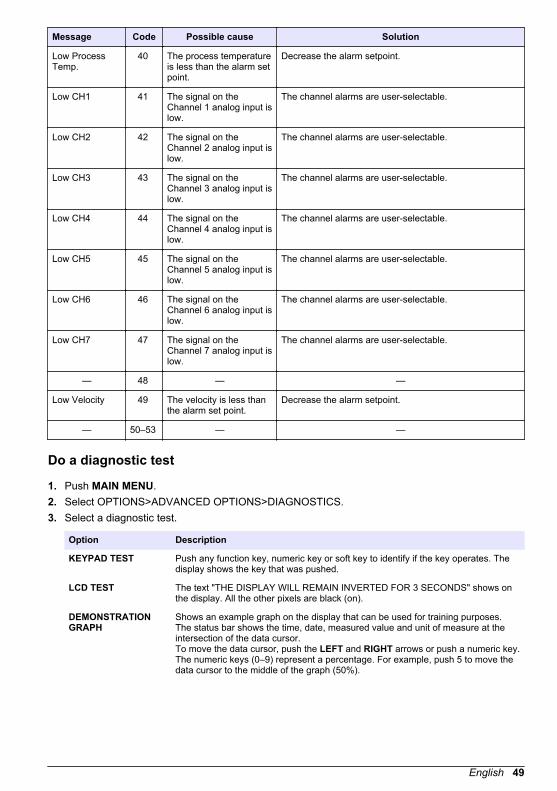
Message Code Possible cause Solution
Low ProcessTemp.
40 The process temperatureis less than the alarm setpoint.
Decrease the alarm setpoint.
Low CH1 41 The signal on theChannel 1 analog input islow.
The channel alarms are user-selectable.
Low CH2 42 The signal on theChannel 2 analog input islow.
The channel alarms are user-selectable.
Low CH3 43 The signal on theChannel 3 analog input islow.
The channel alarms are user-selectable.
Low CH4 44 The signal on theChannel 4 analog input islow.
The channel alarms are user-selectable.
Low CH5 45 The signal on theChannel 5 analog input islow.
The channel alarms are user-selectable.
Low CH6 46 The signal on theChannel 6 analog input islow.
The channel alarms are user-selectable.
Low CH7 47 The signal on theChannel 7 analog input islow.
The channel alarms are user-selectable.
— 48 — —
Low Velocity 49 The velocity is less thanthe alarm set point.
Decrease the alarm setpoint.
— 50–53 — —
Do a diagnostic test
1. Push MAIN MENU.2. Select OPTIONS>ADVANCED OPTIONS>DIAGNOSTICS.3. Select a diagnostic test.
Option Description
KEYPAD TEST Push any function key, numeric key or soft key to identify if the key operates. Thedisplay shows the key that was pushed.
LCD TEST The text "THE DISPLAY WILL REMAIN INVERTED FOR 3 SECONDS" shows onthe display. All the other pixels are black (on).
DEMONSTRATIONGRAPH
Shows an example graph on the display that can be used for training purposes.The status bar shows the time, date, measured value and unit of measure at theintersection of the data cursor.To move the data cursor, push the LEFT and RIGHT arrows or push a numeric key.The numeric keys (0–9) represent a percentage. For example, push 5 to move thedata cursor to the middle of the graph (50%).
English 49
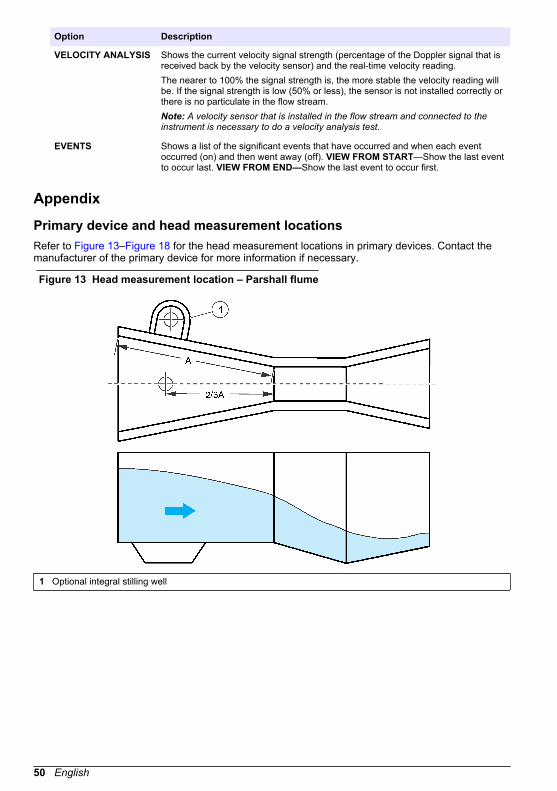
Option Description
VELOCITY ANALYSIS Shows the current velocity signal strength (percentage of the Doppler signal that isreceived back by the velocity sensor) and the real-time velocity reading.The nearer to 100% the signal strength is, the more stable the velocity reading willbe. If the signal strength is low (50% or less), the sensor is not installed correctly orthere is no particulate in the flow stream.Note: A velocity sensor that is installed in the flow stream and connected to theinstrument is necessary to do a velocity analysis test.
EVENTS Shows a list of the significant events that have occurred and when each eventoccurred (on) and then went away (off). VIEW FROM START—Show the last eventto occur last. VIEW FROM END—Show the last event to occur first.
Appendix
Primary device and head measurement locationsRefer to Figure 13–Figure 18 for the head measurement locations in primary devices. Contact themanufacturer of the primary device for more information if necessary.
Figure 13 Head measurement location – Parshall flume
1 Optional integral stilling well
50 English
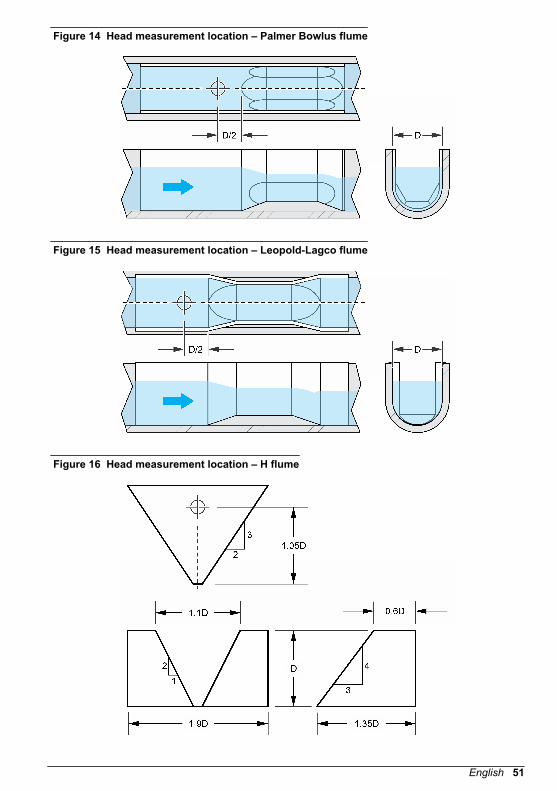
Figure 14 Head measurement location – Palmer Bowlus flume
Figure 15 Head measurement location – Leopold-Lagco flume
Figure 16 Head measurement location – H flume
English 51
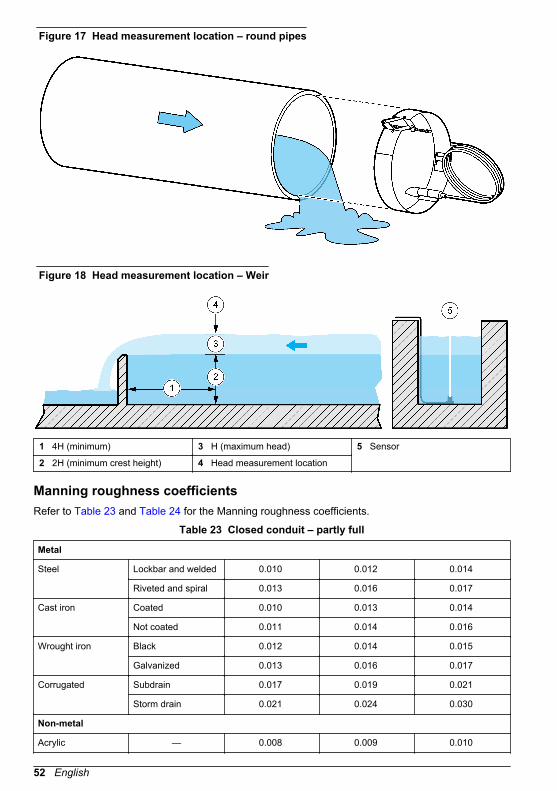
Figure 17 Head measurement location – round pipes
Figure 18 Head measurement location – Weir
1 4H (minimum) 3 H (maximum head) 5 Sensor
2 2H (minimum crest height) 4 Head measurement location
Manning roughness coefficientsRefer to Table 23 and Table 24 for the Manning roughness coefficients.
Table 23 Closed conduit – partly full
Metal
Steel Lockbar and welded 0.010 0.012 0.014
Riveted and spiral 0.013 0.016 0.017
Cast iron Coated 0.010 0.013 0.014
Not coated 0.011 0.014 0.016
Wrought iron Black 0.012 0.014 0.015
Galvanized 0.013 0.016 0.017
Corrugated Subdrain 0.017 0.019 0.021
Storm drain 0.021 0.024 0.030
Non-metal
Acrylic — 0.008 0.009 0.010
52 English
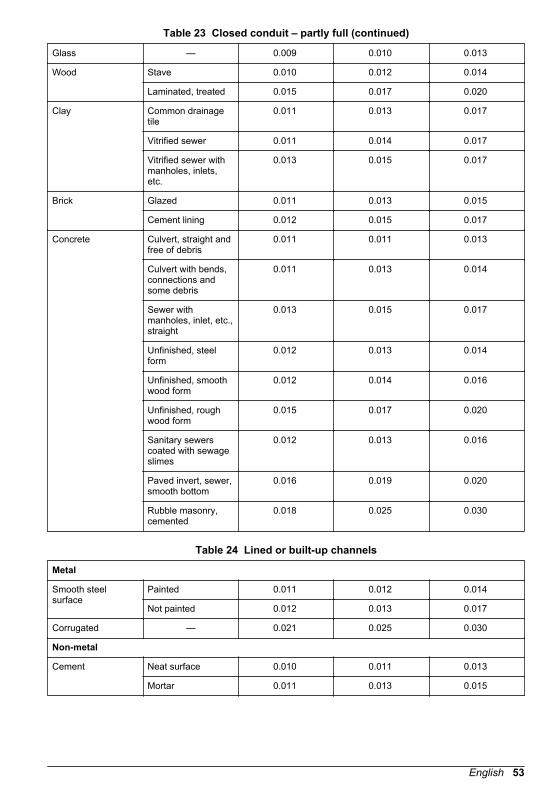
Table 23 Closed conduit – partly full (continued)
Glass — 0.009 0.010 0.013
Wood Stave 0.010 0.012 0.014
Laminated, treated 0.015 0.017 0.020
Clay Common drainagetile
0.011 0.013 0.017
Vitrified sewer 0.011 0.014 0.017
Vitrified sewer withmanholes, inlets,etc.
0.013 0.015 0.017
Brick Glazed 0.011 0.013 0.015
Cement lining 0.012 0.015 0.017
Concrete Culvert, straight andfree of debris
0.011 0.011 0.013
Culvert with bends,connections andsome debris
0.011 0.013 0.014
Sewer withmanholes, inlet, etc.,straight
0.013 0.015 0.017
Unfinished, steelform
0.012 0.013 0.014
Unfinished, smoothwood form
0.012 0.014 0.016
Unfinished, roughwood form
0.015 0.017 0.020
Sanitary sewerscoated with sewageslimes
0.012 0.013 0.016
Paved invert, sewer,smooth bottom
0.016 0.019 0.020
Rubble masonry,cemented
0.018 0.025 0.030
Table 24 Lined or built-up channels
Metal
Smooth steelsurface
Painted 0.011 0.012 0.014
Not painted 0.012 0.013 0.017
Corrugated — 0.021 0.025 0.030
Non-metal
Cement Neat surface 0.010 0.011 0.013
Mortar 0.011 0.013 0.015
English 53
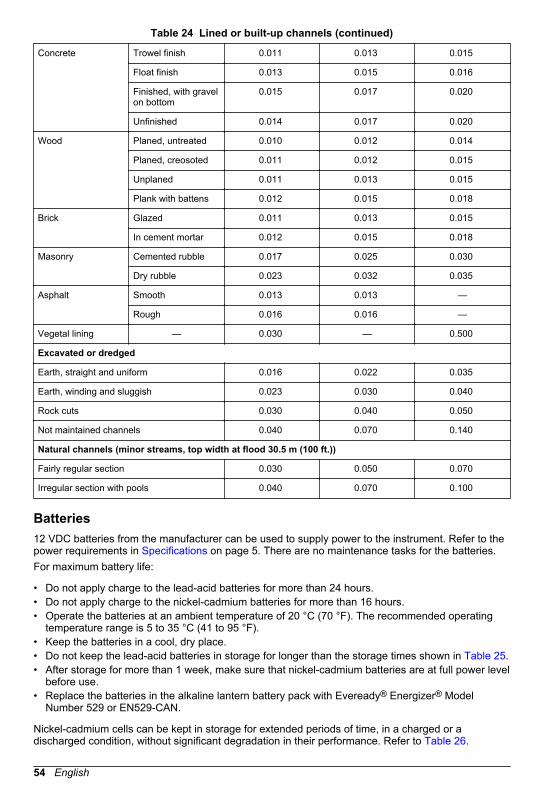
Table 24 Lined or built-up channels (continued)
Concrete Trowel finish 0.011 0.013 0.015
Float finish 0.013 0.015 0.016
Finished, with gravelon bottom
0.015 0.017 0.020
Unfinished 0.014 0.017 0.020
Wood Planed, untreated 0.010 0.012 0.014
Planed, creosoted 0.011 0.012 0.015
Unplaned 0.011 0.013 0.015
Plank with battens 0.012 0.015 0.018
Brick Glazed 0.011 0.013 0.015
In cement mortar 0.012 0.015 0.018
Masonry Cemented rubble 0.017 0.025 0.030
Dry rubble 0.023 0.032 0.035
Asphalt Smooth 0.013 0.013 —
Rough 0.016 0.016 —
Vegetal lining — 0.030 — 0.500
Excavated or dredged
Earth, straight and uniform 0.016 0.022 0.035
Earth, winding and sluggish 0.023 0.030 0.040
Rock cuts 0.030 0.040 0.050
Not maintained channels 0.040 0.070 0.140
Natural channels (minor streams, top width at flood 30.5 m (100 ft.))
Fairly regular section 0.030 0.050 0.070
Irregular section with pools 0.040 0.070 0.100
Batteries12 VDC batteries from the manufacturer can be used to supply power to the instrument. Refer to thepower requirements in Specifications on page 5. There are no maintenance tasks for the batteries.For maximum battery life:
• Do not apply charge to the lead-acid batteries for more than 24 hours.• Do not apply charge to the nickel-cadmium batteries for more than 16 hours.• Operate the batteries at an ambient temperature of 20 °C (70 °F). The recommended operating
temperature range is 5 to 35 °C (41 to 95 °F).• Keep the batteries in a cool, dry place.• Do not keep the lead-acid batteries in storage for longer than the storage times shown in Table 25.• After storage for more than 1 week, make sure that nickel-cadmium batteries are at full power level
before use.• Replace the batteries in the alkaline lantern battery pack with Eveready® Energizer® Model
Number 529 or EN529-CAN.
Nickel-cadmium cells can be kept in storage for extended periods of time, in a charged or adischarged condition, without significant degradation in their performance. Refer to Table 26.
54 English

Note: At room temperature, the self-discharge rate of nickel-cadmium batteries can be as high as 2% per day.When charged cells have been in storage for a long period of time, or at an elevated temperature, a change startsin the negative electrode. The structure changes so that it is less reactive than a fresh cell. This structure will goback to normal after one or two charge/discharge cycles.
Table 25 Storage time for a lead-acid battery
Storage temperature Storage time (maximum)
0 to 20 °C 12 months
21 to 30 °C 9 months
31 to 40 °C 5 months
41 to 50 °C 2.5 months
Table 26 Storage time for a nickel-cadmium battery
Storage temperature Storage time (maximum)
20 to 30 °C 9 months
30 to 40 °C 5 months
over 40 °C 3 months
SCADA-Modbus® system guidelinesIntroduction to SCADA-Modbus communicationsRefer to these guidelines when Modbus ASCII protocol is used to communicate directly with thisinstrument through an RS232 or modem connection. A working knowledge of SCADA (supervisorycontrol and data acquisition), SCADA components and the different topologies used to build thecommunications network are necessary. A basic understanding of the Modbus ASCII protocol isnecessary, so a description of the key parts of the protocol is supplied.This section includes the setup process, but does not supply specific implementation details of anyparticular MMI (man machine interface) or controller. However, the examples may reference somemanufacturers for illustrative purposes. The description of the Modbus ASCII protocol is suppied forreference only and is not a tutorial. This section only supplies the description of Modbus ASCII forthis instrument.Modbus, an open protocol, identifies how each instrument knows its device address, recognizes amessage sent to it, identifies the type of action to be taken and extracts any data or other informationcontained in the message. This instrument and MMI communicate with a master-slave technique inwhich only the master can initiate queries to a slave (950). The 950 will always be considered theslave, never a master.The master communicate with individual instruments or can send a message to the instrumentswithin its scope. Responses are never returned to broadcast queries from the master. The Modbusprotocol gives the format for the query of the master. The Modbus protocol puts the format of thequery in the device address, a function code that identifies the requested action, any data to be sentand an error-checking field. The response message of the instrument is made with the Modbusformat which confirms the action to be done, any data to be returned and an error checking field.
ASCII transmission modeThis instrument communicates on standard Modbus networks with Modbus ASCII. In ASCII mode,messages start with a colon (:), and end with a carriage return-line feed pair. The characters that canbe transmitted for all fields are hexadecimal 0–9, and A–F. When a message is transmitted over aModbus ASCII communication link, each character or byte is sent in the order of LSB (leastsignificant bit) to MSB (most significant bit). Table 27 shows a typical message frame.
English 55
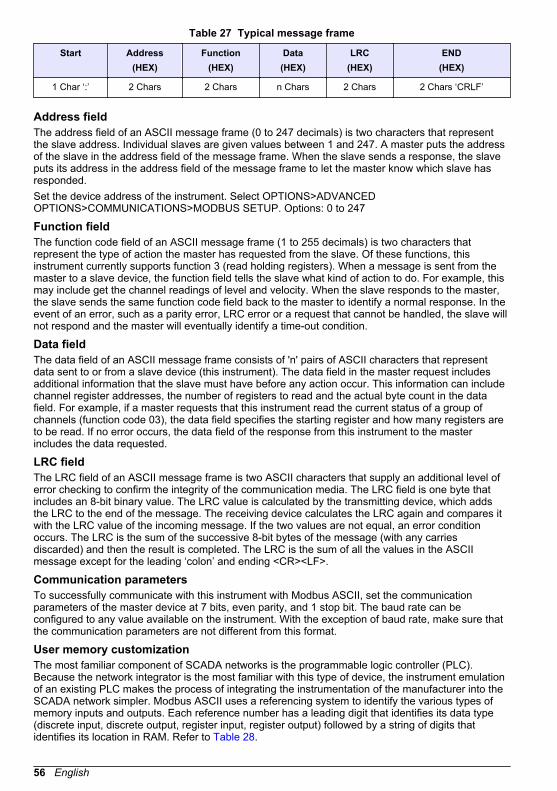
Table 27 Typical message frame
Start Address(HEX)
Function(HEX)
Data(HEX)
LRC(HEX)
END(HEX)
1 Char ‘:’ 2 Chars 2 Chars n Chars 2 Chars 2 Chars ‘CRLF’
Address fieldThe address field of an ASCII message frame (0 to 247 decimals) is two characters that representthe slave address. Individual slaves are given values between 1 and 247. A master puts the addressof the slave in the address field of the message frame. When the slave sends a response, the slaveputs its address in the address field of the message frame to let the master know which slave hasresponded.Set the device address of the instrument. Select OPTIONS>ADVANCEDOPTIONS>COMMUNICATIONS>MODBUS SETUP. Options: 0 to 247
Function fieldThe function code field of an ASCII message frame (1 to 255 decimals) is two characters thatrepresent the type of action the master has requested from the slave. Of these functions, thisinstrument currently supports function 3 (read holding registers). When a message is sent from themaster to a slave device, the function field tells the slave what kind of action to do. For example, thismay include get the channel readings of level and velocity. When the slave responds to the master,the slave sends the same function code field back to the master to identify a normal response. In theevent of an error, such as a parity error, LRC error or a request that cannot be handled, the slave willnot respond and the master will eventually identify a time-out condition.
Data fieldThe data field of an ASCII message frame consists of 'n' pairs of ASCII characters that representdata sent to or from a slave device (this instrument). The data field in the master request includesadditional information that the slave must have before any action occur. This information can includechannel register addresses, the number of registers to read and the actual byte count in the datafield. For example, if a master requests that this instrument read the current status of a group ofchannels (function code 03), the data field specifies the starting register and how many registers areto be read. If no error occurs, the data field of the response from this instrument to the masterincludes the data requested.
LRC fieldThe LRC field of an ASCII message frame is two ASCII characters that supply an additional level oferror checking to confirm the integrity of the communication media. The LRC field is one byte thatincludes an 8-bit binary value. The LRC value is calculated by the transmitting device, which addsthe LRC to the end of the message. The receiving device calculates the LRC again and compares itwith the LRC value of the incoming message. If the two values are not equal, an error conditionoccurs. The LRC is the sum of the successive 8-bit bytes of the message (with any carriesdiscarded) and then the result is completed. The LRC is the sum of all the values in the ASCIImessage except for the leading ‘colon’ and ending <CR><LF>.
Communication parametersTo successfully communicate with this instrument with Modbus ASCII, set the communicationparameters of the master device at 7 bits, even parity, and 1 stop bit. The baud rate can beconfigured to any value available on the instrument. With the exception of baud rate, make sure thatthe communication parameters are not different from this format.
User memory customizationThe most familiar component of SCADA networks is the programmable logic controller (PLC).Because the network integrator is the most familiar with this type of device, the instrument emulationof an existing PLC makes the process of integrating the instrumentation of the manufacturer into theSCADA network simpler. Modbus ASCII uses a referencing system to identify the various types ofmemory inputs and outputs. Each reference number has a leading digit that identifies its data type(discrete input, discrete output, register input, register output) followed by a string of digits thatidentifies its location in RAM. Refer to Table 28.
56 English
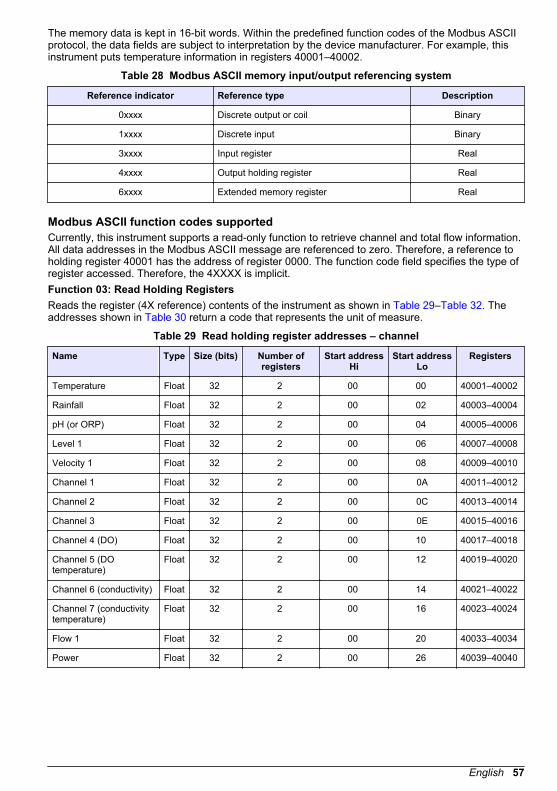
The memory data is kept in 16-bit words. Within the predefined function codes of the Modbus ASCIIprotocol, the data fields are subject to interpretation by the device manufacturer. For example, thisinstrument puts temperature information in registers 40001–40002.
Table 28 Modbus ASCII memory input/output referencing system
Reference indicator Reference type Description
0xxxx Discrete output or coil Binary
1xxxx Discrete input Binary
3xxxx Input register Real
4xxxx Output holding register Real
6xxxx Extended memory register Real
Modbus ASCII function codes supportedCurrently, this instrument supports a read-only function to retrieve channel and total flow information.All data addresses in the Modbus ASCII message are referenced to zero. Therefore, a reference toholding register 40001 has the address of register 0000. The function code field specifies the type ofregister accessed. Therefore, the 4XXXX is implicit.Function 03: Read Holding RegistersReads the register (4X reference) contents of the instrument as shown in Table 29–Table 32. Theaddresses shown in Table 30 return a code that represents the unit of measure.
Table 29 Read holding register addresses – channel
Name Type Size (bits) Number ofregisters
Start addressHi
Start addressLo
Registers
Temperature Float 32 2 00 00 40001–40002
Rainfall Float 32 2 00 02 40003–40004
pH (or ORP) Float 32 2 00 04 40005–40006
Level 1 Float 32 2 00 06 40007–40008
Velocity 1 Float 32 2 00 08 40009–40010
Channel 1 Float 32 2 00 0A 40011–40012
Channel 2 Float 32 2 00 0C 40013–40014
Channel 3 Float 32 2 00 0E 40015–40016
Channel 4 (DO) Float 32 2 00 10 40017–40018
Channel 5 (DOtemperature)
Float 32 2 00 12 40019–40020
Channel 6 (conductivity) Float 32 2 00 14 40021–40022
Channel 7 (conductivitytemperature)
Float 32 2 00 16 40023–40024
Flow 1 Float 32 2 00 20 40033–40034
Power Float 32 2 00 26 40039–40040
English 57
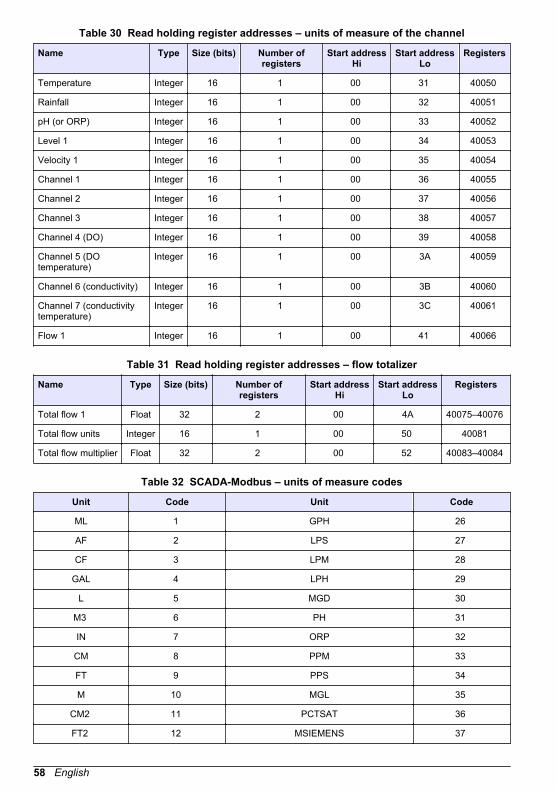
Table 30 Read holding register addresses – units of measure of the channel
Name Type Size (bits) Number ofregisters
Start addressHi
Start addressLo
Registers
Temperature Integer 16 1 00 31 40050
Rainfall Integer 16 1 00 32 40051
pH (or ORP) Integer 16 1 00 33 40052
Level 1 Integer 16 1 00 34 40053
Velocity 1 Integer 16 1 00 35 40054
Channel 1 Integer 16 1 00 36 40055
Channel 2 Integer 16 1 00 37 40056
Channel 3 Integer 16 1 00 38 40057
Channel 4 (DO) Integer 16 1 00 39 40058
Channel 5 (DOtemperature)
Integer 16 1 00 3A 40059
Channel 6 (conductivity) Integer 16 1 00 3B 40060
Channel 7 (conductivitytemperature)
Integer 16 1 00 3C 40061
Flow 1 Integer 16 1 00 41 40066
Table 31 Read holding register addresses – flow totalizer
Name Type Size (bits) Number ofregisters
Start addressHi
Start addressLo
Registers
Total flow 1 Float 32 2 00 4A 40075–40076
Total flow units Integer 16 1 00 50 40081
Total flow multiplier Float 32 2 00 52 40083–40084
Table 32 SCADA-Modbus – units of measure codes
Unit Code Unit Code
ML 1 GPH 26
AF 2 LPS 27
CF 3 LPM 28
GAL 4 LPH 29
L 5 MGD 30
M3 6 PH 31
IN 7 ORP 32
CM 8 PPM 33
FT 9 PPS 34
M 10 MGL 35
CM2 11 PCTSAT 36
FT2 12 MSIEMENS 37
58 English

Table 32 SCADA-Modbus – units of measure codes (continued)
Unit Code Unit Code
IN2 13 MICROSIEMENS 38
M2 14 GRAMSPERKG 39
AFD 15 PCTPERDEGC 40
CFS 16 DEGREE_C 41
CFM 17 DEGREE_F 42
CFH 18 MILS 43
CFD 19 VOLTS 44
CMS 20 ft/s 45
CMM 21 MPS 46
CMH 22 PCT_O2 47
CMD 23 PCT_H2S 48
GPS 24 PCT_LEL 49
GPM 25 VDC 50
QueryRefer to Table 33 for the Modbus ASCII query form that specifies the starting register and number ofregisters to be read. Refer to Table 34 for an example.The master queries this instrument with a Read Holding Registers request, which implies a 4XXXXregister reference, to slave device address 01. The message asks for data from holding registers40007–40008 to get the level information, which requires two registers to store the floating pointvalue.Note: Registers are referenced from zero in the data field.
Table 33 Modbus ASCII query format
Start':'
Slaveaddress
Function(03)
Startaddress
high
Startaddress low
Number ofpoints high
Number ofpoints low
LRC <CR> <LF>
Table 34 Channel query to read level – example
Start':'
Slaveaddress
Function(03)
Startaddress
high
Startaddress
low
Number ofregisters
high
Number ofregisters
low
LRC <CR> <LF>
: 01 03 00 06 00 02 F4 <CR> <LF>
ResponseThe instrument responds with the transmission that shows a level reading of 15.0 inches. Refer to Table 35.The instrument response is the same address and function code, which identifies that there are noproblems in the communication between the master and instrument. The ‘Byte Count’ field identifieshow many 8-bit data items are being returned in the data field. With Modbus ASCII, this is one-halfthe actual count of ASCII characters transmitted in the data portion of the response. The contents of40007 are shown as two byte values of 00 00 hex, and the contents of register 40008 are shown as
English 59
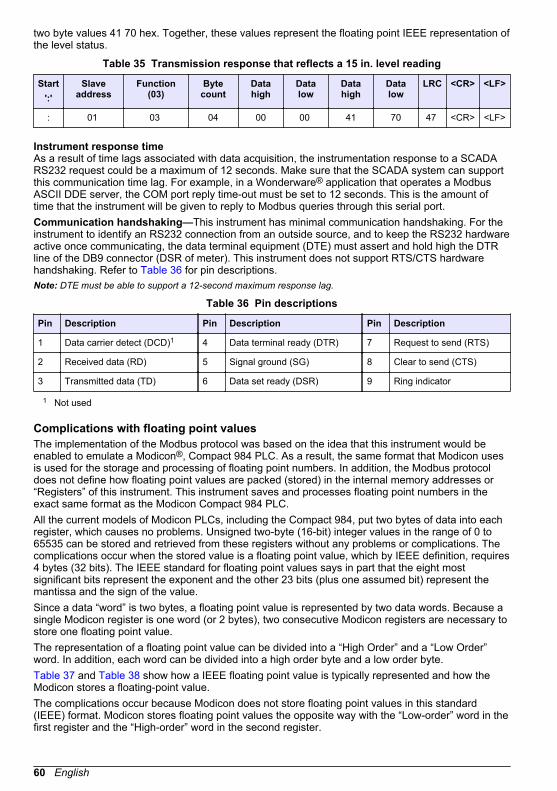
two byte values 41 70 hex. Together, these values represent the floating point IEEE representation ofthe level status.
Table 35 Transmission response that reflects a 15 in. level reading
Start':'
Slaveaddress
Function(03)
Bytecount
Datahigh
Datalow
Datahigh
Datalow
LRC <CR> <LF>
: 01 03 04 00 00 41 70 47 <CR> <LF>
Instrument response timeAs a result of time lags associated with data acquisition, the instrumentation response to a SCADARS232 request could be a maximum of 12 seconds. Make sure that the SCADA system can supportthis communication time lag. For example, in a Wonderware® application that operates a ModbusASCII DDE server, the COM port reply time-out must be set to 12 seconds. This is the amount oftime that the instrument will be given to reply to Modbus queries through this serial port.Communication handshaking—This instrument has minimal communication handshaking. For theinstrument to identify an RS232 connection from an outside source, and to keep the RS232 hardwareactive once communicating, the data terminal equipment (DTE) must assert and hold high the DTRline of the DB9 connector (DSR of meter). This instrument does not support RTS/CTS hardwarehandshaking. Refer to Table 36 for pin descriptions.Note: DTE must be able to support a 12-second maximum response lag.
Table 36 Pin descriptions
Pin Description Pin Description Pin Description
1 Data carrier detect (DCD)1 4 Data terminal ready (DTR) 7 Request to send (RTS)
2 Received data (RD) 5 Signal ground (SG) 8 Clear to send (CTS)
3 Transmitted data (TD) 6 Data set ready (DSR) 9 Ring indicator
1 Not used
Complications with floating point valuesThe implementation of the Modbus protocol was based on the idea that this instrument would beenabled to emulate a Modicon®, Compact 984 PLC. As a result, the same format that Modicon usesis used for the storage and processing of floating point numbers. In addition, the Modbus protocoldoes not define how floating point values are packed (stored) in the internal memory addresses or“Registers” of this instrument. This instrument saves and processes floating point numbers in theexact same format as the Modicon Compact 984 PLC.All the current models of Modicon PLCs, including the Compact 984, put two bytes of data into eachregister, which causes no problems. Unsigned two-byte (16-bit) integer values in the range of 0 to65535 can be stored and retrieved from these registers without any problems or complications. Thecomplications occur when the stored value is a floating point value, which by IEEE definition, requires4 bytes (32 bits). The IEEE standard for floating point values says in part that the eight mostsignificant bits represent the exponent and the other 23 bits (plus one assumed bit) represent themantissa and the sign of the value.Since a data “word” is two bytes, a floating point value is represented by two data words. Because asingle Modicon register is one word (or 2 bytes), two consecutive Modicon registers are necessary tostore one floating point value.The representation of a floating point value can be divided into a “High Order” and a “Low Order”word. In addition, each word can be divided into a high order byte and a low order byte.Table 37 and Table 38 show how a IEEE floating point value is typically represented and how theModicon stores a floating-point value.The complications occur because Modicon does not store floating point values in this standard(IEEE) format. Modicon stores floating point values the opposite way with the “Low-order” word in thefirst register and the “High-order” word in the second register.
60 English
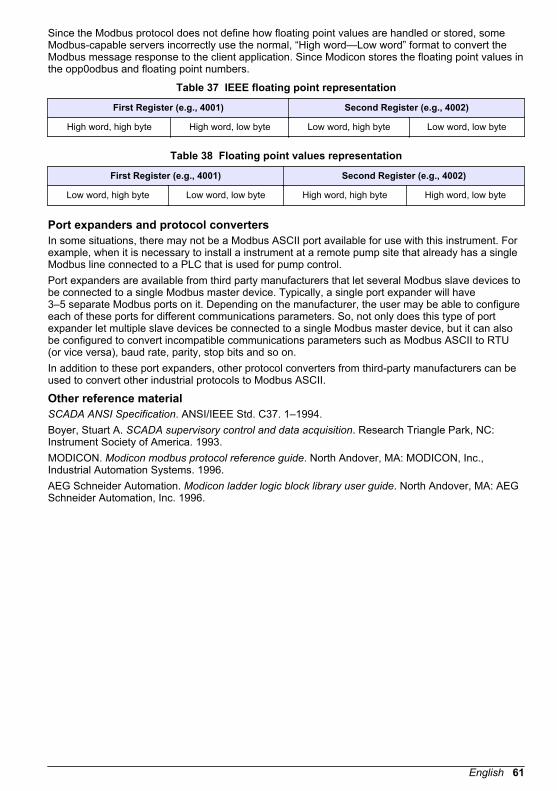
Since the Modbus protocol does not define how floating point values are handled or stored, someModbus-capable servers incorrectly use the normal, “High word—Low word” format to convert theModbus message response to the client application. Since Modicon stores the floating point values inthe opp0odbus and floating point numbers.
Table 37 IEEE floating point representation
First Register (e.g., 4001) Second Register (e.g., 4002)
High word, high byte High word, low byte Low word, high byte Low word, low byte
Table 38 Floating point values representation
First Register (e.g., 4001) Second Register (e.g., 4002)
Low word, high byte Low word, low byte High word, high byte High word, low byte
Port expanders and protocol convertersIn some situations, there may not be a Modbus ASCII port available for use with this instrument. Forexample, when it is necessary to install a instrument at a remote pump site that already has a singleModbus line connected to a PLC that is used for pump control.Port expanders are available from third party manufacturers that let several Modbus slave devices tobe connected to a single Modbus master device. Typically, a single port expander will have3–5 separate Modbus ports on it. Depending on the manufacturer, the user may be able to configureeach of these ports for different communications parameters. So, not only does this type of portexpander let multiple slave devices be connected to a single Modbus master device, but it can alsobe configured to convert incompatible communications parameters such as Modbus ASCII to RTU(or vice versa), baud rate, parity, stop bits and so on.In addition to these port expanders, other protocol converters from third-party manufacturers can beused to convert other industrial protocols to Modbus ASCII.
Other reference materialSCADA ANSI Specification. ANSI/IEEE Std. C37. 1–1994.Boyer, Stuart A. SCADA supervisory control and data acquisition. Research Triangle Park, NC:Instrument Society of America. 1993.MODICON. Modicon modbus protocol reference guide. North Andover, MA: MODICON, Inc.,Industrial Automation Systems. 1996.AEG Schneider Automation. Modicon ladder logic block library user guide. North Andover, MA: AEGSchneider Automation, Inc. 1996.
English 61
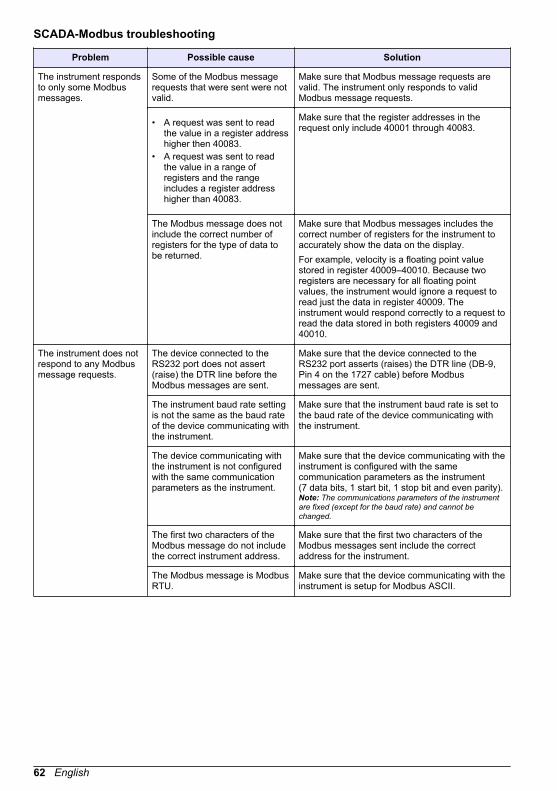
SCADA-Modbus troubleshooting
Problem Possible cause Solution
The instrument respondsto only some Modbusmessages.
Some of the Modbus messagerequests that were sent were notvalid.
Make sure that Modbus message requests arevalid. The instrument only responds to validModbus message requests.
• A request was sent to readthe value in a register addresshigher then 40083.
• A request was sent to readthe value in a range ofregisters and the rangeincludes a register addresshigher than 40083.
Make sure that the register addresses in therequest only include 40001 through 40083.
The Modbus message does notinclude the correct number ofregisters for the type of data tobe returned.
Make sure that Modbus messages includes thecorrect number of registers for the instrument toaccurately show the data on the display.For example, velocity is a floating point valuestored in register 40009–40010. Because tworegisters are necessary for all floating pointvalues, the instrument would ignore a request toread just the data in register 40009. Theinstrument would respond correctly to a request toread the data stored in both registers 40009 and40010.
The instrument does notrespond to any Modbusmessage requests.
The device connected to theRS232 port does not assert(raise) the DTR line before theModbus messages are sent.
Make sure that the device connected to theRS232 port asserts (raises) the DTR line (DB-9,Pin 4 on the 1727 cable) before Modbusmessages are sent.
The instrument baud rate settingis not the same as the baud rateof the device communicating withthe instrument.
Make sure that the instrument baud rate is set tothe baud rate of the device communicating withthe instrument.
The device communicating withthe instrument is not configuredwith the same communicationparameters as the instrument.
Make sure that the device communicating with theinstrument is configured with the samecommunication parameters as the instrument(7 data bits, 1 start bit, 1 stop bit and even parity).Note: The communications parameters of the instrumentare fixed (except for the baud rate) and cannot bechanged.
The first two characters of theModbus message do not includethe correct instrument address.
Make sure that the first two characters of theModbus messages sent include the correctaddress for the instrument.
The Modbus message is ModbusRTU.
Make sure that the device communicating with theinstrument is setup for Modbus ASCII.
62 English
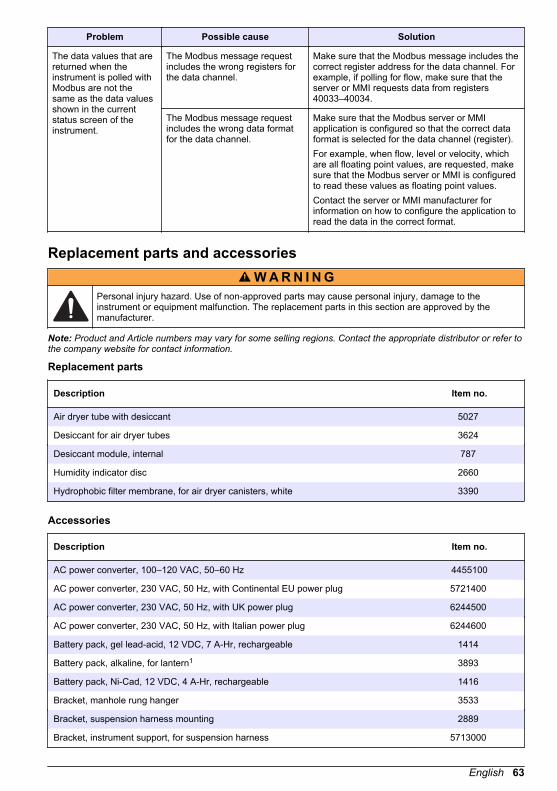
Problem Possible cause Solution
The data values that arereturned when theinstrument is polled withModbus are not thesame as the data valuesshown in the currentstatus screen of theinstrument.
The Modbus message requestincludes the wrong registers forthe data channel.
Make sure that the Modbus message includes thecorrect register address for the data channel. Forexample, if polling for flow, make sure that theserver or MMI requests data from registers40033–40034.
The Modbus message requestincludes the wrong data formatfor the data channel.
Make sure that the Modbus server or MMIapplication is configured so that the correct dataformat is selected for the data channel (register).For example, when flow, level or velocity, whichare all floating point values, are requested, makesure that the Modbus server or MMI is configuredto read these values as floating point values.Contact the server or MMI manufacturer forinformation on how to configure the application toread the data in the correct format.
Replacement parts and accessoriesW A R N I N G
Personal injury hazard. Use of non-approved parts may cause personal injury, damage to theinstrument or equipment malfunction. The replacement parts in this section are approved by themanufacturer.
Note: Product and Article numbers may vary for some selling regions. Contact the appropriate distributor or refer tothe company website for contact information.
Replacement parts
Description Item no.
Air dryer tube with desiccant 5027
Desiccant for air dryer tubes 3624
Desiccant module, internal 787
Humidity indicator disc 2660
Hydrophobic filter membrane, for air dryer canisters, white 3390
Accessories
Description Item no.
AC power converter, 100–120 VAC, 50–60 Hz 4455100
AC power converter, 230 VAC, 50 Hz, with Continental EU power plug 5721400
AC power converter, 230 VAC, 50 Hz, with UK power plug 6244500
AC power converter, 230 VAC, 50 Hz, with Italian power plug 6244600
Battery pack, gel lead-acid, 12 VDC, 7 A-Hr, rechargeable 1414
Battery pack, alkaline, for lantern1 3893
Battery pack, Ni-Cad, 12 VDC, 4 A-Hr, rechargeable 1416
Bracket, manhole rung hanger 3533
Bracket, suspension harness mounting 2889
Bracket, instrument support, for suspension harness 5713000
English 63
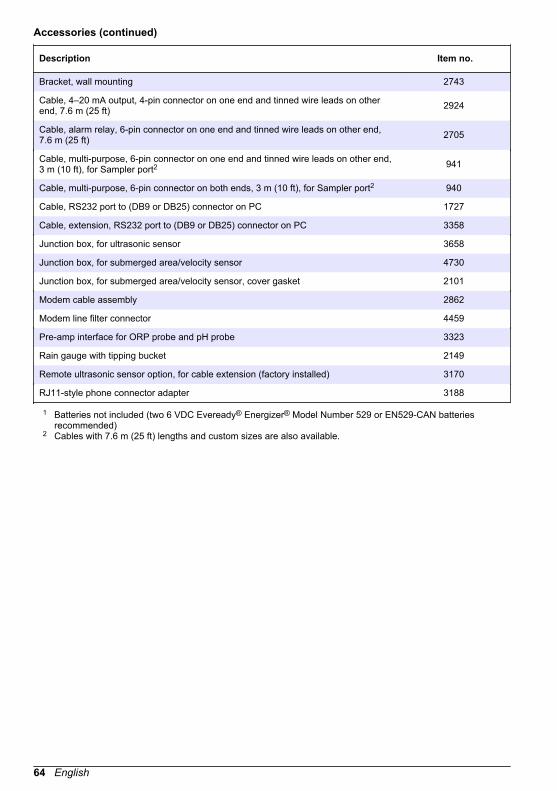
Accessories (continued)
Description Item no.
Bracket, wall mounting 2743
Cable, 4–20 mA output, 4-pin connector on one end and tinned wire leads on otherend, 7.6 m (25 ft) 2924
Cable, alarm relay, 6-pin connector on one end and tinned wire leads on other end,7.6 m (25 ft) 2705
Cable, multi-purpose, 6-pin connector on one end and tinned wire leads on other end,3 m (10 ft), for Sampler port2 941
Cable, multi-purpose, 6-pin connector on both ends, 3 m (10 ft), for Sampler port2 940
Cable, RS232 port to (DB9 or DB25) connector on PC 1727
Cable, extension, RS232 port to (DB9 or DB25) connector on PC 3358
Junction box, for ultrasonic sensor 3658
Junction box, for submerged area/velocity sensor 4730
Junction box, for submerged area/velocity sensor, cover gasket 2101
Modem cable assembly 2862
Modem line filter connector 4459
Pre-amp interface for ORP probe and pH probe 3323
Rain gauge with tipping bucket 2149
Remote ultrasonic sensor option, for cable extension (factory installed) 3170
RJ11-style phone connector adapter 3188
1 Batteries not included (two 6 VDC Eveready® Energizer® Model Number 529 or EN529-CAN batteriesrecommended)
2 Cables with 7.6 m (25 ft) lengths and custom sizes are also available.
64 English


HACH COMPANY World HeadquartersP.O. Box 389, Loveland, CO 80539-0389 U.S.A.Tel. (970) 669-3050(800) 227-4224 (U.S.A. only)Fax (970) [email protected]
HACH LANGE GMBHWillstätterstraße 11D-40549 Düsseldorf,GermanyTel +49 (0) 2 11 52 88-320 Fax +49 (0) 2 11 52 88-210 [email protected]
HACH LANGE Sàrl6, route de Compois1222 VésenazSWITZERLANDTel. +41 22 594 6400Fax +41 22 594 6499
© Hach Company/Hach Lange GmbH, 2013–2014.All rights reserved. Printed in U.S.A.