Embed Size (px)
Citation preview

User Manual
SMART INFO
The web-based part
Version: 150813
Manual code: 1.3.1
Foundation Connect International


Connect International | Table of Contents i
Table of Contents
Table of Contents i
Glossary of Terms iii
Error notifications iv
Preface v
1 Introduction 1
2 Login in SMART Info 3
3 Develop your SMART Info administration 4
3.1 Enter location types 4
3.2 Enter locations in the location hierarchy 4
3.3 Enter relation types 5
3.4 Enter organisation types 5
3.5 Enter the organization hierarchy 6
3.6 Enter contacts 6
3.7 Select product types and indicators in the Account product types 8
4 Plan a project in SMART Info 11
5 Make monitoring forms 13
6 Enter monitoring data in SMART Info 17
6.1 How to make a product ID 17
6.2 Enter QUA product data online 17
6.3 Enter QUA product data offline 20
6.4 Enter product numbers 21
7 Use of SMART Info reports 25
7.1 Use of the Project reports 25
7.1.1 Introduction 25
7.1.2 Summary report 25
7.1.3 Products report 28
7.1.4 Suppliers report 28
7.1.5 Monitors report 29
7.2 Use of the Project indicators report 29
7.3 Use of the Product details + their presentation in Google maps 29
Annex 1 Project Cycle Management (PCM) 30
Annex 2 The Logical Framework Analysis 33
A2.1 Introduction 33
A2.2 LFA – Analysis phase 37
A2.2.1 Learn about the context and identify the stakeholders 37
A2.2.2 Problem and objective tree analysis 38

ii Table of Contents | Connect International
A2.3 LFA – Selection phase 40
A2.3.1 Strategy development 40
A2.4 LFA – Planning phase 42
A2.4.1 Logframe development 42
A2.4.2 Verify the project’s design 46
A2.4.3 The theory of change 47
Annex 3 Products 51
A3.1.1 Product planning 51
Annex 4 Monitoring and evaluation 52
A4.1 Introduction 52
A4.2 Monitoring 53
A4.3 Evaluation 57
A4.3.1 Evaluation of projects 57
A4.3.2 Evaluation of organisations 59
A4.3.3 Audits 59
Annex 5 Indicators 60
A5.1 Introduction 60
A5.2 Indicator types 62
A5.2.1 Project evaluation indicators at objective level 63
A5.2.2 Project evaluation indicators at Outcome level (outcome indicators) 65
A5.2.3 Result indicators 65
A5.2.4 Finalized product evaluation indicators 65
A5.2.5 Finalized product monitoring indicators 65
A5.2.6 Product activity monitoring indicators 66
A5.3 Measuring indicators 67
Annex 6 How to introduce SMART Info 67
A6.1.1 Introduce project coordinators 68
A6.1.2 Introduce product time schedules per project 68
A6.1.3 Monthly project check in SMART Info 71
A6.1.4 Introduce project auditors 72
A6.1.5 Quarterly project check in SMART Info 72
Annex 7 Super administrator info 74
A7.1.1 Make a new product type 74
A7.1.2 Make a new indicator 74

Connect International | Glossary of Terms iii
Glossary of Terms
Term Explanation
CDO Community Development Officer. This is a staff member of the support
organization.
Customer The organization or person(s) who pay for a project, part of a project or
product
Monitor The person who does the monitoring.
Owner/user The person(s) who own and use a product. This can but does not
necessarily have to be the one or persons who pay for the product!
Example: if Connect International pays for a toilet to be built at the house
of the poor family Obama, Connect International is the financer (the
customer) while the family Obama is the owner and user of the toilet, but if
the family Obama has paid for the toilet itself it is both the customer and
the owner/user of the toilet.
PMER Planning, Monitoring, Evaluation and Reporting
PMI Product Measurement Indicator.
PNI Product Numeric Indicator. In case relevant PNI1 (the first Numeric
Indicator) is ‘The number of persons using the product’.
PQCI Product Quality Critical Indicator.
PQI Product Quality Indicator.
Project In this document where we speak of ‘project’ this can mean both a project
or a program.
PUCI Product Utilization Critical Indicator.
PUI Product Utilization Indicator.
QUA Quality, Utilization and Amounts.
SIB SMART INFO BASE – the web-based part of SMART Info
Supplier The organization or person(s) who produce and/or sell a product.

iv Error notifications | Connect International
Error notifications
Parsererror
- means you have not worked in SMART Info some time
and should login again before being able to continue
working in SMART Info.

Connect International | Preface v
Preface
SMART Info is a system for Planning, Monitoring, Evaluation and Reporting (PMER) of
projects and organizations, including things that are realized (which we call products)
and the effects and impacts of projects. A product is something realized by a project1 or
which is a spinoff (indirect result or outcome) of a project. Examples of products are: a
school building, a borehole with a hand pump, but it can for instance also be a completed
training course, a manual or even a management quarter. A product activity is an activity
necessary for the realization of a product. To realize a specific product usually several
activities are required.
PMER is important because you want to:
- P (Planning) – Plan and develop proper projects and their budgets and adapt
project planning and budgets in a proper way whenever required.
- M (Monitoring) - Know whether activities are executed properly, whether realized
products function and are used properly, and whether progress is sufficient and in
line with the expenditures.
- E (Evaluate) – Know whether project results, effects and impacts and their
sustainability are good enough and in line with the planning.
- R (Reporting) – Have documents for different stakeholders that cover the
information needed and that can easily be read and understood.
Planning is important because if it is done well the chance that a project can be
smoothly implemented in enhanced and problems and unexpected over expenditures
can be avoided.
Monitoring is important because it can and should enable us to react immediately to
signalled problems (or potential problems) and take immediate measures. Additionally
monitoring provides us the information we need as a basis for reporting about the
projects to other people such as managers, donors, authorities, etc.
By sending staff in the field with monitoring forms we ensure that people check
whether things are OK on site. Important is of course that fieldworkers fill in the
monitoring forms properly and that each time they find something which is not OK they
do act immediately with appropriate measures to solve the problem. An organization
that monitors properly and uses the monitoring information in a proper and active way
learns better and quicker and solves its problems more effectively. The result is better
projects and better reports and accountability. Beneficiaries will benefit more, donors
will be convinced about the quality of the work, and authorities will be more open and
convinced about the usefulness of the projects. This will lead to better results, better
1 Where we speak of ‘projects’ we mean both projects and programs.

vi Preface | Connect International
and more sustainable impacts, and also to more respect, trust, cooperation, and …
hopefully also more funding. An important part of any monitoring system should be to
include monitoring of the monitors, to control whether the quality and intensity of the
monitoring is sufficient (because if not, it will not yield proper information which may
even cause problems to get worse).
Evaluations are required to look back from time to time to assess whether indeed
things are going well, especially with regard to the effects and impacts of the work we
do. Basically we want to control whether our work makes sense and leads to structural
benefits that are important for the beneficiaries we wish to assist. In order to be able to
evaluate a project properly it is important to have baseline information (how was the
situation with regard to what we want to improve before the start of the project),
monitoring data (telling us exactly what has been realized, what was the quality of it
just after completion, how were things used just after completion, etc.), and effect
information (how is the situation with regard to what we want to improve at this
moment, possibly also how was it at a certain moment in between). This will allow us
the determine trends in improvement of the situation, to find out/get indications
whether and to what extent the realized output and outcomes may have
caused/contributed to the improvements (especially if combined with measurements of
and comparison with the situation in location or among beneficiaries where the project
has not been executed), and to verify whether planning and monitoring have been
done properly.
A distinction is made between internal and external evaluations. For internal
evaluations usually a standard system is used which enables the organization to control
and learn with regular intervals (of for instance one year) whether its projects really
improve the situation and whether the organization is improving itself. External
evaluations are executed by people from outside the organization. This can be done on
the request of a donor (to have an objective control of what has really been realized
and what the effects are), but may also be done on request of the involved
implementing organization itself (to learn whether an outsider comes to the same
conclusions as the organization itself with regard to its work, a sort of extra control).
With regard to PMER we usually want to know one or more of the following things:
Numbers of products realized and planned – per project we want to know how
many products of each product type have been realized. This we can then compare
with the planning to see if we are on track with the work.
Quality, Utilization and Amount (QUA) details of finalized products – for
finalized products we want to know what their quality is and how well and how
intensive they are utilized by the intended or even unintended users. We also often

Connect International | Preface vii
want to know one or more so–called ‘Amount’ details, which we divide in
‘Measurement’ details (e.g. how much water does a water point produce, how deep is
a well, etc.) and ‘Numeric’ details (e.g. number of persons using a realized water
point, amount of land irrigated with a realized water point, etc.).
Quality and progress of product activities – for products we often want to know
whether the activities that realize the products are carried out properly and what their
progress is in relation to the planning.
Planning of activities – for each project and for the internal organization we want
to plan the required activities in time in a proper and easy way so that everybody can
easily find and determine what has to be done when and by who.
Budget and expenditures per product – we want to know how much money has
been planned to be spent per project result to date and how much has been actually
spent to date. (This part will be incorporated in a next version of SMART Info).
Budget per project – we want to plan the budget for each project and be able to
adapt the budget easily if things change. (This part will be incorporated in a next
version of SMART Info).
Impact and level of success of projects and organizations– we want to know
the level of success of the projects we implement. Additionally we also want to know
the level of success of our own organization and/or other organizations, such as for
instance local companies or local NGO’s funded, trained and/or guided by us or our
partner organizations. (This part will be incorporated in a next version of SMART Info;
available in Excel).
SMART Info enables you to enter data about all the above issues in a database and get a
number of important reports out of it. SMART Info consists of the following modules:
Module
name
Explanation
BASE The web-based part of SMART Info for planning and monitoring
products in projects and reporting about the results. It covers the entry
and reporting of planning and realization data for products and product
activities.
SURVEY Excel file for entry and reporting of evaluation data (for
projects/programs, organizations, etc.).
BUDGET Excel file for developing budgets for projects/programs.
This manual covers the web-based part of SMART Info.

Connect International | Introduction 1
1 Introduction
SMART Info fits in the Project Cycle Management (PCM) method (see Annex 1) and is
based on the Logical Framework Analysis (LFA) method (see Annex 2).
In SMART Info the feature ‘product’ is important. ‘Products’ are things realized either
directly by the project itself (output products) or by parties facilitated, capacitated etc.
by the project and as such they are an indirect result of a project (outcome products).
Products are context and target group specific but are in SMART Info also standardized.
Example: a groundwater point, a latrine, a manual or a training course are ‘output
products’ if they are realized directly by a project. But they are ‘outcome products’ if they
result from parties trained, social marketed etc. by a project (e.g. a water point,
produced and sold by a company trained by a project, is an outcome product). For
further details on products see Annex 3.
Below a summary of the different features of SMART Info:
Pla
nn
ing
(p
roje
cts
with
results,
pro
duct
types,
sub-t
ypes
per
pro
ject
year)
Project X
Objective
+ strategy
Result Product Type (PT) Sub-type Year 1 Year 2 Etc.
Result 1 PT 1.1 X 21 13
PT 1.2 Y 12 45
Result 2 PT2.1 Z 8 2
PT2.2 A Etc.
Result3 Etc.
Mo
nit
orin
g
(of pro
ducts
+ t
heir indic
ato
rs p
er
pro
duct
sta
ge in
the p
roduct
libra
ry, to
whic
h o
rganiz
ations c
an a
dd
their o
wn p
roduct
types a
nd indic
ato
rs a
s w
ell)
Product type: all products that can be covered with the same indicators in each product stage.
C = Critical Indicator, NC = Non Critical indicator. A product with one or more critical indicators scoring poorly is rejected.
Evalu
ati
on
(N
orm
ative s
urv
eys for
evalu
ations,
baselines,
assessm
ents
, etc
.)
Organizations evaluate without knowledge on statistics and evaluation designs. Survey questions each have 4 standard answers going from a very poor (score 1) to a very good (score 4) situation, with the boundary between good and bad always between score 2 and 3. Surveys can be selected from survey libraries and can easily be customized to the ideas, wishes and preferences of the organizations by themselves. Summarized results can be
compared to the survey results of other organizations even if these used different survey questions (for comparisons between organizations, meta- analyses, etc.). Trends over the years are measured and reported. Below an example of a small part of the summary report generated by our organization survey module.
Topic nr
Topic
Organization survey - Scores for all respondents together
2 1 1
Phase 1 Phase 2 Phase 3
Av. %<=2 % no
answer Priority Av. %<=2
% no answer
Priority Av. %<=2 % no
answer Priority
1 Leadership - Performance Board
3,2 20,0 0,0 3,0 3,2 20,0 0,0 1,0 3,2 20,0 0,0 1,0
2 Leadership - 3,3 0,0 0,0 1,0 3,0 40,0 0,0 1,0 3,2 20,0 0,0 3,0

2 Introduction | Connect International
Performance Managers
3 Leadership - Capacity 4,0 0,0 0,0 2,0 2,5 75,0 0,0 1,0 2,5 75,0 0,0 4,0
Rep
orti
ng
of
pro
ject
mo
nit
orin
g d
ata
(g
reen is g
ood, ora
nge is in b
etw
een a
nd r
ed is b
ad)
Su
mm
ary r
ep
orts
In
dic
ato
rs r
ep
orts
Project report with scores per each indicator
of each product type involved. Within the report one can click on the score of an indicator which then provides below type of information zooming in on the involved scores per supplier and per location for that indicator.
Pro
du
ct
gen
eral
deta
il r
ep
orts

Connect International | Login in SMART Info 3
Realized products are presented in Google Earth. Clicking on a product ikon provides above information while also all product information together is presented on demand.
In the web-based part of SMART Info (from here on in this manual we refer to the web-
based part of SMART Info simply by the term ‘SMART Info’) your organization will need to
make a custom made administration. You can compare this with a financial
administration in a financial software package - the software is generic, the
administration is custom made in the generic software to fit entirely to the organization
working with it. SMART Info is generic, your organization’s administration that you will
make in it will be entirely custom made to fit your organization’s details, needs, priorities
and way of working.
2 Login in SMART Info
1. Make connection to the internet with Google Chrome (not through Explorer!).
2. In the upper bar type: http://wells.ophileon.com and click the return key.
3. If you want you can choose another language here for working with the software.
4. Login with your user name and password, click on the Login button.
5. You are now in the home screen of your SMART Info administration.

4 Develop your SMART Info administration | Connect International
3 Develop your SMART Info administration
First you will need to develop the basic administration of your organization in the system.
You can do this by following the steps described in this chapter.
3.1 Enter location types
1. Go to the admin part of SMART Info.
2. Click on ‘Location types’.
3. Enter the location types you wish to work with. Examples of location types: country,
province, region, district, city, town, Ward, village, sub-village, neighbourhood, etc.
4. IMPORTANT: make sure that you enter ‘Country’ as one of your location types! This is
needed for whenever a meta-analysis is to be done covering data from different
organizations and different countries (in such case your data will only be used after
official approval by your organization!). Is also needed in case your organisation does
or may ever work in other countries as well.
3.2 Enter locations in the location hierarchy
1. Go to the admin part of SMART Info.
2. Click on ‘Location hierarchy’.
3. Click on ‘All locations’ (it now colours blue).
4. Click on the ‘Add’ button. A blue field with ‘New item’ appears while to the right a
screen appears in which you can enter location details.
5. For location type select ‘Country’ (highest location hierarchy level) and for location
name type the name of your country. You can also fill in GPS data if you wish (though
not so relevant in case of a country). When ready click on ‘Save’.
6. Click on the name of the country you have just entered, then click on the ‘Add’ button.
Under the country name a blue field with ‘New item’ appears while in the right part
the screen for entry of location details appears again. Now enter the details of the
highest official administrative level in your country. For instance this may be ‘Province’
or ‘Region’. Example: suppose the highest administrative level in your country is the
‘Province’, you should select for location type ‘Province’ and for location details you
type the name of one province in which your organization works. You can also add
GPS data of the province although at this level this may be not so relevant. Then click

Connect International | Develop your SMART Info administration 5
on ‘Save’. In the same way enter the other provinces in which your organization
works.
7. Now do the same for the next level in your location hierarchy. For example if your
second-highest hierarchy location was ‘Province’ your third-highest location hierarchy
level may be ‘District’. Follow the same procedure as above with the difference that
each time when you start to enter a new district you first click on the name of the
province in which the district is located, then click on ‘Add’ etc.
8. Do this for each level of you location hierarchy. At the lower levels different location
types may be placed under one higher location hierarchy level. For instance under a
district you may both have towns and wards (this is a level used in Tanzania for a
group of villages), then under the towns you can place for instance neighbourhoods
while under Wards you can place villages and under villages you can place sub-
villages. It is like climbing down a ladder. At the highest step you may have a
province, then one step lower should include all the districts you work in that are part
of that province, etc.
9. IMPORTANT: you can always add new locations in the location hierarchy but you
cannot change the location hierarchy anymore once you have entered it and used it in
your data entries! For instance if you have forgotten one level you cannot add that
level anymore. So think carefully before entering the different levels and locations in
the location hierarchy and make sure to enter things correctly!
3.3 Enter relation types
1. Go to the admin part of SMART Info.
2. Click on ‘Relation types’.
3. Click on the button ‘Add relation type’.
4. Enter the name of the relation type and then click on ‘Save’. Relation types we
recommend to enter are: Supplier, Customer, Monitor, Manager, .//still to be worked
out//..
3.4 Enter organisation types
With organisation type we mean the different types of offices you have. For instance you
probably have a main office which we recommend to give it the organisation type
‘Headquarter’. You may also have other offices which you could for instance give the
organisation type ‘branch’. In this example you would have to enter two organisation
types: ‘Headquarter’ and ‘branch’. Enter the organisation types as follows:

6 Develop your SMART Info administration | Connect International
1. Go to the admin part of SMART Info.
2. Click on ‘Organisation types’.
3. You can enter the different organisation types you distinguish in your organisation by
clicking each time on the button ‘Add organisation type’ and enter the details of the
organisation type, then click on the ‘Save’ button.
3.5 Enter the organization hierarchy
1. Go to the admin part of SMART Info.
2. Click on ‘Organization hierarchy’.
3. Click once on ‘All organisations’ then click on the ‘Add’ button.
4. Enter the details of your Headquarter, then click the ‘Save’ button.
5. If you wish to enter branches of your organisation click in the list on the left of the
screen on the name of your Headquarters as you have just entered, then click on the
‘Add’ button. You see now that a new item appears at one level lower than your
Headquarter. You can enter the details of a branch, then click the ‘Save’ button.
6. Enter other branches in the same way.
7. If something went wrong you can delete an item in the list by clicking on it and then
on the ‘Delete’ button (only possible if you have not yet used the involved
organisation in your database, so make sure the list is correct before starting to enter
monitoring and other data in the database). You can later always add new
organisations in the hierarchy (for instance if you would open a new branch in the
future you can simply add this branch then in the list).
3.6 Enter contacts
Your organization will have contact with persons and organizations. These you can enter
in the contacts. You can always add new contacts later as well, but be aware that when
you start to enter monitoring data in SMART Info you will need the contacts list to enter
the person who did the monitoring, the person who produced the product involved, etc.
So it is good to enter as many of your contacts as possible, especially the known
suppliers (contractors), staff of the organization, Board members, etc. For each contact
you wish to enter do as follows (while entering the details click on the ‘Save’ button once
a in a while):
1. Go to the admin part of SMART Info.
2. Click on ‘Contacts’.

Connect International | Develop your SMART Info administration 7
3. Click on the ‘Add contact’ button. The ‘Add contact’ window appears.
4. Type the name of the contact in the ‘Contact name’ box. This can be the name of a
person or the name of an organisation or company.
5. Select the contact type in the ‘Contact type’ box. You can choose between ‘Person’
and ‘Organisation’.
6. If you wish (not obligatory) you can select the contact parent in the ‘Contact parent’
box. The contact parent is the person or organisation under which the contact
functions in relation to your organisation. For instance if you enter the name of a staff
of a company, the contact parent of that person will be his or her company. If you
enter the name of a staff member of your organisation the contact parent of that
person will be your organization (so also enter your own organization as a contact!
7. Enter other contact details (not obligatory but of course good to do it), including e-
mail address, phone number, visiting address and if relevant postal address, picture
of the contact.
8. Indicate whether the contact is active or not (click on the small square behind ‘Active’
to indicate the person or organisation is active). Active means the person or
organisation is still alive/in function. For instance, if a person dies the person will
have to remain in the contact list if he or she has been used anywhere in the
database (if not the contact can also be deleted from the list), but then you can click
once again in the small square behind ‘Active’ to make this square empty again,
meaning the person/organisation is now regarded not active and can as such not
been entered anywhere anymore in monitoring forms or other places in the database.
9. In case the person or organisation will be allowed by your organisation to have some
form of access to your SMART Info database (see explanation below) you should
enter a user name and a password (and confirm the password). The person can then
login with this user name and password into the SMART Info database of your
organisation and will then have access to things and actions in the database as
determined for the user role provided to this contact (see below).
10. Select the user role. Here you can select the role you wish to give the contact with
regard to access to your SMART Info database. The following user roles are
distinguished:
Viewer. A viewer is only allowed to view certain things in the database, cannot enter
or change anything.
Monitor. A monitor can view things and enter monitoring data.
Datatypist. A datatypist can view things in the account, enter monitoring data, enter
and modify data on contacts, project logic and planning,

8 Develop your SMART Info administration | Connect International
Administrator. The administrator can do everything as far as possible and allowed
within the administration of the organization. In addition to the data typist the
administrator can add users to the account, grant permissions to users belonging to
the account, select indicators, location types and organization node types, and
manage user profiles within the account. Usually only the manager of the
organisation and one higher level admin staff of the organisation get this user role.
11. Click on the small box behind ‘Send login information by e-mail’ if the contact has
been given a user role and you wish to inform this contact what the involved user
name and password is by e-mail (the e-mail address entered for the contact will be
used in that case). It may take some time though before the e-mail arrives.
Enter one contact for all individual customers of products!
In each monitoring form you will need to indicate who is the customer of the product
and who is the owner/user of the product. See the glossary of terms for the difference
between these to terms. In short, the customer is the one who pays while the
owner/user is the one who owns and uses the products. Sometimes these are different
persons or organizations, while sometimes they are the same. In case it is an individual
person who pays for a product you don’t want to enter all such individuals as contacts as
they will probably appear in your whole data base only once in the monitoring form of
the involved product. For such contacts you can make one general contact which you
give the name ‘Individual customer’. Then each time when you have such an individual
customer you can click on this contact in the contacts list, while under ‘owner/user’ you
can type the actual name and details of the person (see the ‘Product details’ part of the
monitoring forms).
3.7 Select product types and indicators in the Account product
types
In the Account product types you select which of the product types your organization
needs as well as the indicators you want to use per each selected product type. This
avoids that when you want to enter monitoring data for a product you will need to search
through an endless list to find the product type you need. Having a shortlist of product
types that you actually need, keeps things simple and gives you more easy overview.
The indicators you will select here per each selected product type are the ones that you
will find in your monitoring forms (see the monitoring part in chapter ...). You can also

Connect International | Develop your SMART Info administration 9
change the following order of the indicators per product type division. For more
information about indicators see Annex 2.
You don’t need to enter all product types at once. You can later always select other
product types and even whole product groups from the list if you wish in the Account
product types.
To select a product type, the indicators and their following order do as follows:
1. Go to the admin part of SMART Info.
2. Click on ‘Account product types’.
3. You can select whole product groups by clicking on the square before a product group.
This means that all product types within that product group are selected to be part of
your account with product types. If so don’t forget to select the indicators and their
following order per each of these product types (see further on how to do this).
4. You can also click on the small triangle before the product group. This opens the
product group and shows you the product types. Now you can select one or more
product types instead of selecting all of them.
5. Let’s select one product type by clicking on the square just before the product type.
Continue as follows:
6. Click on the small triangle in front of the product type. You will see the three stages
appear (activity, finalized, evaluation).
7. Click on the small triangle in front of the stage you wish to work on.
Important: Make sure in the end you have worked out each of the three stages!
8. You see one or more divisions appear. Click on one division. In the right part of the
screen you see the indicators that belong to this division.
Important: Make sure in the end you have clicked on all the divisions and done the
actions described below for each division!
9. To select the indicators you wish to include in your monitoring lists click on the
square before each indicator you wish to select.
Important: Save your work once in a while by clicking on the Save button at the
bottom of the screen (scroll down if you don’t see it!).
10. To change the following order click on the indicator you wish to move up or down in
the list. Now click on one of the arrows to the right to move the indicator up or down.
11. Important: when you are ready click on the ‘Save’ button at the bottom of the screen.
You may need to scroll down to find this screen (sometimes you don’t see it anymore
on the screen, or sometimes it is somewhere in the middle). Don’t forget otherwise
you loose the selection and then in your monitoring forms you will not find it back!!

10 Develop your SMART Info administration | Connect International
12. If you cannot find a product type in the ‘Account product type’, it means the product
type does not yet exist in the system. In this case you should propose to Connect
International to design the product type and its indicators and then enter this in the
system so you can select it through Account product type. To do so do as follows:
propose the name of the product type as well as the divisions and the indicators per
division for each of the product stages to Connect International (if this is confusing
for you just send Connect International an e-mail signalling that a product type you
wish to use is not yet in the system; Connect International will then contact you and
help you to design the product type and the indicators). Connect International will
verify whether it all fulfils the conditions and standards of the system and will
together with you work further on the proper design and when all is ready enter the
product type and the indicators in the system. After that you can select the product
type form the Account product type including the indicators you wish to use.
Problem solving: if you want to select product groups, product types or indicators in
the list that fall of the screen at the bottom and you cannot scroll down to reach them
you can click on one product group which you can still see on the screen and then go
down by pressing the arrow for going down on your key board.

Connect International | Plan a project in SMART Info 11
4 Plan a project in SMART Info
1. Go to the planning part of SMART Info.
2. Click on ‘Projects’.
3. Click on the ‘Add project’ button (or, if you wish to edit an existing project, click on
the pencil drawing under ‘Actions’ at the right of the list of projects)
4. In the tab ‘Details’ enter the project code, project name, project status (select form
list), the start date, the planned end date and the overhead and contingency
percentages as in the approved budget, then click on the ‘Save’ button.
5. In the tab ‘Project logic’ enter the objective of the project.
6. Now click on the ‘Add Result’ button and enter the name of the first project result (in
LFA terms this is the first ‘Expected result’).
7. Click on the button ‘Add Product Type’ and select from the list the product type you
wish to add to the result. If you can’t find the product type you wish to add in the list
do as follows:
a) Go to the ‘Account product type’ in the Admin part of the system and verify if the
product type you need can be found there. If so select the product type and the
indicators you wish to include in the way described in the paragraph called ‘Enter
Account product types’ in chapter 3 of this manual.
b) If you cannot find the product type in the Account product type, the product type
does not yet exist in the system. See the last point in the paragraph called ‘Enter
Account product types’ in chapter 3 of this manual on what you should/can do in
that case.
8. Type a sub-type and then click on the Save button. The sub-type is a further
description of the product type. In this way you can make things more clear. Also it is
possible to have two or more times the same product type under one result but each
of them with a different sub-product type. They will be monitored with the same
indicators but do differ from each other. Some examples:
a) Product type = ‘rural building’. Examples of sub-types: ‘Rural primary school
building’, ‘Rural clinic building’, ‘Rural orphanage building’.
b) Product type = ‘Hand dug well with Rope pump’. Examples of sub-types: ‘New
water point’, ‘Rehabilitated water point’.
If you don’t have anything to put for the sub-type, type something like ‘None’ or ‘New
product’ as the system will oblige you to enter something for the sub-type (otherwise
it won’t save your entries).

12 Plan a project in SMART Info | Connect International
If you made a mistake you want to undo click the ‘Cancel’ button and afterwards go
back to the project and start again.
9. When you have entered all product types and their sub-types you want to plan under
the Result you can enter a second result by clicking on the ‘Add result button’ and
then add the Product types and sub-types belonging to this result in the same way as
described above.
10. After you have entered (and saved) all results and per result all product types and
sub-types click on the tap ‘Planning’. In the planning overview you can plan for each
product type+sub-type the numbers of products per project year (the project years
are derived from your entry of the start and end date of the project in the tap
‘Details’). Click on the Save button once in a while and of course after you are ready
once again. In case it concerns outcome products (these are products you expect to
be an effect of your project; see Annex 1). To ‘catch’ these outcome products you can
enter a last Result in the tap ‘Project logic’ which you call ‘Outcome products’. Under
this result you can enter all the outcome products and the numbers of these products
per year that you expect to be effectuated by the project.
11. The tap ‘Commitments’ is not used yet. In this tap in a later version of SMART Info
you will be enabled to enter the funds committed by donors or other paying clients
per each of the project results.
//There is no possibility yet to copy a project from an ‘Account projects’ to use it as a
basis for a new project///

Connect International | Make monitoring forms 13
5 Make monitoring forms
1. Go to the admin part of SMART Info.
2. Click on ‘Account product types’.
3. Click on the product group. If you want to have all monitoring forms of all product
types belonging to the product group together in one document continue now with
point 7. If you want to select just one product type continue with the below point.
4. Click on the arrow in front of the product group to which the product type belongs.
5. Click on the product type.
6. Check per stage and division of the product type whether all indicator questions have
been selected that you want to enter in your monitoring form (if not select the ones
you want and click on the ‘Save’ button when ready). Click again on the product type
(it then colours blue)
7. Click on the button ‘Printable form’. A screen appears containing all monitoring forms
of the product type.
Problem shooting: if something strange happens (you get a totally other screen than
described) you have probably not yet selected the indicators you wish to have in your
monitoring form. Check by doing the actions for selection of the indicators as described
in the paragraph ‘Select product types and indicators in the Account product types’.
8. Click anywhere in the screen with the right button of your mouse and then click in the
appearing list on ‘Select all’. If this option is not available then select everything in
the screen with your mouse (click in the upper left corner of the screen with your left
mouse, keep the left mouse pushed and scroll down to select all texts).
9. Click again anywhere in the form with the right button of your mouse and in the
appearing list now click on ‘Copy’.
10. Create a new Word file. In the file click anywhere with the right button of your mouse
and in the appearing list click on ‘Paste’.
11. You will now see the monitoring lists for all stages and divisions of the product type in
your Word file. Probably you will need to adapt the settings of the Word file and do
some editing on the monitoring lists to get them properly laid out in the document.
12. To complete the file you should put a part at the top of the monitoring lists for each
stage in which the monitor can enter general details of the specific product. This part
is always the same and should be placed per stage at the top of each and every
monitoring form. See the example on the next page. You can (and probably should)
divide the document into three documents, one for each stage (deleting per
document the two stages you don’t want in it).

14 Make monitoring forms | Connect International
13. Once the monitoring forms for each stage are ready you can print them as many
times as you wish.
14. Important: in case your organisation would one day add or take out indicators for a
product type in SMART Info you will also need to remember to make new monitoring
forms for the product type!

Connect International | Make monitoring forms 15
Example of how a monitoring form can look like after you edited it in Word:
Monitoring form Group: Piped water systems. Type: Gravity piped water scheme. Stage: Finalized
! Product Id
Longitude
! Monitoring date
Latitude
! Project code and name
Altitude
! Organization division (HQ or branch name)
Supplier
! Name monitor
Customer
! Product status (temporarily not
functioning , abandoned/aborted, functioning and in use, functioning
but not in use)
Back customer
! Location (region - district - sub-district –
location)
Owner/user
(name, address, tel.,
E-mail, other info)
Numbers or codes of the photos or
films made of the product
Description/remarks (write on back
of form if needed)
Division: Sources and intakes
*Question *Your answer *Your remarks *Additional info / help / instructions
Are there any major cracks in the intakes?
No answer
Yes
No
! Are the intakes sufficiently strong and
resisting occurring pressures?
No answer Yes
No
Division: Main pipelines
*Question *Your answer *Your remarks *Additional info / help / instructions
Have at road crossings main pipes been
used that are strong enough (or
constructions that avoid pressure on the pipes)?
No answer
Fully Largely
Only partially
Not at all
Are the main pipelines reaching where they are supposed to reach?
No answer Fully
Largely
Only partially Not at all
Are pressure tanks and other structures in
the main pipelines properly designed and constructed?
No answer
Fully
Largely Only partially
Not at all
Are pressure tanks and other structures
located in the main pipelines where they
No answer
Fully

16 Make monitoring forms | Connect International
*Question *Your answer *Your remarks *Additional info / help / instructions
should be? Largely
Only partially
Not at all
! Are the main pipelines free of major leaks
or if there are leaks can they be repaired
without too much difficulty?
No answer
Yes
No
! Are the main pipes free from silt? No answer Yes
No
If not OK: remove the silt and locate the source. Make sure the
silt does not enter the main pipe.
Are the main pipelines entrenched at a
depth of at least 0,8 m below the surface?
No answer
Fully Largely
Only partially
Not at all
Carefully dig above or just beside the pipeline. Once you are at
the pipeline dig until the bottom and measure the distance from
ground level down to the bottom of the pipeline. This should be at least 0,8 m. Check at least at 4 places along the pipeline.
Etc.

Connect International | Enter monitoring data in SMART Info 17
6 Enter monitoring data in SMART Info
6.1 How to make a product ID
Each product should have a fully unique code or number. This is the product ID. It is
required to be able to find back each and every separate product.
Each product group has a code. The easiest way to make product ID’s is to give each
product belonging to a product group the code of that product group plus a follow up
figure. Example:
The product code of the product group groundwater points is GWP.
Suppose the first product relaized under this product group is a hand drilled borehole
with a rope pump, the code for this product could be for instance GWP00001. Now
suppose a next product realized is a hand dug well equipped with an Afridev hand pump,
meaning also a product belonging to the GWP group. In that case this product could get
the product ID GWP00002, etc.
6.2 Enter QUA product data online
1. Go to the monitoring part of SMART Info.
2. Click on ‘Products’.
3. If you wish to enter monitoring data for a product which is not yet in the database
click the ‘Add product’ button. If you wish to enter data of a product already in the
database find the product (you can use the filter to type the name or id of the
product and find it), then click on the form symbol called ‘create form for product’
which you find at the right end of the product line (there are 4 symbols; click the one
in the right bottom corner). (If you first want to see which forms have already been
entered you can click on the symbol called ‘Forms list’ at the bottom left of the 4
symbols; you then see the list with already entered forms and you can also click an
‘Add form’ button here if you wish or edit a form already in the database).
4. If you clicked the ‘Add product’ button you will see a screen with the taps ‘Details’
and ‘Forms’. Enter the product details in the tap ‘Details’ for as far as possible. The
activity date is the date the activities for realizing the product started. The finalized
date is the date the product was finalized (only to be filled in once the product
indeed is finalized; same for the ‘evaluation date’). If the product is being realized
(we say then ‘it is in the activity stage’) for ‘Status description’ you select
‘Implementation’ from the list; otherwise another status fitting best to the status of
the product at the moment you enter the details. Click on the ‘Save’ button.
5. Then click on the tap ‘Forms’ and then on ‘Add form’.

18 Enter monitoring data in SMART Info | Connect International
6. If you have added a new form a screen appears with 3 taps (‘Form data’, ‘Product
details’, ‘Indicator questions’). Start in the tap ‘Form data’. You will see several of
the basic details of the product already filled. Verify the correctness of those details,
change the things that have changed such as the stage which may have changed
from activity to finalized if you want to enter a form with data for a finalized product.
Enter the data requested for. Also fill in the name of the monitor (select from the list;
if the person is not in the list yet, go to the admin part of the system and click on
‘Contacts’; see the paragraph on this topic in chapter 3 of this manual). For the date
you fill in the date the monitoring was done. Click the ‘Save’ button to save your
changes.
7. Click on ‘Product details’. Check the details already filled in and change if needed and
enter other details for as far as known. Click in the small box behind ‘Reviewed’ if
you have changed things of which you feel they need to be taken up in the main
product details of the product (the difference is that here you are in one form of the
product while the product also has an overall part with product details; in case the
details filled in a form differ from the overall product details you can decide to
overrule the overall product details by clicking in the ‘Reviewed’ box; the overall
product details will then be changed into those ones you just entered in your form).
Enter the required information in all boxes with exception of the boxes with dates
(‘Activity date’, ‘Finalized date’, ‘Evaluation date’, ‘Abandoned’). Each time you fill in
a monitoring form you should enter details in these boxes as follows:
If you have entered in the tab ‘Form data’ that the stage is ‘Activity’ you should
in the tab ‘Product details’ only enter a date in the box for ‘Activity date’. While
in the tab ‘Form data’ you have entered the date the monitoring was carried out,
here in the tab ‘Product details’ for ‘Activity date’ you enter the date the
activities on the product have started. Also make sure that if it concerns a
monitoring form for the activity stage that for ‘Status description’ you select
‘Implementation’ or ‘Preparation’ or ‘Abandoned/aborted’ (depending on which of
these three options covers the actual situation at the time of the monitoring
best). In case the status is Abandoned/aborted also fill in the date it was
abandoned/aborted in the box for ‘Aborted’ (so in that case two dates have been
entered, one in the box for ‘Activity date’ and one in the box for ‘Abandoned’.
If the stage is ‘Finalized’ you enter only a date in the box for ‘Finalized date’.
This has to be the date the product was finalized! For ‘Status description’ you
should select one of the following options: Abandoned/aborted, Functioning and
in use, Functioning but not in use, or Temporarily not functioning, depending on
which of these four options covers the actual situation at the time of the
monitoring best). In case the status is Abandoned/aborted also fill in the date it
was abandoned/aborted in the box for ‘Aborted’ (so in that case two dates have

Connect International | Enter monitoring data in SMART Info 19
been entered, one in the box for ‘Finalized date’ and one in the box for
‘Abandoned’.
If the stage is ‘Evaluation’ you enter only a date in the box for ‘Evaluation date’.
This should be the date the monitoring was done (so in this case it is always the
same date as the date entered in the tab ‘Form data’). For ‘Status description’
you should select one of the following options: Abandoned/aborted, Functioning
and in use, Functioning but not in use, or Temporarily not functioning, depending
on which of these four options covers the actual situation at the time of the
monitoring best). In case the status is Abandoned/aborted also fill in the date it
was abandoned/aborted in the box for ‘Aborted’ (so in that case two dates have
been entered, one in the box for ‘Evaluation date’ and one in the box for
‘Abandoned’.
Click on the ‘Save’ button.
8. If an error message appears it is probably due to the fact that you have selected a
stage for which no indicators have been entered in the system yet. In that case you
will find out in the next step (when clicking on the stage in the tap ‘Indicator
questions’ and no indicators appear; however, in case of a relatively small screen it
may also be that the indicator questions are positioned further down in the page, so
scroll down first to verify whether the indicator questions start further down (below
the ‘Save’ button).///When I save details in the Product details part I get a message
‘Error’’ without explanation. However the changes entered are saved. What is this
and is it possible that if an error message appears it also presents what is wrong and
what should be done? I think I got this message because I selected the stage
‘Activity’ while no indicators have been entered for this product type for the stage
Activity yet. However if users get this error message they will not understand.///
9. Click on the tap ‘Indicator questions’. You will see the three product stages (Activity,
Finalized and Evaluation) in the left part of the screen. One of them is coloured blue
which is the one of which you can open the indicator form (it is the stage you have
indicated in the tap ‘Form data’; if you wish to answer indicators of another stage go
back to this tap ‘Form data’ and change the stage into the one for which you want to
enter indicator answers). You will see the different divisions in which the form is sub-
divided. Click on one for which you have answers to indicator questions. Enter the
answers. Click on Save and go to the indicator questions of a next division. Continue
this way until you answered all questions you wish to answer.
Important: if you don’t see the indicator questions the reason may be that you work with
a relatively small screen due to which the indicator questions are positioned further down
in the page. If so scroll down to verify whether the indicator questions start further down
(below the ‘Save’ button).

20 Enter monitoring data in SMART Info | Connect International
Important: when entering data in the form click on the save button regularly. This button
is to the left and may be somewhere in the middle or at the bottom, so you may have to
scroll up or down to find it (especially with long monitoring forms).
What to do if you don’t see the indicators or if one or more indicators are missing:
If you click on a division of a product type but the indicator form does not appear or
indicators seem to miss, this probably means you forgot to select indicators for your
monitoring form in the ‘Account product types’. To solve this, follow the instructions in
the paragraph called ‘Select product types and indicators in the Account product types’,
especially the last few points, for the product type that gives you problems.
6.3 Enter QUA product data offline
If you have to (or think you may have to) enter QUA monitoring data offline for one or
more products, for instance because you don’t have good or no internet access at your
office, you should first create these products online, then save them offline (on your
computer, tablet or SMART phone) after which you can create monitoring forms and
enter monitoring data offline. These will be uploaded in your system once you go online
again with the computer, tablet or SMART phone.
Use the following steps:
1. Create products online. For each product for which you want to create monitoring
forms and enter data offline, execute the following steps:
a. Somewhere where you can go online go to the monitoring part of SMART Info.
b. Click on ‘Products’.
c. Click on ‘Add product’.
d. Enter a name in the product ID box of the product for which you want to enter
data offline later or enter a temporary name which you can easily recognize as a
product for which no data have been entered yet, for instance the name ‘New1’.
e. Select the project logic. Click on the Save button.
f. Go back to the ‘Products’ overview (click on Products in the top row or go to Home
and then to Products). In the filter box type the name of the product you have
just created.
g. In the product row click in the small box called ‘Available offline’ (the third
column, often very narrow so you don’t see the column heading properly). Now
this product is saved on the hard disk of your computer!
How to remove offline products
If a next time you don’t want certain products in your offline modus anymore

Connect International | Enter monitoring data in SMART Info 21
the only thing you need to do is to click again in the ‘Available offline’ cell for
that product so the cell is empty again. Then you will not find back that product
anymore once you are offline again.
h. In case a product for which you want to create monitoring forms and enter data
offline does already exist in your database you only need to click in the ‘Available
offline’ box of that product (above point g).
i. When you have prepared the products for which you want to enter data offline as
described above, click the ‘Update offline products’ button. SMART Info will then
put the products offline that have been selected by you for offline work. Don’t
forget this otherwise you will not find the products back in the offline modus!
2. Enter QUA data offline. Once you are off line, open your browser (this doesn’t work
in the browser ‘Explorer’ though. It does work in the browser ‘Chrome’, so make sure
you have Chrome as a browser on your computer!). Type the name of the web based
version of SMART Info (currently ‘http://wells.ophileon.com’) and click on the ‘enter’
button on your keyboard. You now see an overview of the products you have
prepared for offline work. You can now create monitoring forms and enter monitoring
data in them (for each stage you wish to select) while you are offline. Create forms
and enter monitoring data for these offline products in the same way as when you
work online (it functions the same as if you are online). (After clicking a tab it may
take some time before the tab appears on the screen, give it some seconds).
3. Uploading offline created data. As soon as you make internet contact again with
the computer, tablet or SMART phone in which you entered offline data and login with
your account in Smart Info the offline created data are uploaded automatically into
your SMART Info database (you will also see a message when you get into your
account confirming that data are uploaded). There is also a button ‘Update offline
products’ you can click on (in the screen appearing after clicking in the monitoring
part of SMART Info on ‘Products’). Make sure to get online with the same computer
that stores the offline filled forms. ///when in the offline form I have changed the
product id in the tab ‘Product details’ the form will still be saved in the other product
but the product id will be indicated wrongly. Technically this is OK but a user may
have changed the product id hoping it will be saved in the database as a separate
product which is not the case. This will probably cause confusion////.
6.4 Enter product numbers
It may not appear so but entering the numbers of products realized and numbers of
products in the activity phase is the most important part of monitoring. It is imperative
for the reports, telling you how many products of each project logic have been realized
enabling also to assess progress. You need to enter the numbers after the completion of

22 Enter monitoring data in SMART Info | Connect International
each quarter for each ongoing project for all project logics for which products have been
realized. Especially the numbers of realized (finalized) products during a quarter is
important! For the entry of numbers of finalized products during a quarter and the
numbers of products in the activity phase during a quarter act as follows (see further
down how you can organize this without loosing the overview or things becoming very
labour intensive):
1. Go to the monitoring part of SMART Info.
2. Click on ‘Product numbers’.
For each project logic (a project logic is a project-result-product type-sub-type),
location, and if needed also the organization level, for which products have been
realized in the last quarter do as follows:
3. Click on the button ‘Add product realization’.
4. Enter the year, the quarter and the project logic.
5. Select the location. You can choose to enter numbers realized and numbers in
activity phase per detailed location or you can enter the numbers without specific
indication of the location (in that last case you click on ‘Country’ which we
recommend as also described further down, so you only need to make one entry per
each project logic).
6. Select the organization (headquarters or for instance one of your branches, if
relevant). To make and ensure you indeed only have to make one entry per project
logic we recommend you click on the highest organization level (probably
‘Headquarters’).
7. Enter the total number of products for this project logic that were in the activity
phase at the last day of the quarter in the field called ‘Number of products in Activity
phase’
8. Enter the number of products for this project logic, that were finalized during the
indicated quarter in the field called ‘Products finalized’.
9. Click on the ‘Save’ button.
How can you organize the numbers data easily and properly before starting to enter
them in SMART Info?
1. Decide at which location level you want to report the product numbers. Example:
suppose your location levels include: region, district, town/village, town
neighbourhood/sub-village. You can if you want decide to just enter numbers of
products finalized and numbers of products in the activity phase for the whole
country (select for location ‘Country). That will spare you a lot of work as you will

Connect International | Enter monitoring data in SMART Info 23
probably work in one or a few regions, so then per product type you will only need to
fill the numbers screen once. However, in this way you may loose a lot of information
(you may think that this info is also entered in the QUA forms which is true for
product types for which you fill in a QUA form for each and every product finalized,
but which is not so if you have product types for which you will fill in a QUA form for
only say 5 or 10% of the products realized which is usually the case for small
products, for instance locally produced cooking stoves, etc.). However, to avoid a lot
of work on detailing numbers of products realized per more detailed location we
recommend to have just one entry per project logic. If you wish to do so click for
location on the option ‘country’ and for organisation on the option ‘Headquarters’.
The reason is that for the bigger product types (probably the most important
products you realize) you will enter a QUA form for each and every product realized
which will also contain the location and organisation details down to the lowest
location level so for those products you will have that information anyway in your
QUA forms.
2. Make an Excel file that contains for each project you are implementing a separate
sheet with in such a sheet the project logics on the Y axis and the project quarters
on the X-axis so you can enter the numbers of products realized in a quarter and the
number of products in the activity phase in this sheet after each quarter before
entering them in SMART Info. Such a sheet (for one project) would look as follows
(with in this example numbers entered in the sheet up and to quarter 2 of 2014 and
an indication with the green colours that all data form quarter 1 have been entered
successfully in SMART Info already):

24 Enter monitoring data in SMART Info | Connect International
Project SHIP007 – Drinking water points and toilets in 12 villages in Njombe Region
Result Product
type Sub-type
2014 2015
Q1 Q2 Q3 Q4 Q1 Q2 Q3 Q4
Fin Act Fin Act Fin Act Fin Act Fin Act Fin Act Fin Act Fin Act
Water
points
Hand
drilled
borehole
with Rope
pump
New
2 7 6 3
Hand dug
well with
Rope
pump
New
1 2 2 0
Hand dug
well with
Rope
pump
Rehabilitated
0 6 6 4
Etc.
3. Once you have filled the above sheet for a certain project for a certain quarter you
can easily enter the data for that quarter in SMART Info by just starting with the first
project logic for the quarter and entering the number of finalized products of that
logic (here ‘Hand drilled borehole with Rope pump – New’) (the number under ‘Fin,
here ‘2’) and the number of products of this logic in the activity phase (the number
under ‘Act’, here ‘7’). Then you can even colour the cells green if you want so you
are sure that you will always see that these data have been entered already in
SMART Info.
4. Enter the numbers for the other project logics in SMART Info in the same way until
you have entered all the numbers of each project logic for the quarter in SMART Info.
5. Do the same for all other projects for which you have entered the numbers.
Remember it is important to enter the numbers each quarter for each project if you
want to get proper reports in SMART Info!

Connect International | Use of SMART Info reports 25
7 Use of SMART Info reports
In het one project report is het denk ik beter als het percentage ‘Realized vs. planning’
een absoluut getal is, zonder cijfers achter de komma. Dat staat beter met de andere
cijfers die ook geen getallen achter de komma hebben.
7.1 Use of the Project reports
7.1.1 Introduction
1. Go to the monitoring part of SMART Info.
2. Click on ‘Project report’.
3. Under ‘Project’ select the project for which you want to see reports. You can also
choose a reporting date which differs from the date of today (e.g. if you wish to
assess results and progress of a project up to a certain date). Under ‘Use NOT
reviewed forms’ you see a small square with a V in it. This means that all filled forms
will be used in the report. If you only wish the reviewed forms to be used you can
click the V away and make the box empty. Normally you will want all forms to be
included. Click on the ‘Generate report’ button.
4. The appearing screen shows different tabs. Beside the tab settings and the tab
‘Export’ (for exporting project reports to Excel files so you can enter them in reports
you wish to send to stakeholders such as donors, authorities etc.) all other tabs show
one specific report for the project. We here under explain each report and how you
can use it.
7.1.2 Summary report
This is the most summarized report. It contains info per product group. This can be an
advantage. For instance if you would work with a long list of all kinds of different types of
groundwater points, the details of all these groundwater points will be presented together
in the summary report on one line as they all belong to one product group. As such this
report is very suitable for managers of organizations, donors of the projects, etc. who
want to have a quick general overview. But it is also valuable for project staff to get a
quick understanding of the progress and quality issues of all products together. In short
one can look at the colours. If a cell colours green this means that at large things are OK,
if it colours orange things will need attention and if it is red things are really not good.

26 Use of SMART Info reports | Connect International
Example of a summary report.
The first part of the summary report presents details of the products in product groups
that are in the activity stage/phase. The colours in this part of the report represent the
following:
Product activities
Percentage of products with critical activities > 5% of all products (in
activity phase + finalized).
Average quality score of activity indicators measured < 60%.
Monitoring intensity (percentage of actually filled versus the required
number of filled activity monitoring forms) <60%.
Percentage of products with critical activities is 2 - 5% of all products (in
activity phase + finalized).
Average quality score of activity indicators measured is between 60 and
80%.
Monitoring intensity (percentage of actually filled versus the required
number of filled activity monitoring forms) is between 60 and 80%.
Percentage of products with critical activities is lower than 2% of all
products (in activity phase + finalized).
Average quality score of activity indicators measured is between 80 and
100%.
Monitoring intensity (percentage of actually filled versus the required
number of filled activity monitoring forms) is between 80 and 100%.
Percentage of products with critical activities. This represents the percentage of
products in the activity stage for which one or more of the critical activity indicators
score poorly (this represents the percentage of products that should be rejected

Connect International | Use of SMART Info reports 27
because something important has been done very incorrectly in the activity stage
which will cause an improper product). A critical activity indicators scoring poorly
means that an activity has gone so bad that the product cannot be accepted, so the
activities should be stopped. An example is the use of very poor quality concrete in
the basic structure of a flat building (meaning the flat building will have a high chance
to collapse some day). If this would be detected during construction the works should
be stopped and what has been built with poor concrete should be broken down. This
means that each product with a critical activity indicator scoring poorly should be
identified and be removed/stopped. For the reports we accept normally about 1 to 4%
of products to have one or more poor scores on critical activity indicators (the cell will
then still colour green) but this does not take away the need to remove each and
every product that has one or more poor scores on critical activity indicators!
Average quality score of activity indicators. This is the average score of all quality
indicators measured during the activity phase (both of products already finalized and
of products still in the activity phase). This percentage should be as high as possible
(100% meaning all quality indicators score optimally high). Usually if the average
score is 80% or higher the cell will colour green meaning things are largely OK (if the
average score is between 60 and 80% it will colour orange and below 60% it will
colour red, with red meaning something is really wrong). However, even if the
average score is above 80% it is possible that there are individual indicators of certain
products that score poorly. This we can further assess later in the indicators report
(see further down).
Monitoring intensity of product activities. Connect International indicates ofr each
product type which monitoring intensity is required. For instance if a mason produces
local stoves it may be sufficient to just monitor the activities once in 1% of the
products made because it is a simple and cheap product which is produced in large
numbers. However, if the product is a school building it may be needed to monitor the
activities several times and in each and every school being built. In the summary
report you can see whether the monitoring intensity is sufficient or not in the colour of
the cells. It can be that in one cell the same monitoring intensity gives another colour
than in another cell due to the above.
The second part of the summary report presents details of the products in product
groups that are in the finalized stage/phase. The colours in this part of the report
represent the following:
Finalized products
Percentage of finalized products with one or more critical indicators > 5%
of all products.
Average quality score of finalized product indicators measured < 60%.
Average utilization score of finalized product indicators measured < 60%.
Monitoring intensity (percentage of actually filled versus the required
number of filled activity monitoring forms) <60%.

28 Use of SMART Info reports | Connect International
Percentage of finalized products with one or more critical indicators is 2 -
5% of all products.
Average quality score of finalized product indicators measured is 60 -
80%.
Average utilization score of finalized product indicators measured is 60 -
80%.
Monitoring intensity (percentage of actually filled versus the required
number of filled activity monitoring forms) is 60 - 80%.
Percentage of finalized products with one or more critical indicators < 2%
of all products.
Average quality score of finalized product indicators measured is 80 -
100%.
Average utilization score of finalized product indicators measured is 80 -
100%.
Monitoring intensity (percentage of actually filled versus the required
number of filled activity monitoring forms) is 80 - 100%.
Further explanations similar to that of the product activities.
The third part of the summary report presents details of the users of the finalized
products. There are two columns: one column presenting he average number of users of
all products that have QUA monitored, and a column with the total number of users
based on the average in the first column times the total number of products finalized.
7.1.3 Products report
The products report is in essence the same as the summary report with the only
difference that now the results per each product type are presented. The interpretation of
all parts of the report is the same though as for the summary report, including the
colours of the cells.
7.1.4 Suppliers report
In the suppliers report the average scores for quality and utilization are provided for each
supplier. It can be that a supplier makes different products. These are all put together in
the calculation of the average quality and utilization score. The use of this report is that
one can see whether there are structural differences in scores between suppliers in a
very easy way. If so one can investigate further what causes the differences and take
appropriate measures if needed. If for instance one or more suppliers make some
structural errors this will probably show in this report. Then through the indicators report
(see further on) one can investigate things further.

Connect International | Use of SMART Info reports 29
7.1.5 Monitors report
In the monitors report the average scores for quality and utilization are provided for each
monitor. It can be that a monitor monitors different products. These are all put together
in the calculation of the average quality and utilization score. The use of this report is
that one can see whether there are structural differences in scores between monitors in a
very easy way. If so one can investigate further what causes the differences and take
appropriate measures if needed. If for instance a monitor does not visit the products but
fills in the forms in a café, this monitor will probably have quite different (usually better)
scores than those of other monitors. Also often monitors are the same persons as those
responsible for the results in an area. In that case monitors often like to compare their
scores with those of other monitors and it is an indication in their eyes of how well they
perform. This is also a danger as it can lead monitors to manipulate the data in their
advantage. Hence the need for project coordinators and project auditors (see Annex 2).
7.2 Use of the Project indicators report
7.3 Use of the Product details + their presentation in Google
maps
In order to see the finalized products in Google maps do as follows:
1. In the home page click under Planning on ‘Projects’.
2. For each project in the list you see in the column called ‘Map’ an icon (a blue kind of
droplet with a white dot in the middle). Click on it and you will automatically go to
Google maps where you see the icons for the finalized products in the project
projected in the map (but only if for the finalized products the GPS data were entered
in the monitoring forms in SMART Info!!).

30 Project Cycle Management (PCM) | Connect International
Annex 1 Project Cycle Management (PCM)
Project Cycle Management (PCM) is a method for proper
management throughout a project2. The method is built
on the insight that every project in its basis consists of 5
project phases (identification, formulation, financing,
implementation and evaluation, together called the
‘project cycle’) and that in each project cycle phase a
specific type of management is required.
The project cycle phases follow up on each other.
However, in reality there is often overlap, there are often
deviations and there are often back loops.
Example of a back loop in a project:
During the implementation phase of a project it appears that the budget is insufficient
and some activities need to be expanded. Therefore, while the project implementation
continues, a plan is made for additional budget and expansion of several of the activities
(identification and formulation) and additional funding is sought (financing).
Important is also that the arrow going from the evaluation phase to the identification
phase is often not there. If a project has an end it stops after the evaluation phase. But if
the evaluation is used to develop insights and knowledge which is used in one or more
new (or follow up) projects one can argue that the arrow is there and we can speak of a
true cycle.
The phases of the project cycle can be described as follows:
Identification. During the identification phase the idea for a project is born,
researched and analysed. Ideas are born as an outcome of former project experiences,
insights in developments and bottlenecks in society and/or among specific target
groups, etc. Often however, also further research is done and/or required to test
whether an idea is feasible and logical. The research may cover such aspects as the
identification of problems, constraints, priorities of target groups and opportunities
which a project could address. This usually also includes a review of socio-economic
indicators, specific circumstances and of national and donor priorities. Often one
speaks of a ‘context analysis’ in this regard. As a result of the insights, knowledge and
2 Where we speak of ‘projects’ we usually also mean ‘programs’. Projects are usually limited in scope and geographical focus and usually of a relatively short duration (typical is one to three years). Programs usually include more complex but fully integrated packages of activities, often including different projects with separate project objectives, executed over a longer period of
time and often executed in different geographical areas, while altogether having one common umbrella objective.

Connect International | Project Cycle Management (PCM) 31
findings ideas for projects are identified and, if believed necessary, screened for
further study. Somewhere in the identification phase consultation with the intended
beneficiaries (it is also possible that several different target groups are researched) is
required to identify their problems, needs, priorities and capabilities, and identify
options to address their highest priority problems. A decision can then be made on the
relevance of each project idea (both to the intended beneficiaries and to other aspects,
such as wishes and conditions of envisaged donors, government laws, policies and
regulations, etc.), and which ideas should be further investigated. All the gathering
and structuring of information is also often referred to as ‘assessment cycle’ as there
is a cyclic sequence of activities involved in this phase3. When finally all required
information is gathered sufficiently, involved stakeholders can develop problem and
objectives trees and project strategies which comprises the analysis part of the Logical
Framework Analysis (LFA) described in the next Annex.
Examples of management issues important in the identification phase: formation of
assessment team, context analysis and research, assessment of donor requirements
and conditions, stakeholder analysis, stakeholder meetings, problem and objectives
tree development, strategy formation, coordination, monitoring.
Formulation. Relevant project ideas are developed into operational project plans.
This includes the planning part of the Logical Framework Analysis during which the
Logframe is developed (see next Annex). After the Logframe is ready once again all
elements are assessed and looked at in their integrated coherence, ideally together
with representatives of the key stakeholders. On the basis of this a decision is made
whether to draw up a formal project proposal and seek funding for the project. The
project proposal is the final output of the formulation phase.
Examples of management issues important in the formulation phase: LFA planning
workshop(s), stakeholder involvement, budgeting, proposal writing, coordination,
monitoring.
Financing. Project proposals are submitted and examined by the funding agency, and
a decision is taken by the agency on whether to fund the project. The funding agency
agrees with the party that submitted the proposal on the modalities of implementation
and formalises these in a legal document which sets out the arrangements by which
the project will be funded and implemented (the contract).
Examples of management issues important in the financing phase: deadline fulfilment,
liaison with funding agency, contract assessment, contract signing, monitoring.
Implementation. The project is mobilised and executed. This may require the
tendering and award of contracts for technical assistance or works and supplies.
3 Read for instance the ‘Handbook for disaster assessment’. ECLAC. United Nations.
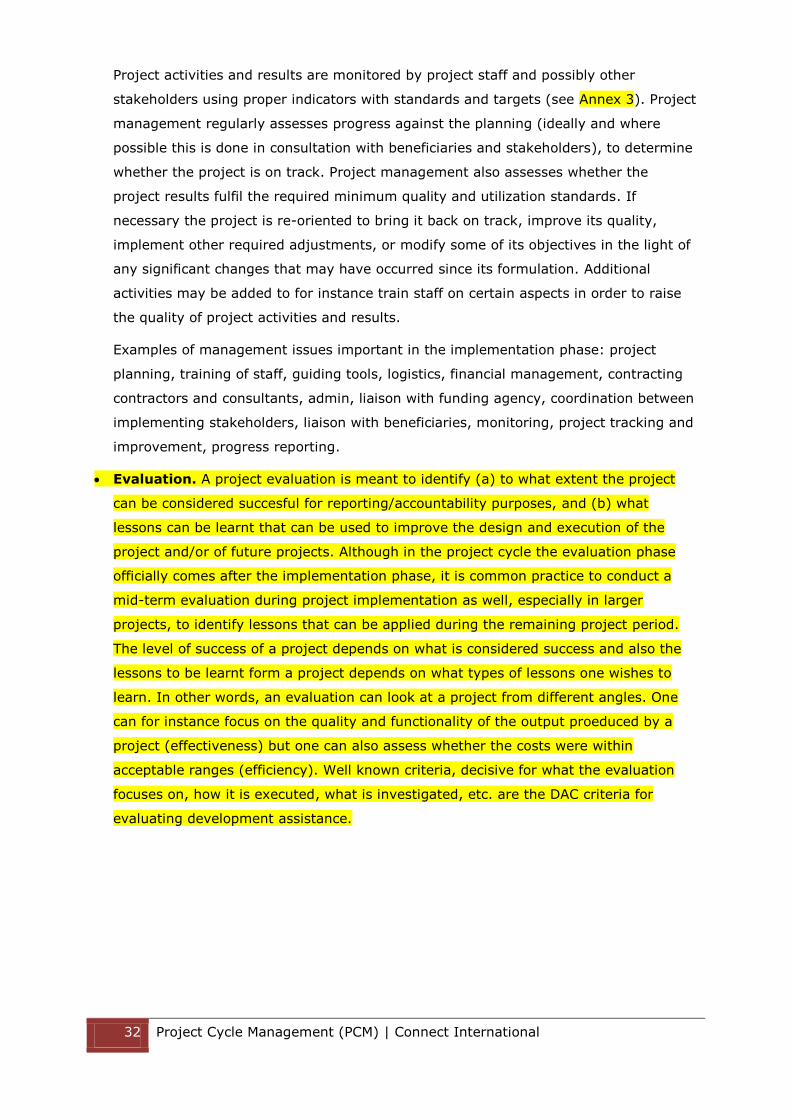
32 Project Cycle Management (PCM) | Connect International
Project activities and results are monitored by project staff and possibly other
stakeholders using proper indicators with standards and targets (see Annex 3). Project
management regularly assesses progress against the planning (ideally and where
possible this is done in consultation with beneficiaries and stakeholders), to determine
whether the project is on track. Project management also assesses whether the
project results fulfil the required minimum quality and utilization standards. If
necessary the project is re-oriented to bring it back on track, improve its quality,
implement other required adjustments, or modify some of its objectives in the light of
any significant changes that may have occurred since its formulation. Additional
activities may be added to for instance train staff on certain aspects in order to raise
the quality of project activities and results.
Examples of management issues important in the implementation phase: project
planning, training of staff, guiding tools, logistics, financial management, contracting
contractors and consultants, admin, liaison with funding agency, coordination between
implementing stakeholders, liaison with beneficiaries, monitoring, project tracking and
improvement, progress reporting.
Evaluation. A project evaluation is meant to identify (a) to what extent the project
can be considered succesful for reporting/accountability purposes, and (b) what
lessons can be learnt that can be used to improve the design and execution of the
project and/or of future projects. Although in the project cycle the evaluation phase
officially comes after the implementation phase, it is common practice to conduct a
mid-term evaluation during project implementation as well, especially in larger
projects, to identify lessons that can be applied during the remaining project period.
The level of success of a project depends on what is considered success and also the
lessons to be learnt form a project depends on what types of lessons one wishes to
learn. In other words, an evaluation can look at a project from different angles. One
can for instance focus on the quality and functionality of the output proeduced by a
project (effectiveness) but one can also assess whether the costs were within
acceptable ranges (efficiency). Well known criteria, decisive for what the evaluation
focuses on, how it is executed, what is investigated, etc. are the DAC criteria for
evaluating development assistance.

Connect International | The Logical Framework Analysis 33
Annex 2 The Logical Framework Analysis
A2.1 Introduction
We first describe the elements that are formulated through a LFA, after which we present
the process steps of a LFA, followed by a description of each of these process steps.
The elements determined through a LFA are:
Goal. The Goal (or Overall objective) of a project is something which is important at a
higher level of society the project hopes to contribute to. It usually focuses at a
specific target group selected for clear reasons that usually have to do with the known
urgency of problems of specific target groups and the Missions and Visions of the
parties planning to execute the project. A project focusing on for instance improved
drinking water for a specific group of people in say Ludewa district in Tanzania, could
have a Goal like ‘Contribute to structural reduction of water related diseases and
burdens in Njombe Region’ (Ludewa district is one of the districts of Njombe Region).
At the Goal level indicators can be formulated (e.g. regional statistics about water
related diseases at the beginning and at the end of the project period). The project
will not achieve the Goal itself but will hopefully contribute to it. To achieve the Goal
also other initiatives are required.
Project objective. This is something the project hopes to achieve. It address the
highest level problem identified for the beneficiaries targeted by the project. Example
of a project objective: ‘Water related diseases and burdens in 10 villages in Ludewa
district reduced with 15% compared to the baseline situation during the project
period’. This is a much more specific statement, something the project may really
achieve fully. Indicators can be attached to this such as for instance the reduction in
diarrhea incidence among the targeted population which can then be measured at the
start, may be somewhere during and at the end of the project. Two main challenges:
(1) attribution – the challenge is to proof that the achieved reductions in disease
incidences have indeed been achieved by the project and not by other factors, (2)
sustainability – how to ensure that the achievement will continue to last also after the
project has been finalized.
The Goal and objective of a project can be formulated when the problems for which
they are needed are well known. Often the problems are well known by the involved
people and if so the Goal and objective can be written down easily. If not investigation
are required to determine the main problems. There are many methods for doing such
investigations, for instance Participatory Rural Appraisals (PRA’s) with villages or
urban neighborhoods, interviews and focus group discussions, and if more detailed
investigations are required one can think of area assessments, hydro-geological
surveys, soil surveys, market assessments, etc. Once all such information has been

34 The Logical Framework Analysis | Connect International
gathered it needs to be analyzed to lead to a proper understanding of the problems
and if possible the priorities and most logical ways to tackle the problems. This again
can be done in many ways. In the LFA one method used is the problem tree and
objective tree which we will describe in the Annex further on.
Strategy. When the project objective has been formulated and the underlying
problems and causes are understood and structured it is time to develop a strategy
which defines how the objective will be addressed by the project. Often there are
several possibilities to address an objective. Example: to reduce water and sanitation
related diseases one can construct water and sanitation facilities, but another strategy
could be to provide water, sanitation and hygiene education to people, or to have a
project focusing on advocacy to local governments that they should do more about the
problem of water and sanitation diseases. The choice for one specific strategy depends
on what is believed to be the most effective way to achieve the objective within the
circumstances, including such aspects as limitations of the budget available, where
best one can have influence, expertise of the executive team available, etc.
Outcomes. When the strategy is known the outcomes of a project can be defined.
These are changed behaviors of people or things realized through changed use or
behaviors by people. For instance a company trained by a project that starts, because
of that, with the production of Rope pumps and selling them, will give an outcome
‘rope pumps sold’ and people who buy and use the Rope pumps constitute the
outcome ‘people using groundwater points equipped with Rope pumps’. But also
improved hygiene behavior as a result of awareness raising on hygiene by a project is
an outcome. In the case of a company trained by the project and due to that selling
rope pumps, the rope pumps are considered an outcome product while if they were
produced by the project or ordered and paid for by the project from a local company
the rope pumps realized in that way are considered an output product as they are
directly realized by the project (see below). Outcomes are things we hope that will
result from our project efforts, but they are closer within our influence sphere than the
project Objective. All formulated outcomes should together be likely to realize the
Objective.
Expected results. These are results we are confident to be able to achieve with the
project. They stem directly from the chosen strategy and are a direct result of the
project activities. As they are realized by the project, the project can also be held
accountable (e.g. by the donor) for delivering the expected results. They address the
main causes of the problems covered by the project strategy, being important and
highly prioritized problems of the target group. Important is that they are formulated
in such a way that if each result is achieved it is likely that through that the Outcomes
and the project objective are achieved. Expected Results could for instance be

Connect International | The Logical Framework Analysis 35
‘Capacitated water product companies’ and ‘Final beneficiaries trained with regard to
water related diseases and prevention of these diseases’.
Output products. Per Expected result we formulate the output products. These are
products realized by the project. Examples: ‘Training course optimal maize growing’
for the final target group, ‘Training course welding as a basis for rope pump
production’ for local companies, ‘Credits for companies enabling them to set up a Rope
pump production line’ etc. For each product type indicators are formulated. During
monitoring these indicators are measured and afterwards the data are entered in
SMART Info. Example: indicators for a realized groundwater point with Rope pump
include: is the pump used, is the concrete platform without bursts, is the yield at least
150 l/hour, etc. The output products under one Expected Result should together
realize the Expected Result. In the SMART Info methodology normally the last
Expected result of a project is reserved for the Outcome products, in case there are
any outcome products to be expected from the project. Often within a project there
are outcome and output products of which the product type is the same. Example: a
project realizes hand drilled boreholes with rope pumps with funds from the project
(output products) but the project also trains companies to produce hand drilled
boreholes and rope pumps. These companies sell hand drilled boreholes with rope
pumps to individual clients who pay for the facilities themselves (no subsidy from the
project) so these boreholes with rope pumps are outcome products. The product type
is the same in both cases but they fall in different categories. The reason for this is
that in the first case (output product) the products are within the complete influence
sphere of the project (the project guarantees that these products will be realized and
pays for the costs) while in the second case the products are an effect hoped for of the
training and guidance of companies by the project. The influence of the project on this
second group, the outcome products, is limited, so the project can only hope and
predict that people will buy the facilities commercially from the companies trained by
the project but cannot guarantee it. For further information on product types and
products see Annex 2.
Product activities and inputs. Each product type has its own specific activities that
together realize a product of that type. Per activity inputs are needed such as labor
with specific skills, materials, tools, equipment, funds./ Also guiding tools such as
software and manuals specifically needed for an activity can be regarded inputs. Per
product activity also indicators are formulated.

36 The Logical Framework Analysis | Connect International
The above described elements can be identified and documented through the Logical
Framework Analysis (LFA) method, a method to plan and detail a project. The process
steps of this method are:
Analysis
phase
Selection
phase
Planning
phase

Connect International | The Logical Framework Analysis 37
A2.2 LFA – Analysis phase
A2.2.1 Learn about the context and identify the stakeholders
If you have an idea for a project, you need to get to know more about the
people, groups, organisations, government bodies, companies… that are or may
become somehow involved or touched by this project?
Most important is to determine who the project wishes to assist and why, and whether
there may be other target groups more in need of assistance/better suitable for your
project. This will depend on the wishes and conditions of the donor, on the Vision and
Mission of your organization, and on the knowledge, skills, awareness, equipment and
tools and level of organization of the people who will implement the project. Once the
final beneficiaries have been identified it is important to learn about their problems,
needs and priorities and the different stakeholders involved in these. There are tools that
can help you with stakeholder analysis, such as PRA methods, mapping tools, Venn
diagrams, organisation charts and so on.
When you’ve selected the most important possible target groups, you can then analyse:
Their main problems
Their interests and needs
Their strengths and weaknesses
How they relate to other groups (cooperation/conflict; dependent/independent…)
Do they need your specific expertise/assistance?
Potential intervention areas and the circumstances related to the project ideas
Potential for funding/financing
Potential partners, networks
Potential competition
Potential impact of your interventions
Political, social, economic situation of the country/region/area + its history
Current and potential market situation, economic stability
Available human resources, level of education
Gender situation, discrimination, social (in)stability
Infrastructure, ICT, logistics

38 The Logical Framework Analysis | Connect International
Security situation
Climatic conditions, natural risks (droughts, earthquakes, rains…)
A2.2.2 Problem and objective tree analysis
During a problem and objective tree analysis workshop (or sometimes it may be
necessary to organise a series of workshops), try to get a representative sample of the
stakeholders who are or may become involved/important in the project to participate.
The problem tree analysis allows you to identify the different problems that the
target group faces, and the relationships between those problems.
The aim is to identify the core problem your project will work on, and see what things are
at the root cause of it, and what other problems are a consequence of the core problem.
The problem tree analysis includes the following steps:
1. Identify the problems. Ask the participants to note different problems of the target
group and direct and indirect causes of these problems at all kinds of levels on cards:
one card per problem. The problems have to be real. If there’s doubt ask them to
clarify by an example. Sometimes participants may bring up things that they think
you, the facilitator of the workshop, find important as they may think you are a
connection to project funding, and they may be right, but it has to be avoided that
problems are brought forward that people think you find important sop they do as if
it really is a problem. Real problems also means that they are occurring now, not
that they could occur if… Also, a problem is not the absence of a solution – it’s still
too early to think of solutions. For instance, if someone thinks that he would get
better crop yields if only he’d have fertilizers, the problem is not ‘The absence of
fertilizers’, but ‘Poor (quality of the) soil’.
2. Identify the core problem and establish a problem tree. There are two ways to
go about this:
The group can agree on the core problem, and develop the problem tree around
it, looking at what underlying problems are the causes of the core problem and
what causes these problems, etc. Be aware that your presence and the fact that
you can do specific things may influence the choice. For instance, if you are
specialised in water and irrigation, the core problem identified by participants
may be more ‘watery’ than when you are specialised in something else.

Connect International | The Logical Framework Analysis 39
Establish the cause and effect relationships between the problems first, and then
select the core problem. This may give you more work to do, because it will be
less clear from the onset what issues are less important or relevant than others.
3. Identify the root problems (the direct causes of the core problem). The root causes
have causes on their own and so on. In this way you can build the problem tree.
4. A tree also has branches above the ground. These are the consequences of the core
problem. The most direct consequences can be found right above the core problem,
then the issues that are a consequence of these direct consequences and so on.
5. When your tree is finished, you may find that there are still some gaps – meaning
there are problems (cards) that you’ve not identified yet. Or maybe you don’t
understand the relation between a separate root/branch and the rest of the tree, and
you may have to reflect on what is missing – or maybe there is a no relation at all.
Now it’s time to turn your problem tree into something constructive: the objectives
tree. This simply means that you start at the top row of the problem, and rephrase every
card in a positive statement or a solution.
As before, sometimes you may need to rephrase
the objective or clarify it.
You also have to check the cause-and-effect
relationships. If problem A causes problem B,
does solution A also lead to the solution of B?
Remove objectives that are not realistic.
Sometimes it is necessary to add objectives.

40 The Logical Framework Analysis | Connect International
A2.3 LFA – Selection phase
A2.3.1 Strategy development
There are often different ways to achieve an objective. If the objective tree is properly
built one can identify these ways in it (see the example below). Sometimes the different
possible ways reinforce each other but more often they are simply different roads leading
to Rome (doing different things but achieving the same objective in the end).
A project wants to achieve things as cheaply, easily and as well as possible. Often one of
the identified ways fits best, either because it is the most cost-effective way to achieve
the objective, or it is the way that can most easily be realized by the project (within its
influence sphere) or it is the way the implementing team has most expertise with, etc. In
the end it is important that within the context and circumstances the most logical way
(meaning ‘strategy’) is chosen that fits your organisation’s Mission, capabilities and
circumstances better than the other ones. Other elements that may influence your choice
may be (to be assessed per possible strategy): required budget, sustainability potential,
potential risks and benefits, expected (positive ánd negative) impacts, gender and social
issues, etc.
When there is more than one suitable strategy, you can use your own criteria to select
the one that suits best to the circumstances of the target group, the situation on the
ground and to your organization and the team envisaged to implement the project.
Connect International | The Logical Framework Analysis 41

42 The Logical Framework Analysis | Connect International
A2.4 LFA – Planning phase
A2.4.1 Logframe development
With the choices made and information obtained one can start to develop the logframe:
Intervention logic
Objectively verifiable indicators
Sources and means of verification
Assumptions and risks
Goal: Please indicate a target value for each indicator.
Please list the sources of verification per indicator.
Project objective(s):
Indicators + target values that clearly show that the project objective has been achieved.
What are the sources of information that exist or can be collected? What are the methods required to get this information?
Which factors and conditions outside the beneficiary's responsibility are necessary to achieve the project objective? (external conditions) Which risks should be taken into consideration?
Outcomes: What are the indicators to measure whether and to what extent the project achieves the predicted outcomes? Including target values.
What are the sources of information for these indicators?
What external conditions must be met to enable the outcomes to be achieved?
Expected results:
What are the indicators to measure whether and to what extent the project achieves the expected
results? Including target values.
What are the sources of information for these indicators?
What external conditions must be met to obtain the expected results properly and on schedule?
Output & outcome products (per each expected result):
What are the indicators to measure whether and to what extent product numbers, quality and utilization (including targets and standards) are achieved and what the involved numeric and measurement values are? (Referral to indicator bases used is sufficient if these are accessible).
What are the sources of information for these indicators and how are the indicators (to be) measured (methods)? (Referral to indicator bases used containing this information is sufficient if these are accessible).
What preconditions/assumptions must be met for the realization of the products?
The logic is the following sequence:
When the project executes activities the planned output products (or outputs) will be
realized in case the assumptions connected to the activities proof to hold.
When the output products under an Expected result are realized well and the
assumptions for these products hold, together they should realize the Expected result.
When the Expected results are realized properly and their assumptions hold, they will
lead together to the envisaged outcomes.

Connect International | The Logical Framework Analysis 43
When the outcomes are effectuated sufficiently and if the assumptions for them hold,
they will achieve the project objective(s) or at least contribute significantly to it.
Therefore in order to enable the above the assumptions in the logframe must be true
and fulfilled while the risks must be sufficiently mitigated and/or prevented.
Remark:
Often instead of the last row being ‘Output products’ donors requiring a logical
framework in the proposals sent to them, ask for the project activities, which is the
traditional Logframe structure4. We provide it here as an example as it is (almost) always
important to respect the formats required by the donor!! In the traditional Logframe
structure the last row looks as follows:
Activities (per each expected result):
Means: What are the means required to implement these activities, e. g. staff, equipment, training, studies, supplies, operational facilities, etc.
What are the sources of information on action progress? Costs What are the action costs? How are they classified? (Breakdown in the Budget for the Action)
What preconditions must be met before the action starts? What conditions outside the Beneficiary’s direct control have to be met for the implementation of the planned activities?
See the example on the next page with a traditional logframe containing an activity part.
Please realize that donors often have slightly different formats to the above presented
ones and unfortunately they do not always make sense. However, as said before, always
try to adhere (as much as possible) to the formats required by the donor! If you decide
to deviate from the prescribed format please try to get permission from the donor to do
so in advance and explain textually in the proposal why you have done this.
The information from the objectives tree is necessary to develop the Logframe, but
generally it takes some tinkering to perfect it. Maybe some outputs or activities may
have to be added. Or the scope of the project objective may have to be redefined, to
make its achievement more realistic within the circumstances and the budget available.
4 In our opinion this is a less accurate way of building a LFA. Often an expected result consists of a
number of products while in the activities part only one set of activities is given unless stated at a
higher level (e.g. instead of describing that drilling the borehole is one of the activities of making a
groundwater point, one can claim that an activity is for instance ‘realization of 50 groundwater
points). Putting the products as an extra layer is more accurate because in SMART Info for each
product type the product activities have been described in large detail so no need to repeat that
layer in the logframe. See also the next Annex about ‘Products’.

44 The Logical Framework Analysis | Connect International
To determine and formulate
assumptions you can use this
diagram as guidance.
Distinguish between normal assumptions and killer assumptions:
Normal assumptions are assumptions that if not coming through may affect the
project to some extent but will not disrupt it.
Killer assumptions are assumptions that, if not coming through, will disrupt the
project (make it impossible to continue it). A possible war is (usually) a killer
assumption for instance. A project should in principle have no killer assumptions.
Example of a traditional Logframe:

Connect International | The Logical Framework Analysis 45
In the Logframe one column is for indicators. Indicators are used in the monitoring and
evaluation system of the project. Monitoring is to assess every day or at least on a
regular basis whether activities go well and products are properly finalized, functioning,
and used. Evaluation is one time event to assess whether/to what extent the project is
successful (it is like taking a photograph of your project, a one moment picture).
Indicators are those things that are monitored and evaluated. They can be statements or
posed as questions. They contain targets and/or standards.
46 The Logical Framework Analysis | Connect International
An indicator is a piece of information telling how one aspect of the project is going or has
gone. We distinguish product activity indicators, finalized product indicators, product
evaluation indicators, project result indicators, project outcome indicators and project
evaluation indicators. See further the Annex on indicators.
The logframe contains another column for verification sources. The verification sources
provide information where you can find the information of each indicator (e.g. in a
database of your organization or of other organizations, in regular reports by the
government, etc.).
A2.4.2 Verify the project’s design
After the Logframe has been determined, it is important to check the coherence and logic
of everything of the project and the Logframe once again and from different
perspectives. You should for instance at least check the below issues (again):
are all the products there to achieve the results? Does the combination of the results
lead to the project outcomes and project objective(s)? Does the project objective
contribute to the goal? Aren’t there any loose ends (missing products, results that
are not relevant for the project objective, etc.)?
Is the target group clearly defined (size, location, type of activities they do, gender,
age, etc.)?
Who will receive the (financial/material) benefits from the project?
Are all the elements of the project and the Logframe clear and unambiguous? Will
everyone concerned understand what is written in the same way? Aren’t there any
concepts that can be interpreted in different ways in various contexts?
Is the project as a whole realistic? Are all elements of the project realistic? How
likely is that the product of an expected result really together will realize the
expected result? How likely is it that the outcomes if realized will really achieve the
objective?
Is the analysis of the assumptions and risks well made? Is it clear how the project
will react in the event that one or several of these risks occur? Have all assumptions
and risks really been formulated, put in the Logframe and analysed? Are there killer
assumptions (if so and if it cannot be assured 100% that these assumptions are
correct the project will need to be reformulated)?
Is the monitoring system established (proper indicators, targets & standards +
methods to measure them)? Are the indicators well designed? Have all product types

Connect International | The Logical Framework Analysis 47
been entered in SMART Info and are there proper and sufficient indicators for all
product types and for all the product stages?
Are the necessary resources there to execute the activities and to manage the
project? What will you do with investments once the project is over?
How will the project results, effects and impacts be sustainable after the project is
finished?
A2.4.3 The theory of change
Theory of Change is the present buzz word to describe and present the Logframe
in a bit more complex and detailed way but on the other hand not covering all
aspects of the Logframe. It contains:
1. A flow diagram that shows the chain from inputs and activities to outputs,
outcomes and impacts.
2. The ‘theory’ that a project applies, which especially underlies the ‘magic leap’
from outputs to outcomes (and impacts): why do you think that the intended
behavioral change (the outcome) will really start to happen?
3. The assumptions that you make in this theory (e.g. no market distortion by
free gifts) and the most important context conditions that might be of
influence on the effectiveness of your theory (no parallel programs that do
they same; legal regulations allow the intervention).
4. An analysis of change agents (and obstructing agents) and their role in the
program.
A theoretical example is given below:

48 The Logical Framework Analysis | Connect International
In this example, there are a number of critical assumptions, which need to be
monitored during the entire project. These are the assumptions that also the
poor have access (equity) and that the voucher system and the campaign at the
start will have sufficient stimulating power that the process will continue
automatically. The lessons learned in similar projects are that there is a need for
additional activities to let this happen. If this was concluded in a mid term review,
new activities could have been made for corrective action.
A few observations on outcomes. Outcomes normally refer to behavioral change.
This may be at the level of people or at the level of organisations. In this
category are words like: use, act, perform, adapt. Words like access, awareness,
knowledge, obtained/received are still considered to be outputs, mostly, as they
do not reflect yet a change in behavior. In this sense, the 7th Millennium
Development Goal of access to water and sanitation is in fact ‘output’ level. It
comes to outcome, if people use the facilities and the water remains safe till
people drink it (at home); and organisations apply the regulations for
sustainability.
Project: Improved water quality at household level by Roses Filters
ToC: Market introduction stimulated by vouchers for replacements
IMMEDIATE INTERMEDIATE
INPUTS ACTIVITIES OUTPUTS OUTCOMES OUTCOMES IMPACTS
HRM/expertiseSelection of sales
agents
80 sales agents
selected and
trained
upscale of filter
business
Training of sales
agents
Marketing survey
incl willingness to payMarketing plan
FundingIntro voucher
system
Social marketing
campaigns
6.000 households
reached with filters
2 years after
introduction people
still have safe water
at home
at end of project >
9.000 families in
project area use
filters
People have
improved health
In kind: filters
Purchase and
Import of Roses
Filters
Required change
agents
CBO, Chamber of
Commerce, Business
Training Centre, Sales
Agents, Government
Uptake from by
banks, business etc
Assumptions: - sales agents see
business
- people willing and
able to buy
- filter certified - continuity in sales
agents
- Import filters
allowed
- people use their
filters continuously
- equity (also the
poor are reached)
- no follow up
campaigns required
Context conditions - no free gifts from
others
- not much
competition
Sales agents
purchase >4,000
spares filters and
>3000 new filters in
3r and 4th year
In 4th year, 60 sales
agents have built up
a sustainable
business

Connect International | The Logical Framework Analysis 49
Outcomes will happen during and at the end of the project and are directly and
exclusively related to the project. Impacts are (mostly) longer term effects which
occur due to many different activities/ developments, and to which the project
makes a contribution, only. Real attribution (e.g. the project is for 30%
accountable for this change) is mostly too difficult to proof, and might require
costly evaluation methods.
The flow diagram of the Theory of Change can be translated into a logical
framework, in which indicators and targets are defined for the outputs, outcomes
and impact(s), including the way these indicators are measured and verified.
Logical framework (example)
Indicators Target Means of
verification
Assumptions
Aim/impact
People have
improved
health
Reduction of water
born diseases
reported at health
posts
At end of
project 30
percent/point
reduction
Dispensary
statistics
Upscale Rose
Filter Business
Increase of sales
in neighbouring
districts
In 2 districts
sale of at least
3,000 filters in
year after
project
Provider of Rose
filters
Intermediate outcomes
Filter market
increased
Nr of people that
use filters at end
of project
9,000 families Sales statistics +
sample on % that
is continuously
using the filter for
drinking
Outdoor water use
is also controlled
Sustainable
sales
Nr of sales agents
that make profit
with their Rose
filter sales
>60 in year 4 Project report +
sample of agents
to check
profitability
No false
competition by free
gifts
Access to credit
Immediate outcomes
People have
safe water at
home
Nr/% of filter
users that have
safe water at
home
4,000 (>67%)
filter house
holds have safe
water 2 years
after filter intro
Check water
quality in sample
of filter users
No follow-up
campaigns required
Sales agents Nr of replacement Annually > Provider of Rose Filter certified

50 The Logical Framework Analysis | Connect International
order both
replacements
and new filters
filters and new
filters per year in
3rd and 4th year
4,000
replacements
and > 3,000
new filters
filter
Outputs
etc
Activities Means/Euro Means Human
Res
Means other
Marketing survey € 25,000 Hired consultant None
Etc
Mind that the assumptions in the last column are ‘conditions’ to reach the aim/outcomes
in the following level above
In a PME plan, these indicators and the assumptions need to be followed.
Evaluation on outputs is focused on performance and ‘efficiency’. Evaluation on
outcomes is more related to the ‘relevance’ and ‘effectiveness’ of the project.
Software for drawing a Theory of Change: TOCO: http://toco.actknowledge.org

Connect International | Products 51
Annex 3 Products
Product types, products, product numbers, product number planning, product activities,
product evaluation vs. project evaluation, audits and baselines, etc.
hoe je onder expected results de producten formuleert zodanig dat erg een losse
activiteiten meer overblijven!!!!!///
A3.1.1 Product planning
Project X
Objective
+ strategy
Result Product Type
(PT) Sub-type Year 1 Year 2 Etc.
Result 1 PT 1.1 X 21 13
PT 1.2 Y 12 45
Result 2 PT2.1 Z 8 2
PT2.2 A Etc.
Result3 Etc.
52 Monitoring and evaluation | Connect International
Annex 4 Monitoring and evaluation
A4.1 Introduction
Monitoring = ongoing regular measurement of indicators in a project or operation. The
main aim of monitoring is first of all to identify things that are not going well enough and
taking immediate measures to improve things! Secondary is collection of data (and their
structuring and analysis) for reporting to stakeholders such as management, donors,
government, beneficiaries, etc.
Evaluation = a short exercise to get a picture of a project or operation at that particular
moment. It is like a snapshot of the situation at a specific time. Evaluations ideally make
use of a proper baseline providing information about the situation at the beginning or at
a point back in time so one can assess the progress and achieved benefits against this
baseline. The aim of evaluations usually is to determine the level of success of an
ongoing project or operation at a certain specific moment in time, the bottlenecks and
how to improve things, or to learn lessons form a finalized project or operation for similar
future projects or operations.
There are different types of evaluations, each with different scope and aims. Examples:
project evaluations (e.g. mid-term, final), organization evaluations (e.g. annually or bi-
annually; refer to the INK and 5C organisation evaluation models), audits (evaluations in
an organizational setting focusing at specific subjects, often procedures, documentation &
reporting, etc.).
Project evaluations can focus at different aspects. The aspects used mostly are described
by the ‘DAC Principles (or Criteria) for Evaluation of Development Assistance’. They
include: relevance/appropriateness, connectedness, coherence, coverage, efficiency,
effectiveness, impact and sustainability (see further on for details).
The main challenge seems to be monitoring, that is to get it done properly and
consequently. Evaluations are often popular as they are short term events, specific
resources in terms of time, finances etc. Are reserved and planned for it and it feeds
people’s curiosity (how have we been doing, how successful was our work?). Monitoring
however is an ongoing activity that requires a lot of input and dedication and of which
people often don’t immediately see back the results. Hence it is difficult for staff to bring
up the discipline especially if also managers and leaders in the organization are nto so
motivated for it. To make it happen requires a serious dedication and motivation from
leadership and managers to start with, followed by the staff.
Connect International | Monitoring and evaluation 53
A related challenge to monitoring is that often donors and clients tend to be not so
critical on the information they are given and do not try to verify the correctness of the
information structurally. This means organizations are not punished for under performing
with regard to monitoring, which we feel contributes to the lack of motivation for it.
Then why is monitoring important if nobody seems to care about it? A simple story to
raise the awareness:
A few years back there was a big issue in the world news because a large building in
Turkey had collapsed with about 100 people who died in it. The collapse was caused by
poor technical standards used during construction. The contractor had put less cement in
the mortar and concrete structure and less reinforcement than was technically required.
The absence of a monitoring and control system made it possible for him to do so. Of
course in most cases the problems will not be that big but in general one can say that if
monitoring is not done properly the chance is high that the quality, effects and impacts of
projects and operations is lower than what is possible, required, planned and paid for!
A4.2 Monitoring
Monitoring is an ongoing every day activity that staff and often other stakeholders as well
(should) execute. To ensure that proper monitoring of projects and activities is well
introduced and anchored in an organization the following steps are needed:
1. Awareness creation. Leadership and management of the organization need to be
aware of the importance of monitoring and need to take a fundamental decision to
introduce and anchor proper monitoring in their organization even if this is difficult,
requires expertise not (yet) available and will cost (a lot of) money. A problem is that
this will happen only if there is a proper incentive for the organization to do so. Such
incentive can (and in most cases has to) come from external pressure from donors,
governments or others involved to which/whom the organization is susceptible (e.g.
a donor really pressing for the right monitoring data can be successful if he agreed
this with the organization before the start of the project and only if he pays fully or
at least partly after having received these data).
In current practise this incentive is not sufficiently there. Donors for instance may
press for data on certain indicators put in the Logframe but the Logframe usually
does not mention the indicators that are needed to ensure that all activities have
been executed with the right quality (e.g. in the Logframe you will very probably not
find back that the casing used in boreholes will need to be of a specific pressure class
and material or that the mortar used in the walls of a building constructed by the
project needs to be of a certain mixture). The devil is in the details!
This is the main reason why monitoring is such a hazzle, why required key data are
in most cases not available, why therefore most evaluations end up concluding there

54 Monitoring and evaluation | Connect International
weren’t enough proper data to come to solid understanding and conclusions, and,
worst of all, why so many projects are of poor quality, suitability and impact without
the donors, governments, and beneficiaries even knowing about it.
A building constructed with poor mortar will last considerably less time than if proper
mortar is used but it needs an expert eye to see what the quality fot he mortart used
is once the walls are ready! The borehole that has a poor quality casing will look as
nice as a borehole with a proper quality casing once it is ready but it will start to
collapse after 2 to 5 years. To the contrary stakeholders such as donors and also the
beneficiaries, involved authorities etc. often get thick reports with beautiful stories
and all kinds of data on certain indicators that make them think it is a wonderful
project while in actual fact the reality is (totally) different. Or simply there is no or
only a very tiny report form which hardly any insight is obtained (usually only
number of facilitie srelaized are mentioned, almost never is there solid and complete
information on quality and utilization aspects.
An example how it could (should) be organized: in the 19 seventees (or eighties?) a
lot of organizations did very poor financial monitoring. Often this was on purpose so
nobody could detect their level of corruption and leaders, managers, staff etc could
steal stuff and money and get away with it. More often even organization simply
didn’t want to spend resources on proper financial bookkeeping as nobody was
interested in it anyway, so why doing it in a proper way. At a certain point is was
decided somewhere at world level that international rules would be drawn up for
financial bookkeeping and the financial annual reports to which all organizations
worldwide should adhere in order to stop all that malfunctioning of organizations.
Since then financial bookkeeping by organizations has improved drastically. The
result has been that organizations now much better manage their finances and a lot
of roads to corruption have been blocked. It has improved the functionality of
organizations dramatically.
If such a worldwide decision would be taken for what we we call narrative monitoring
(monitoring the things relaized by projects) this would very likely result in an even
more dramatic leap in quality and effectiveness of organizations.This however,
requires international rules and standards for narrative monitoring.

Connect International | Monitoring and evaluation 55
SMART Info standards for narrative monitoring and evaluation
SMART Info has developed its own generic standards for narrative monitoring. These
form a basis for the M&E indicators used in the product and surveys laid down in the
libraries in the software. As the standards have to be generic and applicable in any
situation, for any type of product or survey an extremely simple basis was used for it:
1. For monitoring the basis used is the cost of a product. The product type cost is
indicative for:
the minimum number of indicators that has to be formulated for the product
activity, finalized product and product evaluation stages of the product type,
the monitoring intensity in each of the product stages.
2. For evaluations the basis used is the cost and/or importance of a project or
organization turnover. This is indicative for the minum number of questions to be
used in a survey for the evaluation or audit of a project or organization.
The above is applied in a broad way though, as for instance within one product type the
costs of products can be very different. For instance the product type ‘rural building’ can
be a two classroom primary school but it can also be a rural secondary school with ten
classrooms, three offices, a library and six teachers houses.
2. Selection of system and M&E framework.
3. Installation of the system and framework
4. Training of managers and staff
5. Development of M&E procedures
6. Implementation of the M&E procedures.
7. Daily and structural monitoring and control by leadership and management
of the continued proper implementation of the M&E procedures.
8. Project cycle. After step 1 to 7 one should think of it as a project cycle in itself, so
somewhere down the line the M&E system will need to be evaluated and then
reflection is required and identification of improvements and changes needed to
ensure even better M&E in the years after.
9. Etc. This means the organization should keep the cycle spinning around and don’t
loose the attention!

56 Monitoring and evaluation | Connect International
(Wake up) Call for donors:
Donors should enter in their project contracts with implementing organizations that the
implementing organizations need to apply a fully developed M&E system. It would be
good to include a statement that the system has to fulfil the SMART Info standards as
these have been worked out per product type and with sufficient numbers of well
developed indicators. In this way a minimal M&E system and quality is secured if applied
properly by the implementing organization (and if not the donor can refuse to pay). This
does mean however, that implementing organizations should be able to build up the
system and for that obtain the required resources to introduce the required M&E systems
in line with the above steps. Main reason for donors to do this: it will result in better
accountability and project results!

Connect International | Monitoring and evaluation 57
A4.3 Evaluation
A4.3.1 Evaluation of projects

58 Monitoring and evaluation | Connect International
DAC criteria for the evaluation of projects

Connect International | Monitoring and evaluation 59
Sustainab ility Sustainability looks at the longer term
continuation of the realized results,
effects and impacts. Due to the current
focus in developing aid on business
aspects sustainability is these days often
translated into ‘profitability’.
Evaluations assessing
projects for which longer
term effects are important.
How to set up a project evaluation
Including the research methods and data collection system
How to work out the data
A4.3.2 Evaluation of organisations
INK versus 5C.
Overview of topics
How to set up a proper organisation evaluation and the research methods and data
collection system
How to work out the data
A4.3.3 Audits
How to set up a proper audit and the methods and data collection system
How to work out the data

60 Indicators | Connect International
Annex 5 Indicators
A5.1 Introduction
An indicator is a statement containing one or more standards regarding the required
level of performance, quality and/or success of something, that can be measured and/or
objectively identified. An indicator may also contain targets. The indicator can be posed
as a statement or as a question. In the last case we speak about an indicator question.
A standard is a minimum threshold within an indicator, usually with regard to the
required quality of something, which is decisive for whether the performance measured
by the indicator is regarded successful. A standard can for instance be 150 l/hour which
is part of the indicator stating that the maximum yield of a low cost groundwater point
should be not less than 150 l/hour.
A target is a number set by the project for something it wishes to achieve. This can for
instance be the number of water points planned to be realized, but also the number of
beneficiaries targeted by the project or the reduction in the diarrhoea incidence the
project hopes to achieve. Targets say nothing about the quality of something which
distinguishes them clearly from standards.
If all indicators of all parts of the project are successful the project is successful. If not all
indicators are successful the project may still be successful but this then depends on the
judgment of the people evaluating the project.
Example 1:
For the yield of a certain type of groundwater points equipped with hand pumps the
indicator is:
“The yield, when pumping at maximum speed, should at least be 150 liter per hour.”
If posed in the form of a question it becomes:
“Is the yield, when pumping at maximum speed, at least 150 liter per hour? (Y/N)”
Within the above indicator the standard is 150 liter per hour. If the yield measured is
lower than 150 liter per hour the water point is officially regarded unsuccessful. It can
still be acceptable though to the people using it!
Example 2:
For the reduction in diarrhoea the project hopes to achieve (impact) the indicator is:
“Reduction in the diarrhoea incidence with at least 25% compared to the baseline level”.
If posed in the form of a question it becomes:
“Is the diarrhoea incidence reduced with at least 25% compared to the baseline level?
(Y/N)”

Connect International | Indicators 61
Within the above indicator the target is 25%. If the reduction in diarrhoea incidence
compared to the baseline measured is lower than 25% the project is not regarded
unsuccessful but less successful than was hoped for.
Some conditions indicators need to fulfil:
Indicators should be properly and clearly formulated, understandable for the persons
measuring the indicators.
Indicators should be measurable in a manner as objective as possible.
Measuring indicators should be possible at acceptable cost and within the capabilities
of the implementing agency and the people doing the measurements.
People measuring indicators should be properly trained into the methods of measuring,
and have access to all required tools, equipment and materials needed for measuring
the indicators.
The methods for measuring indicators should be properly documented and people
doing the measuring should have this documentation.
Proxy-indicators
Proxy-indicators are indicators that give an indirect indication about something you wish
to know. Example: in a training you want to get an idea about the quality of the training.
A proxy indicator for it is the official (and unofficial) qualifications of the teacher. It is
possible that a teacher without the right qualifications still provides a very good training,
so it is not providing direct proof about the quality of the training but it does give an
indication. It is one piece of the puzzle and if for instance other pieces of the puzzle
(other proxy indicators) also indicate weaknesses it becomes more and more likely that
the quality of the training is not good. Proxy-indicators are needed where it is not
possible to measure the direct indicators that would give the required information
straight. This is often the case with impact indicators as these are often difficult to
measure and the level of attribution is also often unsure (see further on).
Statement:
Developing proper indicators in a project that cover all aspects of the project is a very
labour intensive exercise that needs ample field testing, adaptations etc., a high level of
expertise and an agreement, at least a consent, between parties involved 5 on the
standards used. Therefore we have done it and are doing it for you! In SMART Info.
5 In negotiations between parties there are different possible levels of agreement that can be reached: win-win (everybody agrees fully because everybody wins), consensus (all agree on the negotiation results, nobody looses), compromise (all parties agree but have to give in a bit on what they hoped to get out of the negotiations), consent (all parties agree but each party has to give in so much that none of the parties is happy with the end result). Read among others ‘The 7 habits of highly effective leaders’ of Stephen Covey if you are interested in this topic.

62 Indicators | Connect International
A5.2 Indicator types
In literature you can find many ways in which indicators are structured. We follow the
LFA method plus our SMART Info structure of product types and product stages:
LFA interven-
tion logic
Stage Indicator
types Examples
Project objective
Project evaluation
Impact Infant mortality rates among all infants in the rural areas of Njombe region, Tanzania, reduced from 60 (baseline) to 40 deaths/1000 live births by 2020.
Sustainability
The profitability of companies trained is at least 50% higher compared to the baseline 10 years after the end of the project.
Parents school committee has proper statutes, including proper member election regulations, good leadership, and is active. (proxy indicator for sustainability of school improvements)
Effectiveness The percentage of groundwater points realized compared to the
planning is at least 95%.
Efficiency The total project cost is not higher than the available total budget.
Coverage % of target population effectively reached.
Connectedness
Coherence
Relevance/
appropriateness
The project fulfils one or more of people’s top 3 highest priority
needs.
Project
outcomes
Project
evaluation Outcome
Nr. of people properly and consequently using groundwater points equipped with Rope pumps realized by or as an effect of the project the same or higher than the planned/envisaged number.
Results
Finalized
product monitoring
Result Number of low cost groundwater points realized. (Derived from the finalized product ‘Numbers indicators’).
Product types (for
outcome and output products)
Finalized product evaluation
Quality (C/NC) The water point is well functioning. (= C indicator).
Utilization (C/NC)
The water point is well used. (= C indicator).
Numeric Number of m2 irrigated with the water point.
No’s of users Number of persons using the water point.
Finalized product monitoring
Numbers Number of hand drilled boreholes with Rope pumps realized.
Quality (C/NC)
The concrete of the apron around the borehole does not show
any major cracks. (= NC indicator). The water point is at least 30 m away from any toilet. (= NC
indicator). The hand drilled borehole with Rope pump yields at least 150
l/hour. (=C indicator).
Utilization (C/NC)
The water point is well operated and maintained. (= NC
indicator). The users of the water point are satisfied with it. (= C
indicator). The water taken from the water point for drinking is not
contaminated between the collection and its use. (= NC indicator).
Measurement Depth of the borehole (in m).
Numeric Number of large animals drinking regularly from the water point.
No’s of users Number of persons using the water point.
Product activity (and inputs) monitoring
Numbers Number of products in the activity phase.
Quality (C/NC) The casing used for the borehole is of PVC quality 6 PN or better. (= C indicator).
Measurement Length of the casing pipes used (in m).
About the terminology used in the above table:

Connect International | Indicators 63
C = Critical indicator, NC = Non critical indicator. A product with one or more critical
indicators scoring poorly (in any of the product stages) is officially rejected (although
it can still be acceptable to the beneficiaries). Example: in Mozambique a low cost
groundwater point yielded slightly less than 150 l/hour. Therefore it was officially
regarded unsuccessful. However, because the beneficiaries had few alternatives while
another, better yielding groundwater point, was unlikely to be found nearby, they
decided to accept the water point as they could still cover most of their water needs
with it.
Numeric is about quantities of things related to the use of the product.
Measurement is about quantities related to the characteristics of the product.
A5.2.1 Project evaluation indicators at objective level
Impact indicators
The positive changes (related to the project objective) and negative changes (often even
unknown!) produced by a development intervention, directly or indirectly, intended or
unintended. Impact indicators consider:
What happened as a result of the project?
What real difference has the project made to the beneficiaries?
How many people were affected (positive/negative)?
An impact indicator contains a target group, number and type of people targeted,
locations, a target and a time frame.
An impact indicator is a useful indicator if it can be measured with the means available!
One should proof attribution which is the extent to which measured impacts are a direct
or indirect result of the project because impacts may also be a result of other factors
outside the project. For instance reduced diarrhoea incidence levels measured may result
from the water points realized by the project but may also be (partly) a result of
improved hygiene behaviours as were promoted/sensitized by a government program in
the same period. For water projects one can use the Minimum Evaluation Procedure
(MEP): if one can proof that water facilities are used structurally, correctly and
hygienically (= an outcome of the project) one can safely assume that this will have a
significant impact on health, because this causal relation has been proven in many water
projects!
Sustainability indicators
Sustainability is concerned with achieving positive benefits likely to continue in the long
run and preventing/avoiding negative (especially environmental) effects. Consider the
following questions:
To what extent did the benefits continue after donor funding ceased?

64 Indicators | Connect International
What were the major factors which influenced the achievement or non-achievement of
sustainability of the project?
Often sustainability is difficult to measure at the end of a project (when the final report is
prepared) as its achievement can only be measure din the long ruin. To cope with this
dilemma often proxy-indicators are used.
Effectiveness indicators
A measure of the extent to which an aid activity attains its objectives. In evaluating the
effectiveness of a programme or a project, it is useful to consider the following
questions:
To what extent were the objectives achieved / are likely to be achieved?
What were the major factors influencing the achievement or non-achievement of the
objectives?
To what extend were expected results and products realized in line with the project
planning (numbers, timing)?
Efficiency indicators
Efficiency measures the outputs -- qualitative and quantitative -- in relation to the inputs.
It is an economic term which signifies that the aid uses the least costly resources and
means possible (in terms of finance but may also be in terms of time, materials used,
etc.) to achieve the desired results, effects and impacts. This generally requires
comparing alternative approaches to achieving the same, to assess whether the most
efficient process has been adopted.
When evaluating the efficiency of a programme or a project, it is useful to consider the
following questions:
Were activities cost-efficient?
Were objectives achieved on time?
Was the project implemented in the most efficient way compared to alternatives?
Providing a budget overview with budget planning, received funds and actual
expenditures can be regarded as an efficiency indicator. Efficiency can also mean other
things though, e.g. the amount of time needed to finalize some works or the resources
required in terms of materials needed for something.
Relevance indicators
The extent to which the aid activity is suited to the priorities and policies of the target
group, recipient and donor. Consider the following questions:
To what extent are the objectives of the programme still valid?
Are the activities and outputs of the programme consistent with the overall goal and
the attainment

Connect International | Indicators 65
of its objectives?
Are the activities and outputs of the programme consistent with the intended impacts
and effects?
Coverage indicators
Connectedness indicators
Coherence indicators
A5.2.2 Project evaluation indicators at Outcome level (outcome indicators)
Indicators showing how people’s behaviours have changed as a result of the project or
things realized through changed use or behaviours by people as a result of the project.
A5.2.3 Result indicators
The indicators express in qualitative and relatively broad terms what will be realized by
the project. In most cases it is a grouping of the products realized under the Expected
results. Therefore often no separate indicators are determined for the expected results.
A5.2.4 Finalized product evaluation indicators
In principle they have the same features as finalized product indicators but usually they
are different indicators as for product evaluation one normally wants to have a very
limited set of indicators that just give insight in whether products function, are properly
utilized and by how many users. They are measured usually quite a long time after the
completion of the products, for instance after one or two years or longer. In some cases
the product evaluations may be repeated again or even at regular intervals (for instance
one may want to measure some indicators of groundwater points every 5 years in order
to get insight in their sustainability and level of functionality and utilization in the long
run).
A5.2.5 Finalized product monitoring indicators
Finalized product indicators are measured directly after finalization of a product or at
some point after its completion. It depends on the product type what the best timing is.
For instance a finalized borehole with hand pump can best be final monitored about 2 to

66 Indicators | Connect International
3 months after its completion because then structural problems can usually be observed
while also the users have their first solid experience with the water points. To the
contrary a finalized training can best be final monitored (often called evaluated in the
context but it is in actual fact a monitoring action) directly after the training when the
participants are still together and the training is still fresh in their minds so they can
provide good feedback on what was good and what can be improved.
Two main indicator groups are determined:
QUA indicators – indicators for quality, utilization and amounts (numeric and
measurement) of the products
Numbers indicators – numbers of products in function.
For Q(uality) indicators one can think of indicators focusing at things like:
Effectiveness/quality/robustness
Does it do the job
Is it appropriate for the users
Safety of the product usage
Etc
U(tilization) indicators focus at how (well) people use the products, how satisfied they are
with the products, how they operate, maintain, repair and sustain the products etc.
A(mounts) indicators focus at measurement issues and numeric issues of the finalized
products.
A5.2.6 Product activity monitoring indicators
The following groups are included:
Number of products in the activity phase
Quality of activity implementation and of the inputs (materials, but also for instance
professional skills and attitude regarding he activity of people implementing the
activity)
Sometimes also one or more measurement type indicators are included.
A critical activity indicators scoring poorly means that an activity has gone so bad that
the product cannot be accepted, so the activities should be stopped. An example is the
use of very poor quality concrete in the basic structure of a flat building (meaning the flat
building will have a high chance to collapse some day). If this would be detected during
construction the works should be stopped and what has been built with poor concrete
should be broken down. This means that each product with a critical activity indicator
scoring poorly should be identified and be removed/stopped. In the reports in SMART
Info we normally have a minimum standard that not more than 0 to 4% of products (the

Connect International | How to introduce SMART Info 67
actual percentage depends on the product type) is allowed to have one or more poor
scores on critical activity indicators. However, this does not take away the need to
remove each and every product that has one or more poor scores on critical activity
indicators!
A5.3 Measuring indicators
It is very important that the persons executing monitoring tasks do not only have forms
with the indicators they are to measure but also the knowledge and skills to measure the
indicators, the required equipment and tools and the (background) documentation
explaining how to measure the indicators. However, may be most important is that they
need to have the proper attitude (motivation!) to measure the indicators. Often staff in a
project are very busy and monitoring is perceived as a burden rather than an important
part of their work. The reason is often that they do not immediately see the benefits and
also because it requires continuous discipline to prepare for it, travel to site, execute the
monitoring tasks, take measures in case of detected shortcoming and when back ensure
that data are entered in a proper database. Then they will also need to analyse and use
the reports generated with the data for developing structural improvement. This is time
consuming and requires a high level of discipline, hence motivation!
It can only be achieved if involved staff are not only properly trained to do so but also
supervised intensively by their managers to do it and do it properly! It requires the
creation of a monitoring culture in the organization.
In SMART Info for each indicator in the system also the method of how to measure the
indicator is shortly described in the monitoring forms created by the software system.
Annex 6 How to introduce SMART Info
SMART Info is a web based tool that will enable your organization to become a learning
and always improving organization with improved quality, sustainability, effects and
impacts of your projects and improved accountability of your results. However, to make
it work optimally it needs to be embedded properly in your organization. You need to
make sure that data are collected at the proper times and that everything is properly
entered in the database. More importantly is that people in your organization should do
something with the data, they should learn form it and use the increased knowledge and
insights to improve things. Partly this should happen on the spot, for instance when a
monitor observes that one or more activities are not properly executed he should rectify
that immediately and also assess how come that this could go wrong and then improve
things in the structure so it will not happen again. Partly the assessments and
improvements are done later after carefully assessing reports and using the findings to

68 How to introduce SMART Info | Connect International
improve things. This requires a restructuring of your organization with new structures
and procedures to be introduced that will ensure a proper introduction of SMART Info.,
The reward will be a better functioning organization that counties to learn and improve,
better reporting to donors and higher chances for increases in funding in the future,
higher levels of involvement of and accountability to all kinds of stakeholders which again
will increase the support for your organization and improve the results. Etc. So it is
definitely worth the effort although it requires some work and especially a lot of discipline
to execute the procedures consequently also in the longer run. Keep in mind: if you are
able to keep up that discipline your organization and its beneficiaries/clients will benefit
hugely from it!
Here under we present a number of steps your organization should take to properly build
up the structures and procedures needed to ensure a proper introduction and structural
embedding of SMART Info in your organization.
A6.1.1 Introduce project coordinators
A good way of working is to introduce project coordinators. It starts with a decision by
the Board of your organization that for each project a project coordinator has to be
appointed. A good way of working of a project coordinator is as described here under
(though each organization may adapt it to its own situation and preferences; bottomline
is that you want to introduce someone who coordinates things and feels and is
responsible for the project being properly executed and if problems arise that these are
timely identified and solved, preferably even before they actually arise).
The project coordinator has the responsibility for the proper execution of the project and
is answerable about the results to the management of the organization. He/she ensures
that at the right times people are at work in the project and he keeps a constant eye on
the proper progress of the project as well as on the proper quality of the works and
products. In case of problems he timely signals this. He is also responsible for making
the required reports in time with a good quality. For the execution of the works and the
monitoring of the activities as well the finalized products the coordinator works with a
project team. The project team members may take up certain tasks and may on their
turn coordinate other people, for instance contractors or daily laborers, but the project
coordinator is responsible for the proper execution of the project plus the proper
monitoring of it (including the entry of the data in SMART Info).
A6.1.2 Introduce product time schedules per project

Connect International | How to introduce SMART Info 69
Develop a monthly time schedule per project (best in an Excel file, but you can also for
instance make flipcharts which you put on the wall in the office) with information on
important targets and activities (see the planning part in SMART Info the project planning
with planned numbers of products per project year; what you will make here is a further
detailed plan per month for the most important products and product activities organized
per product group (to avoid getting too many lines and a too confusing large overview),
which should be in line with the yearly project plan and planned product numbers in
SMART Info). The project coordinator should do as follows:
1. Go to the reporting part in your SMART Info account.
2. Click on ‘Project report’.
3. Select the project concerned and create the report.
4. Export the (still empty) summary project report to an Excel file and save this file in a
folder you have created specifically for the project.
5. For each project year in the plan add columns until you have 12 columns per project
year.
6. Add specific planning in the monthly cells for each line to create a detailed plan. This
may look as follows (the project coordinator is responsible for the proper and timely
updating):
SHIPO096 Water and sanitation facilities Njombe area
Project coordinator: Tom Owalo
Result Product group aug-14 sep-14 okt-14 nov-14 dec-14 jan-15 feb-15 Etc.
Project coordination Quarters
SMART Info
month update
SMART Info
month update
SMART Info
quarter
update
SMART Info
month
update
SMART Info
month update
SMART Info
quarter update
Progress
report to donor
SMART
Info
month
update
1.
Water facilities
Groundwater points
Groundwater
investigations
(still 2 to be
done next
month)
Marketing in 8
villages
2 groundwater
investigations
Contracting
drilling teams
Start drilling
at 8 sites
3 groundwater
points ready
2 groundwater
points ready
2 groundwater
points ready
2 water
points
ready
2.
Trainings
Training rope
pump
production
Training of 3
drilling teams
Follow
up
training
drilling
teams
3.
Sanitation facilities
Household toilets
3 toilets 8 toilets 14 toilets 14 toilets 14 toilets 14 toilets 4.
School toilets 2 blocks 2 blocks 2 blocks 2 blocks 1 block 5.
Trainings Training toilet
production
Training toilet
production
6.
The above is what we call a living document (we assume that we are in August 2014 so
therefore also some of the texts in this month are no longer red as action has been
executed ont hem already). Everything that has not been realized yet you can put it in
red. Once it is realized you change the color to green and if it is only partly realized and

70 How to introduce SMART Info | Connect International
still needs further action you can color it orange. As circumstances and achievements will
never exactly follow the planning, the document will need to be updated and changed
regularly. For instance when certain products planned to be finalized in one month are
not ready by the end of that month you may decide to shift the planning for all or some
of those products to the next month. At the end of January 2015 the above schedule may
then look as follows:
Result Product group aug-14 sep-14 okt-14 nov-14 dec-14 jan-15 feb-15 Etc.
Project coordination Quarters
SMART Info
month update
SMART Info
month update
(left it to be
caught up next
month)
SMART Info
quarter
update
Meeting with
authorities
SMART Info
month
update
SMART Info
month update
SMART Info
quarter update
Progress
report to donor
SMART
Info
month
update
7.
Water facilities
Groundwater points
Groundwater
investigations
( 2 were
realized in next
month)
Marketing in
villages
Groundwater
investigations
continued
2 groundwater
investigations
Contracting
drilling teams
Start drilling
at 5 (instead
of 8) sites
(other sites
done next
month)
2 (instead of 3)
groundwater
points realized
Drilling started
at 3 remaining
sites planned
last month
(done)
4 (instead of
2)
groundwater
points realized
1 drilling team
stopped
working
2 groundwater
points realized
3 water
points
8.
Trainings
Training rope
pump
production
Training of 3
drilling teams
12 guiding
eventds
6 guiding
events
8 guiding
events
Follow
up
training
drilling
teams
9.
Sanitation facilities
Household toilets
3 toilets (5 less
than was
planned)
4 toilets (4
less than was
planned)
4 toilets (10
less than was
planned!!)
2 toilets (12
less than was
needed;
production
lacks behind.
Needed
training of new
masons;
done , see
below)
14 toilets 22 toilets 10.
School toilets
1 block 1 block 1 block
Training new
masons
needed
2 blocks 3 blocks 11.
Trainings
Training toilet
production
(done next
month)
Training toilet
production
Training toilet
production
Training new
masons
(originally not
planned but
done to boost
production of
toilets)
12.
It is the task of the project coordinator to update the schedule each time when an action
has been completed and assess regularly (e.g. weekly) together with the reports in
SMART Info whether progress is sufficient. With the colors in the overview it is easy to
see where the problems are in terms of progress and realization of actions and products.
Basically it is like a kind of game: get as many cells green as quickly as possible!
Important is that it is a working schedule while in SMART Info all progress and qualitative
data are entered allowing the project coordinator and others to assess overall progress,

Connect International | How to introduce SMART Info 71
quality, utilization in summary and detailed reports that are also suitable for reporting.
Both (the above schedule and the SMART Info reports) should be used together and
compared with each other on a regular basis! The schedule should be used weekly for the
planning of next weeks project activities!
The project coordinator should be ‘on the ground’ regularly to control whether the
involved staff and other implementers do the works properly and whether the works and
finalized products are properly monitored!
A6.1.3 Monthly project check in SMART Info
Each project will need to be checked monthly in SMART Info by the project coordinator.
This does not involve data entry as data can and should be entered every time data
become available (data entry can be done by the project coordinator or by the monitors
or by someone from the admin department, depending on the preferences and way of
working of your organization). Also it does not mean the project coordinator or others
should only once a month look carefully in SMART Info. SMART Info ideally is used daily,
at least weekly by each project coordinator and also by for instance the manager of your
organization.
The SMART Info monthly project check is a structured update and assessment of the
project data in SMART Info, a sort of a mini evaluation to assess and ensure that all data
have been entered in SMART Info, that monitoring has been done in accordance with the
standards and to assess with the SMART Info data whether the QUA aspects of product
activities and finalized products are sufficient and whether progress is good. The check
includes the following steps:
1. Control whether all filled monitoring forms have been entered properly in SMART Info.
Take a few of the already entered forms during the last month, find the filled forms in
SMART Info and compare the answers in the forms and those in SMART Info. If there
are differences you should also control the other forms and improve the data entry
until you are very sure that all data of all forms are entered correctly in SMART Info.
2. Assess both in the summary and in the products report whether progress is sufficient
for all project logics and whether the quality and utilization of the finalized products is
OK. If not assess what the problems are (among others by looking further into the
indicators report what the specific problems are) and introduce proper measures to
improve things structurally.
3. Assess in the suppliers and monitors reports whether some have strange or poor
scores. If so assess further and take appropriate measures.
4. Randomly pick out form SMART Info two or three of the finalized products and visit
these if possible, fill in the monitoring forms yourself for these products and verify

72 How to introduce SMART Info | Connect International
later whether your answers coincide with the answers already in SMART Info for the
products. If there are inconsistencies investigate also for other products entered in the
system and take appropriate measures as far as possible to improve things
structurally!
5. Notify the management of your organizations about any problems you feel need their
attention!
A6.1.4 Introduce project auditors
//still to be described///
A6.1.5 Quarterly project check in SMART Info
//to be completed///
The quarterly project check in SMART Info includes:
1. Assess whether all monitoring forms of the project have been entered in SMART Info
(ask the data typist and the team members to be sure). If not make sure that all
monitoring forms are properly entered in SMART Info.
2. Go to the products report of the project in SMART Info (see paragraph …).
3. Identify which of the cells in the report have a red or an orange color. The aspects
involved with the orange and red cells will need your attention and appropriate action.
For instance, if the monitoring intensity for the product activities of a certain project
logic (project – result- product type – sub-type) colors red it means that the activities
for this project logic have not been monitored sufficiently and you will need to ensure
that your project team members increase the activity monitoring for this project logic.
Remember, not everything has to be perfect. Use your own logic and experience but
try to get things as good as possible. Often people get tired of monitoring and
complain it is always the same. However, don’t forget that because you do the
monitoring there is always pressure on people executing he activities to do things
right. This then becomes and insurance for good quality and as soon as quality does
go down you will detect it quickly and take appropriate action to get to an acceptable
quality again. Make sure also to instruct your team members that if they monitor
something to be not good enough it is not enough that they just indicate this in the
monitoring form. They should do that, but additionally the involved team member
should take appropriate action to improve things. In the monitoring list the team
member should indicate what was observed initially, so if it was bad but he instructed
people to improve things on the spot, he should still give the involved indicator a poor

Connect International | How to introduce SMART Info 73
score in the monitoring form. In the space for comments he can/should explain what
he did to improve things. Then the next time he will pass by to monitor the activity,
the score will hopefully be better (he can even pass by the next day again and monitor
the activity again, so that day the score will be good, so the average score for the
indicator will go up, i.e. of course if people have really improved on executing the
activity).
4. If progress of the realization of certain products is insufficient this can also be seen in
the products report. If so assess how realization of these products can be sped up.
Too low realization of products should also be notified in the Excel sheet discussed
before. In the Excl sheet you can re-plan things and indicate how you will speed up
the realization of the products.
5. Go to the indicator report in SMART Info (see paragraph …). In the same as under
point 2 (above) assess which of the indicators are orange or red. Those one you can
click on the colored cell which will lead you to the underlying details. Assess what and
where things are not OK and make plans how to improve on things. This may require
further training of certain suppliers or others involved with the indicator.
6. Discuss your findings extensively with the project team and make plans for
improvements. Notify the manager of your organization in case of serious problems
and/or problems you don’t know what to do about. In serious cases you may also
have to notify Board members and/or others.
In the overview of the forms for a product it would be good if you can see for which
stage each monitoring form in the list is
In project report wordt percentage critical activity indicators niet goed berekend: na
invoering van 1 kritische activity indicator met ja beantwoord en 1 andere kritische
activity indicator met nee beantwoord levert het resultaat 25% op.

74 Super administrator info | Connect International
Annex 7 Super administrator info
A7.1.1 Make a new product type
A7.1.2 Make a new indicator
If for a new numeric indicator you want to enter for a product type in the product
hierarchy you want the respondent to be able to answer in a number with decimals
behind the comma (or point) you need to indicate this in the box Decimals (a 1 means 1
figure behind the comma, 2 means 2 etc.).


![]project-open[ Reporting & Indicators Options](https://img.pdfslide.us/doc/110x75/54b38ddd4a7959b8468b4655/project-open-reporting-indicators-options-5584a7dd18bb4.jpg)