Embed Size (px)
Citation preview

MITSUBISHI ELECTRIC RESEARCH LABORATORIEShttp://www.merl.com
User-Guided Dimensional Analysis of Indoor BuildingEnvironments from Single Frames of RGB-D Sensors
Xiao, Y.; Feng, C.; Taguchi, Y.; Kamat, V.R.
TR2016-150 November 2016
AbstractIn many construction, facility management, and inspection tasks, dimensional analysis of ge-ometric features and artifacts is significant for spatial analysis and decision making. Taskssuch as as-built geometry modeling and robotic workspace generation need to efficiently in-terpret critical dimensions of specific objects (e.g., diameter of a pipe, width of an opening) ina potentially cluttered environment based on data gathered from various positions. Thispa-per presents a user-guided dimensional analysis approach to automatically acquire geometricinformation from a single frame of an RGB-D sensor. In the first step, an RGB-D sensoris used to capture three-dimensional (3D) point clouds of building environments. Then, byextracting planes and performing geometric analysis, the dimensional information of objectsof interest is obtained from a single frame. The designed user guidance system evaluates thecompleteness of the acquired data, and then provides interactive guidance for moving thesensor to acquire complete data, from which stable and accurate geometric measurementscan be obtained. The proposed method has been tested on hallways, door frames, and stairsin a building environment. The experimental results demonstrate that the method offers sig-nificant promise in enabling dimensional analysis in a wide variety of realtime measurementcontexts.
Journal of Computing in Civil Engineering
This work may not be copied or reproduced in whole or in part for any commercial purpose. Permission to copy inwhole or in part without payment of fee is granted for nonprofit educational and research purposes provided that allsuch whole or partial copies include the following: a notice that such copying is by permission of Mitsubishi ElectricResearch Laboratories, Inc.; an acknowledgment of the authors and individual contributions to the work; and allapplicable portions of the copyright notice. Copying, reproduction, or republishing for any other purpose shall requirea license with payment of fee to Mitsubishi Electric Research Laboratories, Inc. All rights reserved.
Copyright c© Mitsubishi Electric Research Laboratories, Inc., 2016201 Broadway, Cambridge, Massachusetts 02139


1Ph.D. Candidate, Tishman Construction Management Program, Dept. of Civil and Environmental Engineering, Univ. of
Michigan, 2350 Hayward St., Suite 1306 G.G. Brown Bldg., Ann Arbor, MI 48109 (corresponding author). E-mail:
2Visiting Research Scientist, Mitsubishi Electric Research Laboratories, 201 Broadway, 8th Floor Cambridge, MA
02139. E-mail: [email protected]
3Senior Principal Research Scientist, Mitsubishi Electric Research Laboratories, 201 Broadway, 8th Floor Cambridge,
MA 02139. E-mail: [email protected]
4Professor, Tishman Construction Management Program, Dept. of Civil and Environmental Engineering, Univ. of
Michigan, 2350 Hayward St., Suite 2340 G.G. Brown Bldg., Ann Arbor, MI 48109. E-mail: [email protected]
User-Guided Dimensional Analysis of Indoor Building
Environments from Single Frames of RGB-D Sensors
Yong Xiao1, Chen Feng2, Yuichi Taguchi3, and Vineet R. Kamat4
ABSTRACT
In many construction, facility management, and inspection tasks, dimensional analysis of
geometric features and artifacts is significant for spatial analysis and decision making. Tasks
such as as-built geometry modeling and robotic workspace generation need to efficiently
interpret critical dimensions of specific objects (e.g., diameter of a pipe, width of an opening)
in a potentially cluttered environment based on data gathered from various positions. This
paper presents a user-guided dimensional analysis approach to automatically acquire
geometric information from a single frame of an RGB-D sensor. In the first step, an RGB-D
sensor is used to capture three-dimensional (3D) point clouds of building environments. Then,
by extracting planes and performing geometric analysis, the dimensional information of
objects of interest is obtained from a single frame. The designed user guidance system
evaluates the completeness of the acquired data, and then provides interactive guidance for
moving the sensor to acquire complete data, from which stable and accurate geometric
measurements can be obtained. The proposed method has been tested on hallways, door
frames, and stairs in a building environment. The experimental results demonstrate that the
method offers significant promise in enabling dimensional analysis in a wide variety of real-
time measurement contexts.
Keywords

User guidance; Dimension; RGB-D sensor; Indoor scene; Geometric measurement

Introduction
Three-dimensional (3D) geometry and, in particular, dimensional information about the built
environment is required in a wide range of civil infrastructure applications (Bosché 2010). During
the construction phase, dimensional information must be monitored on site so that the work can
meet the requirements of the design and specifications. During the maintenance phase, dimensional
information is necessary to check whether the built environment remains consistent with existing
building codes and to quantify any developed flaws (e.g. deformations). In addition, in the context
of construction automation, dimensional information is useful for any robot performing tasks in the
construction or built environment. For example, a door installing robot must consider the actual size
of the door frame on a construction site instead of the designed size due to potential tolerance
discrepancies. Given such dimensional information, the robot is able to install a door correctly and
ensure that it can fit the panel in a frame accurately. In addition, the dimensions of any openings are
significant for an autonomous robot while moving in indoor environments. For example, when
passing through a door, a robot has to detect the dimension of the opening space so that it can make
an informed choice about whether to directly go through this door or to find another way.
Traditionally, dimensional information in the built environment is manually obtained by tape
measurements, which is labor intensive and has limited accuracy. With the rapid development of
sensors for capturing 3D point clouds, geometric models of the civil infrastructure can be obtained
rapidly and accurately, thereby making the automatic retrieval of infrastructure dimensions a
possibility. In order to obtain accurate dimensions of civil infrastructure, laser scanners are widely

used to capture high-accuracy 3D point clouds to build 3D models that contain detailed dimensional
information (Bennett 2009; Huber et al. 2010; Xiong et al. 2013). However, Tang et al. (2010)
pointed out that this process is usually time-consuming and not fully automated.
Instead of using 3D laser scanners, RGB cameras (Bae et al. 2014; Brilakis et al. 2011;
Golparvar-Fard et al. 2011) can be used to capture a series of images that are then processed using
structure from motion (SFM) to generate 3D point clouds. This method is able to obtain point clouds
for large-scale scenes and has a shorter data acquisition time compared to methods that use laser
scanners. Another commonly used method to obtain colored 3D point clouds is to employ stereo
cameras that are composed of two RGB cameras (Fathi and Brilakis 2011) or to utilize RGB-D
cameras consisting of an RGB camera and a depth camera (Chen et al. 2015; Zhu and Donia 2013).
One of the benefits of utilizing stereo or RGB-D cameras is that these cameras enable obtaining
point clouds from single frames and thus performing data analysis in real time. Moreover, colored
3D point clouds provide the opportunity to extract semantic information compared to point clouds
generated from laser scanners (Golparvar-Fard et al. 2011). Therefore, stereo or RGB-D cameras are
well suited for geometry and dimension interpretation from 3D point clouds in contexts where
human users or robots need to interact with the built environment in real time.
In this paper, we propose a user-guided dimensional analysis approach that is able to compute
dimensions in indoor built environments using a color and depth (RGB-D) sensor. The method
performs dimensional analysis on a single frame obtained from an RGB-D sensor to achieve high

computational efficiency and to avoid error accumulations in multi-frame registration. Due to the
limited field of view and measurement range of the sensor, a single frame cannot guarantee that all
dimensional information of interest can be computed. Therefore, a knowledge-based user guidance
system is developed to guide a user (or a robot) to move the sensor to a better position so that
complete data suitable for dimensional analysis is collected. After a complete frame data is collected,
the geometric analysis is performed to obtain the necessary dimensional information.
The remainder of the paper is organized as follows: Section 2 reviews related work and outlines
its limitations. Section 3 describes the designed method in detail. Section 4 describes the conducted
experiments and the obtained results. Finally, Section 5 draws conclusions and discusses ongoing
and future work.
Previous Work
In the context of getting dimensional information from built environments, several research
studies have focused on creating 3D models by using high-end 3D laser scanners (2D rotational
laser scanners or terrestrial laser scanners), which can provide accurate and rich 3D point clouds of a
large environment. Budroni and Boehm (2010) used a plane sweep algorithm and a priori
knowledge to segment point clouds into floors, ceilings, and walls, and created a 3D interior model
by intersecting these elements. Since this method utilized the Manhattan-world assumption to obtain
rectangular primitives for objects, it failed to handle complicated geometric primitives or
complicated structures. Nüchter and Hertzberg (2008) used semantic labeling to find coarse scene

features (e.g., walls, floors) of indoor scenes from point clouds obtained by a 3D laser scanner. They
employed common-sense knowledge about buildings to label planar surfaces as wall, floor, ceiling,
and door. Díaz-Vilariño et al. (2015) combined laser scan data and high-resolution images to detect
interior doors and walls and automatically obtained optimized 3D interior models. Instead of
primarily utilizing planes from point clouds, Dimitrov and Golparvar-Fard (2014) presented a new
method to segment point clouds into non-uniform B-spline surfaces for as-built modeling.
In addition, several researchers have also used high-accuracy laser scanners to obtain 3D models
of dynamic construction environments and equipment. Wang and Cho (2015) designed a smart
scanning system to rapidly identify target objects and update the target’s point clouds. They then
used concave hull surface modeling algorithms to get a 3D surface model. Cho and Gai (2014) used
laser scanners to obtain 3D point clouds of the environment and identified 3D target models by
comparing them to a model database. The field results of these two papers demonstrated that the
method could improve productivity and safety in heavy construction equipment operations. Brilakis
et al. (2010) explored a framework for automated generation of parametric building information
models (BIMs) of constructed infrastructure from hybrid video and laser scanning data. They
developed several automated processes for generating BIMs from point clouds, for example,
automated generation of colored point clouds from video and laser scanner data, and automated
identification of most frequently occurring objects. A drawback of these approaches that use high-
end 3D laser scanners is that they need professional setup and operation (e.g., attaching markers in
the environment for registering point clouds). Moreover, the post-processing methods used to

extract 3D models from point clouds are time-consuming and labor intensive since such sensors
typically obtain millions of points to represent surfaces as point clouds.
Instead of using high-accuracy laser scanners, simultaneous localization and mapping (SLAM)
techniques have been widely used for registering multiple 3D frames and obtaining 3D models of
large-scale environments with affordable sensors (e.g. low-cost RGB-D sensors, cameras).
Newcombe et al. (2011) presented KinectFusion, which employed an iterative closest point (ICP)
algorithm to register a current depth map to a global model reconstructed by fusing all previous
depth maps. Taguchi et al. (2013) proposed the point-plane SLAM system that uses both points and
planes as primitives to achieve faster correspondence search and registration of data frames, and to
generate 3D models composed of planar surfaces. Cabral and Furukawa (2014) proposed a method
for reconstructing a piecewise planar and compact floor plan from multiple 2D images, which
provides an improved visualization experience albeit with fewer geometric details. Although the 3D
models generated by these methods enable dimensional analysis in large-scale environments, the
accuracy is limited due to drift error accumulations in multi-frame registration.
Unlike previous work, the method described in this paper aims to obtain dimensional information
of indoor scenes from a single frame of an affordable RGB-D sensor. The proposed single-frame
approach avoids the error accumulation problems inherent in multi-frame registration. In order to
overcome the limitations of a single frame, such as the limited field of view and measurement range,

this paper describes a user guidance system that provides directional feedback for the user to obtain
complete data suitable for dimensional analysis.
The most relevant prior work to our paper is Kim et al. (2012) which presented a hand-held
system for real-time interactive acquisition of residential floor plans. The system described in that
paper integrates an RGB-D sensor, a micro-projector, and a button interface to help the user capture
important architectural elements in indoor environments. Instead of obtaining the floor plan of a
building using a SLAM technique as in Kim et al. (2012), the method in this paper focuses on
obtaining dimensional information of specific objects in indoor environments from a single frame.
Moreover, the designed user guidance system guides the user in observing essential components for
specified scenes.
The proposed user guidance system was inspired by Richardson et al. (2013) and Bae et al.
(2010). Richardson et al. (2013) presented a user-assisted camera calibration method that suggests
the position of calibration targets in the captured images to obtain reliable, stable, and accurate
camera calibration results. Bae et al. (2010) proposed the computational rephotography system that,
given a reference image, guides the user to capture an image from the same viewpoint. In order to
obtain accurate dimensional information from a single frame of an RGB-D sensor, the proposed user
guidance system evaluates the completeness of the current frame and then instructs the user to move
the sensor to get improved results for the application. Using basic guidance, the proposed system

can lead a non-expert user through the steps necessary to obtain complete data and thus accurate
dimensional measurements.
Dimensional Analysis – Technical Approach
In this paper, the focus of the dimensional analysis is on civil infrastructure with planar surfaces
in indoor environments using an RGB-D sensor. The proposed framework is shown in Fig. 1. Firstly,
one frame of 3D point clouds (for example Fig. 1 (a)) is acquired by an RGB-D sensor. Then, the
preprocessing is conducted on the point clouds to extract planar surfaces and compute topological
relationships of these planes (Fig. 1 (b)). Based on the planes and their topological relations, the
geometric analysis is performed to compute the initial dimensions of the scene (Fig. 1 (c)).
Combining the scene type and the initial dimensional measurements, the user guidance system
evaluates the completeness of the current frame and dimensional measurements. If the data frame
does not contain all components for computing the dimensions, the user guidance system provides
instructions for moving the sensor to get a complete frame and thus accurate dimension
measurements. Therefore, a new frame data (Fig. 1 (d)) is captured by the sensor. The same
processes, i.e. preprocessing (Fig. 1 (e)) and geometric analysis (Fig. 1 (f)), are performed to acquire
new dimensions, which have a higher quality and are used as the final dimension estimation results.

Preprocessing: extract
planes and their
topological relationships
Geometric Analysis:
estimate initial
dimenions
User Guidance: compare shape
estimation with the template
and provide guidance
Complete
frame?
Final
Dimensions
Yes
Depth Sensor
Guidance for moving
sensor: move the
sensor higher
No
3D Data generation:
generate 3D point cloud
from depth sensor
(a) One frame of 3D point clouds
(b) Preprocessing results
(c) Initial dimension estimation
(d) Another frame of 3D
point clouds
(e) Preprocessing results
(f) New dimension estimation
Shape Template
Fig.1. System Framework

Data Preprocessing
In this paper, it is assumed that the object of interest is composed of, supported by, or surrounded
by planar surfaces. Since the proposed method is intended for dimensional analysis of indoor scenes,
this assumption is reasonable as the common objects in indoor scenes have planar surfaces. Based
on this assumption, the geometric analysis is performed to obtain dimensional information of
specific infrastructure elements.
In order to extract planar surfaces efficiently, the fast plane extraction algorithm for organized
point clouds proposed by Feng et al. (2014) is employed. This algorithm first segments the point
clouds into groups and uses them as nodes to create a graph. Then, an agglomerative hierarchical
clustering is performed on this graph to merge nodes on the same plane. Finally, the planes are
refined by pixel-wise region growing.
This paper focuses on estimating dimensions by utilizing plane topological relationships, which
enables us to obtain robust and accurate measurements. Therefore, once all the planes are extracted
from the point clouds, the topological relationships among these planes are estimated based on the
plane parameters. Four types of plane topological relations of interest are defined as follows:
· Parallel: if the normal vectors of two planes are parallel to each other, the two planes are
parallel planes.
· Coplanar: if two planes have the same geometric parameters, they are coplanar planes.
Coplanar planes are also parallel planes.

· Intersecting: if two planes are not parallel to each other, they are intersecting planes.
· Perpendicular: if the normal vectors of two planes are perpendicular (orthogonal to each
other), the two planes are perpendicular.
It should be noted that due to the uncertainty in sensor measurements, these relationships are
approximately ascertained. For example, if the angle of the normal vectors between two planes is
less than a specified α degrees, they are considered as parallel planes (α is empirically set as five to
avoid classifying non-parallel planes as parallel due to large α or failure in detecting the parallel
plane relationship).
Geometric Analysis
If all the measurements from the sensor were perfect, the dimensional information could be
directly computed based on the geometric representations of the infrastructure. However, the sensor
measurements have uncertainty inevitably and thus the geometric representations estimated from the
point clouds are not perfect. In order to get robust and accurate dimensional information, least
squares methods are utilized to mitigate measurements uncertainty. In this paper, based on the scene
types and experimental scenarios, the distance between two parallel planes and the distance between
boundary points of coplanar planes are of interest. In addition, these two distances are also of
interest in general for indoor environments which contain many regular planar surfaces. Methods for
these two distance computations are proposed to obtain robust estimation.

Distance between Parallel Planes
After extracting the planes, the plane parameters are estimated from the points by least squares.
Given the set of points !"# = $%"
#, &"# , '"
#(, ) = 1, … , * assigned to Plane +, whose parameters are
represented by - = [." , /" , 0" , 2"]3 , the plane equation ."%"# + /"&"
# + 0"'"# + 2" = 0 needs to be
satisfied for all the * points. Thus, a homogeneous system can be constructed as
6- = 0 (1)
where the matrix 6 can be constructed by stacking the row vectors $%"# , &"
# , '"# , 1(. In order to get the
least squares estimation, one possible solution is to perform singular value decomposition (SVD)
(Mandel, 1982) on the matrix 6 and then the plane parameters - can be extracted from the results of
SVD. By the SVD theory a 7 × 8 real matrix 6 can be decomposed as 6 = 9:;3 where 9 is a
7 × 7 unitary matrix (i.e. 993 = <), > is a 7 × 8 diagonal matrix with non-negative values, and ;
is a 8 × 8 unitary matrix. In order to find a least-squares solution, by imposing the constraints
‖-‖ = 1, the solution aims to minimize ‖6-‖. As the rank of 6 is 8 (7 > 8 for our data), the
solution of Equation (1) is the last column of ;.
Since it is assumed that there exist parallel plane sets, the plane parameter estimation results can
be made more accurate by using this prior information. Suppose Plane + and Plane A are parallel to
each other and the sets of points assigned to these planes are given as !"#, ) = 1, … , * and !B
C , D =

1, … , E. To enforce the parallel constraint, Plane + and Plane A share the same normal vector and the
equations are defined as
.%"# + /&"
# + /'"# + 2" = 0
.%BC + /&B
C + 0'BC + 2B = 0
(2)
Then a homogenous system similar to Equation (1) can be constructed with - = $., /, 0, 2" , 2B(3 and
the matrix 6 constructed by stacking $%"# , &"
# , '"# , 1,0( and $%B
C , &BC , 'B
C , 0,1(. Therefore, by using SVD
the plane parameters of parallel planes are computed using all the points on the planes.
Once the plane parameters are obtained, the distance 2"B between the parallel planes is calculated
directly based on the plane parameters as
2"B =
|2" − 2B|
√.I + /I + 0I
(3)
Distance between Boundary Points of Coplanar Planes
The coplanar planes boundary points refer to boundary points that are located between the two
coplanar planes. For example, when measuring the width of the door while the door height is too
high to be observed, the points on the wall near the door will be captured as two coplanar planes. To
obtain the width of the door, the door frame points are extracted and used as the coplanar planes

boundary points. In this context, the door width is the distance between boundary points of two
coplanar planes as shown in Fig. 2 (a).
(a) Coplanar plane points (b) Boundary points of coplanar points
(c) Coplanar plane boundary points (d) Line fitting and distance computations
Fig. 2. Estimation of the distance between two coplanar planes
In order to automatically find door frames, firstly the topological relationships between extracted
3D planar surfaces are estimated based on the plane fitting results. After detecting the coplanar
planes, all the coplanar planes are rotated based on the plane parameters to make sure that the
normal of the plane is parallel to the new Y axis and all Y values of the rotated points are almost the
same. Then the boundary points (Fig. 2 (b)) of the two planar surface, JKL and JKI, are separately

extracted by using the 2D alpha shape algorithm (Bernardini and Bajaj 1997). The 2D alpha shape
algorithm moves a circle at a radius of M in the space while the circle must only contain points on its
boundary and no points are allowed inside of the circle. Those points that allow the circles are the
boundary points extracted by the 2D alpha shape algorithm. Based on the boundary points of each
surface, the coplanar planes boundary points NKL and NKI (Fig. 2 (c)), are obtained by utilizing a
nearest points searching method. Finally, as shown in Fig. 2 (d) a pair of parallel lines DL and DI are
fitted from NKL and NKI using the similar method in the previous section. The two 2D lines are
defined as
.%L" + /'L
" + 0L = 0.%I
B + /'IB + 0I = 0
(4)
where [., /, 0L] and [., /, 0I] are respectively the geometric parameters of the two 2D lines of
NKL and NKI, and O%L" , 'L
" P is the +-th point of NKL while O%IB , 'I
BP is the A-th point of NKI. Therefore,
a homogeneous system described by Equation 1 can be obtained where - = [., /, 0L, 0I] and 6 is
constructed by stacking [%L" , 'L
" , 1,0] and [%IB , 'I
B , 0,1]. Based on the geometric parameters of the two
2D lines, the distance 2LI between the two lines is computed as the following
2LI =
|0L − 0I|
√.I + /I (5)
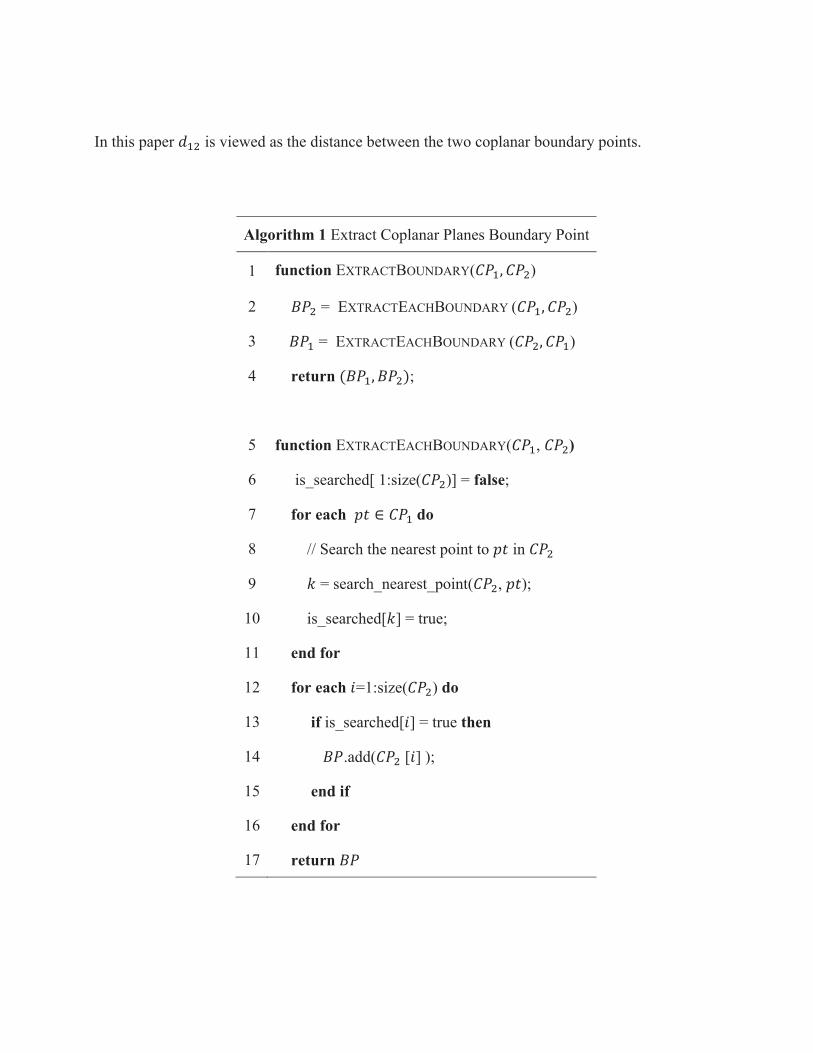
In this paper 2LI is viewed as the distance between the two coplanar boundary points.
Algorithm 1 Extract Coplanar Planes Boundary Point
1 function EXTRACTBOUNDARY(JKL, JKI)
2 NKI = EXTRACTEACHBOUNDARY (JKL, JKI)
3 NKL = EXTRACTEACHBOUNDARY (JKI, JKL)
4 return (NKL, NKI);
5 function EXTRACTEACHBOUNDARY(JKL, JKI)
6 is_searched[ 1:size(JKI)] = false;
7 for each ST ∈ JKL do
8 // Search the nearest point to ST in JKI
9 ) = search_nearest_point(JKI, ST);
10 is_searched[)] = true;
11 end for
12 for each +=1:size(JKI) do
13 if is_searched[+] = true then
14 NK.add(JKI [+] );
15 end if
16 end for
17 return NK

In order to automatically extract the coplanar planes boundary points, a nearest point searching
method (Algorithm 1) is proposed. The boundary points of the two planes, JKL and JKI , are
separately extracted and used as input for that algorithm. For the first plane, for each point in JKL,
the nearest point in the second plane boundary points JKI is searched (Algorithm 1 Lines 7-11).
After iterating all the points on the first plane, the points in JKI that have been searched as the
nearest points, NKI, belong to the coplanar boundary points from the second plane (Algorithm 1
Lines 12-16). By repeating the process for the second plane, the coplanar planes boundary points on
the first plane, NKL, can be also found.
This method utilizes the nearest neighbor search strategy to approximately find the coplanar
planes boundary points. Since it employs the boundary points of each plane and the nearest neighbor
search, it tends to prefer the point that is located closer to the other plane and thus to find a subset of
the true coplanar planes boundary points. However, these points are sufficient for computing the
distance between two coplanar planes as they are extracted from the boundary points of the two
planes. In addition, this method utilizes the boundary points of the two coplanar planes, which
reduces the computation time.
User Guidance
The goal of the user guidance system is to generate instructions for moving the sensor to poses
where the sensor can capture complete frames that contain all necessary elements of the scene and
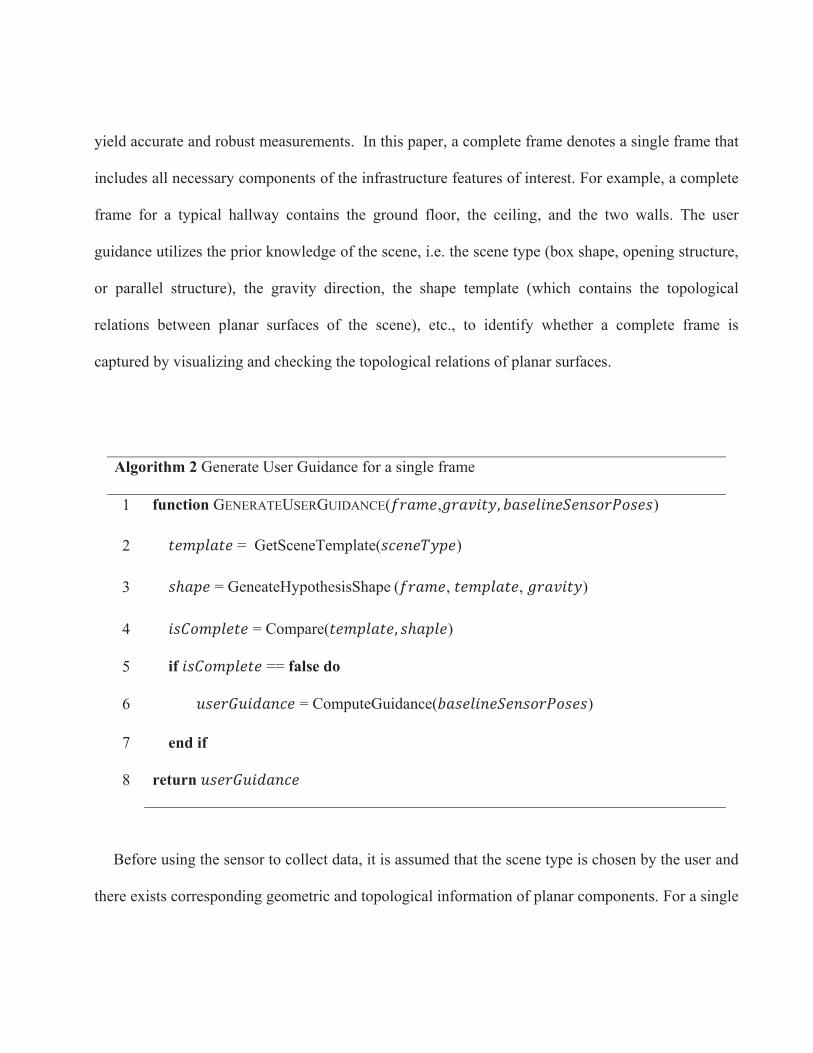
yield accurate and robust measurements. In this paper, a complete frame denotes a single frame that
includes all necessary components of the infrastructure features of interest. For example, a complete
frame for a typical hallway contains the ground floor, the ceiling, and the two walls. The user
guidance utilizes the prior knowledge of the scene, i.e. the scene type (box shape, opening structure,
or parallel structure), the gravity direction, the shape template (which contains the topological
relations between planar surfaces of the scene), etc., to identify whether a complete frame is
captured by visualizing and checking the topological relations of planar surfaces.
Algorithm 2 Generate User Guidance for a single frame
1 function GENERATEUSERGUIDANCE(VW.7X,YW.Z+T&, /.\XD+8X^X8\_WK_\X\)
2 TX7SD.TX = GetSceneTemplate(\0X8X`&SX)
3 \ℎ.SX = GeneateHypothesisShape (VW.7X, TX7SD.TX, YW.Z+T&)
4 +\J_7SDXTX = Compare(TX7SD.TX, \ℎ.SDX)
5 if +\J_7SDXTX == false do
6 b\XWcb+2.80X = ComputeGuidance(/.\XD+8X^X8\_WK_\X\)
7 end if
8 return b\XWcb+2.80X
Before using the sensor to collect data, it is assumed that the scene type is chosen by the user and
there exists corresponding geometric and topological information of planar components. For a single

frame, the system tries to identify the components of a scene and recover a hypothesis shape which
is used for generating the user guidance for moving the sensor (Algorithm 2 Line 3). The system
checks the completeness of the current frame by comparing the shape template and the hypothesis
shape (Algorithm 2 Line 4). In order to generate quantitative guidance for the user, the user
guidance system utilizes some of the sensor poses that are able to observe complete frames as
baseline sensor poses. When an incomplete frame is obtained, by comparing the current sensor pose
with the baseline sensor poses (Algorithm 2 Line 6), the user guidance proposes quantitative
movement suggestions of the sensor to the user. The generated guidance describes the sensor
movement suggestions in terms of translation and rotation of the sensors with respect to the default
sensor coordinate system. In the text, for the sake of illustration, simple cases of user guidance are
used and the user guidance is described in words that are more user-friendly for human users. The
user guidance generation stops if a complete frame is observed. The detailed user guidance system
will be described for three general cases - box shape, opening structure, and parallel structure.
Box Shape
A box shape is defined as the shape that contains two sets of two parallel planes while the two
sets are perpendicular to each other. As shown in Fig. 3 (a), Plane d and J are parallel to each other,
so are Plane N and e. Moreover, Plane d is perpendicular to Plane e. The solid lines in Fig. 3 (a)
denote the intersection lines between two intersection planar surfaces. A typical example of a box
shape is a hallway in indoor scenes and this paper uses a hallway as an example to illustrate the
method. To get the dimension of this structure (the width and height of the hallway), the points from

all the four planes (d, N, J, and e) should be observed by the sensor. Therefore, the sensor at the
baseline poses should be in the center of the hallway and almost horizontal with its view direction
parallel to Plane d. When the sensor acquires an incomplete frame which does not contain data from
all the four planes, the user guidance will identify the incompletion of the frame and provide user
guidance for moving the sensor to capture sufficient points from all the four planar surfaces.
Since a typical hallway (composed of two walls, a ceiling, and a ground floor) is usually 2~3
meters high, an RGB-D sensor like Kinect is able to capture points from at least three planes of that
hallway. When the sensor is too high away or too close to the ground floor, the ceiling or the ground
floor cannot be observed by the sensor. If one planar surface is not obtained in the data, the
geometric analysis is performed based on the partial data. Based on the prior information (i.e. the
scene type, the related shape template and baseline sensor poses) and the captured data, the
hypothesized shape is reconstructed to evaluate the completeness of this frame so as to guide the
user.
(a) The box shape template
(b) An incomplete frame and
dimension measurements
(c) The hypothesis shape
and the user guidance
(d) A complete frame and
new dimension
measurements
Fig. 3. Box shape user guidance

Fig. 3 shows an example of the user guidance for a box shape. Fig. 3 (a) displays a priori
knowledge about the box shape template, where gray shapes denote planar surfaces. This shape
template also contains geometric and topological information of all the four planes. As shown in Fig.
3 (b), Plane e (i.e., the ground floor) is not detected in the data because it is too close to the sensor
(closer than the minimum measurement distance of the sensor). Based on the observed planes and
the shape template, the user guidance system generates a hypothesis box shape from that frame.
Since the ceiling and the two walls are measured in the data, the intersection lines between the three
planar surfaces can be derived, as denoted by the two solid lines (in fact horizontal) in Fig. 3 (c). By
vertically extending the end points (which are computed according to the line equation and the
measured point clouds) of the two solid lines, the two vertical dotted lines are hypothesized and the
other end points of the dotted lines are found based on their equations and the point clouds. The last
two dotted lines are created by extending the end points while keeping it parallel to the two
horizontal solid lines. Hence, the box shape (the red lines in Fig. 3 (b)) is constructed for this frame
and an abstract template (Fig. 3 (c)) is also created. However, the height is not accurate since it is
computed by hypothesizing the vertical dotted lines and their end points. By comparing the shape in
Fig. 3 (c) and the shape template in Fig. 3 (a), the system identifies the fact that Plane e is not
observed and then the user guidance system compares the current sensor pose with baseline sensor
poses of the box shape and generates guidance for the user to move the sensor higher to obtain the
accurate height.

Since the system detects that there are no points from Plane e, the system instructs the user to
move the sensor higher in order to get points from Plane e, the floor. By following the guidance, the
sensor is moved higher and then a new and better frame is obtained as shown in Fig. 3 (d). In this
frame, all the four planes can be extracted from the point clouds and a box shape similar to the
template can be constructed without using any hypothesis. Thus, both the height and the width of the
hallway can be computed by geometric analysis.
It should be noted that by assuming the sensor is held almost horizontally, even though only one
plane is observed, the user guidance system is still able to generate user guidance for moving the
sensor to find complete frames. For example, if Plane d is observed, based on the sensor pose
assumption, the user guidance system will identify that at least a wall is captured and provide
guidance for moving or rotating the sensor right or left to capture more data. Similarly, if two planes
are captured by the sensor, the user guidance system works well too.
Opening Structure
An opening structure is defined as an opening in a planar surface, i.e., a rectangular hole within a
planar surface. In this paper, a door frame that is indented in a wall is used as an example of an
opening structure. Since most doors in this paper are located in the hallways, it is difficult to obtain
both its width and height as the sensors cannot move as far from the door as possible when it is
facing the door. Therefore, this paper currently focuses on estimating the width of a door. As shown
in Fig. 4 (a), Plane d and Plane N are vertical walls and they are on the same plane (their topological

relation is coplanar). In order to get accurate width of the opening, the two planes d and N are
necessary to provide constraints to reconstruct the shape of the opening. Thus, the user guidance is
implemented to ensure that the two planes are observed by the sensor at an optimal pose, where the
sensor at the baseline poses is almost horizontal and its view direction is orthogonal to Plane d
and N, and moreover, it is close to the center of the opening.
Fig. 4 displays an example of the user guidance for an opening shape. The opening shape
template is shown in Fig. 4 (a), where gray shapes denote planar surfaces and solid lines are
components of the shape. For example, if Plane N is not captured in the data, a candidate wall is
identified as follows: first the centroids of Plane d and Plane J are projected onto a line that passes
the sensor position and is perpendicular to both Plane d and J; since the projected point of the wall
should be closer to the sensor compared to that of a door, Plane d is detected as a candidate wall. By
assuming the door width, the system can still reconstruct an estimated shape as shown in Fig. 4 (b).
Here the vertical solid line is estimated by fitting a line using the boundary points between the two
parallel surfaces, while the vertical dashed line is hypothesized from the door width assumption. By
comparing Fig. 4 (c) and (a), the user guidance system identifies that another wall, i.e., Plane N, is
missing in the current frame. Therefore, using the baseline poses, the system instructs the user to
move the sensor right so that the data of Plane N can be observed by the sensor. In this way, a new
frame with better quality data that contains Plane d and N is obtained (Fig. 4 (d)). Thus, the door
width is computed using the method for estimating the distance between boundary points of
coplanar planes.

(a) Opening structure user
guidance
(b) An incomplete frame
and dimension
measurements
(c) The hypothesis shape
and the user guidance
(d) A complete frame and
new dimension
measurements
Fig. 4. Opening structure user guidance
It should be noted that for the simplicity of illustration, in Fig. 4 only translation related user
guidance is discussed. In fact, by comparing with the baseline poses, the user guidance also
produces sensor movement guidance in terms of orientation. For example, using the incomplete
frame in Fig.4 (b) as an example, the normal vector fg of the candidate door plane, i.e. Plane J , is
on the right of the view direction hijkif fg and hijk are both pointing to the door. To make and
fg and hijk point to the same direction, the sensor should be rotated right in order to approach the
baseline poses for observing complete frames.
Parallel Structure
A parallel structure is composed of multiple parallel planes. In this paper, the stair is used for an
example of parallel structures. The critical dimensions of a parallel structure are the distances
between parallel planes. For stairs, interesting dimensions are defined as follows (Fig. 5): the width

is defined as the distance between two consecutive vertical planes and the height is defined as the
distance between two consecutive horizontal planes.
(a) The definition of stair width and height in a side view
of a stair.
(b) The definition of stair width and height in a typical
stair.
Fig. 5. Stair dimensions
There are two reasons for using parallel planes in the dimension definition. Firstly, for most
applications in robotics and civil engineering, the dimensions defined in this way are sufficient even
though stairs usually contain some protruding parts, for example, stair nosing (the protruding part of
a tread), and bump to avoid slipperiness on the tread. Secondly, from a practical perspective, it is
complicated to fit a perfect rectangle for point clouds since the sensors usually fail to obtain all
points of edges. Moreover, the methods utilizing least squares estimation to fit a rectangle to point
clouds are inclined to obtain a smaller rectangle compared to the ground truth. Therefore, we use the
distance between two parallel planes to define the dimensions of interest and this definition also
provides hints for the subsequent user guidance.

In order to obtain the width and height of the stairs, two sets of parallel planar surfaces must be
presented in the point clouds. Since the width and height of a stair are close to each other, the sensor
is able to get sufficient points from both horizontal and vertical planes if its view direction is around
45 degrees with respect to both the horizontal and vertical planes of stairs. Based on this principle,
the user guidance system estimates its orientation with respect to the stairs and then provides
corresponding instructions for moving the sensor to get more vertical and horizontal planes.
(a) The parallel structure
template
(b) An incomplete frame (c) The hypothesis shape (d) A complete frame and
Fig. 6. Parallel structure user guidance
Fig. 6 shows an example of the user guidance system for the stair. The template of the stair is
shown in Fig. 6 (a). In Fig. 6 (b) several vertical planar surfaces and a horizontal planar surface are
observed in that frame. In this case, only the width of the stair is able to be computed from the
vertical surfaces by the geometric analysis. Based on the assumption of the shape template (Fig. 6
(a)) and the frame data, the height of the stair can be approximately computed by estimating the
height of several vertical planar surfaces. Thus, as shown in Fig. 6 (c), an instantiation of the shape
template based on the data is derived from the frame data while the width has a good accuracy and

the height has a poor accuracy. Based on Fig. 6 (c) and the relative position and orientation of the
sensor with respect to the stairs, the user guidance system provides guidance for moving the sensor
to a better position with a better orientation. In this case, the sensor should be rotated toward the
ground in order to obtain more points from the horizontal planes (Fig. 6 (d)).
Experiments and Results
Experimental Setup and Sensor Calibration
In the conducted experiments, a Kinect for Xbox 360 sensor is used as the RGB-D sensor to
obtain 3D point clouds of indoor scenes. This sensor can capture images with a resolution of
640x480 and work at a frame rate of 30 fps. The suggested operation range of this sensor is 0.8 to
5.0 meters and the depth resolution decreases quadratically with increasing distance from the sensor
(approximately 7cm at the range of 5m) (Khoshelham and Elberink 2012).
The RGB-D camera has an infrared (IR) camera and a color (RGB) camera. With the assistance
of an IR laser emitter, the IR camera is able to get a depth image of the environment. Meanwhile,
the RGB camera is able to capture a color image. By using the intrinsic parameters of the two
cameras and the relative transformation between the two cameras, the colored 3D point clouds can
be computed from the color image and the depth image. When the Kinect sensor is factory-
assembled, the IR sensor and the RGB camera are fixed relative to each other and thus there exist
default parameters for the two cameras, including the intrinsic parameters and their transformation
matrix. However, due to imperfections in the manufacturing process, these default parameters
cannot be expected to be exact for all Kinect sensors. Therefore, it is necessary to calibrate the
Kinect sensor if it is used for applications that require high and repeatable accuracy. The sensor
calibration in this paper aims to obtain intrinsic and extrinsic parameters of the Kinect sensor and
thus obtain accurate 3D colored point clouds from the sensor. By viewing the Kinect as a stereo
system, a stereo camera calibration method is utilized to calibrate the Kinect and obtain its intrinsic
parameters, and the extrinsic parameters between its IR camera and RGB camera.
The sensor is calibrated before gathering data. During the calibration, the IR emitter is covered
by an opaque object and thus the IR sensor can obtain intensity instead of depth. To enable the IR
sensor to capture a bright image, a lamp is used to provide more illumination for the calibration
markers. In addition, to enable higher marker detection results, a fiducial marker system based on
AprilTags (Olson 2011) is used instead of traditional checkboard for calibration. Based on multiple
pairs of images by the IR sensor and the RGB sensor, the calibration obtains the parameters of the
stereo system.
To fully utilize the knowledge of the measured indoor environment, during the experiments the
sensor should be held almost horizontally to the extent possible by the user, which ensures that the
gravity direction is consistent with the assumption used in recognizing components of scenes. The
sensor can be tilted a little bit as a tolerance (±15m within the desired gravity direction) is added to
check the gravity direction. Within this context, for a hallway, the floor is almost horizontal while
the wall is almost vertical in the point clouds. This assumption is reasonable in terms of the potential
applications. For a robotic platform, it is easy to mount the sensor in this position. For a user holding
the device, the sensor can be easily adjusted to meet this assumption.
Regarding the user guidance, the scene type, i.e. box shape, opening structure, or parallel
structure, is selected by the user. The user guidance utilizes the shape template of the scene and
geometric analysis to identify these planar components and the completeness of the frame. If the
frame is incomplete, the system will generate user guidance and prompt it in the command window
for the user. The correctness of the generated user guidance is highly dependent on the geometric
analysis results, especially the components detection results for the specific scene type. For example,
when observing the door, if one frame only contains the partial data from a cuboid recycle bin and
the wall, the system will identify the wall as a candidate door while viewing the recycle bin as a
candidate wall. In this context, the user guidance provided by the sensor will not be able to help find
the correct door. In summary, for the current implementation, if the observed scene matches the
designated shape template and the components identification is correct, the system can generate
correct user guidance.
Average Geometric Measurement Accuracy
To evaluate the geometric measurement accuracy, multiple complete frames are acquired by
moving the sensor to different positions in order to obtain data at different viewpoints. The average
values over all the measurements from those complete frames are used to demonstrate the accuracy
and performance of the sensor in estimating the dimensions. The ground truth of the dimensional

information is obtained using a tape measure by a carpenter having ten years of construction
experience. The error of this system is calculated by subtracting the average value from the ground
truth.
In terms of a hallway structure, the method is tested on ten hallways in four different buildings.
The overall accuracy of the widths and the heights of the hallways is shown in Table 1. The mean
absolute error of the width measurement is 22mm while that of the height is 36mm. Considering the
accuracy of the Kinect sensor, it can be concluded that this method is able to obtain accurate
hallway width and height. The standard deviations of the absolute errors of the width and height
measurements are 15mm and 24mm respectively. As shown in Table 1, the width measurement
usually has a lower error and relative error compared to the height and moreover, the standard
deviation of the width measurement is smaller than that of the height measurement. The reason is
that the width of a hallway is usually less than its height and Kinect tends to obtain low-quality data
from the ceiling or the floor because the uncertainty of the sensor goes up as the distance increases.
Table 1. Absolute errors and relative errors of hallway width and height measurements. Avg. and
Std. denote average value and standard deviation of each column respectively.
ID
Error (mm) Relative Error
Width Height Width Height
Hallway 1 32 15 1.79% 0.59%

Hallway 2 33 55 1.81% 2.26%
Hallway 3 23 77 0.94% 2.65%
Hallway 4 48 27 1.96% 1.10%
Hallway 5 24 41 0.99% 1.67%
Hallway 6 4 15 0.16% 0.57%
Hallway 7 1 3 0.05% 0.11%
Hallway 8 32 50 1.33% 1.82%
Hallway 9 17 68 1.12% 1.98%
Hallway 10 4 12 0.20% 0.49%
Avg. 22 36 1.04% 1.32%
Std. 15 24 0.67% 0.82%
For door frames, the method is tested on ten door frames in different buildings. The overall
accuracy of the width of doors is shown in Table 2. The mean absolute error of the door width
measurements is 16mm, which shows that the method measures door width with high accuracy. The
standard deviation of the absolute errors is 14mm, which reflects the stability of this method in
measuring door width.

Table 2. Absolute errors and relative errors of door width. Avg. and Std. denote average
value and standard deviation of each column respectively.
ID Error (mm) Relative Error
Door 1 9 0.98%
Door 2 39 4.25%
Door 3 4 0.38%
Door 4 5 0.55%
Door 5 19 2.08%
Door 6 11 1.20%
Door 7 41 4.50%
Door 8 20 2.19%
Door 9 5 0.55%
Door 10 2 0.22%
Avg. 16 1.69%
Std. 14 1.49%
For stairs, the method is tested on ten stairs in different buildings. The mean absolute errors of
the width and the height of these ten stairs are 4mm and 15mm respectively while the standard
deviations are 4mm and 9mm as shown in Table 3. Compared to the accuracy of Kinect, these errors
demonstrate that using parallel planes to compute dimensions is able to get an accurate and stable
estimation. In addition, compared to the dimension measurements of hallways and doors, the stair

dimension measurements have a lower mean absolute error and standard deviation. This is partly
due to the fact that the stair width and height estimated from a single frame are usually computed
using multiple planes while the width and height of a hallway and the width of a door are estimated
using two planes from a single frame.
Table 3. Absolute errors and relative errors of stair width and height measurements. Avg. and Std.
denote average value and standard deviation of each column respectively.
ID
Error (mm) Relative Error
Width Height Width Height
Stair 1 4 11 1.43% 5.97%
Stair 2 6 24 2.12% 13.03%
Stair 3 2 10 0.68% 6.18%
Stair 4 15 28 5.91% 14.30%
Stair 5 0 5 0 2.72%
Stair 6 1 14 0.36% 7.41%
Stair 7 5 4 1.62% 2.25%
Stair 8 2 11 0.65% 6.42%
Stair 9 10 4 3.48% 2.22%
Stair 10 29 1 11.30% 0.55%

Avg. 7 11 2.76% 6.13%
Std. 8 8 1.62% 4.30%
Even though the mean absolute errors of the stair height and width are lower than those of
hallway and door dimensions, both the relative errors of the stair width and height (2.67% ad 6.13%)
are larger than those of the hallway and door dimension. This is mainly because the absolute values
of the stair height (~180mm) and width (~300mm) are smaller compared to door width (~1,000mm),
hallway width (~2,000mm), and hallway height (~2,500mm).
The developed methods are implemented in C++. The Point Cloud Library (PCL 2016) is utilized
for capturing 3D point clouds from the Kinect sensor. The Computation Geometry Algorithms
Library (CGAL 2016) is used for geometry computation. For the three cases, hallway, door, stairs,
the average frame processing time are 0.03s, 0.8s, and 0.07s respectively. The experiments were
conducted on a desktop with Intel Core i7-4790K CPU of 4.00GHz and RAM of 16GB. The
implementation does not employ any multi-threading or GPU techniques. The door frame takes
longer time because many geometric operations (e.g. boundary extraction) are performed in data
analysis. However, using multiple threading techniques, the processing time can be improved and
thus the system will be feasible for real-time applications.

Relations between Sensor Poses and Dimension Measurements
To obtain complete frames of a scene, sensor poses (orientations and positions) have many
options. This section will evaluate relations between sensor poses and the accuracy of dimension
measurements for the three scenes. As aforementioned, the user guidance system generates
instructions about moving the sensor’s position and orientation. The hallway which has larger
dimensions compared with the other two is used to evaluate the effect of sensor positions on the
dimension measurement errors while the stairs to evaluate the effect of sensor orientations on the
dimension measurement errors.
In terms of the hallway case, as the height of a hallway is usually larger than the width, we
primarily evaluated the errors of height measurements corresponding to positions of the sensor by
only varying the height of the sensor. We held the sensor horizontally, and vertically moved the
sensor from a position close to the ground floor to a position close to the ceiling. Thus, the sensor
poses in this way are assumed to have only variations in height. To obtain the relations between the
sensor position and the error of the height measurement, the absolute distance difference 2∗ between
the distance from the sensor to the ground floor and that from the sensor to the ceiling is computed.
If the sensor is near the center of the hallway, the absolute difference 2∗ is near zero. On the
contrary, if the sensor is close to the ground floor or the ceiling, 2∗ is larger and approaches the
height of the hallway. For this hallway whose height is 2.91 meters, when the absolute difference 2∗
is larger than 2.6 meters, the sensor cannot observe any complete frames. As shown in Fig. 7, the
average absolute error of height measurement increases as the absolute distance difference 2∗. This

is partly due to the fact that when the sensor is far away from the hallway center, it captures many
lower quality points that are far away from the sensor. For example, when the sensor is close to the
ground and far from the ceilings, the ceiling points will have larger uncertainty compared to the
ground points. These points with large uncertainty might lead to large errors in dimension
measurements. In addition, as shown in Fig. 7 when the absolute distance difference 2∗ is less than 2
meters, the absolute error of height measurement has less variance compared to that within 2 and 2.5
meters. Thus, it is concluded that when the sensor is close to the center of a hallway it tends to
provide robust and accurate hallway height estimation. However, it should be noted that if the
sensor is located away from the center of a hallway, it does not necessarily indicate that higher
accuracy dimensional measurements cannot be obtained. For example, when the absolute distance
difference 2∗ is within 2 and 2.5 meters some of the absolute errors of height measurement are
pretty accurate (less than 10mm). This is because the dimension measurements are computed using
least squares estimation which mitigates large uncertainty of some points. Therefore, even though
some points have higher uncertainty (which is still centimeter level), they do not dominate the least
squares estimation results, i.e. dimension measurements in this paper. This is also indicated in Fig. 7
by the fact that the average height measurement errors of different ranges are within 20mm.

Fig. 7. Absolute error of measurements corresponding to absolute distance difference 2∗ between
the distance from the sensor to the ground floor and that from the sensor to the ceiling.
For stairs, we collected data by only varying the view direction of the sensor to evaluate whether
the sensor’s orientation can improve the accuracy of dimensional measurements. We manually held
the sensor horizontally and then rotated the sensor to change its view direction. From this dataset,
the complete frames are extracted and their errors against the sensor orientation are shown in Fig. 8.
To obtain complete frames, the sensor’s orientation with respect to the horizontal surfaces of the
stairs should be greater than 18p and less than 73p . The results show that the errors are within
20mm and the dimension measurements have similar errors given that the error of Kinect point
measurement is also on the order of centimeters. In addition, Fig. 8 demonstrates that the sensor

orientation does not significantly affect errors of dimension measurements. This is also due to the
sensor uncertainty and the dimension estimation method.
Fig. 8. Error of dimensions corresponding to sensor orientations for completed stair frames.
Conclusions and Future Work
In this paper, a user-guided dimensional analysis method for indoor building environments is
introduced. The system uses a single frame from an RGB-D sensor to obtain the dimensions of an
indoor scene by extracting planes and performing the geometric analysis. To overcome the
disadvantage of the single frame data, a user guidance strategy is employed to provide guidance for
better sensor poses in order to acquire complete data frames. Experimental results show that this
method can obtain accurate dimensions of hallways, doors, and stairs with centimeters error. The
user guidance system is able to provide useful guidance for moving the sensor to obtain complete

frames. The experimental results also demonstrate that due to the uncertainty magnitude of the
sensor and the dimension estimation method, when complete frames are captured the sensor poses
have little effect on dimension measurements accuracy. Since the current user-guidance system only
guides the user to obtain complete frames, future work will explore how to systematically
investigate the relations between various sensor poses and the dimension measurement accuracy in
order to generate guidance for better frames in terms of high accuracy dimension measurements.
Due to the sensor, i.e. RGB-D cameras, used in the experiments, this research has two main
limitations. Firstly, the RGB-D sensors do not function well in outdoor environments because the
ambient IR affects the functionality of the IR sensor. Secondly, the RGB-D cameras have limited
accuracy which is not sufficient for some construction tasks especially during the construction phase
(e.g., door installation). To overcome these two limitations, different sensors can be utilized to
replace RGB-D cameras. For example, a stereo camera system can be used to get 3D point cloud in
both indoor and outdoor environments. For those applications requiring high accuracy, more
accurate sensors (e.g., laser scanners) can be adopted to acquire 3D point clouds. When different
sensors are used, if the scene is the same, some minor changes needs to be made according to the
property of sensors. Future work will investigate using stereo camera systems for measuring
dimensions of civil infrastructure elements in both indoor and outdoor environments. Another
limitation of the paper is that it can be only applied to infrastructure elements composed of planar
surfaces. Future work will explore the design of corresponding geometric analysis and user guidance
system for scenes containing non-planar surfaces.

Acknowledgments
The authors thank Ph.D. Candidate Kurt Lundeen and Post-Doctoral Fellow Dr. Suyang Dong for
their assistance in collecting the data and obtaining ground truth measurements.
References
Bae, H., Golparvar-Fard, M., and White, J. (2014). "Image-based localization and content authoring
in structure-from-motion point cloud models for real-time field reporting applications."
Journal of Computing in Civil Engineering, 637-644.
Bae, S., Agarwala, A., and Durand, F. (2010). "Computational rephotography." ACM Trans. Graph.,
29(3), 24:21--24:15.
Bernardini F. and Bajaj C. (1997) Sampling and reconstructing manifolds using alpha-shapes.
Technical Report CSD-TR-97-013, Dept. Comput. Sci., Purdue Univ., West Lafayette, IN.
Bennett, T. (2009). "BIM and laser scanning for as-built and adaptive reuse projects: the opportunity
for surveyors." The American Surveyor, 6(6), 15-15.
Bosché, F. (2010). "Automated recognition of 3D CAD model objects in laser scans and calculation
of as-built dimensions for dimensional compliance control in construction." Advanced
Engineering Informatics, 24(1), 107-118.
Brilakis, I., Fathi, H., and Rashidi, A. (2011). "Progressive 3D reconstruction of infrastructure with
videogrammetry." Automation in Construction, 20(7), 884-895.
Brilakis, I., Lourakis, M., Sacks, R., Savarese, S., Christodoulou, S., Teizer, J., and Makhmalbaf, A.
(2010). "Toward automated generation of parametric BIMs based on hybrid video and laser
scanning data." Advanced Engineering Informatics, 24(4), 456-465.
Budroni, A., and Boehm, J. (2010). "Automatic 3D modelling of indoor manhattan-world scenes
from laser data." Proc., ISPRS Symp. Close Range Image Measurement Techniques (vol 2),
Newcastle upon Tyne, UK, vol. XXXVIII, 115-120.
Cabral, R., and Furukawa, Y. (2014). "Piecewise planar and compact floorplan reconstruction from
images." Proc., 2014 IEEE Conference on Computer Vision and Pattern Recognition,
Columbus, OH, 628-635.
CGAL (2016). "Computational Geometry Algorithms Library." <http://www.cgal.org/>. (Feb 7,
2016).
Chen, K., Lai, Y.-K., and Hu, S.-M. (2015). "3D indoor scene modeling from RGB-D data: a
survey." Computational Visual Media, 1(4), 267-278.
Cho, Y. K., and Gai, M. (2014). "Projection-recognition-projection method for automatic object
recognition and registration for dynamic heavy equipment operations." Journal of
Computing in Civil Engineering, 27(5), 511-521.

Díaz-Vilariño, L., Khoshelham, K., Martínez-Sánchez, J., and Arias, P. (2015). "3D modeling of
building indoor spaces and closed doors from imagery and point clouds." Sensors, 15(2),
3491-3512.
Dimitrov, A., and Golparvar-Fard, M. (2014). "Robust nurbs surface fitting from unorganized 3d
point clouds for infrastructure as-built modeling." Computing in Civil and Building
Engineering, 81-88.
Feng, C., Taguchi, Y., and Kamat, V. R. (2014). "Fast plane extraction in organized point clouds
using agglomerative hierarchical clustering." Proc., IEEE International Conference on
Robotics and Automation, Hong Kong, China, 6218-6225.
Golparvar-Fard, M., Bohn, J., Teizer, J., Savarese, S., and Peña-Mora, F. (2011). "Evaluation of
image-based modeling and laser scanning accuracy for emerging automated performance
monitoring techniques." Automation in Construction, 20(8), 1143-1155.
Huber, D., Akinci, B., Pingbo, T., Adan, A., Okorn, B., and Xuehan, X. (2010). "Using laser
scanners for modeling and analysis in architecture, engineering, and construction." Proc.,
2010 44th Annual Conference on Information Sciences and Systems, Princeton, NJ, 1-6.
Khoshelham, K., and Elberink, S. O. (2012). "Accuracy and resolution of kinect depth data for
indoor mapping applications." Sensors, 12(2), 1437-1454.
Kim, Y. M., Dolson, J., Sokolsky, M., Koltun, V., and Thrun, S. (2012). "Interactive acquisition of
residential floor plans." Proc., IEEE International Conference on Robotics and Automation,
St. Paul, MN, 3055-3062.
Mandel, John. (1982) Use of the singular value decomposition in regression analysis. The American
Statistician, 36(1),15-24.
Newcombe, R. A., Izadi, S., Hilliges, O., Molyneaux, D., Kim, D., Davison, A. J., Kohi, P., Shotton,
J., Hodges, S., and Fitzgibbon, A. (2011). "KinectFusion: Real-time dense surface mapping
and tracking." Proc., 2011 10th IEEE International Symposium on Mixed and Augmented
Reality, Basel, Switzerland, 127-136.
Nüchter, A., and Hertzberg, J. (2008). "Towards semantic maps for mobile robots." Robotics and
Autonomous Systems, 56(11), 915-926.
PCL (2016). "Point Cloud Library." <http://pointclouds.org/>. (Feb 7, 2016).
Richardson, A., Strom, J., and Olson, E. (2013). "AprilCal: Assisted and repeatable camera
calibration." Proc, IEEE International Conference on Intelligent Robots and Systems,
Tokoyo, Japan, 1814-1821.
Taguchi, Y., Jian, Y. D., Ramalingam, S., and Feng, C. (2013). "Point-plane SLAM for hand-held
3D sensors." Proc., IEEE International Conference on Robotics and Automation, Kalsruhe,
Germany, 5182-5189.
Tang, P., Huber, D., Akinci, B., Lipman, R., and Lytle, A. (2010). "Automatic reconstruction of as-
built building information models from laser-scanned point clouds: A review of related
techniques." Automation in Construction, 19(7), 829-843.
Wang, C., and Cho, Y. K. (2015). "Smart scanning and near real-time 3D surface modeling of
dynamic construction equipment from a point cloud." Automation in Construction, 49(0),
239-249.
Xiong, X., Adan, A., Akinci, B., and Huber, D. (2013). "Automatic creation of semantically rich 3D
building models from laser scanner data." Automation in Construction, 31, 325-337.
Zhu, Z., and Donia, S. (2013). "Potentials of RGB-D cameras in as-built indoor environments
modeling." Proc., 2013 ASCE International Workshop on Computing in Civil Engineering,
Los Angeles, CA, 23-25.