Embed Size (px)
Citation preview
User Guide ISIR Analysis Tool
2 of 68 The ISIR Analysis Tool User Guide - 1/10/2011
Chapter 1: Getting Started With the ISIR Analysis Tool Navigating the ISIR Analysis Tool ................................................................................................... 3 Identifying ISIR Populations to Extract from the Data Mart ............................................................. 9 Requesting ISIR Data ................................................................................................................... 10 Use of the Export Function ........................................................................................................... 11 Creating and Adding User-Specified Fields .................................................................................. 13 The Student Listing ....................................................................................................................... 18 Appendix A: Creating ASCII Files for EDExpress Users ............................................................... 20
Chapter 2: Standard Reports Introduction ................................................................................................................................... 22 Sample Summary Report ............................................................................................................. 28 Verification Summary Report ........................................................................................................ 31 Field Change Report .................................................................................................................... 35 Field Increment Report ................................................................................................................. 40 Student Listing Report .................................................................................................................. 47 Student Detail Report ................................................................................................................... 51 EFC Impact Analysis Report ......................................................................................................... 53
Chapter 3: Custom Reports Introduction ................................................................................................................................... 57 Report Assistant ........................................................................................................................... 57 The Field Selection Tab ................................................................................................................ 59 The Report Headings Tab ............................................................................................................ 61 The Selection Criteria Tab ............................................................................................................ 63 The Report Options Tab ............................................................................................................... 64 Saving and Running a Custom Report .......................................................................................... 64 Step by Step Illustration ................................................................................................................ 65 Shared Reports ............................................................................................................................ 68
3 of 68 The ISIR Analysis Tool User Guide - 1/10/2011
Navigating the ISIR Analysis Tool The ISIR Analysis Tool is designed to help schools conduct an in depth analysis of applicant populations so they can understand the effectiveness of their own verification procedures. The purpose of this chapter is to explain how to access and navigate the Tool.
How do I access the ISIR Analysis Tool? • To access the ISIR Analysis Tool, you first must enroll through the
Student Aid Internet Gateway (SAIG) for access to FAA Access to CPS Online. The SAIG is the tool that allows Federal Student Aid trading partners to securely exchange batch data with Federal Student Aid Application Systems. Most schools already have financial aid staff enrolled for FAA Access to CPS Online. However, staff responsible for using the ISIR Analysis Tool must ensure that they are enrolled and have been assigned access to use the ISIR Analysis Tool within FAA Access to CPS Online. Each user must apply for and obtain a FSA User ID and password in order to log on to FAA Access to CPS Online and the ISIR Analysis Tool. To apply and obtain a FSA User ID and password go to the SAIG Enrollment web site and click on the FSA User ID Registration Link https://fsawebenroll.ed.gov/PMEnroll/PMAccountServlet.jrun
Once you are enrolled and receive your FSA User ID and password, you can access FAA Access to CPS Online and the ISIR Analysis Tool.
• Go to Start, select Programs and then select your browser (e.g., Internet Explorer). Enter the following address:
http://www.fafsa.ed.gov/FOTWWebApp/faa/faa.jsp
• You are now on the FAA Access to CPS online page. From this page, click the Next button.
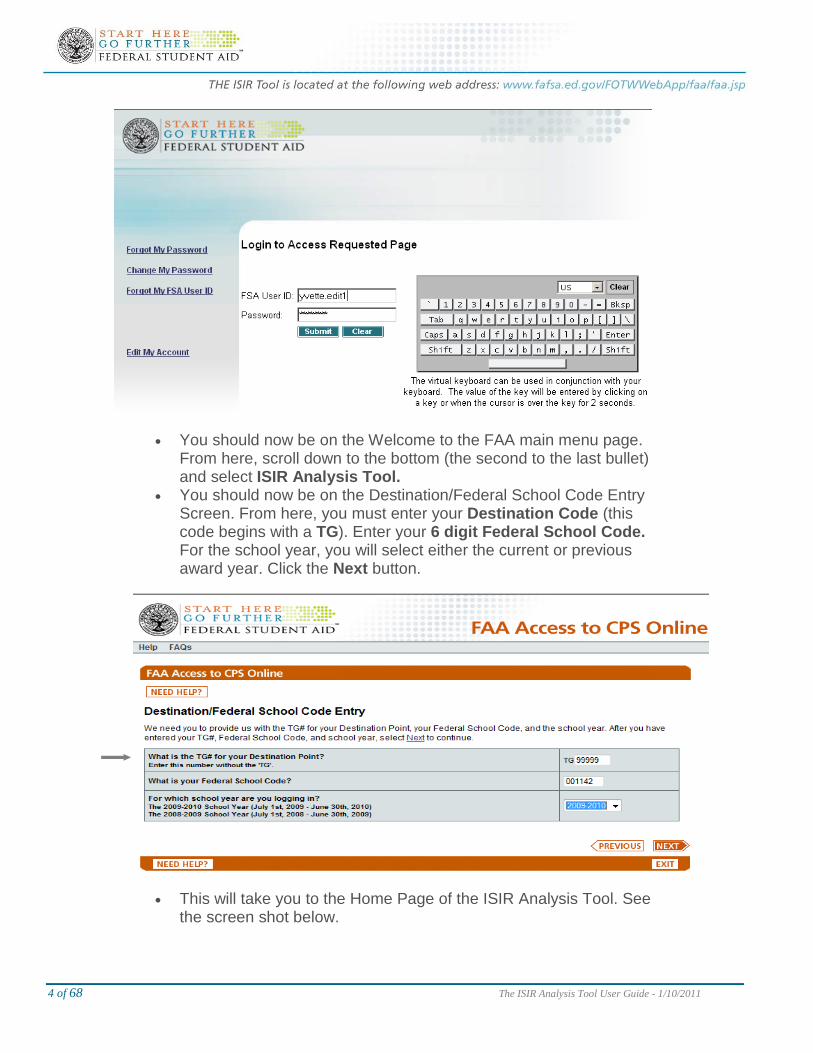
• You are now on the “Login to Requested Page” screen. Enter your FSA User ID and Password. Refer to the screen shot below. You can use the virtual keyboard to enter the information or type the information into the required fields. Click the Submit button.
4 of 68 The ISIR Analysis Tool User Guide - 1/10/2011
• You should now be on the Welcome to the FAA main menu page. From here, scroll down to the bottom (the second to the last bullet) and select ISIR Analysis Tool.
• You should now be on the Destination/Federal School Code Entry Screen. From here, you must enter your Destination Code (this code begins with a TG). Enter your 6 digit Federal School Code. For the school year, you will select either the current or previous award year. Click the Next button.
• This will take you to the Home Page of the ISIR Analysis Tool. See the screen shot below.
5 of 68 The ISIR Analysis Tool User Guide - 1/10/2011
Because schools use different browsers
, you may receive a series of acknowledgement boxes when you first log into FAA Access to CPS Online. Because these boxes are specific to certain browsers (such as Firefox or Internet Explorer), you can simply read each box and continue with the action following the instructions. You may receive similar boxes when you exit the Tool.
When using the ISIR Analysis Tool, do not use the Back button on your browser menu bar to move to the next or previous screens. Use the ISIR Analysis Tool Command buttons at the bottom of the ISIR Analysis screen instead.
Helpful Hint: General Navigation
How do I get back to the Home Page? • From the menu at the top of your screen, you will see three
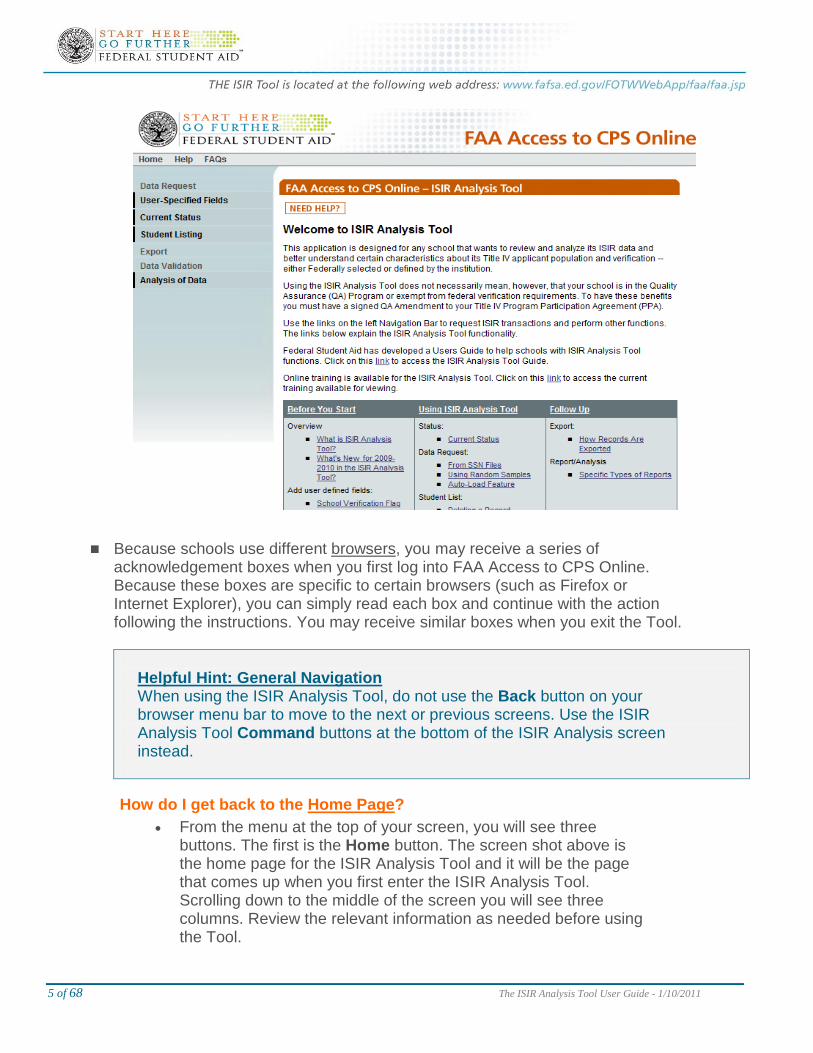
buttons. The first is the Home button. The screen shot above is the home page for the ISIR Analysis Tool and it will be the page that comes up when you first enter the ISIR Analysis Tool. Scrolling down to the middle of the screen you will see three columns. Review the relevant information as needed before using the Tool.
6 of 68 The ISIR Analysis Tool User Guide - 1/10/2011
You may click on the Home navigational button at any time to return to the
home page.
How to access the navigational Help and FAQs buttons? • From the menu at the top of your screen, click the Help button. A
pop-up box appears listing all of the Help topics available. You will notice that the topics are identical to menu items located on the home page button.
• Close the Help box by selecting the Close Help button at the bottom of the box.
• From the menu at the top of your screen, click the FAQs button. • Review the common questions and answers. These questions and
answers will be updated as important issues arise. • Close the Help box by selecting the Close Help button at the
bottom of the box.
You will notice that the Help button provides access to a variety of topics related to the Tool. Since there are many locations throughout the Tool where you may need help, you can access the Help topics from many places throughout the Tool.
The FAQs button contains common questions and answers related to using the
ISIR Analysis Tool.
How to navigate within the tool? • From the menu on the left-hand side of your screen, select Data
Request. Here, you can request your ISIR data from the ISIR data mart or you can upload your user-defined data. Detailed instructions for performing these tasks will be provided later in this guide.
• At the bottom of the page, click Need Help? Here you will find Help topics related to this page. This feature is available throughout every page of the site. Close the Help box by selecting the Close Help button at the bottom of the box.
• From the menu on the left-hand side of your screen, select User-Specified Fields. Click the drop-down arrow in the box. Here, you can view, add or delete fields in the ISIR Analysis Tool.
• You can sort by Student Name, Student SSN, or by Verification Flag. Detailed instructions for performing these tasks will be provided later in this guide.
• From the menu on left-hand side of your screen, select Current Status. Here, you will find how many records (Initial, Paid-on, Initial and Paid-on) are in the ISIR Analysis Tool Database. Remember, you may have just initial records (with no paid-on
7 of 68 The ISIR Analysis Tool User Guide - 1/10/2011
transactions) or paid-on records (with no initial transactions) or you may have initial and paid-on records (with both initial and paid-on transactions). You can also determine if data validation has been performed for the records in the database.
• At the bottom of the page, click the Return button to go back to the home page.
• From the menu on the left-hand side of your screen, select Student Listing. Here, you have different options available to view the records in your database. Click the drop-down arrow in the box. Note that you can view, update, or delete records in your database. While in view mode, you can also sort by any of the column titles that are underlined.
• From the drop-down arrow box, select View Only and click Next (if you have uploaded your records, you can view all records in the database). At the bottom of the screen, click the Previous command button.
• From the drop-down arrow box, select Update Records, click Next. (If you have records in your database, you will be able to update the School Verification Flag, or User-Specified Fields for records in your database. Note that you can click on an individual student record and make a change, or you can use the buttons at the bottom to either Select All or Deselect All. Remember to use the Save button to save any changed information.) At the bottom of the screen, click the Previous command button.
• From the drop-down arrow box, select Delete Records, click Next (If you have records in your database you may delete the School Verification Flag, or User-Specified Fields for records in your database. Note that you can click on an individual student record to delete, or you can use the buttons at the bottom to either Select all or Deselect All. Remember, to use the Delete button to delete any marked records). At the bottom of the screen, click the Previous command button.
• From the menu on the left-hand side of your screen, select Export if you have records in your database and would like to export a SSN List to your schools SAIG mailbox.
• From the menu on the left-hand side of your screen, if you select Data Validation and have initial and paid-on ISIR records in your database, you may run data validation for all records in your database. Data validation should not be performed until both initial and paid-on records have been uploaded. Data validation finalizes your student records for generating reports. The system will display how many records will be deleted before you select the Next button.
• From the menu on the left-hand side of your screen, you will notice the Analysis of Data button. This function is available once you have uploaded and validated your records.
8 of 68 The ISIR Analysis Tool User Guide - 1/10/2011
The Data Request menu
allows you to request your ISIR data from the ISIR data mart. The User-defined Data option for the data request process allows you to add values for User-Specified fields you’ve defined in your User-Specified fields’ setup. You can define up to 15 user-defined fields in setup. Examples might include the verification tracking flag, Satisfactory Academic Progress or program of study. You can add values to your student records by importing a flat file of data using the data request menu option or by manually entering information at the student record level.
The User-Specified Fields menu
How do I exit the ISIR Analysis Tool?
allows you to view, add or delete a field. You can create up to 15 User-Specified fields to track data specific to your school’s needs. Field types that can be created are Date format, Numeric format, String (text) format or Yes/No format. For example, you might find it helpful to track student athletes, SAP, program of study or other data specific to your school.
• Scroll down to the bottom of the screen and select Exit. A pop-up box appears that says, “Are you sure you want to exit FAA Access to CPS Online?” Select OK.
Note:
If you select OK you will be taken out of the ISIR Analysis Tool and the FAA Main Menu and must log in again. You should only use the Exit button when you are finished with the Tool.
9 of 68 The ISIR Analysis Tool User Guide - 1/10/2011
For questions about using the ISIR Analysis Tool, you may contact CPS/SAIG Technical Support at 1-800-330-5947/TTY 1-800-511-5806 or via e-mail at [email protected]. CPS/SAIG Technical Support representatives are available to assist you between 7 a.m. and 7 p.m. CT, Monday through Friday, excluding holidays.
Identifying ISIR Populations to Extract from the Data Mart Purpose:
This section explains how to identify the ISIR population(s) you want to analyze and why identifying the correct population is critical to your analysis.
Prior to using the Tool, you must first determine which ISIR records you want to analyze. The ISIR Analysis Tool has the capacity to focus in on specific subsets of records, but the Tool limits the number of ISIRs you may analyze at a time to 1,500. Therefore, you may wish to restrict the type of ISIR records you request for uploading in order to maximize your ability to analyze particular sub groups of aid recipients. Please note that while you are limited to analyzing 1,500 records at a time, you can analyze multiple ISIR groups by simply rebuilding the database to analyze each subset. We recommend that you name and save your flat files in a manner that makes it easy for you re-analyze each ISIR group. For instance, keep all of the flat files in the same directory and name each to clearly identify what group of ISIRs the file contains. There are several options to consider.
Entire Title IV Aid Recipient Population
To see the entire scope of changes applicants make to their ISIR information and the impact these changes have on EFC and Pell eligibility at your institution. You will also be able to determine the percentage of records falling into any of the desired subpopulations you wish to examine. This may well assist in your evaluation of the most frequently changed ISIR elements so that you can address them in your consumer and high school night information.
CPS Selected ISIRs To determine how effectively CPS verification is in finding those with subsequent changes to EFC and Pell eligibility at your institution. By focusing only on records selected for CPS verification, you will be able to identify what changes to aid eligibility were uncovered through the federally mandated verification process. You will also be able to determine if specific types of applicants flagged for federal verification are more or less likely to experience a
10 of 68 The ISIR Analysis Tool User Guide - 1/10/2011
change to aid eligibility in comparison to other types of applicants selected by the Secretary’s edits.
Discretionary Verification ISIRs
To determine how effectively your own discretionary verification is working by validating if your “gut” feeling about verifying additional cases is right. You will also be able to determine if discretionary verification is making a difference in terms of the EFC and Pell eligibility of those applicants you choose to verify in addition to the federal edits, as well as learn if discretionary verification is worthwhile for the types of applicants it targets.
ISIRs Not Selected for CPS or Discretionary Verification
To see the changes applicants make to their own ISIR information and the impact these changes have on EFC and Pell eligibility at your institution. You may use this information to expand the scope of educational outreach or modify discretionary verification to address changes applicants make that strike you as potentially problematic.
Random Sample of Title IV Recipients Subjected to 100% Verification
Quality Assurance Schools are asked every other year to randomly sample a minimum of 350 ISIR records from applicants verified during the most current award year. NON-QA schools may want to consider a similar sampling exercise in future years. This ISIR group contains all types of ISIR records including the groups identified above. The accuracy of all ISIR information will be established for this sample to assess all potential corrections of ISIR data and examine the impact of these corrections on EFC and Pell eligibility. You may also determine the degree to which federal and discretionary verification are catching the most significant changes, as well as learn the degree to which federal and discretionary verification are selecting cases for verification without a subsequent change to aid eligibility.
Additional ISIR Groups to Consider
• Estimated filers • Year in school groupings • Professional judgment cases • Recipients of state need-based aid • Recipients of institutional need-based aid
After you determine which ISIR populations you wish to analyze, you will need to prepare a flat file. EDExpress users can refer to Appendix A of this chapter for instructions on how to create a flat file using EDExpress.
Requesting ISIR Data The ISIR Analysis Tool allows you to request:
11 of 68 The ISIR Analysis Tool User Guide - 1/10/2011
ISIR Data: This allows you to upload your flat ASCII file containing the SSN, first two letters of the last name and transaction numbers for those students for whom you want ISIR data.
User-defined Data: This allows you to upload your flat ASCII file containing
the SSN, first two letters of the last name and other data you want appended to a student ISIR record.
This section describes how to create a flat ASCII (text) file and request ISIR data. To ensure that the particular records you analyze in the Tool reliably reflect the entire subpopulation of interest, we suggest that you compile a listing of all the students meeting the criteria of the group(s) you wish to examine. Prepare a flat ASCII file with the SSN and the first two letters of the last name, and transaction number(s) for the records you want to analyze. A flat ASCII file can include up to 10,000 records, but the Tool will randomly select up to 1,500 records from flat files that exceed 1,500. Because this subset of 1,500 records will be randomly selected, you may draw conclusions about your entire subpopulation. To learn more about how to create a flat ACSII file and the different options available to bring specific ISIR data into the Tool please refer to the power point presentation found at the following link: Creating a Flat ASCII file and Uploading Records Appendix A includes instructions for EDExpress users to use to assist them in creating a flat ASCII file. Please refer to the Appendix for a detailed description of the steps involved in this process.
REMEMBER: After you upload the ASCII file containing ISIR Records, perform Data Validation to ensure that each student record contains both an initial and paid-on transaction, valid EFC, and your school code on each record.
Use of the Export Function The Export function is useful if you wish to create an ASCII file identifying initial records or paid-on records only. For example, once you create an ASCII file with paid-on transactions only and bring those records into the Tool, you may then select the Export function (from the Tool’s main menu bar) and the Tool will send the flat file of all records currently in your database to your school’s SAIG mailbox. The file is sent under message class IATX09OP. Retrieve this file from your SAIG mailbox and update the initial ISIR transaction number to the file and upload your initial records. You can reverse this process if you would like to bring
12 of 68 The ISIR Analysis Tool User Guide - 1/10/2011
in your initial records first. This process is especially valuable if you use the random sample feature of the Tool to bring in initial or paid-on records.
To upload a flat ASCII file with initial records and use the Export Function to bring in the Paid-on records
• Follow steps to upload a file with initial transactions (refer to the training materials at the following link: Creating a Flat ASCII file and Uploading Records )
• .
•
Once the initial transactions file is uploaded into the Tool, go to homepage of the Tool, and select Export. A flat ASCII file of your initial records will then be sent to your school’s SAIG mailbox. Use this file to create the flat ASCII file for paid-on transactions.
Follow the instructions for uploading a file with paid-on transactions only found in the training materials at the following link: Creating a Flat ASCII file and Uploading Records
After you bring in both the initial and paid-on records, perform Data Validation.
To upload a flat ASCII file with Paid-on records and use the Export Function to bring in the initial records
• •
Follow steps to upload a file with paid-on transactions
•
Once your paid-on transactions file is uploaded into the Tool, go back to the homepage of the Tool and select Export. A flat ASCII file of your paid-on records will then be sent to your SAIG mailbox. You can then use this file to create the flat ASCII file for initial transactions.
Follow the instructions for uploading a file with initial transactions only.
After you bring in both the initial and paid-on records, perform Data Validation.
To validate the data • On the homepage, select the Data Validation function. • Click Next. • A warning box will appear reminding you to only perform this
function after both initial and paid on transactions have been uploaded into the Tool. Click OK to continue.
• Information about the number of records successfully validated and deleted (if any) will display.
13 of 68 The ISIR Analysis Tool User Guide - 1/10/2011
Creating and Adding User-Specified Fields Bringing User-Specified information into the Tool is a two-step process. First you must add a field to the online database to hold the information. Then you populate this field with your information stored in a flat ASCII file.
• You can create up to 15 individual User-Specified Fields. • The types of fields you can create are Date, Numeric, Yes/No, and
String. Each type has a different maximum field length. The help feature provides specific information on maximum field lengths.
• Creating User-Specified Fields allows you to track institutional specific information pertaining to individual records.
• The Tool has a pre-defined field for School Verification. You can update this field either manually through the student listing function or by uploading a flat ASCII file containing the user data associated with a particular student record. You can also include the School Verification Flag in the original flat ASCII file so it can pre-populate the Verification Flag during the upload process. Since the field length for the flat ASCII file is 16, you can include a “Y” as the 16th character to automatically set the Verification Flag to a Y when you upload the records. This process is very important for a QA school since QA schools have their own Verification criteria, but does not necessarily apply for non-QA schools unless you are analyzing a set of records selected for discretionary verification by the school. If you would like to prepare a flat ASCII file to upload the School Verification Flag and other User-Specified Fields, please refer to the training section of our web site: http://www.ifap.ed.gov/qahome/iatooltraining.html
• Within the Data Analysis functionality of the Tool, you can run custom reports that provide information about the records in the sample that met User-Specified criteria.
To add a User-Specified Field • On the homepage, select the User-Specified Fields function.
This function allows you to create User-Specified Fields, and update School Verification Flags. See the first screenshot below.
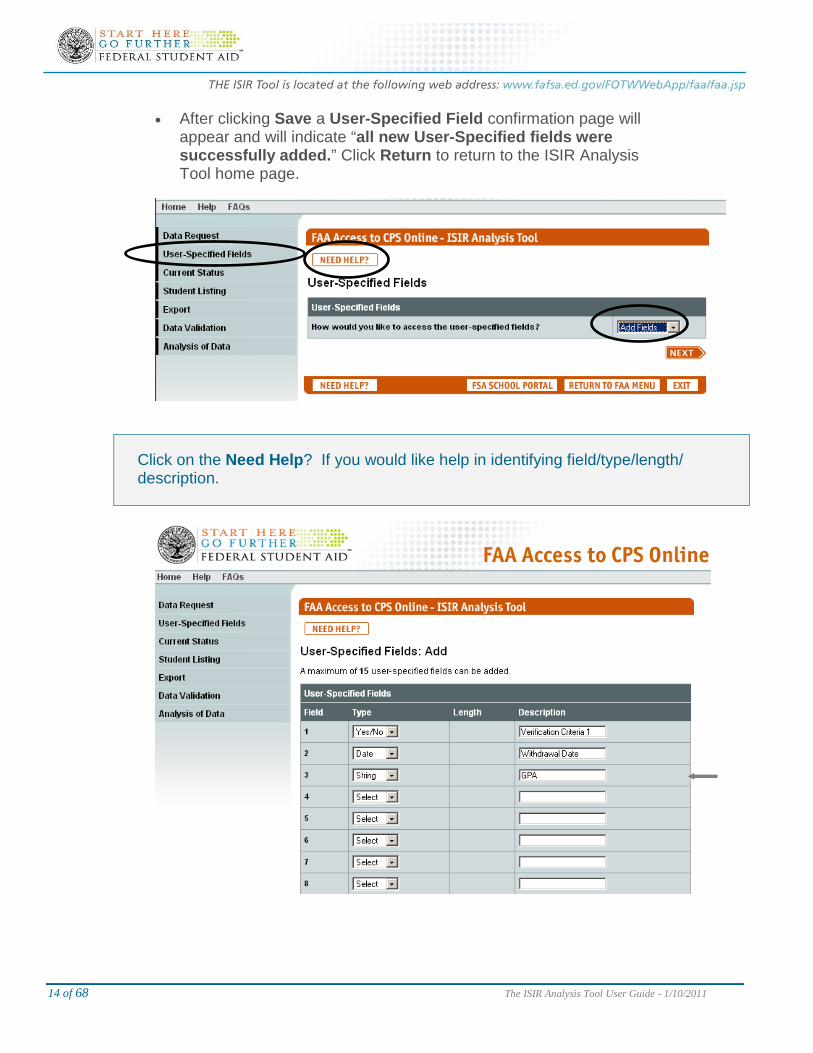
• Next, the Tool will ask, “How would you like to access the User-Specified Fields?” Click on the down arrow and Select Add Fields, Click Next.
• The Add User-Specified Fields page will appear. There are 4 columns: Field, Type, Length, and Description. Select the field to add. See second screenshot below.
• The field lengths are pre-populated. • Under the column Description type in the description for the User-
Specified Field. Click Save to save the newly added User-Specified Field.
14 of 68 The ISIR Analysis Tool User Guide - 1/10/2011
• After clicking Save a User-Specified Field confirmation page will appear and will indicate “all new User-Specified fields were successfully added.” Click Return to return to the ISIR Analysis Tool home page.
Click on the Need Help? If you would like help in identifying field/type/length/ description.
15 of 68 The ISIR Analysis Tool User Guide - 1/10/2011
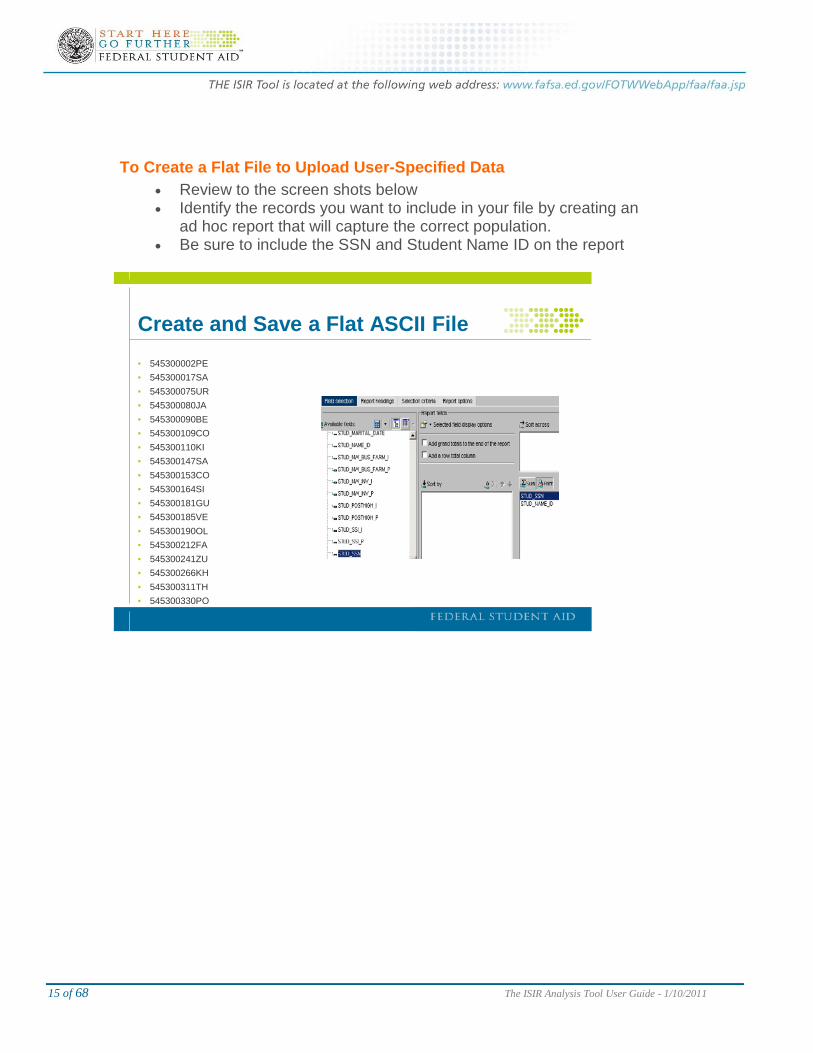
To Create a Flat File to Upload User-Specified Data • Review to the screen shots below • Identify the records you want to include in your file by creating an
ad hoc report that will capture the correct population. • Be sure to include the SSN and Student Name ID on the report
Create and Save a Flat ASCII File• 545300002PE• 545300017SA• 545300075UR• 545300080JA• 545300090BE• 545300109CO• 545300110KI• 545300147SA• 545300153CO• 545300164SI• 545300181GU• 545300185VE• 545300190OL• 545300212FA• 545300241ZU• 545300266KH• 545300311TH• 545300330PO
16 of 68 The ISIR Analysis Tool User Guide - 1/10/2011
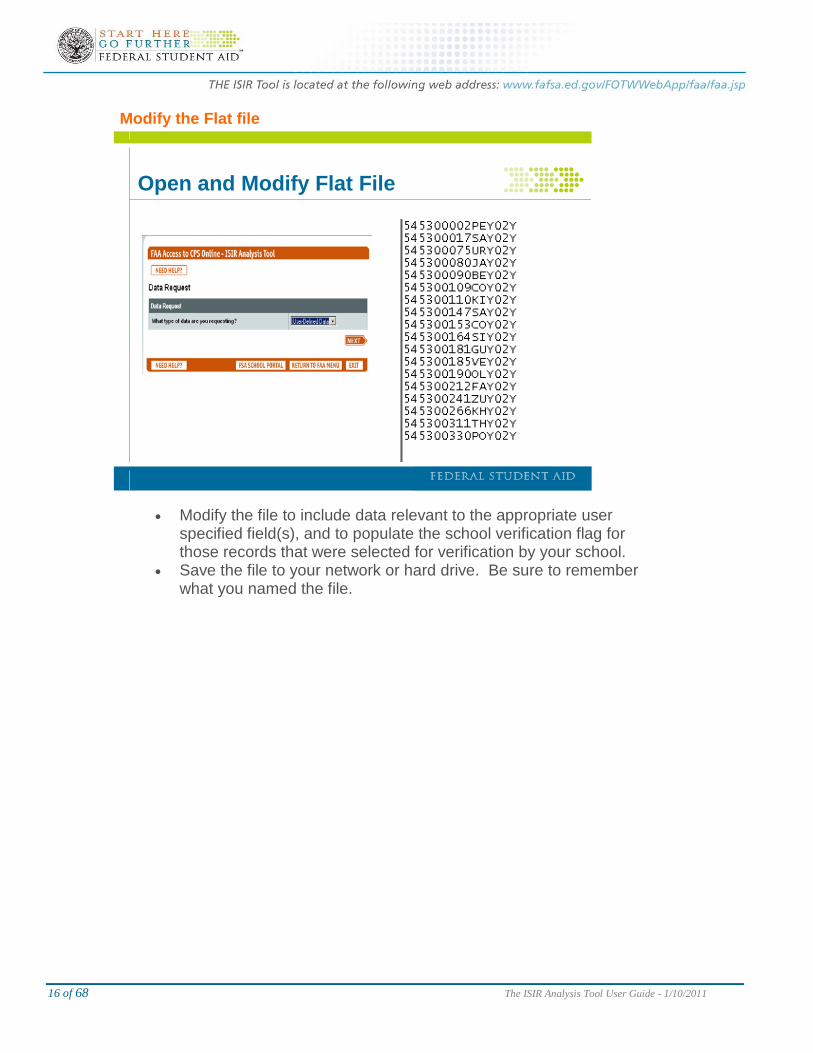
Modify the Flat file
Open and Modify Flat File
• Modify the file to include data relevant to the appropriate user specified field(s), and to populate the school verification flag for those records that were selected for verification by your school.
• Save the file to your network or hard drive. Be sure to remember what you named the file.
17 of 68 The ISIR Analysis Tool User Guide - 1/10/2011
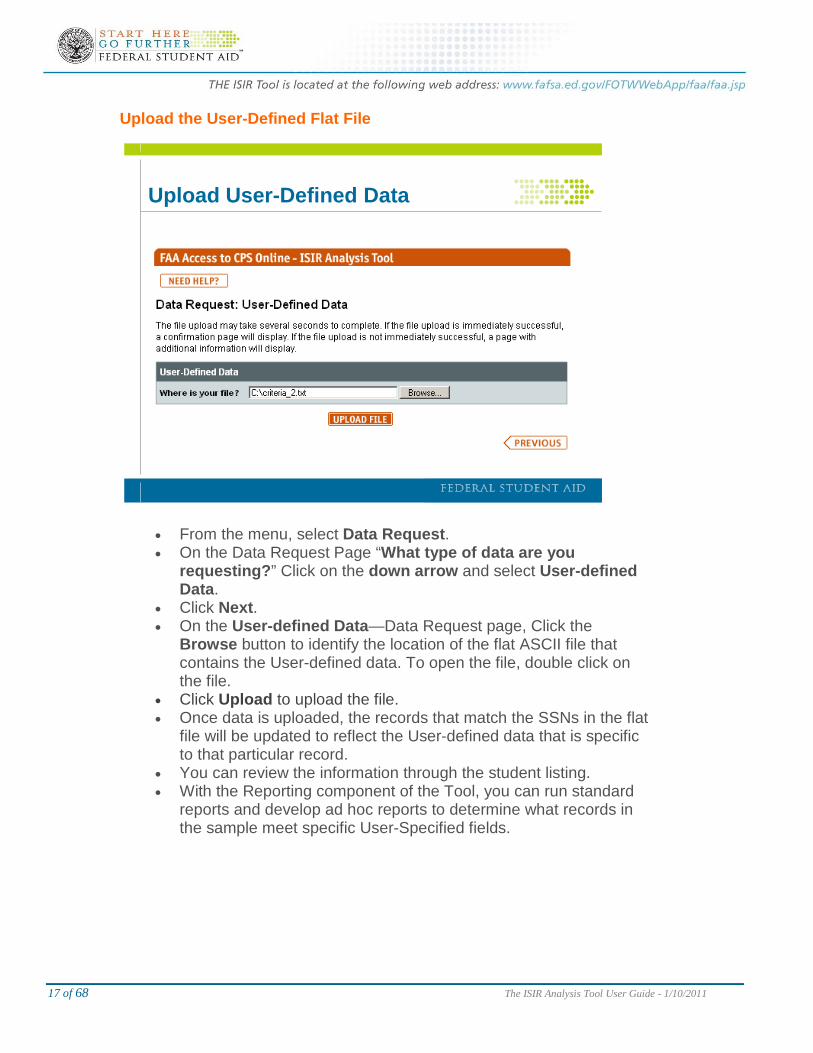
Upload the User-Defined Flat File
Upload User-Defined Data
• From the menu, select Data Request. • On the Data Request Page “What type of data are you
requesting?” Click on the down arrow and select User-defined Data.
• Click Next. • On the User-defined Data—Data Request page, Click the
Browse button to identify the location of the flat ASCII file that contains the User-defined data. To open the file, double click on the file.
• Click Upload to upload the file. • Once data is uploaded, the records that match the SSNs in the flat
file will be updated to reflect the User-defined data that is specific to that particular record.
• You can review the information through the student listing. • With the Reporting component of the Tool, you can run standard
reports and develop ad hoc reports to determine what records in the sample meet specific User-Specified fields.
18 of 68 The ISIR Analysis Tool User Guide - 1/10/2011
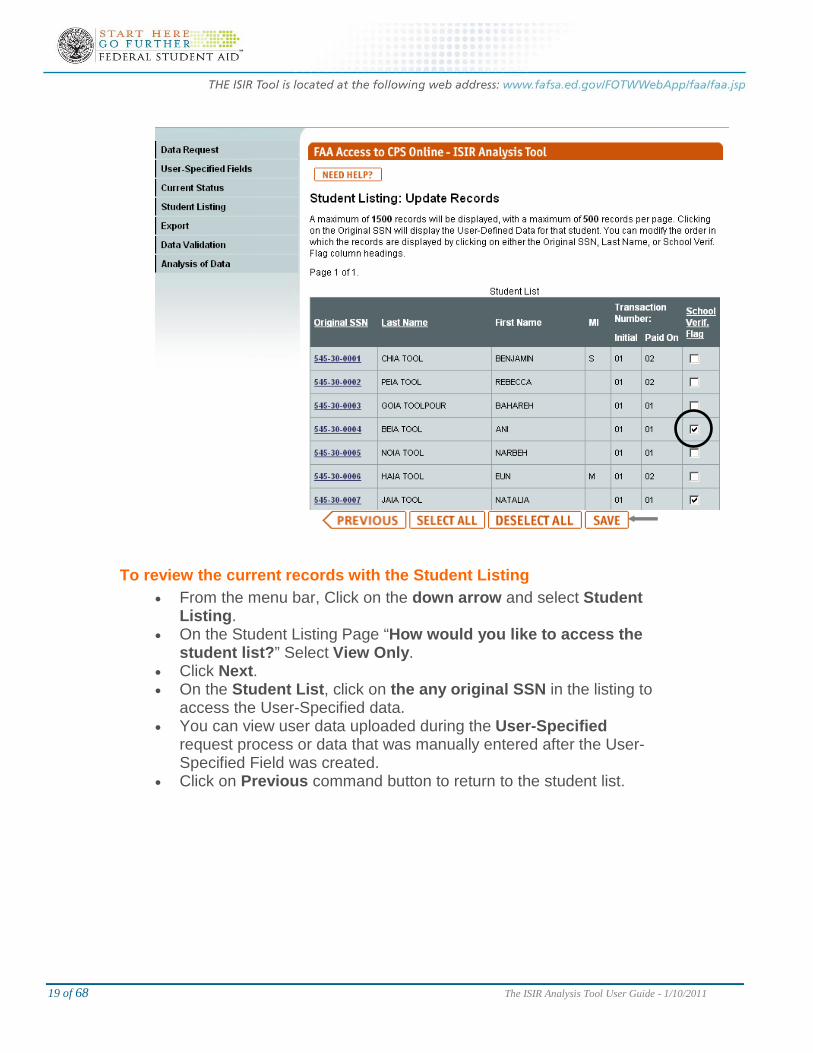
The Student Listing
• The Student Listing identifies the specific students whose ISIR records are currently in the Tool
• The Student Listing will list 500 records per page. If the Select All feature is used when more than 500 records are contained in the database, you must be sure to save each page of 500 records.
• To update School Verification Flags you have two choices: manually on a case-by-case basis or by uploading a flat ASCII file containing the SSNs, Name ID and Y for institutional verification
• By using the Analysis component of the Tool, users can develop ad hoc reports that provide information on those records that were marked with the School Verification Flag.
• You may sort in Student Listing by either clicking on the column for original SSN, Last Name or School Verification Flags.
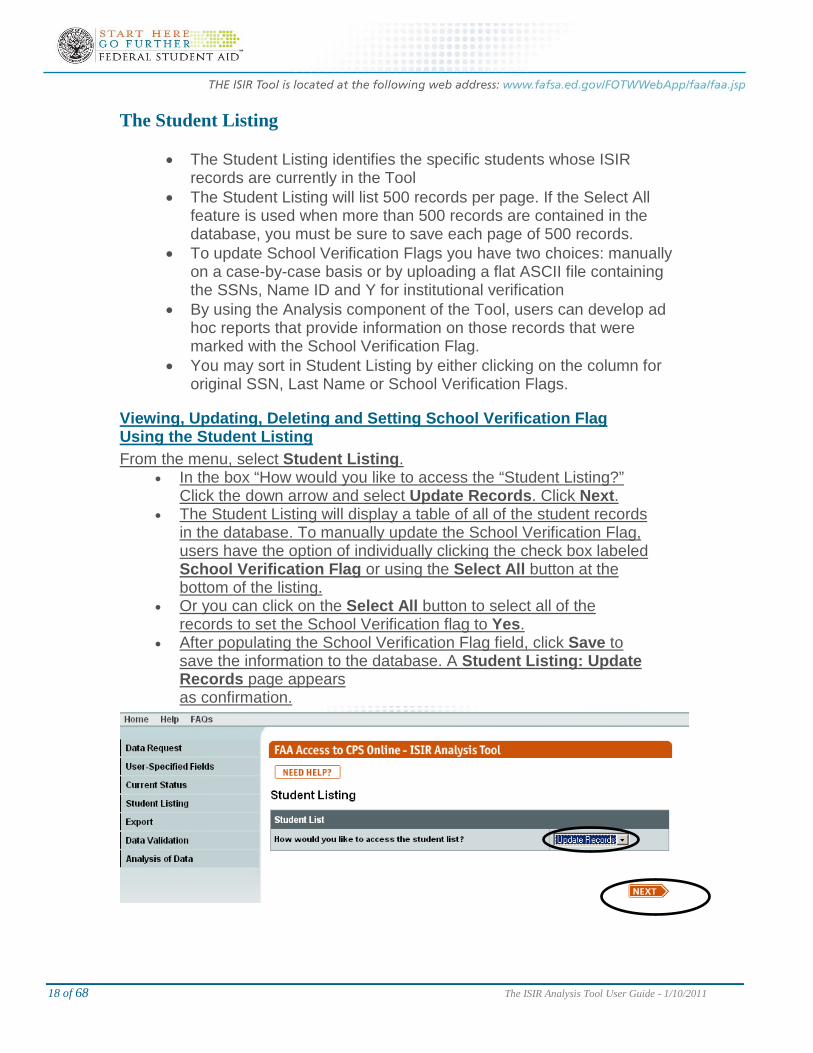
Viewing, Updating, Deleting and Setting School Verification Flag Using the Student Listing From the menu, select Student Listing.
• In the box “How would you like to access the “Student Listing?” Click the down arrow and select Update Records. Click Next.
• The Student Listing will display a table of all of the student records in the database. To manually update the School Verification Flag, users have the option of individually clicking the check box labeled School Verification Flag or using the Select All button at the bottom of the listing.
• Or you can click on the Select All button to select all of the records to set the School Verification flag to Yes.
• After populating the School Verification Flag field, click Save to save the information to the database. A Student Listing: Update Records page appears as confirmation.
19 of 68 The ISIR Analysis Tool User Guide - 1/10/2011
To review the current records with the Student Listing • From the menu bar, Click on the down arrow and select Student
Listing. • On the Student Listing Page “How would you like to access the
student list?” Select View Only. • Click Next. • On the Student List, click on the any original SSN in the listing to
access the User-Specified data. • You can view user data uploaded during the User-Specified
request process or data that was manually entered after the User-Specified Field was created.
• Click on Previous command button to return to the student list.
20 of 68 The ISIR Analysis Tool User Guide - 1/10/2011
Appendix A: Creating ASCII Files for EDExpress Users
EdExpress will write a flat ASCII file (DAT file) and create the SSN, add the first two letters of the last name and bring forward the 01 transaction number. However, please be aware of the following:
• You must identify the 01 records in your sample by writing a query
and selecting the sample records in EDExpress. Instructions on how to do this are on the next page.
• You will need to go back into the file and make sure that the 01 transaction was the one you identified as the initial transaction. If not, simply open the file and change it on the record. You will also have to type in the transaction number used as the paid on ISIR.
• Please keep in mind, that the 2008–2009 EDExpress includes a function called Global/File format that will have the original SSN. In most cases this should not be a problem. However, if you discovered that an SSN was wrong for someone in your sample and corrected it, you must revise the SSN used for that student to reflect the correct SSN to ensure that you receive the correct record. Global/File format will have the original SSN listed, so you will only need to select a student name and not a specific transaction number. Transactions may be added to the file once it is created.
We recognize that this option is not streamlined. However, using EDExpress can save you time by creating the flat ASCII file along with the SSN and first two letters of the last name. The instructions on how to create this file in EDExpress are as follows: Getting Started:
1. If you haven’t already done so, download EDExpress onto your computer from www.fsadownload.ed.gov. (Don't forget to import your year-to-date ISIR data into the software after downloading and installing it.)
2. Create a folder to ensure that the flat ASCII file you write is easily identified and accessible. Instructions on how to do this are in Step 1 on the following page. If you have an IAM file already established, you do not need to set up a new folder and can save your flat file to your IAM file.
3. Follow the steps on the next page.
21 of 68 The ISIR Analysis Tool User Guide - 1/10/2011
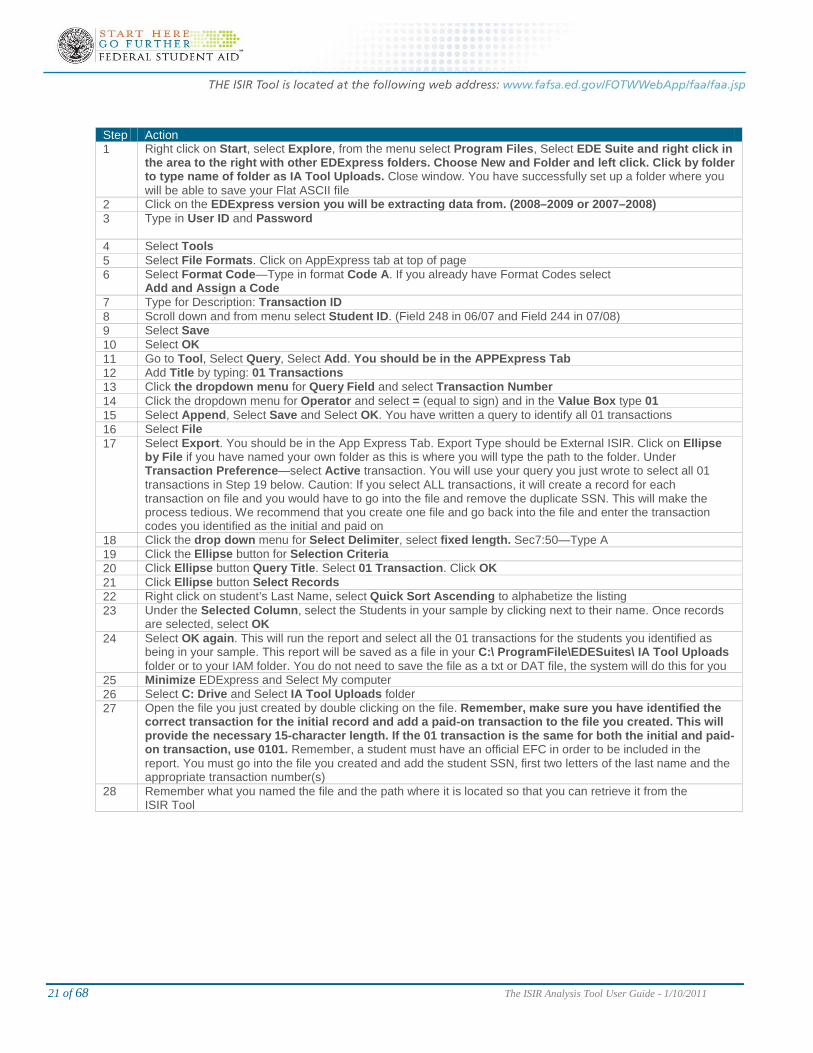
Step Action 1 Right click on Start, select Explore, from the menu select Program Files, Select EDE Suite and right click in
the area to the right with other EDExpress folders. Choose New and Folder and left click. Click by folder to type name of folder as IA Tool Uploads. Close window. You have successfully set up a folder where you will be able to save your Flat ASCII file
2 Click on the EDExpress version you will be extracting data from. (2008–2009 or 2007–2008) 3 Type in User ID and Password
4 Select Tools 5 Select File Formats. Click on AppExpress tab at top of page 6 Select Format Code—Type in format Code A. If you already have Format Codes select
Add and Assign a Code 7 Type for Description: Transaction ID 8 Scroll down and from menu select Student ID. (Field 248 in 06/07 and Field 244 in 07/08) 9 Select Save 10 Select OK 11 Go to Tool, Select Query, Select Add. You should be in the APPExpress Tab 12 Add Title by typing: 01 Transactions 13 Click the dropdown menu for Query Field and select Transaction Number 14 Click the dropdown menu for Operator and select = (equal to sign) and in the Value Box type 01 15 Select Append, Select Save and Select OK. You have written a query to identify all 01 transactions 16 Select File 17 Select Export. You should be in the App Express Tab. Export Type should be External ISIR. Click on Ellipse
by File if you have named your own folder as this is where you will type the path to the folder. Under Transaction Preference—select Active transaction. You will use your query you just wrote to select all 01 transactions in Step 19 below. Caution: If you select ALL transactions, it will create a record for each transaction on file and you would have to go into the file and remove the duplicate SSN. This will make the process tedious. We recommend that you create one file and go back into the file and enter the transaction codes you identified as the initial and paid on
18 Click the drop down menu for Select Delimiter, select fixed length. Sec7:50—Type A 19 Click the Ellipse button for Selection Criteria 20 Click Ellipse button Query Title. Select 01 Transaction. Click OK 21 Click Ellipse button Select Records 22 Right click on student’s Last Name, select Quick Sort Ascending to alphabetize the listing 23 Under the Selected Column, select the Students in your sample by clicking next to their name. Once records
are selected, select OK 24 Select OK again. This will run the report and select all the 01 transactions for the students you identified as
being in your sample. This report will be saved as a file in your C:\ ProgramFile\EDESuites\ IA Tool Uploads folder or to your IAM folder. You do not need to save the file as a txt or DAT file, the system will do this for you
25 Minimize EDExpress and Select My computer 26 Select C: Drive and Select IA Tool Uploads folder 27 Open the file you just created by double clicking on the file. Remember, make sure you have identified the
correct transaction for the initial record and add a paid-on transaction to the file you created. This will provide the necessary 15-character length. If the 01 transaction is the same for both the initial and paid-on transaction, use 0101. Remember, a student must have an official EFC in order to be included in the report. You must go into the file you created and add the student SSN, first two letters of the last name and the appropriate transaction number(s)
28 Remember what you named the file and the path where it is located so that you can retrieve it from the ISIR Tool
22 of 68 The ISIR Analysis Tool User Guide - 1/10/2011
Introduction
The ISIR Analysis Tool analyzes changes to ISIR information that occur between the initial and paid on transactions. Using a suite of standard reports all schools can analyze the impact that verification efforts have on the accuracy of need-based financial aid at their campus. This chapter describes how to run and interpret each of the reports available in the Tool.
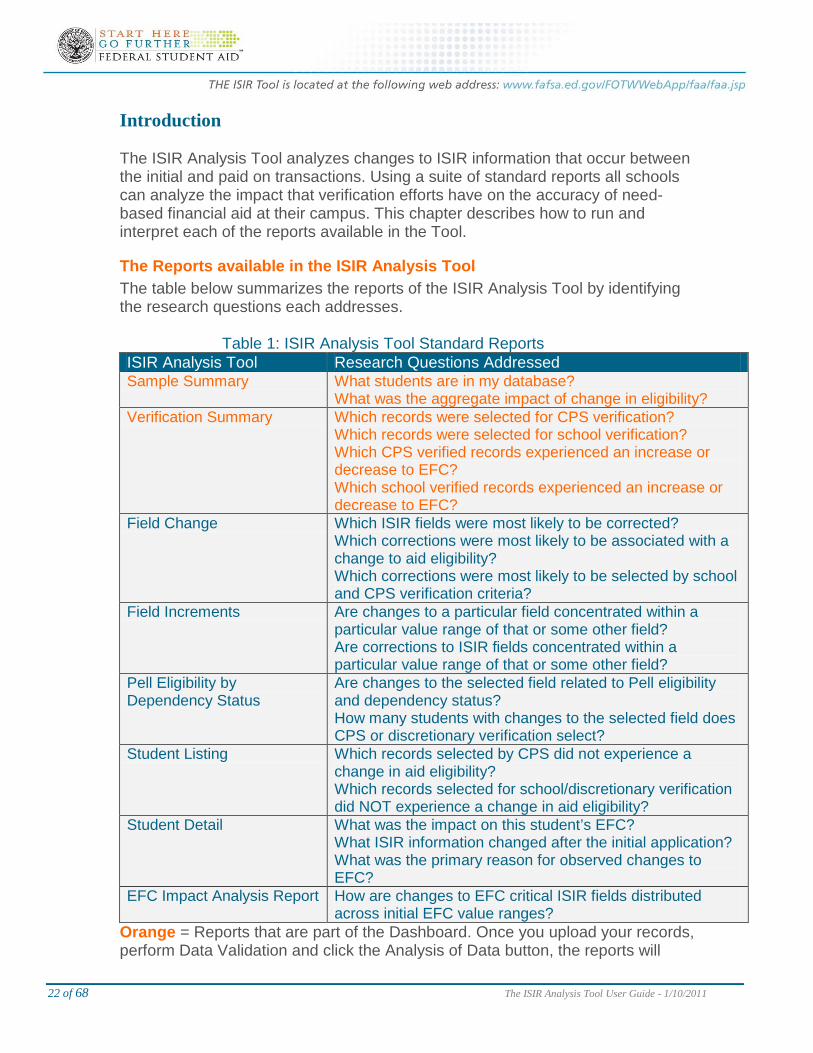
The Reports available in the ISIR Analysis Tool The table below summarizes the reports of the ISIR Analysis Tool by identifying the research questions each addresses.
Table 1: ISIR Analysis Tool Standard Reports
ISIR Analysis Tool Research Questions Addressed Sample Summary What students are in my database?
What was the aggregate impact of change in eligibility? Verification Summary Which records were selected for CPS verification?
Which records were selected for school verification? Which CPS verified records experienced an increase or decrease to EFC? Which school verified records experienced an increase or decrease to EFC?
Field Change Which ISIR fields were most likely to be corrected? Which corrections were most likely to be associated with a change to aid eligibility? Which corrections were most likely to be selected by school and CPS verification criteria?
Field Increments Are changes to a particular field concentrated within a particular value range of that or some other field? Are corrections to ISIR fields concentrated within a particular value range of that or some other field?
Pell Eligibility by Dependency Status
Are changes to the selected field related to Pell eligibility and dependency status? How many students with changes to the selected field does CPS or discretionary verification select?
Student Listing Which records selected by CPS did not experience a change in aid eligibility? Which records selected for school/discretionary verification did NOT experience a change in aid eligibility?
Student Detail What was the impact on this student’s EFC? What ISIR information changed after the initial application? What was the primary reason for observed changes to EFC?
EFC Impact Analysis Report How are changes to EFC critical ISIR fields distributed across initial EFC value ranges?
Orange = Reports that are part of the Dashboard. Once you upload your records, perform Data Validation and click the Analysis of Data button, the reports will
23 of 68 The ISIR Analysis Tool User Guide - 1/10/2011
automatically run and will be included in the Dashboard. If you want to generate either dashboard report using only a subset of cases, you can access filtering options by running these reports from the Standard Reports Folder. Blue = Reports often used for analysis. The Field Change Report is the place to begin. You may then drill down to the Field Increment Report, Pell Eligibility by Dependency Status Report, Student Listing Report and Student Detail Report. You can access the reports without using the drill down feature. If you run the reports from the Standard Reports Folder, you can take advantage of additional filtering options that are not available in drill down.
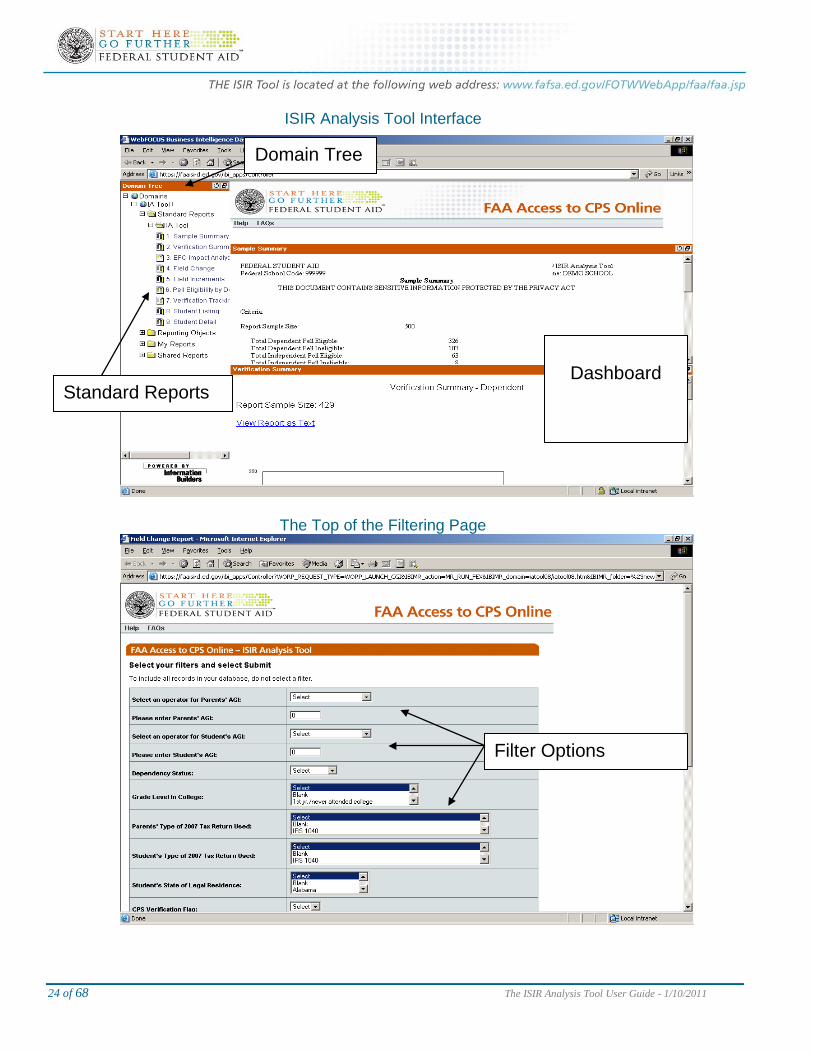
Three ways to generate reports We go into more specific detail on how to generate each report below, but first we provide a general overview of how the Tool works. There are three ways to generate reports within the ISIR Analysis Tool. The first is automatically. Two reports – the Sample Summary and Verification Summary Reports are automatically available on the Dashboard. See the annotated screen shot on the next page for the location of areas identified here in bold text. Users can also choose to generate any of the Standard Reports listed in the IA Tool subdirectory under the Domain Tree. Finally, users can generate a second report by “drilling down” at certain locations of other reports. Users often combine these three ways of generating reports as they investigate their data.
The Dashboard The two Dashboard reports are generated by the system when the user launches analysis of data. Users always have access to Sample and Verification Summary reports that reflect the information of all the records currently loaded into the Tool.
The Domain Tree Under the Domain Tree, users may select any of the Standard Reports. Note that the two reports on the Dashboard are also listed here. The reason for this duplication is users have access to a host of filtering options when they launch reports from under the Domain Tree. By using these filters, users can limit which records are included in a given report. For example they could select only dependent students who have adjusted gross incomes less than $50,000. When working from the Domain Tree, users can also change the format of the report from the default HTML to Microsoft Excel.
24 of 68 The ISIR Analysis Tool User Guide - 1/10/2011
ISIR Analysis Tool Interface
The Top of the Filtering Page
Dashboard
Domain Tree
Standard Reports
Filter Options
25 of 68 The ISIR Analysis Tool User Guide - 1/10/2011
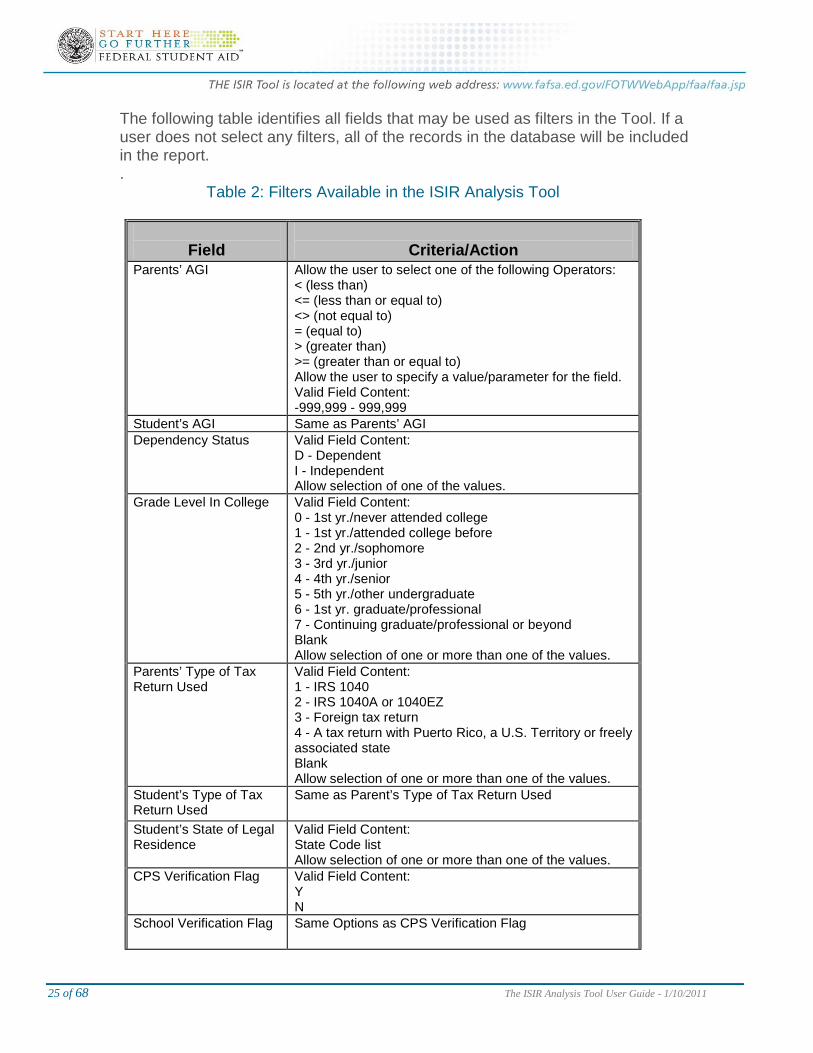
The following table identifies all fields that may be used as filters in the Tool. If a user does not select any filters, all of the records in the database will be included in the report. .
Table 2: Filters Available in the ISIR Analysis Tool
Field
Criteria/Action
Parents’ AGI Allow the user to select one of the following Operators: < (less than) <= (less than or equal to) <> (not equal to) = (equal to) > (greater than) >= (greater than or equal to) Allow the user to specify a value/parameter for the field. Valid Field Content: -999,999 - 999,999
Student’s AGI Same as Parents’ AGI Dependency Status Valid Field Content:
D - Dependent I - Independent Allow selection of one of the values.
Grade Level In College Valid Field Content: 0 - 1st yr./never attended college 1 - 1st yr./attended college before 2 - 2nd yr./sophomore 3 - 3rd yr./junior 4 - 4th yr./senior 5 - 5th yr./other undergraduate 6 - 1st yr. graduate/professional 7 - Continuing graduate/professional or beyond Blank Allow selection of one or more than one of the values.
Parents’ Type of Tax Return Used
Valid Field Content: 1 - IRS 1040 2 - IRS 1040A or 1040EZ 3 - Foreign tax return 4 - A tax return with Puerto Rico, a U.S. Territory or freely associated state Blank Allow selection of one or more than one of the values.
Student’s Type of Tax Return Used
Same as Parent’s Type of Tax Return Used
Student’s State of Legal Residence
Valid Field Content: State Code list Allow selection of one or more than one of the values.
CPS Verification Flag Valid Field Content: Y N
School Verification Flag Same Options as CPS Verification Flag
26 of 68 The ISIR Analysis Tool User Guide - 1/10/2011
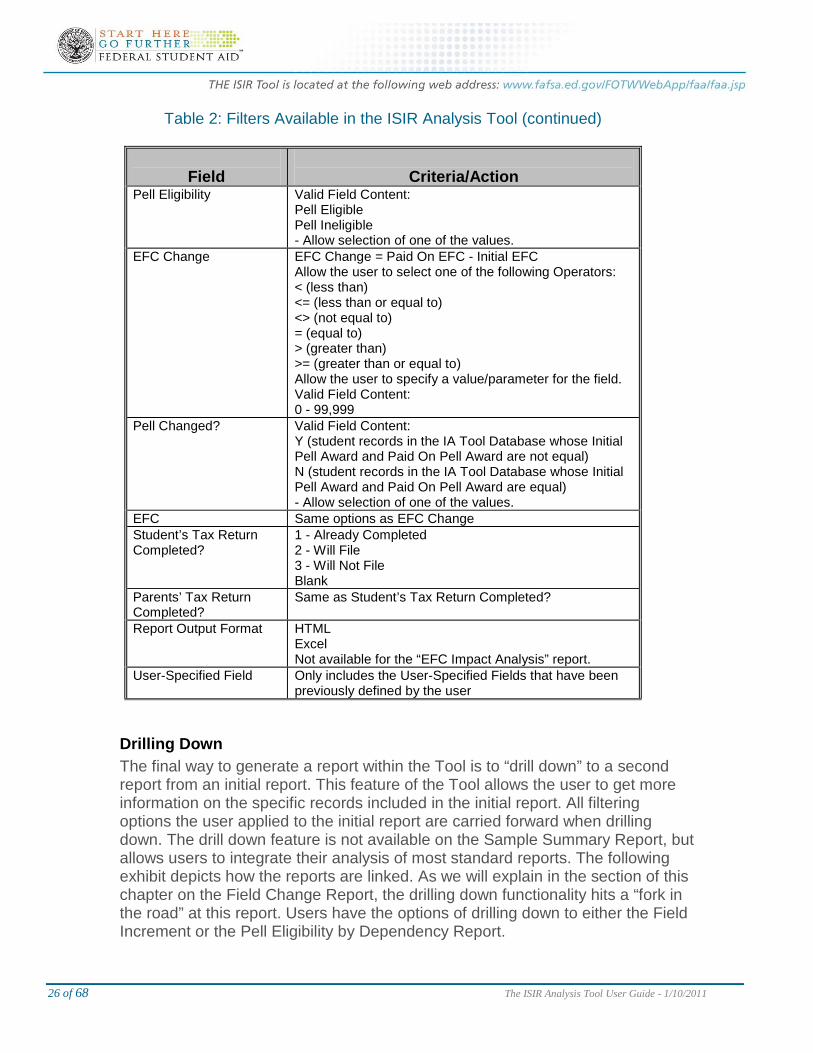
Table 2: Filters Available in the ISIR Analysis Tool (continued)
Field
Criteria/Action
Pell Eligibility Valid Field Content: Pell Eligible Pell Ineligible - Allow selection of one of the values.
EFC Change EFC Change = Paid On EFC - Initial EFC Allow the user to select one of the following Operators: < (less than) <= (less than or equal to) <> (not equal to) = (equal to) > (greater than) >= (greater than or equal to) Allow the user to specify a value/parameter for the field. Valid Field Content: 0 - 99,999
Pell Changed? Valid Field Content: Y (student records in the IA Tool Database whose Initial Pell Award and Paid On Pell Award are not equal) N (student records in the IA Tool Database whose Initial Pell Award and Paid On Pell Award are equal) - Allow selection of one of the values.
EFC Same options as EFC Change Student’s Tax Return Completed?
1 - Already Completed 2 - Will File 3 - Will Not File Blank
Parents’ Tax Return Completed?
Same as Student’s Tax Return Completed?
Report Output Format HTML Excel Not available for the “EFC Impact Analysis” report.
User-Specified Field Only includes the User-Specified Fields that have been previously defined by the user
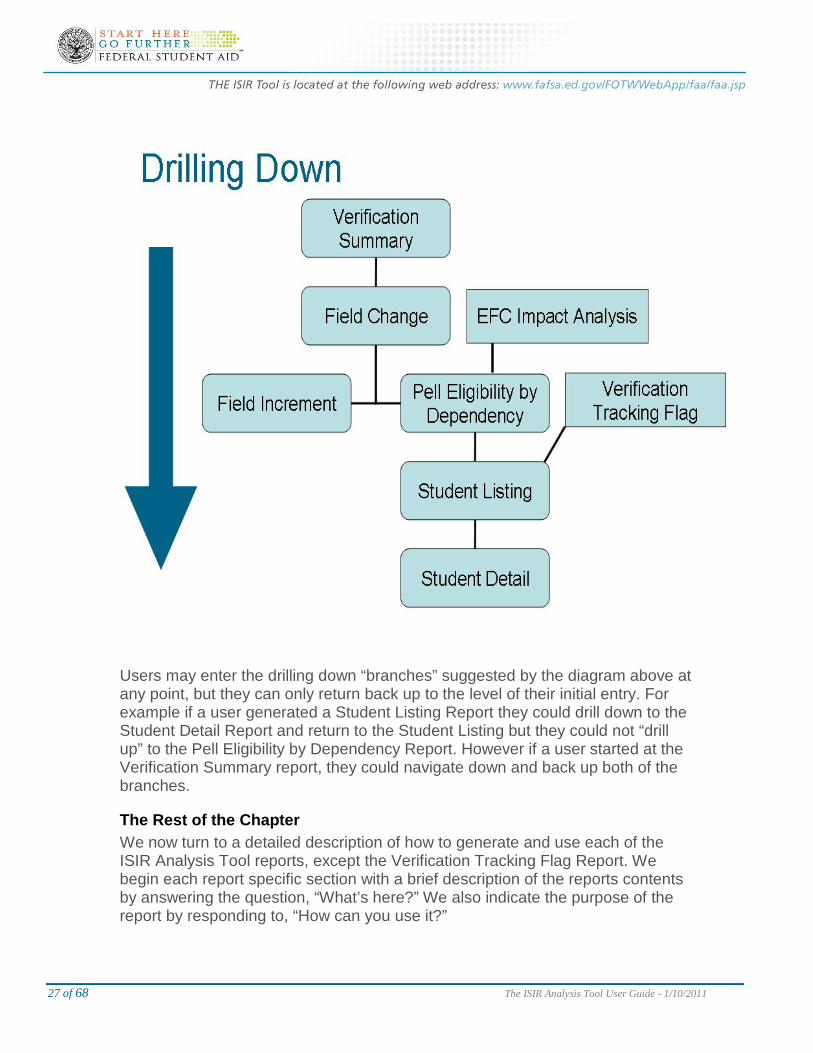
Drilling Down The final way to generate a report within the Tool is to “drill down” to a second report from an initial report. This feature of the Tool allows the user to get more information on the specific records included in the initial report. All filtering options the user applied to the initial report are carried forward when drilling down. The drill down feature is not available on the Sample Summary Report, but allows users to integrate their analysis of most standard reports. The following exhibit depicts how the reports are linked. As we will explain in the section of this chapter on the Field Change Report, the drilling down functionality hits a “fork in the road” at this report. Users have the options of drilling down to either the Field Increment or the Pell Eligibility by Dependency Report.
27 of 68 The ISIR Analysis Tool User Guide - 1/10/2011
Users may enter the drilling down “branches” suggested by the diagram above at any point, but they can only return back up to the level of their initial entry. For example if a user generated a Student Listing Report they could drill down to the Student Detail Report and return to the Student Listing but they could not “drill up” to the Pell Eligibility by Dependency Report. However if a user started at the Verification Summary report, they could navigate down and back up both of the branches.
The Rest of the Chapter We now turn to a detailed description of how to generate and use each of the ISIR Analysis Tool reports, except the Verification Tracking Flag Report. We begin each report specific section with a brief description of the reports contents by answering the question, “What’s here?” We also indicate the purpose of the report by responding to, “How can you use it?”
28 of 68 The ISIR Analysis Tool User Guide - 1/10/2011
Sample Summary Report • What’s here?
o Counts of records o Statistics on changes to Pell Awards
• How can you use it? o Describe students in the Tool (or subset) o Describe aggregate impact of changes to ISIR data on Pell
eligibility The Sample Summary Report provides descriptive information about the records in your database and is found at the top section of the Dashboard. The report provides the distribution of records that fall into the four categories defined by the combination of dependency and Pell eligibility status.
To Enlarge the Sample Summary Report from the Dashboard • Select the icon located in the right hand corner of the Sample
Summary Report. You can enlarge the box by selecting the icon on the top right corner – it is the middle icon.
• An annotated example of Sample Summary Repot is available on the next page.
• When you are done reviewing the Sample Summary Report select the X located at the top right hand corner of the report to close out of this report.
To run the Sample Summary Report from the Domain Tree
Note: There is no reason to run the Sample Summary Report from the Domain Tree unless you want to use filters or produce an Excel version of the report. The unfiltered HTML version of this report is already available on the Dashboard. • Under the Domain tree, click on + symbol next to the IA Tool 09-10. • Click on + symbol to open the Standard Reports and then the IA
Tool 2009-2010 subfolders. • Click on the first report listed, the “1. Sample Summary” or click on
the page icon immediately to left of this label. • This will open the filter page. Select whatever filters options you
want to use. • Click Submit. • When you are done reviewing the Sample Summary Report select
the X located at the top right hand corner of the report to close out of this report.
On the next page we provide an annotated example of a Sample Summary Report.
29 of 68 The ISIR Analysis Tool User Guide - 1/10/2011
Annotated Example of the Sample Summary Report
•
FEDERAL STUDENT AID
2009-2010 ISIR Analysis Tool
Federal School Code: 999999
School Name: DEMO SCHOOL
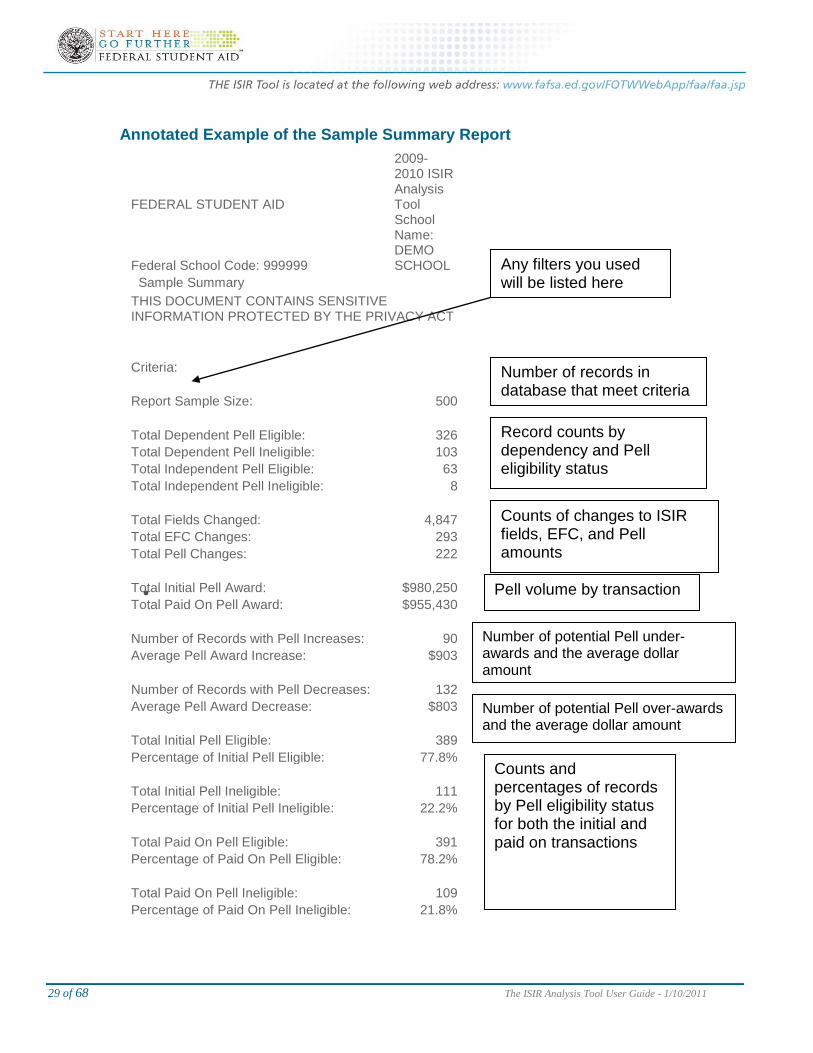
Sample Summary THIS DOCUMENT CONTAINS SENSITIVE INFORMATION PROTECTED BY THE PRIVACY ACT Criteria: Report Sample Size: 500 Total Dependent Pell Eligible: 326 Total Dependent Pell Ineligible: 103 Total Independent Pell Eligible: 63 Total Independent Pell Ineligible: 8 Total Fields Changed: 4,847 Total EFC Changes: 293 Total Pell Changes: 222 Total Initial Pell Award: $980,250 Total Paid On Pell Award: $955,430 Number of Records with Pell Increases: 90 Average Pell Award Increase: $903 Number of Records with Pell Decreases: 132 Average Pell Award Decrease: $803 Total Initial Pell Eligible: 389 Percentage of Initial Pell Eligible: 77.8% Total Initial Pell Ineligible: 111 Percentage of Initial Pell Ineligible: 22.2% Total Paid On Pell Eligible: 391 Percentage of Paid On Pell Eligible: 78.2% Total Paid On Pell Ineligible: 109 Percentage of Paid On Pell Ineligible: 21.8%
Any filters you used will be listed here
Counts of changes to ISIR fields, EFC, and Pell amounts
Record counts by dependency and Pell eligibility status
Number of records in database that meet criteria
Number of potential Pell under-awards and the average dollar amount
Number of potential Pell over-awards and the average dollar amount
Counts and percentages of records by Pell eligibility status for both the initial and paid on transactions
Pell volume by transaction
30 of 68 The ISIR Analysis Tool User Guide - 1/10/2011
Questions the report answers
“What students are in my database?” The total number of records in your database or that are selected when using specific filters is a quite useful piece of information to have when you want to assess how common specific changes to ISIR fields are. A complete count of all records that meet selection criteria – whether they experience a change to ISIR information or not – is also useful when considering the scope of adding or subtracting a certain group of students from your school’s verification efforts. In addition to a total count, the report provides counts by initial dependency and Pell eligibility status.
What was the aggregate impact of change in eligibility? The report provides counts of changes to ISIR fields; EFC; and Pell amounts. Divide each of these counts by the total number of records in the report to produce averages. Using the annotated version of the report on the previous page for example, we calculate an average of 9.67 (4847 ÷ 500) fields changed per record, 58.6% (293 ÷ 500) records with an EFC change, and 44.4% (222 ÷ 500) records with a change to Pell. The report provides the total volume of Pell Awards on the initial and paid on transactions. The next four rows of the report provide the number and average dollar amount of potential Pell under- and over-awards. By multiplying the number of Pell increases by the average increase will provide the total dollar amount of Pell increases. Likewise multiplying the number of Pell decreases by the average decrease will provide the total dollar amount of reductions to Pell. In our example these calculations would yield a total $81,270 (90 × $903) in Pell increases and $105,996 (132 × $803) in Pell decreases
How can you use this information? You can use the information to describe current verification and evaluate the need for improvement in your verification practices. The average number of ISIR fields per records and the percent of records experiencing a change to EFC and Pell all measure the need for verification. The higher these values the higher the need for verification. The dollar amount calculations for changes to Pell can help your aid office quantify the value of current verification efforts. By dividing the total dollar amount of Pell increases and decreases by the total volume of Pell provided on this report, you can calculate Pell under and over-awards in terms of the percent of initial Pell awards. Using our example report these calculations would be 8.3% ($81,270 ÷ $980,250) potential under-awards and 10.8%. ($105,996 ÷ $980,250) You can compare these percentages across different groups of students or
31 of 68 The ISIR Analysis Tool User Guide - 1/10/2011
award years. The raw dollar amounts are not as readily compared as percents because different years and subgroups will have different numbers of records.
Verification Summary Report
• What’s here? o Counts of records by CPS and School verification status o Within verification groups, counts of records experiencing an
increase and decrease to EFC • How can you use it?
o Evaluate efficiency of verification criteria o Drill down to a particular subset of records for further analysis
On the bottom pane of the Dashboard, the Verification Summary Report is available as a bar graph. The bar chart graphically represents the verification status of records uploaded into the tool as well as displaying the tendency of records in the various verification groups to experience an increase and decrease in EFC. As we explain later in this section, the Verification Summary Report can also be run under the Domain Tree.
To Enlarge the Verification Summary Report on the Dashboard: • Select the icon located in the right hand corner of the Verification
Summary Report. You can enlarge the box by selecting the icon on the top right corner – it is the middle icon.
• Note that the dashboard version of the Verification Summary Report is really two separate graphs. One for all dependent students and one for all independent students.
• If you would prefer to View Report as Text simply click on that link (see example report on the next page). Note that are two separate links to the text versions for this report, one for dependent and one for independent records.
• When you are done, select the X located at the top right hand corner of the Verification Summary Report to close the report.
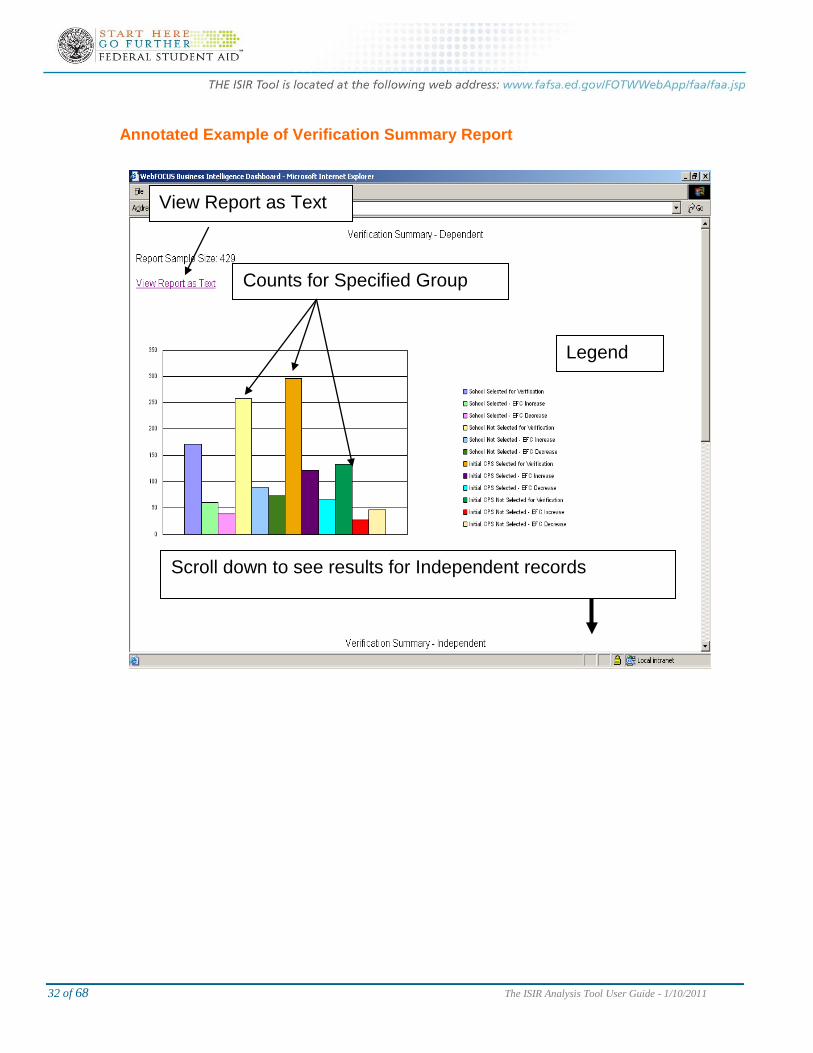
On the following page we provide an annotated example of a Verification Summary Report; this is followed by the “View Report as Text” version of the same information.
32 of 68 The ISIR Analysis Tool User Guide - 1/10/2011
Annotated Example of Verification Summary Report
Legend
Counts for Specified Group
Scroll down to see results for Independent records
View Report as Text
33 of 68 The ISIR Analysis Tool User Guide - 1/10/2011
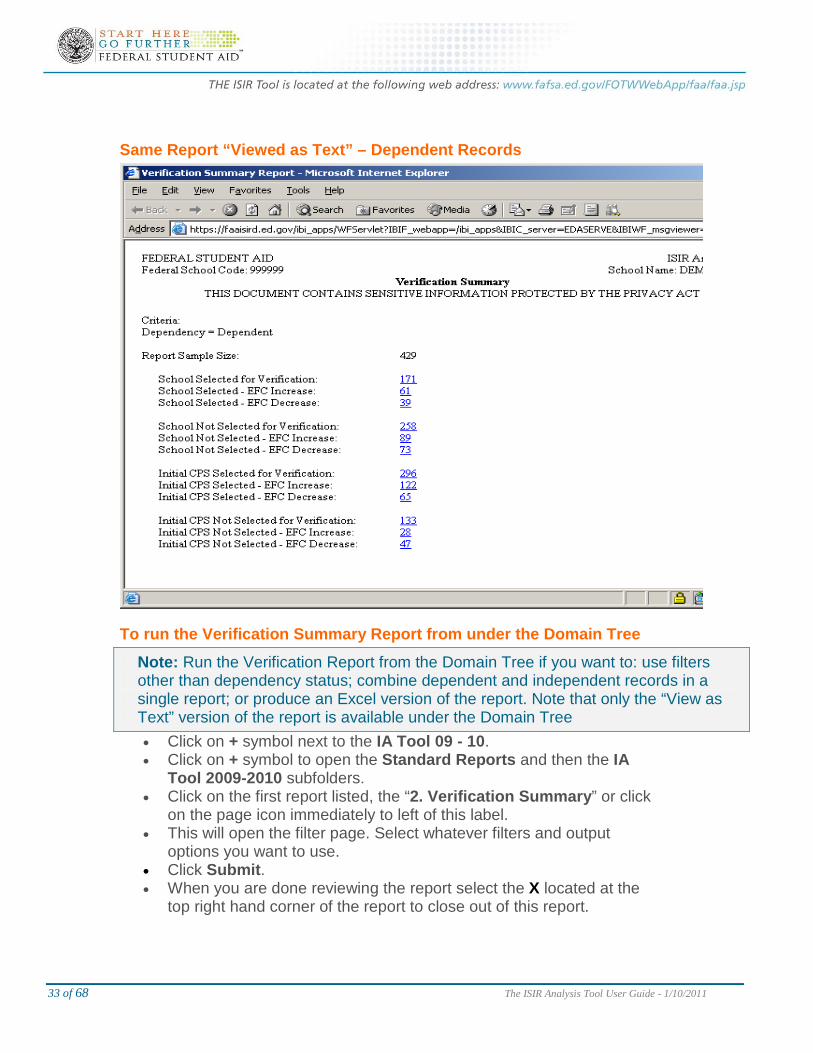
Same Report “Viewed as Text” – Dependent Records
To run the Verification Summary Report from under the Domain Tree
Note: Run the Verification Report from the Domain Tree if you want to: use filters other than dependency status; combine dependent and independent records in a single report; or produce an Excel version of the report. Note that only the “View as Text” version of the report is available under the Domain Tree • Click on + symbol next to the IA Tool 09 - 10. • Click on + symbol to open the Standard Reports and then the IA
Tool 2009-2010 subfolders. • Click on the first report listed, the “2. Verification Summary” or click
on the page icon immediately to left of this label. • This will open the filter page. Select whatever filters and output
options you want to use. • Click Submit. • When you are done reviewing the report select the X located at the
top right hand corner of the report to close out of this report.
34 of 68 The ISIR Analysis Tool User Guide - 1/10/2011
Questions the report answers
How many students were and were not selected for CPS verification?
How many students were and were not selected for School verification?
How many students in each of these four groups experienced an EFC increase or decrease between their initial and paid on transaction? All of the counts sought by the questions above correspond to bars in the default Dashboard version of the Verification Summary Report. The same information can also be found in the rows of data in the text version of the report.
How can you use this information? You can use these counts to evaluate the effectiveness of current School or CPS verification efforts. You can readily calculate the percent of verified records experiencing a change in EFC. To illustrate using the example text version of the report above, we would calculate that 58.5% ((61 + 39) ÷ 171) of dependent records selected for School verification experienced either an increase or decrease to EFC. Put another way, 41.5% (100% - 58.5%) of the School selected dependent records experienced no change to EFC. Ideally a high percentage of records selected for verification experience a change to EFC. While you could conduct analogous calculations using records not selected for School or CPS verification, the interpretation of these results varies depending on your school’s situation. Generally speaking, you have no way of knowing whether or not changes observed in either of the two not selected populations were in fact “corrections” or simply “second tries.” You might find it interesting to examine the level of change among non-selected students, but remember you generally don’t know whether or not each change was for the better. There is an important exception to this. Every other year, schools participating in the Quality Assurance Program conduct verification on 100% of records drawn into a random sample of their applicants and analyze the changes to ISIR information stemming from this exercise in the Tool. During sample years, Quality Assurance schools should determine the percentage of records not selected by their School criteria that experienced a change to EFC. Ideally, a low percentage of records not selected for verification experience a change to EFC
Further Guidance for Quality Assurance Schools:
During sample years, run the Verification Summary Report under the Domain tree using the filtering page to select students with initial EFC below your school’s cost of attendance.
35 of 68 The ISIR Analysis Tool User Guide - 1/10/2011
Drilling Down to Extend Analysis You can use your results from the Verification Summary report to focus further analysis on any of the individual counts displayed. You do this by simply clicking on the bar or count of interest. Doing so will “drill down” to a report that provides counts of specific ISIR field changes, the impact of these changes upon aid eligibility, and the percentage of records that experienced a change to the indicated ISIR field that were selected by CPS or School verification. This report is called the Field Change Report and is discussed in the next section of this chapter. Field Change Report
• What’s here? o Counts of records with specific changes o Description of the impact on EFC and Pell o The tendency of CPS and School to select records with a
given change for verification • How can you use it?
o Identify fields to target with outreach o Identify areas to target with verification o Drill down for more information on records with a specific
change
The Field Change Report provides counts of records experiencing changes to specific ISIR Fields between the initial and paid-on transaction. It provides percentage of records with the indicated change that also experience EFC increases or decreases, as well as Pell increases or decreases. It is important to keep in mind when using the Field Change Report that results are based solely on records that experienced at least one change to an ISIR field. Records where the initial and paid on transaction were the same are excluded from all counts and percentages.
To Run the Field Change Report from the Domain Tree: • From the Domain Tree, Select IA Tool 09–10 (left click on the
mouse). • Click the Standard Report (left click on mouse) Icon from the left
navigation bar and select IA Tool 2009- 2010. • Select 4. Field Change Report. If you receive the pop up box “Do
you want to display the Non Secure Items”, Select “yes”. • On the Filters page select any desired criteria. In the example report
that follows, under Dependency Status we selected: Dependent and under CPS Verification Flag we selected: Yes.
• Click Submit. • By default the Field Change Report displays changes to all ISIR
fields. See the screenshot below.
36 of 68 The ISIR Analysis Tool User Guide - 1/10/2011
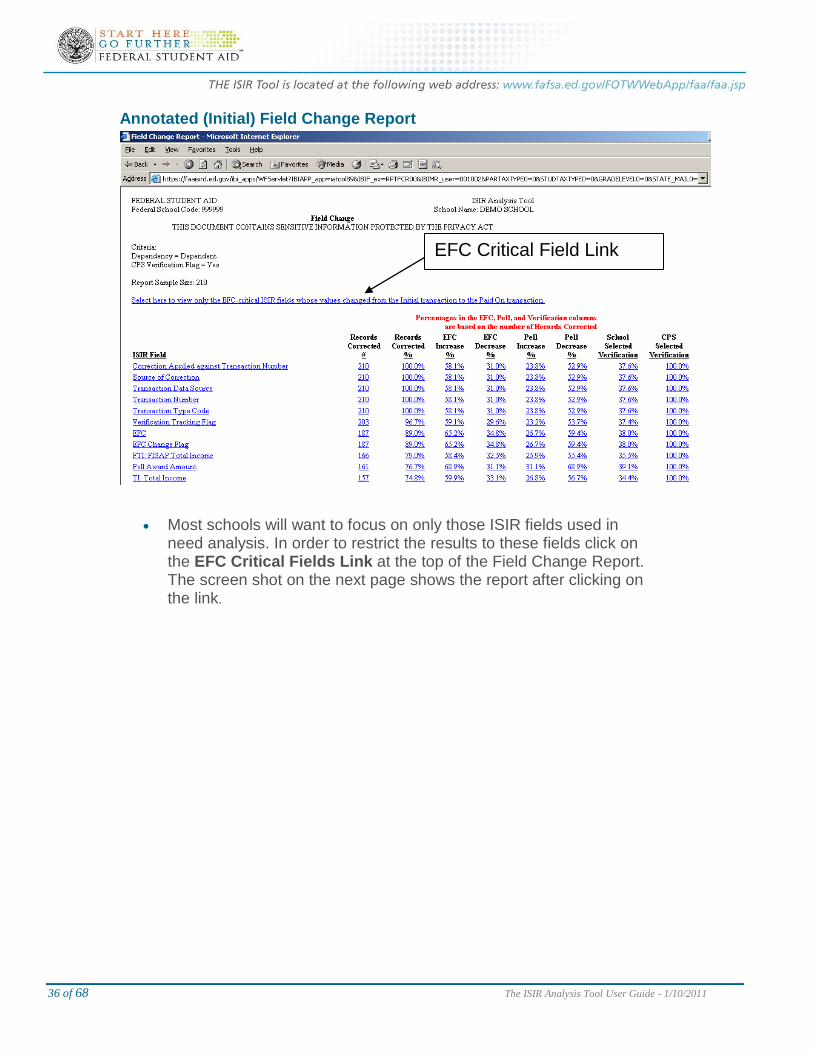
Annotated (Initial) Field Change Report
• Most schools will want to focus on only those ISIR fields used in need analysis. In order to restrict the results to these fields click on the EFC Critical Fields Link at the top of the Field Change Report. The screen shot on the next page shows the report after clicking on the link.
EFC Critical Field Link
37 of 68 The ISIR Analysis Tool User Guide - 1/10/2011
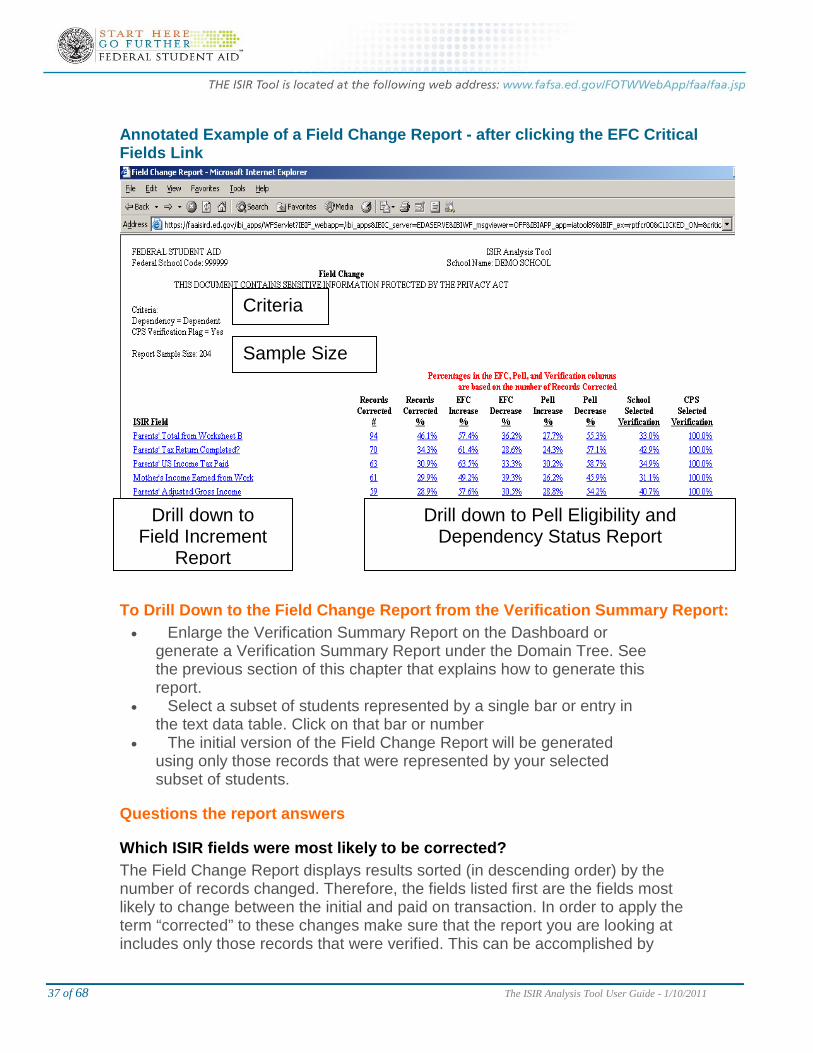
Annotated Example of a Field Change Report - after clicking the EFC Critical Fields Link
To Drill Down to the Field Change Report from the Verification Summary Report: • Enlarge the Verification Summary Report on the Dashboard or
generate a Verification Summary Report under the Domain Tree. See the previous section of this chapter that explains how to generate this report.
• Select a subset of students represented by a single bar or entry in the text data table. Click on that bar or number
• The initial version of the Field Change Report will be generated using only those records that were represented by your selected subset of students.
Questions the report answers
Which ISIR fields were most likely to be corrected? The Field Change Report displays results sorted (in descending order) by the number of records changed. Therefore, the fields listed first are the fields most likely to change between the initial and paid on transaction. In order to apply the term “corrected” to these changes make sure that the report you are looking at includes only those records that were verified. This can be accomplished by
Drill down to Field Increment
Report
Drill down to Pell Eligibility and Dependency Status Report
Criteria
Sample Size
38 of 68 The ISIR Analysis Tool User Guide - 1/10/2011
using the filtering page to include only those students that your school verified. Quality Assurance Program schools are reminded that when analyzing data from their random samples, all records in the Tool should have been verified even if they did not meet your school’s normal criteria.
Which corrections were most likely to be associated with a change to aid eligibility? The Field Change Report provides the percent of records corrected that also experienced: EFC increases; EFC decreases; Pell Increases; and Pell Decreases. When analyzing the ISIR fields most likely to change, look at the fields with larger EFC (Pell) increases and decreases. Just because an ISIR field is listed toward the top of the report does not necessarily mean those changes will affect EFC or Pell. As indicated by the red heading in the report the percentages displayed to the right of the records corrected column are based on the number of records corrected, not the entire report sample size. Therefore, you need to keep the percent of records correct in mind when interpreting all other table entries. You can easily derive the percent of all records experiencing a change to a specific field that also have the change to aid eligibility or verification status indicated by the column headings. Simply multiply the two percentages together. To illustrate using the first row of data from EFC critical field version of the report on page 17, we can determine that 26.4% (46.1% × 57.4%) of all records with a change experienced both a change to Parents’ Total from Worksheet B and an increase to EFC.
Tip:
If you are interested in performing the calculations described in the preceding paragraph, use the filtering page to select Excel as the report’s output format. This will allow you to use Excel to do the math.
Which corrections were most likely to be selected by either school or CPS verification criteria? The final two columns of the field change report provide the percent of records with the indicated change that were selected by either School or CPS verification. Generally speaking the higher these percentages, the better job school and CPS verification are doing in terms of catching these corrections. However, be sure to factor in the effect of any selection criteria you applied to the report when interpreting these percentages. In our example on page 17 of this chapter all the entries under CPS Selected Verification are 100% because the filtering criteria include CPS Verification Flag =Yes.
39 of 68 The ISIR Analysis Tool User Guide - 1/10/2011
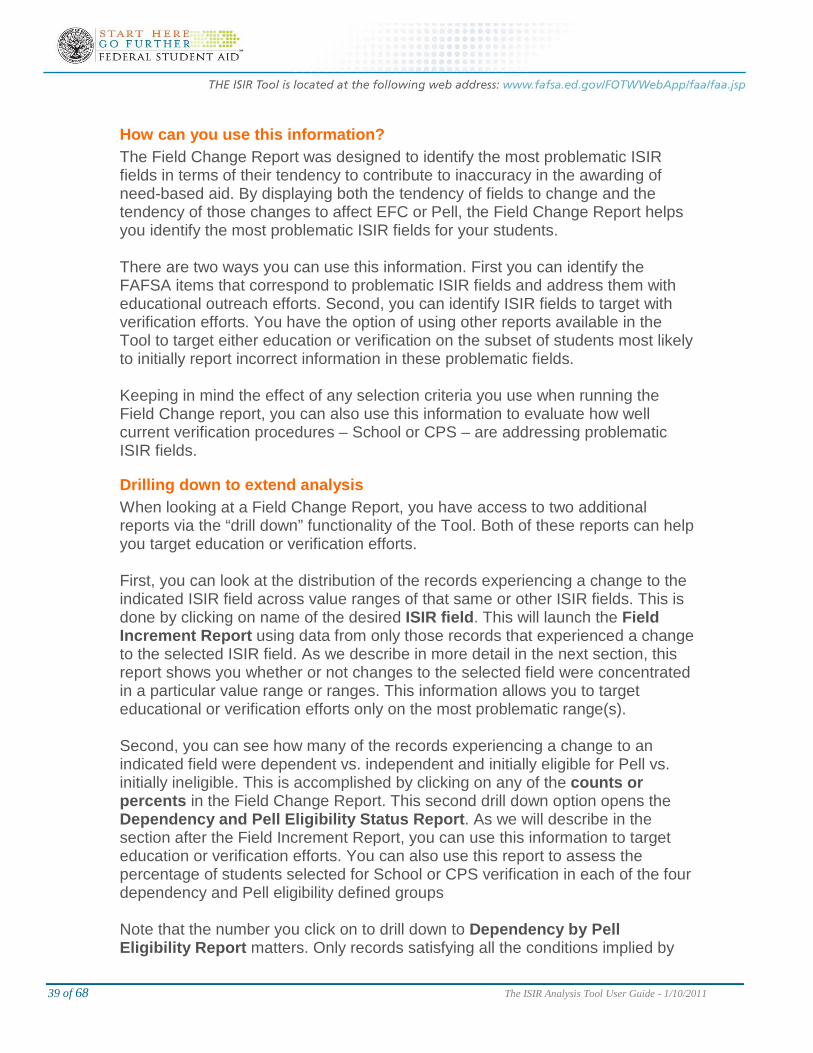
How can you use this information? The Field Change Report was designed to identify the most problematic ISIR fields in terms of their tendency to contribute to inaccuracy in the awarding of need-based aid. By displaying both the tendency of fields to change and the tendency of those changes to affect EFC or Pell, the Field Change Report helps you identify the most problematic ISIR fields for your students. There are two ways you can use this information. First you can identify the FAFSA items that correspond to problematic ISIR fields and address them with educational outreach efforts. Second, you can identify ISIR fields to target with verification efforts. You have the option of using other reports available in the Tool to target either education or verification on the subset of students most likely to initially report incorrect information in these problematic fields. Keeping in mind the effect of any selection criteria you use when running the Field Change report, you can also use this information to evaluate how well current verification procedures – School or CPS – are addressing problematic ISIR fields.
Drilling down to extend analysis When looking at a Field Change Report, you have access to two additional reports via the “drill down” functionality of the Tool. Both of these reports can help you target education or verification efforts. First, you can look at the distribution of the records experiencing a change to the indicated ISIR field across value ranges of that same or other ISIR fields. This is done by clicking on name of the desired ISIR field. This will launch the Field Increment Report using data from only those records that experienced a change to the selected ISIR field. As we describe in more detail in the next section, this report shows you whether or not changes to the selected field were concentrated in a particular value range or ranges. This information allows you to target educational or verification efforts only on the most problematic range(s). Second, you can see how many of the records experiencing a change to an indicated field were dependent vs. independent and initially eligible for Pell vs. initially ineligible. This is accomplished by clicking on any of the counts or percents in the Field Change Report. This second drill down option opens the Dependency and Pell Eligibility Status Report. As we will describe in the section after the Field Increment Report, you can use this information to target education or verification efforts. You can also use this report to assess the percentage of students selected for School or CPS verification in each of the four dependency and Pell eligibility defined groups Note that the number you click on to drill down to Dependency by Pell Eligibility Report matters. Only records satisfying all the conditions implied by
40 of 68 The ISIR Analysis Tool User Guide - 1/10/2011
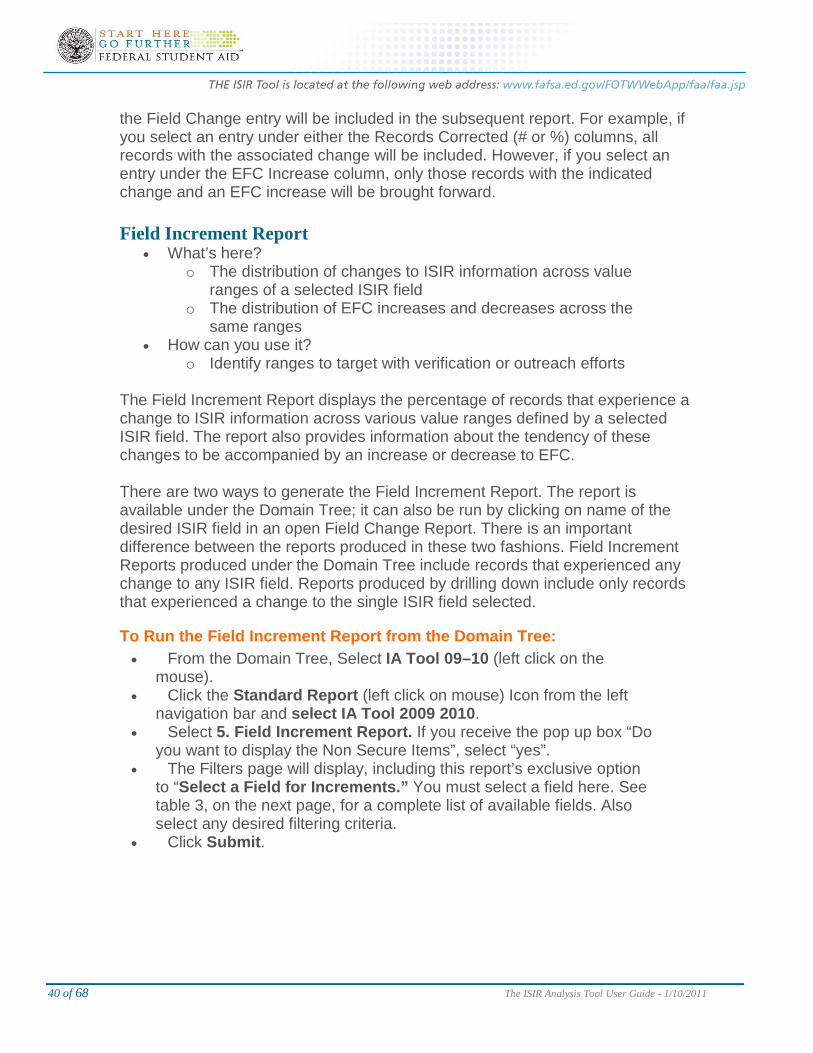
the Field Change entry will be included in the subsequent report. For example, if you select an entry under either the Records Corrected (# or %) columns, all records with the associated change will be included. However, if you select an entry under the EFC Increase column, only those records with the indicated change and an EFC increase will be brought forward. Field Increment Report
• What’s here? o The distribution of changes to ISIR information across value
ranges of a selected ISIR field o The distribution of EFC increases and decreases across the
same ranges • How can you use it?
o Identify ranges to target with verification or outreach efforts The Field Increment Report displays the percentage of records that experience a change to ISIR information across various value ranges defined by a selected ISIR field. The report also provides information about the tendency of these changes to be accompanied by an increase or decrease to EFC. There are two ways to generate the Field Increment Report. The report is available under the Domain Tree; it can also be run by clicking on name of the desired ISIR field in an open Field Change Report. There is an important difference between the reports produced in these two fashions. Field Increment Reports produced under the Domain Tree include records that experienced any change to any ISIR field. Reports produced by drilling down include only records that experienced a change to the single ISIR field selected.
To Run the Field Increment Report from the Domain Tree: • From the Domain Tree, Select IA Tool 09–10 (left click on the
mouse). • Click the Standard Report (left click on mouse) Icon from the left
navigation bar and select IA Tool 2009 2010. • Select 5. Field Increment Report. If you receive the pop up box “Do
you want to display the Non Secure Items”, select “yes”. • The Filters page will display, including this report’s exclusive option
to “Select a Field for Increments.” You must select a field here. See table 3, on the next page, for a complete list of available fields. Also select any desired filtering criteria.
• Click Submit.
41 of 68 The ISIR Analysis Tool User Guide - 1/10/2011
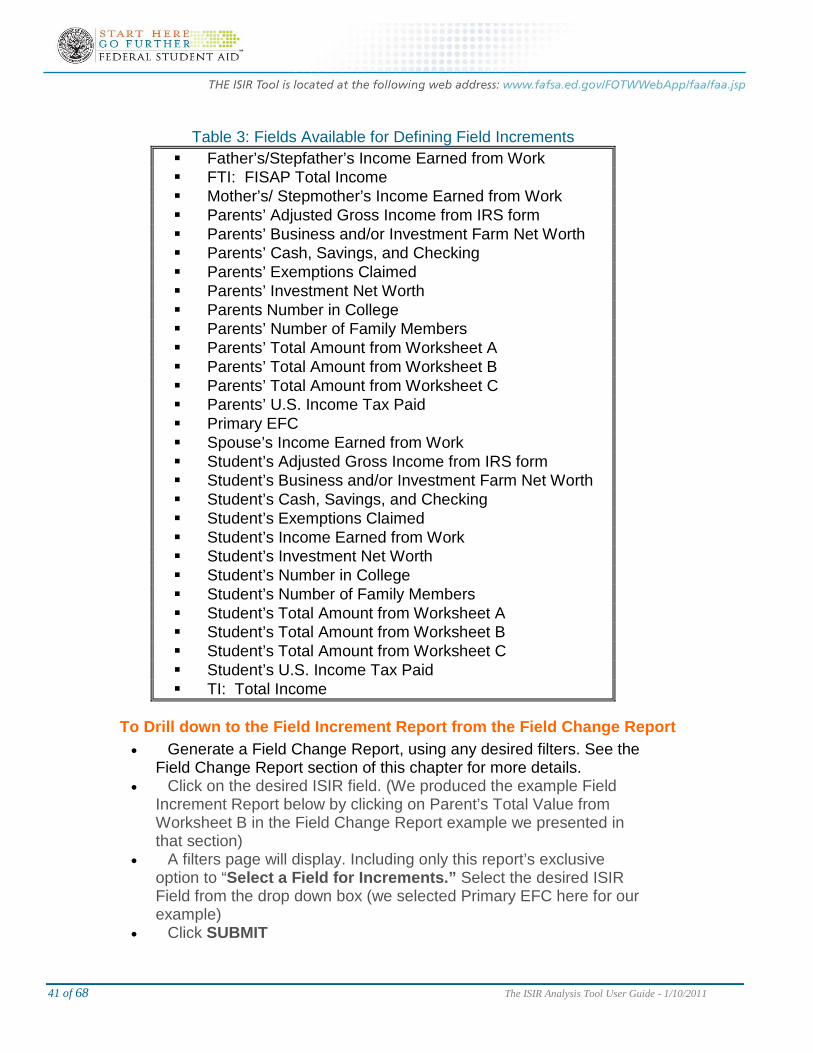
Table 3: Fields Available for Defining Field Increments
Father’s/Stepfather’s Income Earned from Work FTI: FISAP Total Income Mother’s/ Stepmother’s Income Earned from Work Parents’ Adjusted Gross Income from IRS form Parents’ Business and/or Investment Farm Net Worth Parents’ Cash, Savings, and Checking Parents’ Exemptions Claimed Parents’ Investment Net Worth Parents Number in College Parents’ Number of Family Members Parents’ Total Amount from Worksheet A Parents’ Total Amount from Worksheet B Parents’ Total Amount from Worksheet C Parents’ U.S. Income Tax Paid Primary EFC Spouse’s Income Earned from Work Student’s Adjusted Gross Income from IRS form Student’s Business and/or Investment Farm Net Worth Student’s Cash, Savings, and Checking Student’s Exemptions Claimed Student’s Income Earned from Work Student’s Investment Net Worth Student’s Number in College Student’s Number of Family Members Student’s Total Amount from Worksheet A Student’s Total Amount from Worksheet B Student’s Total Amount from Worksheet C Student’s U.S. Income Tax Paid TI: Total Income
To Drill down to the Field Increment Report from the Field Change Report • Generate a Field Change Report, using any desired filters. See the
Field Change Report section of this chapter for more details. • Click on the desired ISIR field. (We produced the example Field
Increment Report below by clicking on Parent’s Total Value from Worksheet B in the Field Change Report example we presented in that section)
• A filters page will display. Including only this report’s exclusive option to “Select a Field for Increments.” Select the desired ISIR Field from the drop down box (we selected Primary EFC here for our example)
• Click SUBMIT
42 of 68 The ISIR Analysis Tool User Guide - 1/10/2011
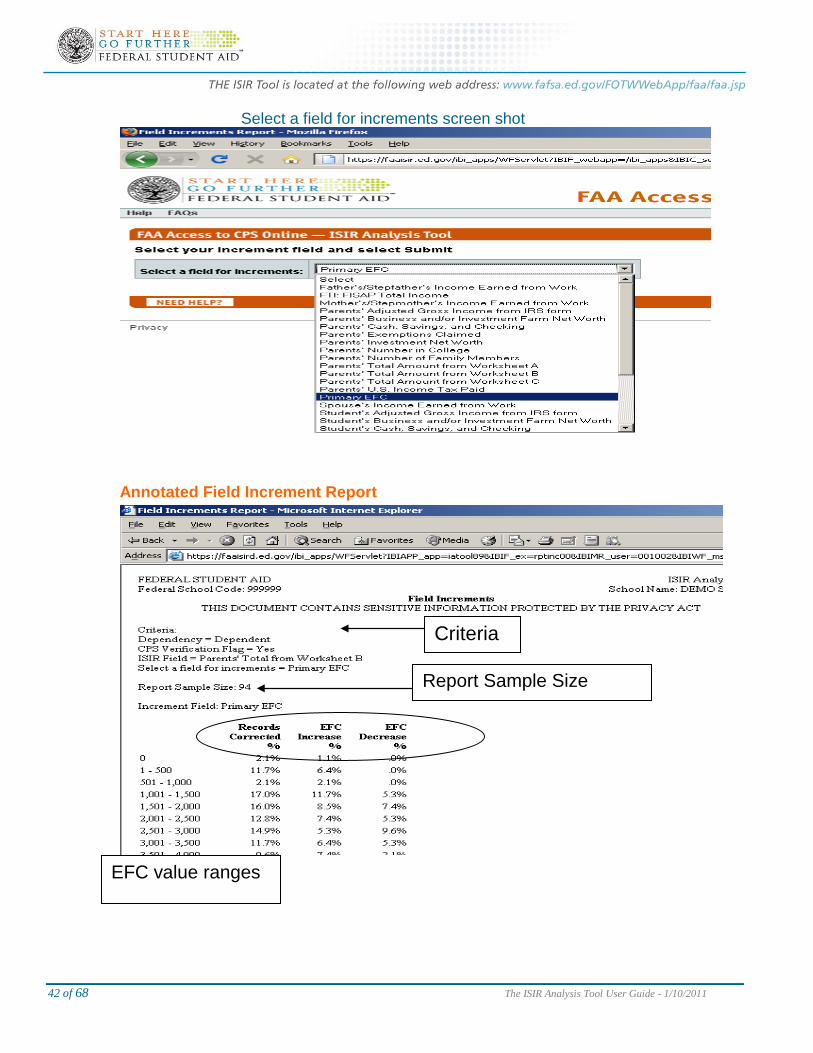
Select a field for increments screen shot
Annotated Field Increment Report
Criteria
Report Sample Size
EFC value ranges
43 of 68 The ISIR Analysis Tool User Guide - 1/10/2011
Questions the report answers
Are any corrections to ISIR fields concentrated within a particular value range of that or some other field? When you run the report from the Doman tree, the Field Increment Report will display the distribution of all corrections to ISIR information across value ranges of a selected ISIR field. By comparing the percent of records corrected in the different value ranges displayed, you can see whether or not changes are concentrated in one or more value ranges. Conversely. you also should look for value ranges that have relatively few corrections. In addition to considering the prevalence of corrections across the value ranges, you should temper the interpretation of your findings with the result displayed in EFC increase and decrease columns. When the sum of the two EFC-change entries is equal to or nearly equal to the percentage of records corrected, all or nearly all of the changes were associated with a potential change in aid eligibility. When this is the case, give your findings more weight. When the sum of EFC increases and decreases is significantly less than the total records corrected a good share of changes to ISIR information had no affect on EFC. Discount your findings in these situations. If you want to focus exclusively on preventing potential over-awards of need-based aid you can look at only the EFC increase column. Likewise if you want to concentrate on reducing potential under-awards, you can focus exclusively on the EFC decrease column.
Are changes to a particular field concentrated within a particular value range of that or some other field? When you drill down to the Field Increment Report from the Field Change Report, your results will display the distribution of all corrections to a single ISIR field. You interpret the findings just as described above, but they reflect only the changes to the field you selected.
How can you use this information? You can use this information to help target verification or education efforts. When analyzing the changes detected by your school’s current verification, you can look for value ranges where corrections to ISIR information are rare or where it rarely affects EFC. If practical you may want to consider excluding students within these ranges from future efforts. Schools participating in the Quality Assurance Program can use the Field Increment Report to find value ranges with high percentages of corrections that affect EFC among records they typically do not verify. Schools should consider adding the most problematic ranges to future school verification efforts.
44 of 68 The ISIR Analysis Tool User Guide - 1/10/2011
• What’s here Pell Eligibility by Dependency Status Report
o Counts of changes to ISIR information by Pell and dependency status
o Description of the impact on EFC and Pell within each group o The tendency of CPS and School verification to select records
with a given change within each group • How can you use it?
o Assess the need to target changes with either verification or outreach efforts
o Drill down to particular subset of records for further analysis
This report displays counts of changes to ISIR information broken out by dependency and Pell eligibility status. It also presents disaggregated percentages of these records selected by School and CPS verification. There are two ways to generate this report. The report is available under the Domain Tree; it can also be run by clicking on any of the count or percentage entry in the Field Change Report. The reports produced in these two fashions differ in an important way. Pell Eligibility by Dependency Status Reports produced under the Domain Tree includes records that experienced any change to any ISIR field. When drilling down from the Field Change Records, the records included depend on where on the drilling down took place. Only records satisfying all the conditions implied by the location on Field Change Report will be included in the subsequent Pell Eligibility by Dependency Report. For example, if you select an entry under either the Records Corrected (# or %) columns, all records with the associated change will be included. However, if you select an entry under the EFC Increase column, only those records with the indicated change and an EFC increase will be included.
To Run the Pell Eligibility by Dependency Status Report from the Domain Tree: • From the Domain Tree, Select IA Tool 09–10 (left click on the
mouse). • Select the Standard Report (left click on mouse) Icon from the left
navigation bar and select IA Tool 2009 - 2010. • Select 6. Pell Eligibility by Dependency Status Report. If you
receive the pop up box “Do you want to display the Non Secure Items”, Select “yes”.
• The Filters page will display. Select any desired filtering criteria. • Click Submit.
45 of 68 The ISIR Analysis Tool User Guide - 1/10/2011
To Drill down to the Pell Eligibility by Dependency Status Report from the Field Change Report:
• Generate a Field Change Report, using any desired filters. See the Field Change Report section of this chapter for more details.
• Drill down to the Pell Eligibility by Dependency report by clicking on any of the numbers entries (except the Report Sample Size) in the Field Change Report. Remember that this choice will determine which records are included in your report.
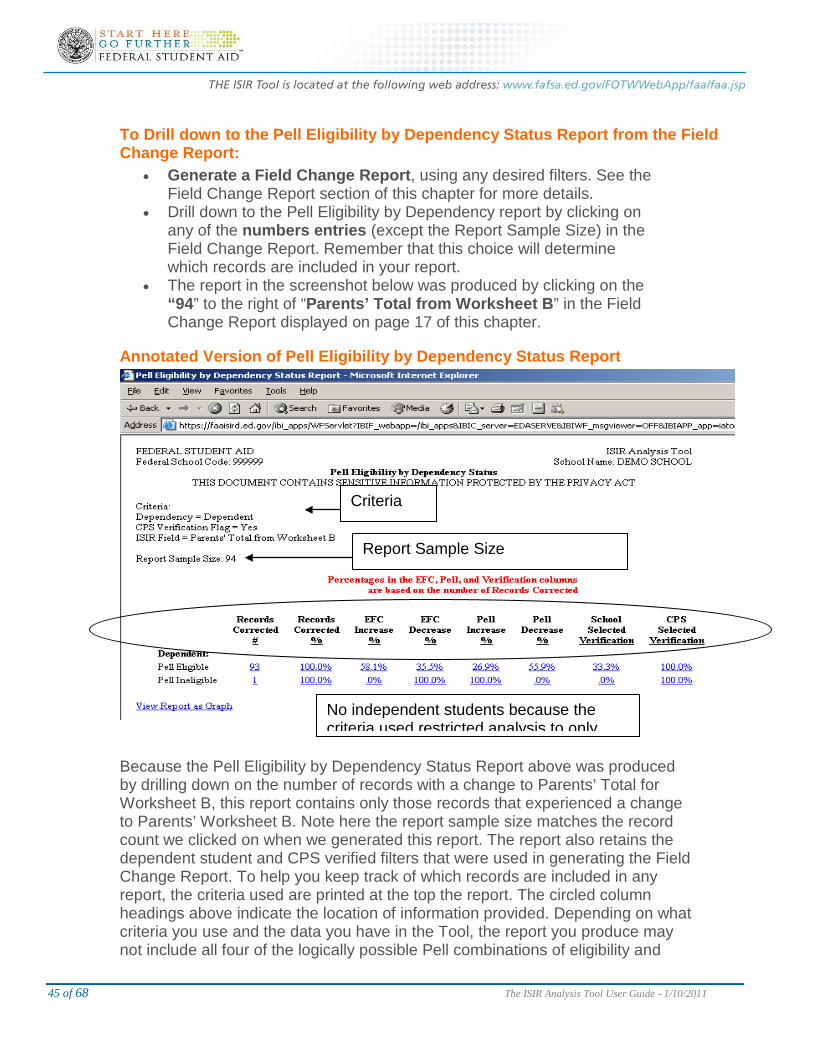
• The report in the screenshot below was produced by clicking on the “94” to the right of “Parents’ Total from Worksheet B” in the Field Change Report displayed on page 17 of this chapter.
Annotated Version of Pell Eligibility by Dependency Status Report
Because the Pell Eligibility by Dependency Status Report above was produced by drilling down on the number of records with a change to Parents’ Total for Worksheet B, this report contains only those records that experienced a change to Parents’ Worksheet B. Note here the report sample size matches the record count we clicked on when we generated this report. The report also retains the dependent student and CPS verified filters that were used in generating the Field Change Report. To help you keep track of which records are included in any report, the criteria used are printed at the top the report. The circled column headings above indicate the location of information provided. Depending on what criteria you use and the data you have in the Tool, the report you produce may not include all four of the logically possible Pell combinations of eligibility and
Criteria
Report Sample Size
No independent students because the criteria used restricted analysis to only
46 of 68 The ISIR Analysis Tool User Guide - 1/10/2011
dependency status. In our example there are no rows for independent students because the original Field Change Report selected only dependent records.
Questions the report answers
Are changes to ISIR information related to Pell eligibility and dependency status? You can use this report to address changes to ISIR information in general by running it from the Domain Tree. By drilling down from a Field Change report, you can use the report to answer questions about changes to a specific ISIR field. The report presents counts of corrected records accompanied by the effect the changes had on EFC and Pell data broken out by Pell and dependency status. You can compare the number of corrections and the tendency of those corrections to affect EFC or Pell. Because the data are presented side by side, it is easy to see if students who are eligible for Pell are different than ineligible students. If you do not filter the results by dependency status, you can also compare dependent and independent students that share the same Pell eligibility status.
How does the tendency for CPS or School verification to select records with changes to any or a specific ISIR field vary by the student’s Pell and dependency status? The ability to answer this second question is generally limited to Quality Assurance Program schools during a year they draw a random sample and verify all students in that sample whether or not those students met the school’s normal verification criteria. Outside a situation like this, there is no way to know how many changes School or CPS verification may be missing or how many of the changes outside of the verified population are really “corrections.” But when sample data are available, the last two columns of output in the Pell Eligibility by Dependency Status Report in essence give School and CPS verification flags a grade in terms of selecting records with changes. When using this report to grade their verification efforts, schools may want to use a filter to exclude students with an EFC higher than their cost of attendance. Corrections to ISIR information above this threshold are unlikely to affect aid eligibility. When interpreting their results, schools should look at all the columns not just the final two. High percentages are not necessarily good and low percentages aren’t necessarily bad. Ideally, the percent selected for verification would be high when the percent of EFC and Pell changes is high and low when those percentages are low.
47 of 68 The ISIR Analysis Tool User Guide - 1/10/2011
How can you use this information? Knowing whether or not Pell and dependency status are related to corrections to ISIR information and the tendency of those change to affect aid eligibility is helpful in targeting educational or verification efforts. For example, if you find that substantially more Pell eligible than ineligible students are initially misreporting additions to income, you might decide to target corrective measures exclusively on students eligible for Pell grants. If you are analyzing data from a random sample of aid applicants that have all been verified, you can assess the tendency of CPS and discretionary verification to miss students who experience a change to ISIR data that affect their eligibility for need based aid. You can use this information to improve your School verification procedures.
Drilling down to extend analysis By clicking on any of the blue counts or percentages in the Pell Eligibility by Dependency Status Report you can drill down to the Student Listing Report. This report provides a list of individual students including: identifying information; a summary of the change to EFC and Pell; and the student’s School and CPS verification status. You can use this information to identify individual students to review as part of your analysis. Student Listing Report
• What’s there? o List of students’ name, SSN, EFC change, Pell Change,
School verification and CPS verification status • How can you use it?
o See tendency of School and CPS verification to select records with and without changes to EFC and Pell
o Drill down to Student Detail Report for more information This report provides a list of students containing: social security number; name; an indication of whether their EFC increased, decreased, or stayed the same; an indication of whether their Pell amount increased, decreased, or stayed the same; whether or not the student was selected by the School for verification; and whether or not the student was selected by the CPS for verification. There are two ways to generate this report. The report is available under the Domain Tree; it can also be run by clicking on any of the numeric cell entries identified in blue in the Pell Eligibility by Dependency Status Report. If launched from under the Domain Tree, the report will include whatever records satisfy any filtering selections you make. When drilling down from the Pell Eligibility by Dependency Status Report, the records included are determined by where you click when drilling down. Only records satisfying all the conditions implied by that location will be included in the subsequent Student Listing. For example, if you selected the count of dependent, Pell eligible students under the Records
48 of 68 The ISIR Analysis Tool User Guide - 1/10/2011
Corrected # column, all dependent, Pell-eligible records would be included. However, if you select the entry in the same row under the Pell Increase column, only dependent, Pell-eligible records that experienced a Pell increase will be included on the Student Listing.
To Run the Student Listing Report from the Domain Tree: • From the Domain Tree, Select IA Tool 09–10. • Select the Standard Report Icon from the left navigation bar and
select IA Tool 2009-2010. • Select 8. Student Listing. If you receive the pop up box “Do you
want to display the Non Secure Items”, Select “yes”. • The Filters page will display. Select any desired filtering criteria. • Click Submit.
To Drill down to the Student Listing Report from the Pell Eligibility by Dependency Status Report:
• Generate a Pell Eligibility by Dependency Status Report, using any desired filters. See the section of this chapter devoted to that report for more details.
• From the Pell Eligibility by Dependency Status Report, drill down to the Student Listing Report by clicking on any of the cell entries in blue. Remember the cell from which you drill down will determine which records will be included in the Listing.
On the next page we present an example Student Listing Report. We produced this report by drilling down from the 58.1% of dependent, Pell eligible students that experience an EFC increase on the Pell Eligibility by Dependency Report displayed on page 25. Note that the all the criteria that have been applied to this report are listed at the top of the page.
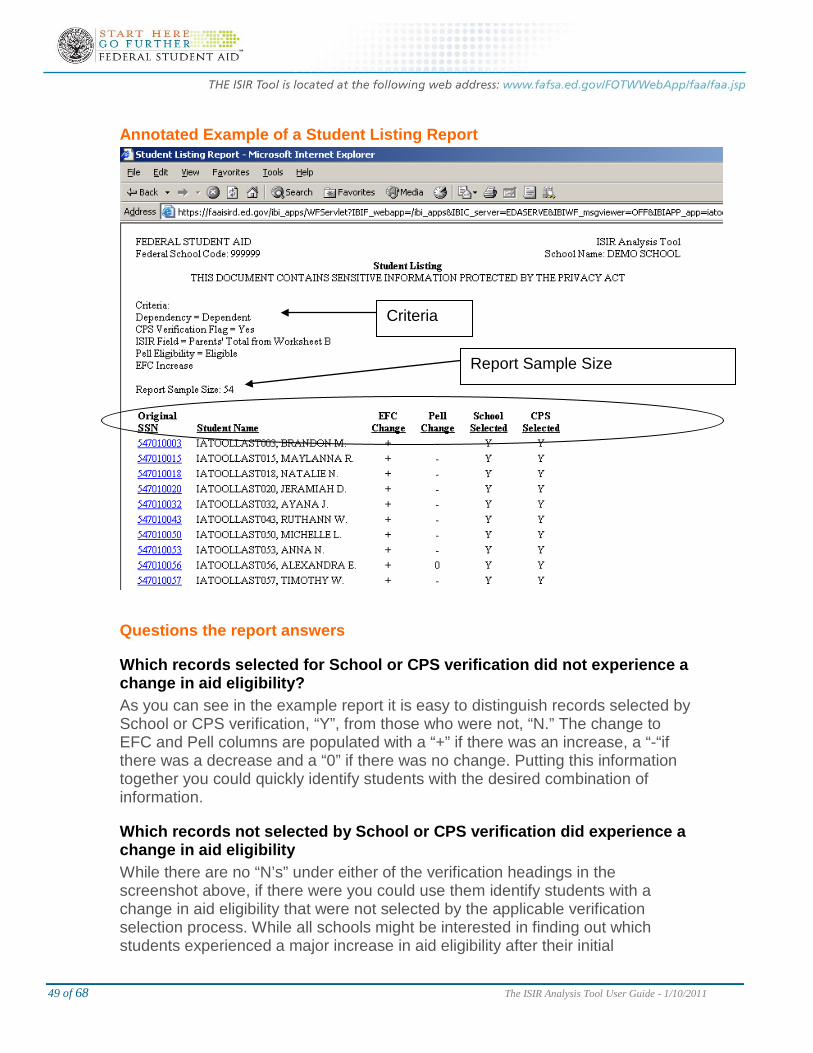
49 of 68 The ISIR Analysis Tool User Guide - 1/10/2011
Annotated Example of a Student Listing Report
Questions the report answers
Which records selected for School or CPS verification did not experience a change in aid eligibility? As you can see in the example report it is easy to distinguish records selected by School or CPS verification, “Y”, from those who were not, “N.” The change to EFC and Pell columns are populated with a “+” if there was an increase, a “-“if there was a decrease and a “0” if there was no change. Putting this information together you could quickly identify students with the desired combination of information.
Which records not selected by School or CPS verification did experience a change in aid eligibility While there are no “N’s” under either of the verification headings in the screenshot above, if there were you could use them identify students with a change in aid eligibility that were not selected by the applicable verification selection process. While all schools might be interested in finding out which students experienced a major increase in aid eligibility after their initial
Report Sample Size
Criteria
50 of 68 The ISIR Analysis Tool User Guide - 1/10/2011
application, only Quality Assurance Program Schools analyzing their random sample data can interpret these changes as corrections missed by current verification procedures.
How can you use this information? The main purpose of the Student Listing Report is to make it easier for you to select the records with the desired combination of verification status and change in aid eligibility. By drilling down on an individual student’s social security number, you can look at all the changes that occurred between the initial and paid on transaction as well as get basic demographic information on the individual student. Comparing and contrasting the details in this second report may provide insight into improving verification or educational efforts. All schools can use the Student Listing to help them contrast verified students with changes to aid eligibility and verified students without. During this exercise you should look for ways to distinguish students with changes from those without in the second level reports. The idea is to try to stop wasting time and effort verifying the types of students that are unlikely to experience a change in aid eligibility. If you are analyzing data from a random sample of aid applicants that have all been verified, you could analyze the population not normally selected for verification in a similar fashion. In this situation you try to find ways to distinguish non-verified students with changes to EFC and Pell from those without. The goal would be to add the types of students likely to experience EFC and Pell changes to your school’s future verification or educational efforts. Given the student identifying information included on the Student Listing Report, you could also use this reporting template to export the data into another application for further analysis. When using the report in this fashion, we recommend that you use the filtering page to change the output format to Excel.
Drilling down to extend analysis By clicking on the social security number of a student, you can drill down to the Student Detail Report for that student. This report provides a complete listing of all the changes to ISIR information that occurred between the initial and paid on transaction for that student. As discussed above, this is the information you use to compare students with different verification outcomes. The main purpose of the Student Listing Report is to make it easier for you to find the right Student Detail Reports to view. The next section of this chapter provides details on how to run and interpret this report.
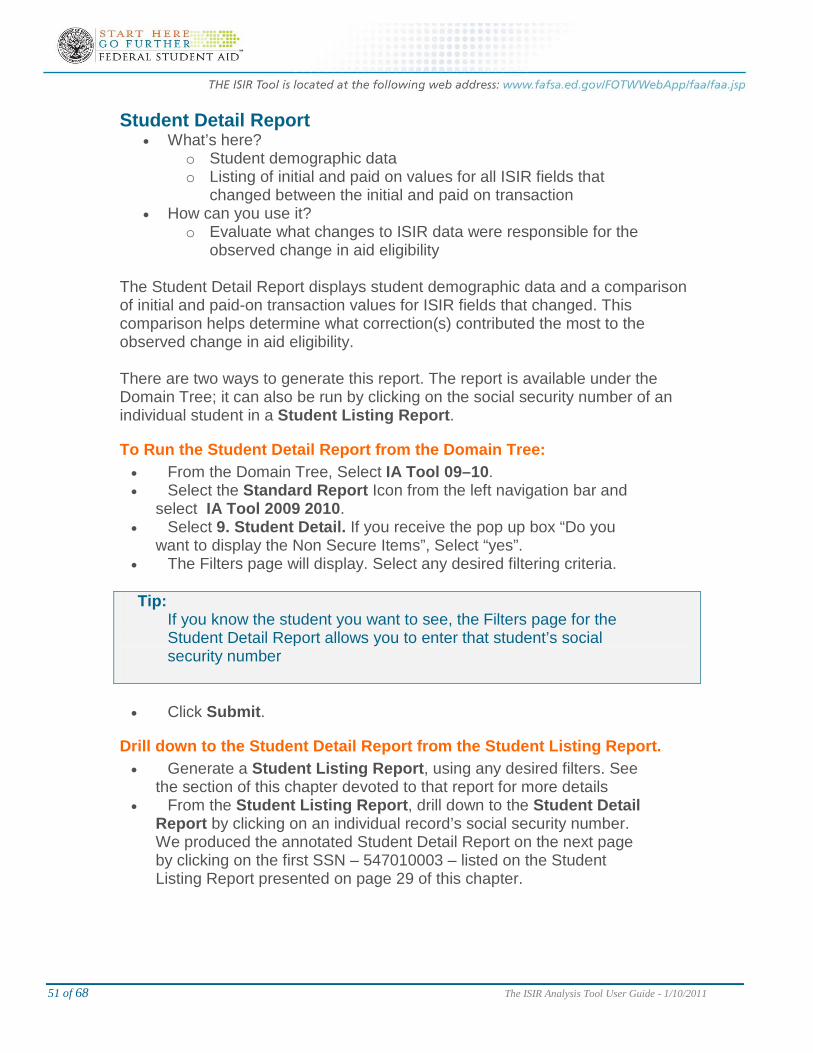
51 of 68 The ISIR Analysis Tool User Guide - 1/10/2011
Student Detail Report • What’s here?
o Student demographic data o Listing of initial and paid on values for all ISIR fields that
changed between the initial and paid on transaction • How can you use it?
o Evaluate what changes to ISIR data were responsible for the observed change in aid eligibility
The Student Detail Report displays student demographic data and a comparison of initial and paid-on transaction values for ISIR fields that changed. This comparison helps determine what correction(s) contributed the most to the observed change in aid eligibility. There are two ways to generate this report. The report is available under the Domain Tree; it can also be run by clicking on the social security number of an individual student in a Student Listing Report.
To Run the Student Detail Report from the Domain Tree: • From the Domain Tree, Select IA Tool 09–10. • Select the Standard Report Icon from the left navigation bar and
select IA Tool 2009 2010. • Select 9. Student Detail. If you receive the pop up box “Do you
want to display the Non Secure Items”, Select “yes”. • The Filters page will display. Select any desired filtering criteria. Tip:
If you know the student you want to see, the Filters page for the Student Detail Report allows you to enter that student’s social security number
• Click Submit.
Drill down to the Student Detail Report from the Student Listing Report. • Generate a Student Listing Report, using any desired filters. See
the section of this chapter devoted to that report for more details • From the Student Listing Report, drill down to the Student Detail
Report by clicking on an individual record’s social security number. We produced the annotated Student Detail Report on the next page by clicking on the first SSN – 547010003 – listed on the Student Listing Report presented on page 29 of this chapter.
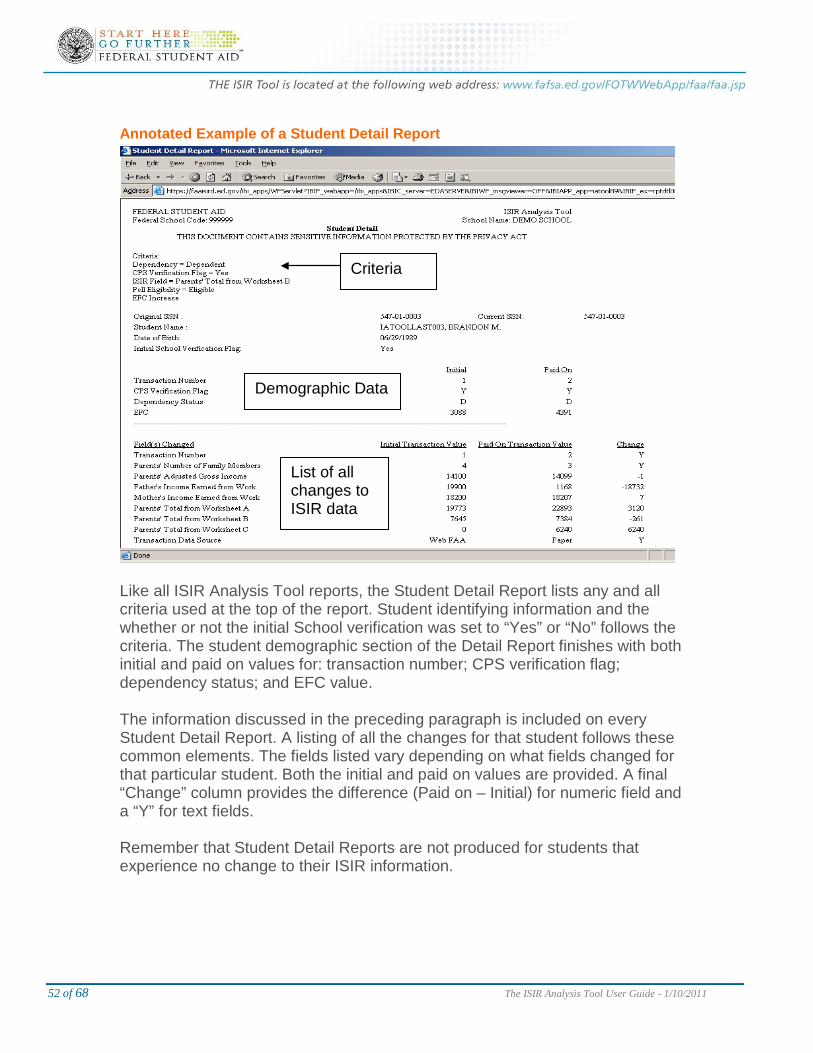
52 of 68 The ISIR Analysis Tool User Guide - 1/10/2011
Annotated Example of a Student Detail Report
Like all ISIR Analysis Tool reports, the Student Detail Report lists any and all criteria used at the top of the report. Student identifying information and the whether or not the initial School verification was set to “Yes” or “No” follows the criteria. The student demographic section of the Detail Report finishes with both initial and paid on values for: transaction number; CPS verification flag; dependency status; and EFC value. The information discussed in the preceding paragraph is included on every Student Detail Report. A listing of all the changes for that student follows these common elements. The fields listed vary depending on what fields changed for that particular student. Both the initial and paid on values are provided. A final “Change” column provides the difference (Paid on – Initial) for numeric field and a “Y” for text fields. Remember that Student Detail Reports are not produced for students that experience no change to their ISIR information.
Criteria
Demographic Data
List of all changes to ISIR data
53 of 68 The ISIR Analysis Tool User Guide - 1/10/2011
Questions the report answers
What was the impact on this student’s EFC? The initial and paid on EFC values are the final entry in the common “demographic data” section of the Student Detail Report. By subtracting one from the other, you can calculate the effect of all changes in ISIR data on aid eligibility.
What ISIR information changed after the initial application? Below the common area, the Student Detail Report lists all the changes to ISIR fields.
What was the primary reason for observed changes to EFC? By reviewing the magnitude and direction of all the changes, you can determine which change or changes were primarily responsible for the correction to EFC. Students often misreport ISIR data by a trivial amount. For example, students may initially report rounded off income and tax figures. While these values will be corrected during verification, it is important to distinguish such errors from more profound corrections.
How can you use this information? You can use the information on the Student Detail Report to understand the full context of the observed change in aid eligibility. By strategically comparing students with no or a trivial change in EFC to those records with a substantial change to EFC; you may be able to gain insight into how to best target your educational and verification efforts. EFC Impact Analysis Report
• What’s here? o Graph or table with counts of changes to any and the five most
commonly changed critical ISIR fields disaggregated by initial EFC value range
• How can you use it? o Determine if changes to ISIR fields are concentrated in an
initial EFC range o Target verification or outreach efforts
This report can assist you in refining your verification procedures by identifying which initial EFC value range accounts for most of the changes to EFC critical fields. The three EFC value ranges for 2008-09 award year were 0, 1-4041, and 4042 or more. These value ranges change annually, but always represent zero EFC, Pell eligible with an EFC greater than zero, and Pell ineligible students.
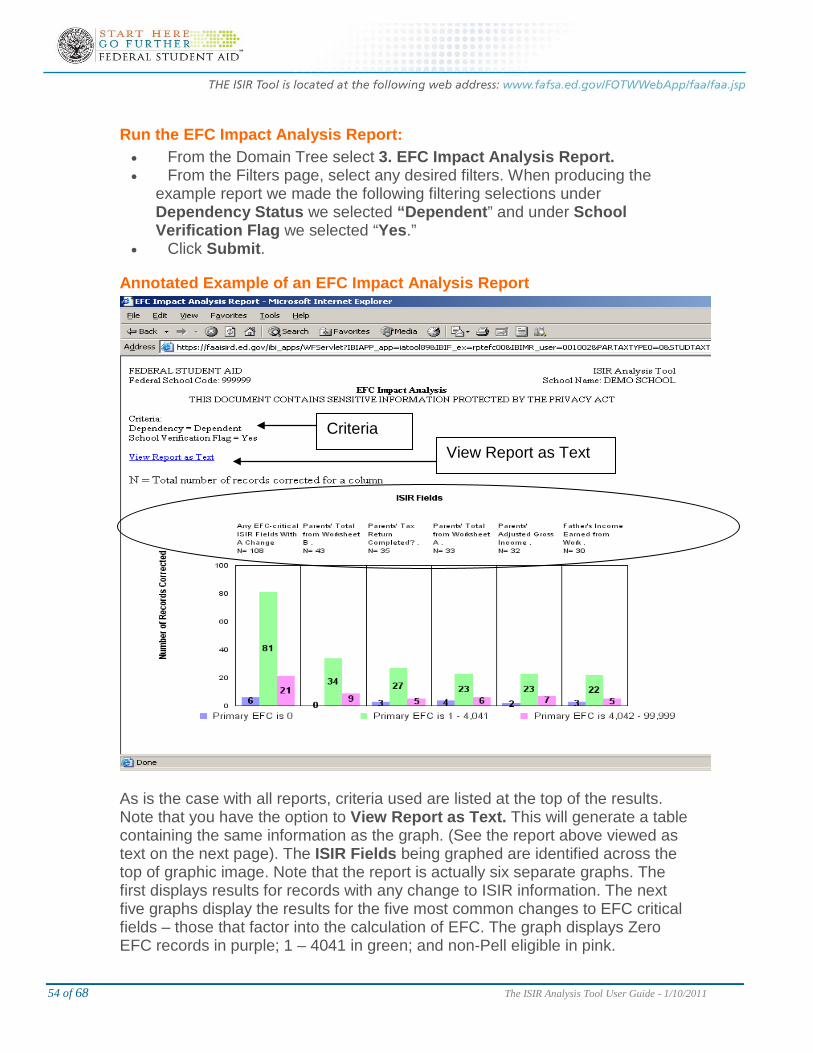
54 of 68 The ISIR Analysis Tool User Guide - 1/10/2011
Run the EFC Impact Analysis Report: • From the Domain Tree select 3. EFC Impact Analysis Report. • From the Filters page, select any desired filters. When producing the
example report we made the following filtering selections under Dependency Status we selected “Dependent” and under School Verification Flag we selected “Yes.”
• Click Submit.
Annotated Example of an EFC Impact Analysis Report
As is the case with all reports, criteria used are listed at the top of the results. Note that you have the option to View Report as Text. This will generate a table containing the same information as the graph. (See the report above viewed as text on the next page). The ISIR Fields being graphed are identified across the top of graphic image. Note that the report is actually six separate graphs. The first displays results for records with any change to ISIR information. The next five graphs display the results for the five most common changes to EFC critical fields – those that factor into the calculation of EFC. The graph displays Zero EFC records in purple; 1 – 4041 in green; and non-Pell eligible in pink.
Criteria View Report as Text
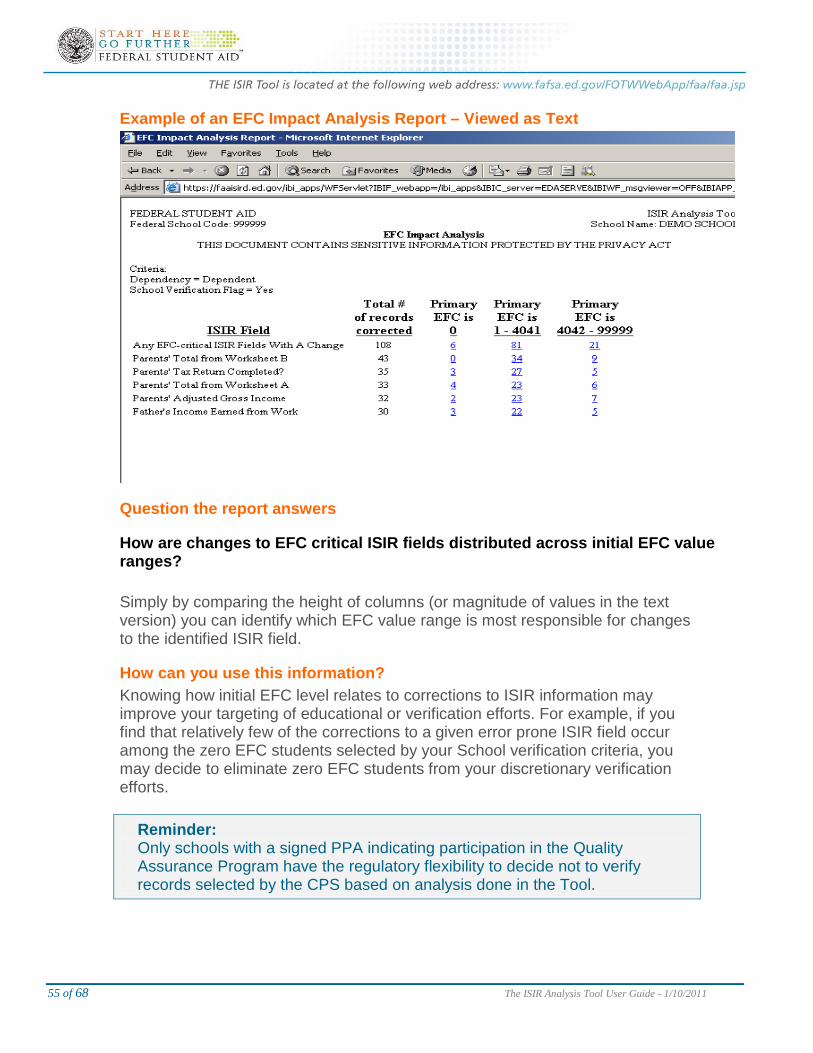
55 of 68 The ISIR Analysis Tool User Guide - 1/10/2011
Example of an EFC Impact Analysis Report – Viewed as Text
Question the report answers
How are changes to EFC critical ISIR fields distributed across initial EFC value ranges?
Simply by comparing the height of columns (or magnitude of values in the text version) you can identify which EFC value range is most responsible for changes to the identified ISIR field.
How can you use this information? Knowing how initial EFC level relates to corrections to ISIR information may improve your targeting of educational or verification efforts. For example, if you find that relatively few of the corrections to a given error prone ISIR field occur among the zero EFC students selected by your School verification criteria, you may decide to eliminate zero EFC students from your discretionary verification efforts.
Reminder: Only schools with a signed PPA indicating participation in the Quality Assurance Program have the regulatory flexibility to decide not to verify records selected by the CPS based on analysis done in the Tool.
56 of 68 The ISIR Analysis Tool User Guide - 1/10/2011
Drilling down to extend analysis When looking at an EFC Impact Analysis Report, you have “drill down” access to the Pell Eligibility by Dependency Status Report. As we described in the section of this chapter devoted to that report, you can use this information to target education or verification efforts. You can also use the Pell Eligibility by Dependency Status Report to assess the percentage of students selected for School and CPS verification in each of the four dependency and Pell eligibility defined groups. Note that the column on the graph or the number in the text version of the reports determines which ISIR field change and which EFC value range will be included in the resulting report. After drilling down to the Pell Eligibility by Dependency Status Report, you may continue onto the Student Listing and Student Detail Reports as explained in the sections of this chapter that describe those reports.
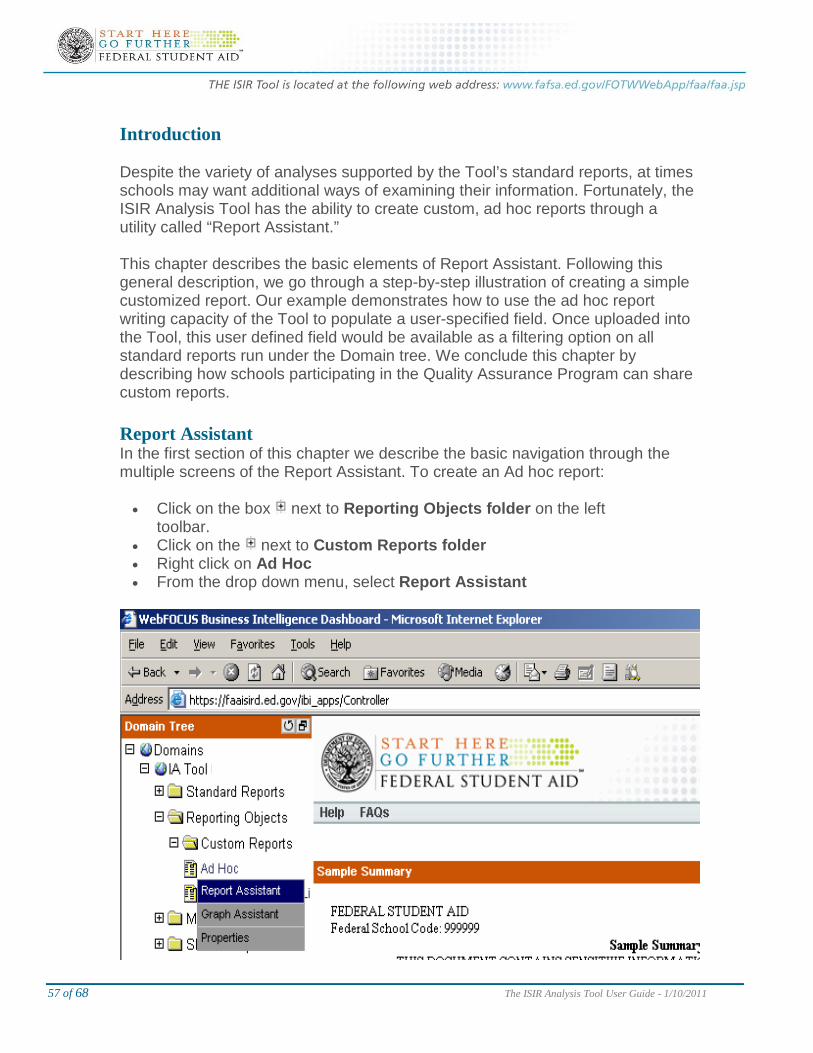
57 of 68 The ISIR Analysis Tool User Guide - 1/10/2011
Introduction
Despite the variety of analyses supported by the Tool’s standard reports, at times schools may want additional ways of examining their information. Fortunately, the ISIR Analysis Tool has the ability to create custom, ad hoc reports through a utility called “Report Assistant.” This chapter describes the basic elements of Report Assistant. Following this general description, we go through a step-by-step illustration of creating a simple customized report. Our example demonstrates how to use the ad hoc report writing capacity of the Tool to populate a user-specified field. Once uploaded into the Tool, this user defined field would be available as a filtering option on all standard reports run under the Domain tree. We conclude this chapter by describing how schools participating in the Quality Assurance Program can share custom reports. Report Assistant In the first section of this chapter we describe the basic navigation through the multiple screens of the Report Assistant. To create an Ad hoc report:
• Click on the box next to Reporting Objects folder on the left
toolbar. • Click on the next to Custom Reports folder • Right click on Ad Hoc • From the drop down menu, select Report Assistant
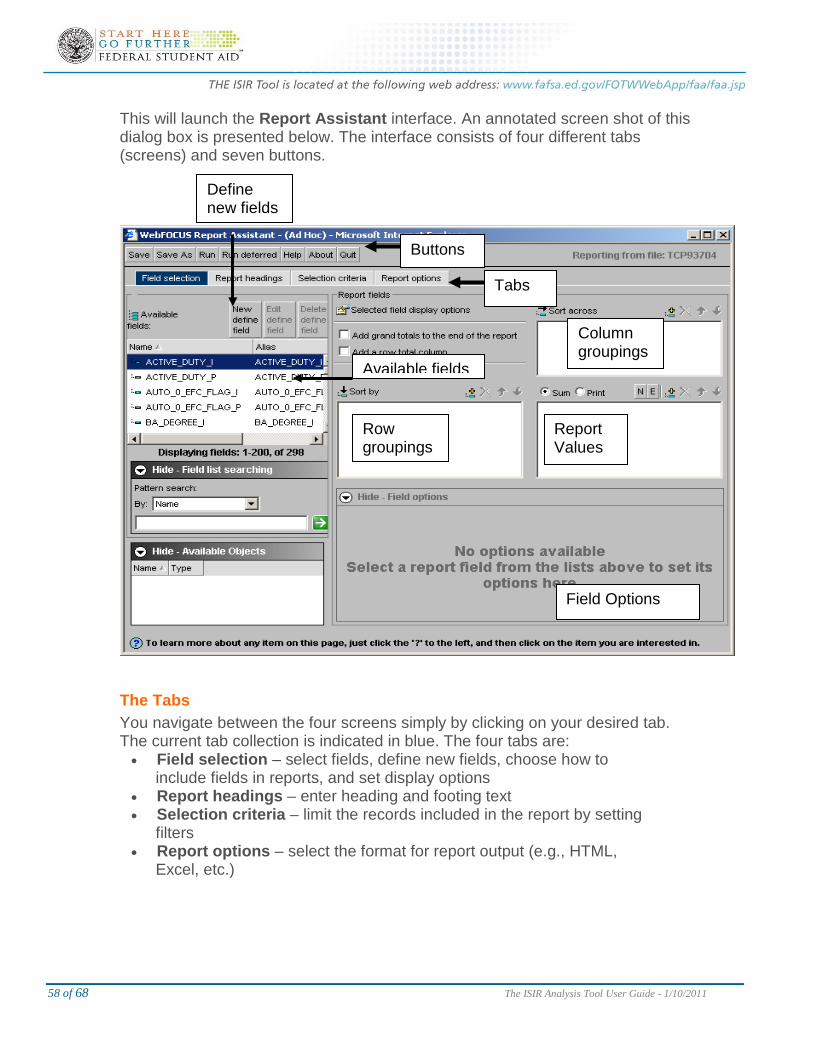
58 of 68 The ISIR Analysis Tool User Guide - 1/10/2011
This will launch the Report Assistant interface. An annotated screen shot of this dialog box is presented below. The interface consists of four different tabs (screens) and seven buttons.
The Tabs You navigate between the four screens simply by clicking on your desired tab. The current tab collection is indicated in blue. The four tabs are: • Field selection – select fields, define new fields, choose how to
include fields in reports, and set display options • Report headings – enter heading and footing text • Selection criteria – limit the records included in the report by setting
filters • Report options – select the format for report output (e.g., HTML,
Excel, etc.)
Buttons
Tabs
Row groupings
Column groupings
Report Values
Define new fields
Available fields
Field Options
59 of 68 The ISIR Analysis Tool User Guide - 1/10/2011
The Buttons The seven buttons that run along the top of the screen are available in all tabs. Use them to: • Save – save the current report settings • Save as – save the current report settings under a new name • Run – execute the report • Run deferred – this function is not currently supported • Help – access Report Assistant’s online help • About – display technical information about the version of Report
Assistant being used • Quit – leave Report Assistant
The Field Selection Tab Report Assistant opens in the Field Selection tab. This is appropriate, as users will spend the vast majority of their time authoring Ad hoc reports working under this tab. To select fields use the box labeled “Available Fields.” Simply highlight the field(s) you would like to include in your report.
Tip – to select multiple fields hold down the control key.
You have choices in how you include the selected fields in a report. Fields can be “Report Values” or be used to define “Column or Row Groupings.” See the annotated screen shot above. You place highlighted fields in the desired box by
clicking on the “yellow/teal, plus/minus sign” icon above the desired box. To group records based on their value, place the selected field(s) in either “Sort by” or “Sort across” windows. If you want the report to reflect the values of the selected field, click the plus/minus sign icon to the right of the Sum and Print radio buttons. You can add as many fields as you want to the boxes. Clicking Sum or Print above the report values box changes the options available for displaying the values of select fields in this box. Select Print when you want the report to be a listing of all individual record values for the selected fields. Select Sum when you want a report summarizing the values of multiple students in a single statistic (e.g., average or sum).
NEW – that the default has changed from Print to Sum.
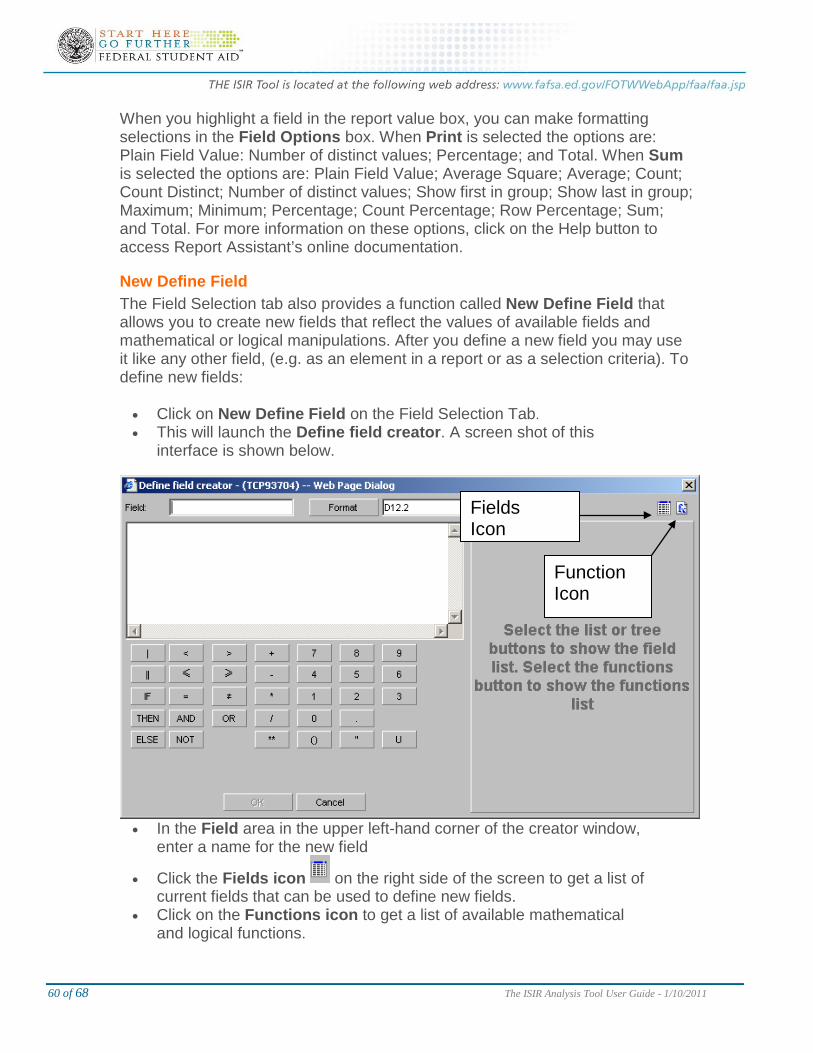
60 of 68 The ISIR Analysis Tool User Guide - 1/10/2011
When you highlight a field in the report value box, you can make formatting selections in the Field Options box. When Print is selected the options are: Plain Field Value: Number of distinct values; Percentage; and Total. When Sum is selected the options are: Plain Field Value; Average Square; Average; Count; Count Distinct; Number of distinct values; Show first in group; Show last in group; Maximum; Minimum; Percentage; Count Percentage; Row Percentage; Sum; and Total. For more information on these options, click on the Help button to access Report Assistant’s online documentation.
New Define Field The Field Selection tab also provides a function called New Define Field that allows you to create new fields that reflect the values of available fields and mathematical or logical manipulations. After you define a new field you may use it like any other field, (e.g. as an element in a report or as a selection criteria). To define new fields: • Click on New Define Field on the Field Selection Tab. • This will launch the Define field creator. A screen shot of this
interface is shown below.
• In the Field area in the upper left-hand corner of the creator window,
enter a name for the new field
• Click the Fields icon on the right side of the screen to get a list of current fields that can be used to define new fields.
• Click on the Functions icon to get a list of available mathematical and logical functions.
Function Icon
Fields Icon
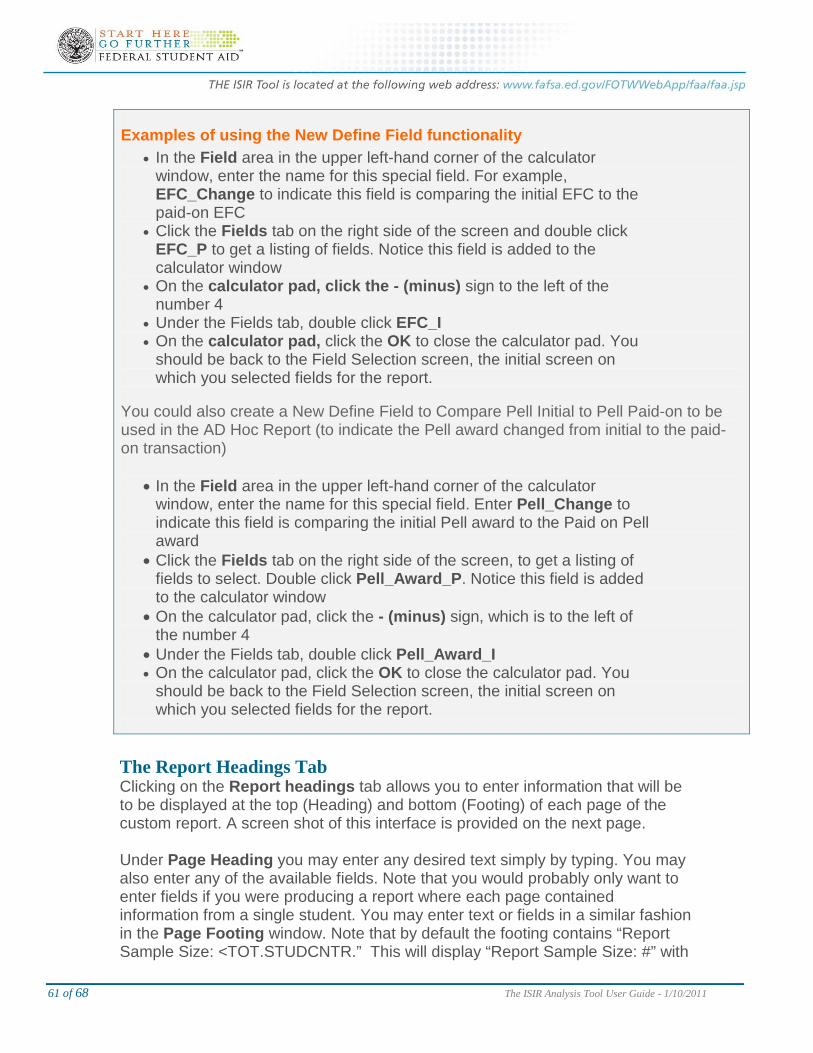
61 of 68 The ISIR Analysis Tool User Guide - 1/10/2011
Examples of using the New Define Field functionality • In the Field area in the upper left-hand corner of the calculator
window, enter the name for this special field. For example, EFC_Change to indicate this field is comparing the initial EFC to the paid-on EFC
• Click the Fields tab on the right side of the screen and double click EFC_P to get a listing of fields. Notice this field is added to the calculator window
• On the calculator pad, click the - (minus) sign to the left of the number 4
• Under the Fields tab, double click EFC_I • On the calculator pad, click the OK to close the calculator pad. You
should be back to the Field Selection screen, the initial screen on which you selected fields for the report.
You could also create a New Define Field to Compare Pell Initial to Pell Paid-on to be used in the AD Hoc Report (to indicate the Pell award changed from initial to the paid-on transaction)
• In the Field area in the upper left-hand corner of the calculator
window, enter the name for this special field. Enter Pell_Change to indicate this field is comparing the initial Pell award to the Paid on Pell award
• Click the Fields tab on the right side of the screen, to get a listing of fields to select. Double click Pell_Award_P. Notice this field is added to the calculator window
• On the calculator pad, click the - (minus) sign, which is to the left of the number 4
• Under the Fields tab, double click Pell_Award_I • On the calculator pad, click the OK to close the calculator pad. You
should be back to the Field Selection screen, the initial screen on which you selected fields for the report.
The Report Headings Tab Clicking on the Report headings tab allows you to enter information that will be to be displayed at the top (Heading) and bottom (Footing) of each page of the custom report. A screen shot of this interface is provided on the next page. Under Page Heading you may enter any desired text simply by typing. You may also enter any of the available fields. Note that you would probably only want to enter fields if you were producing a report where each page contained information from a single student. You may enter text or fields in a similar fashion in the Page Footing window. Note that by default the footing contains “Report Sample Size: <TOT.STUDCNTR.” This will display “Report Sample Size: #” with
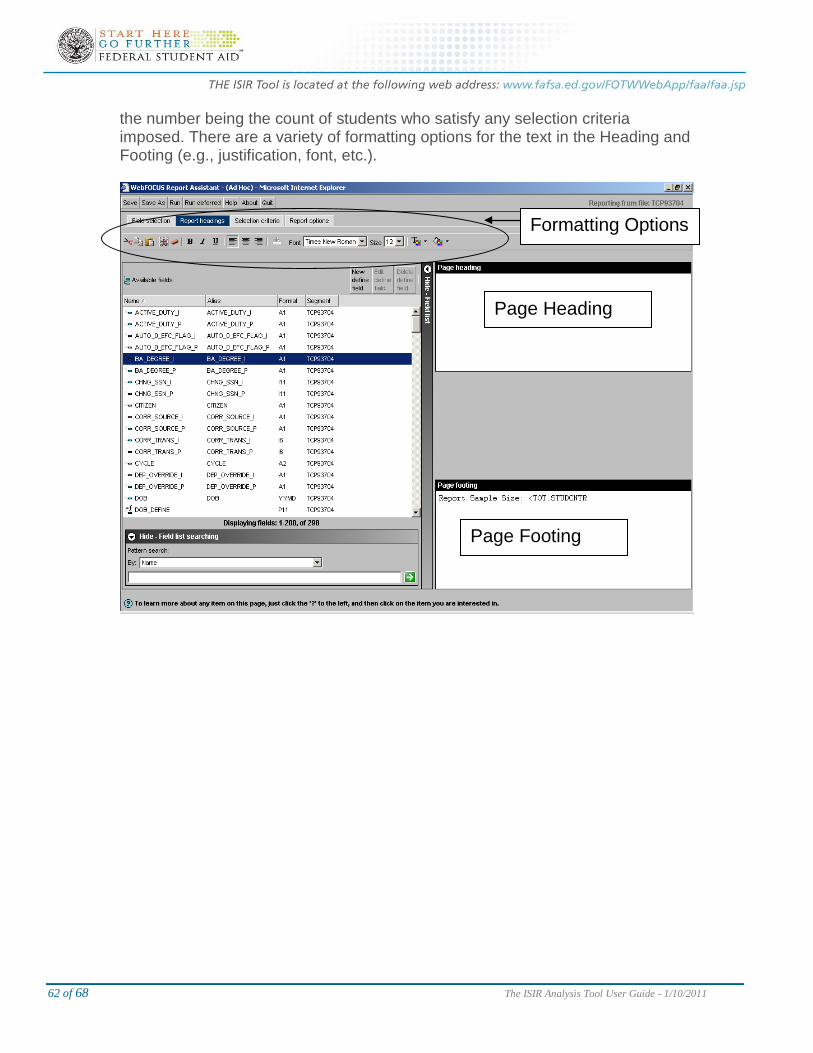
62 of 68 The ISIR Analysis Tool User Guide - 1/10/2011
the number being the count of students who satisfy any selection criteria imposed. There are a variety of formatting options for the text in the Heading and Footing (e.g., justification, font, etc.).
Page Heading
Page Footing
Formatting Options
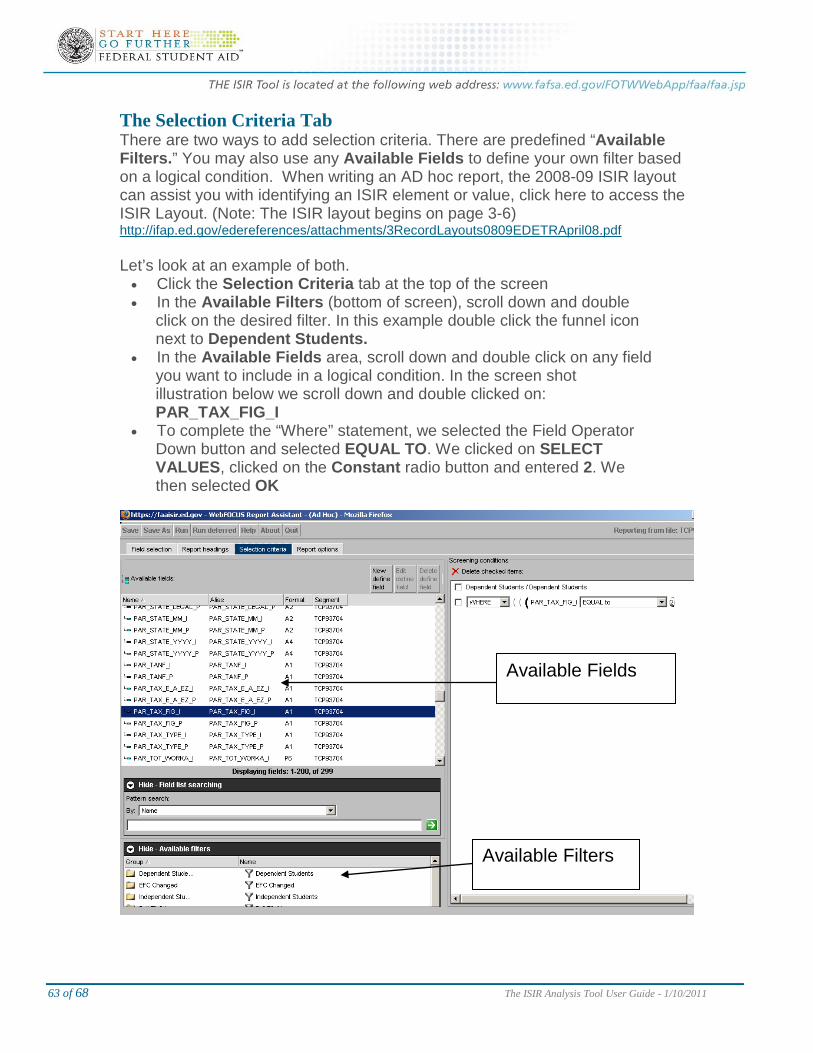
63 of 68 The ISIR Analysis Tool User Guide - 1/10/2011
The Selection Criteria Tab There are two ways to add selection criteria. There are predefined “Available Filters.” You may also use any Available Fields to define your own filter based on a logical condition. When writing an AD hoc report, the 2008-09 ISIR layout can assist you with identifying an ISIR element or value, click here to access the ISIR Layout. (Note: The ISIR layout begins on page 3-6) http://ifap.ed.gov/edereferences/attachments/3RecordLayouts0809EDETRApril08.pdf Let’s look at an example of both. • Click the Selection Criteria tab at the top of the screen • In the Available Filters (bottom of screen), scroll down and double
click on the desired filter. In this example double click the funnel icon next to Dependent Students.
• In the Available Fields area, scroll down and double click on any field you want to include in a logical condition. In the screen shot illustration below we scroll down and double clicked on: PAR_TAX_FIG_I
• To complete the “Where” statement, we selected the Field Operator Down button and selected EQUAL TO. We clicked on SELECT VALUES, clicked on the Constant radio button and entered 2. We then selected OK
Available Filters
Available Fields
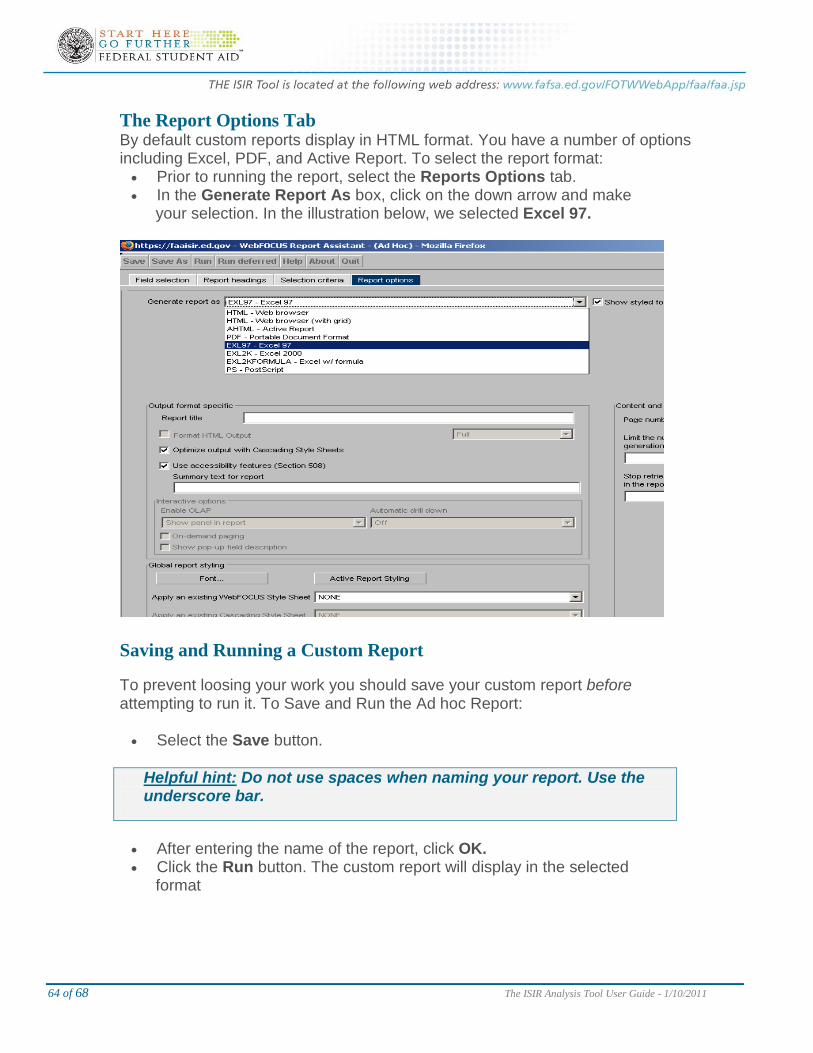
64 of 68 The ISIR Analysis Tool User Guide - 1/10/2011
The Report Options Tab By default custom reports display in HTML format. You have a number of options including Excel, PDF, and Active Report. To select the report format: • Prior to running the report, select the Reports Options tab. • In the Generate Report As box, click on the down arrow and make
your selection. In the illustration below, we selected Excel 97.
Saving and Running a Custom Report To prevent loosing your work you should save your custom report before attempting to run it. To Save and Run the Ad hoc Report: • Select the Save button.
Helpful hint: Do not use spaces when naming your report. Use the underscore bar.
• After entering the name of the report, click OK. • Click the Run button. The custom report will display in the selected
format
65 of 68 The ISIR Analysis Tool User Guide - 1/10/2011
Step by Step Illustration The following example was derived from a school participating in the Quality Assurance (QA) Program. This school verified dependent students when their parents estimated their taxes. This was one of several school verification criteria and they wanted to be able to distinguish students who met this specific criterion from other students in their database. Below we describe how to accomplish this by creating a custom report that lists all the names and social security numbers of dependent students with parents who were estimated filers. This would allow the school to generate reports in the Tool that focus exclusively on only those dependent records with parents who estimated their taxes. After generating this report, users would edit the file with a text editor, adding a “Y” flag to these records. Then users would create a user defined field in the Tool to house this information. The final step is to upload the file with the flags. The first step is to log into the Tool and launch Analysis of Data.
Launching Report Assistant • Click on the box next to Reporting Objects folder on the left toolbar. • Click on the next to Custom Reports folder • Right click on Ad Hoc • From the drop down menu, select Report Assistant
The Field Selection Tab Report Assistant opens in the Field Selection tab. • Select on STUD_SSN in the available fields window • Click on the plus/minus sign icon to the right of the Sum and Print radio
buttons. • Select on STUD_NAME_ID in the available fields window • Click on the plus/minus sign icon to the right of the Sum and Print radio
buttons. • Change the Radio Button selection from Sum to Print.
Select the Report Headings Tab To enter information in the Report Headings tab:
• At the top of the screen, click Report Headings • To center the heading, click in the box that displays the center justification • In the Heading box, type the heading, Dependent Student Parents
Estimated Tax Filer
66 of 68 The ISIR Analysis Tool User Guide - 1/10/2011
Select the Selection Criteria Tab To enter information in the Selection Criteria tab:
• At the top of the screen, click the Selection Criteria tab • In the Available Filters area, scroll down and drag and drop the following
field in the box under Screening Conditions: Dependent Students • In the Available Fields area, scroll down and drag and drop the following
field in the box under Screening Conditions: PAR_TAX_FIG_I • To complete the “Where” statement, select the Field Operator Down
button and select EQUAL TO. Click on SELECT VALUES and click on the Constant radio button and enter 2. Select OK
Select the Report Options Tab To enter information in the Report Options tab:
• Prior to running the report, select the Reports Options tab • Under the Generate Report As section, click on the down arrow and select
EXL-97 – Excel 97. (Select the version of Excel on your computer or lower.)
To Save and Run the AD Hoc Report To Save and Run the AD hoc Report to determine records that met the criterion:
• Select the Save button in the description enter a name for the report such
as, “DEP_PAR_ESTIMATED” • Click OK • On the tool bar, click Run. The Ad Hoc Report will display in Excel Format • You can now save this Report as a text file to your hard drive. Click File,
SAVE AS, and then enter a name such as, DEP_PAR_ESTIMATED. Under the SAVE AS section, click on the down arrow and select, Text (tab delimited) as the type. Click SAVE. You may receive a pop up box regarding formatting. If so, simply click YES
To Add “Y” Flags to Text File • Open notepad (or another text editing program) on your computer. Locate
the file you just saved to your hard drive (DEP_PAR_ESTIMATED). You will need to modify this file to include the values that identify the user defined field that will use 01 to 15. If you have not yet defined any user defined fields, use 01, (add the 01Y at the end of each record).
• Delete any extra spaces and the Report Heading. Remember, the file must include the Social Security Number and the first two letters of the last name, followed by a space (or a “Y” if the records was selected for institutional verification), and by 01Y. The format would look like this: 555005555CA 01Y, or 555005555CAY01Y
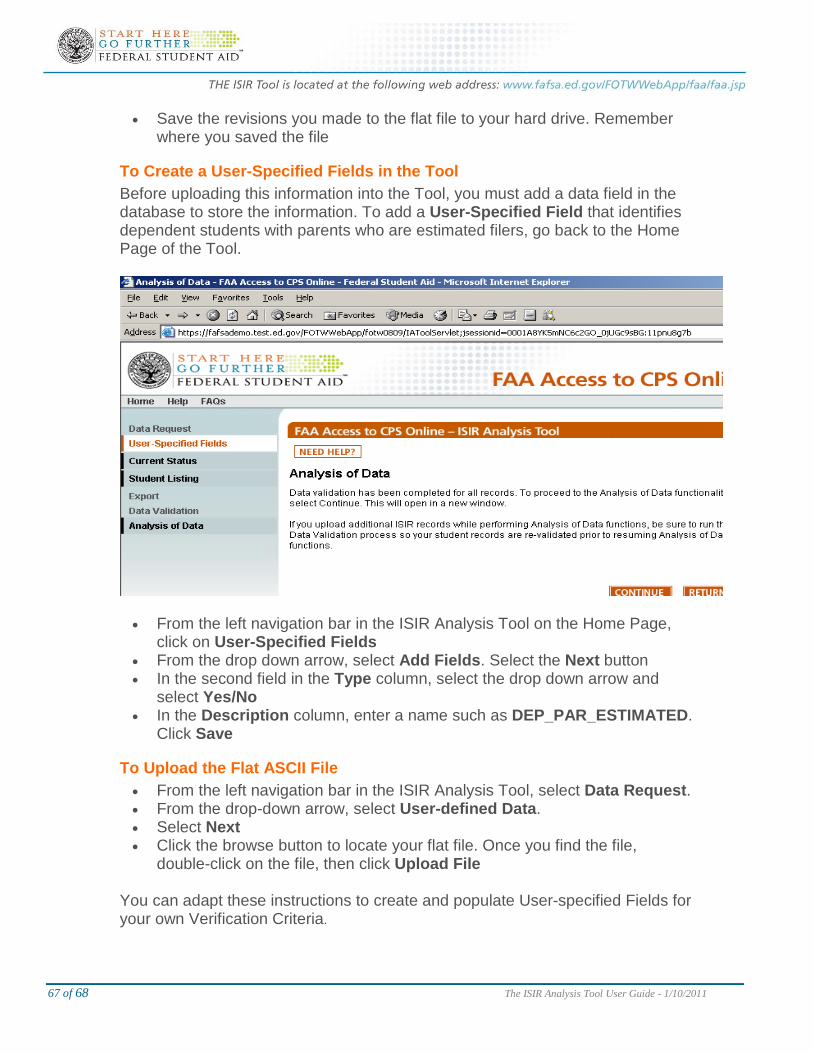
67 of 68 The ISIR Analysis Tool User Guide - 1/10/2011
• Save the revisions you made to the flat file to your hard drive. Remember where you saved the file
To Create a User-Specified Fields in the Tool Before uploading this information into the Tool, you must add a data field in the database to store the information. To add a User-Specified Field that identifies dependent students with parents who are estimated filers, go back to the Home Page of the Tool.
• From the left navigation bar in the ISIR Analysis Tool on the Home Page,
click on User-Specified Fields • From the drop down arrow, select Add Fields. Select the Next button • In the second field in the Type column, select the drop down arrow and
select Yes/No • In the Description column, enter a name such as DEP_PAR_ESTIMATED.
Click Save
To Upload the Flat ASCII File • From the left navigation bar in the ISIR Analysis Tool, select Data Request. • From the drop-down arrow, select User-defined Data. • Select Next • Click the browse button to locate your flat file. Once you find the file,
double-click on the file, then click Upload File
You can adapt these instructions to create and populate User-specified Fields for your own Verification Criteria.
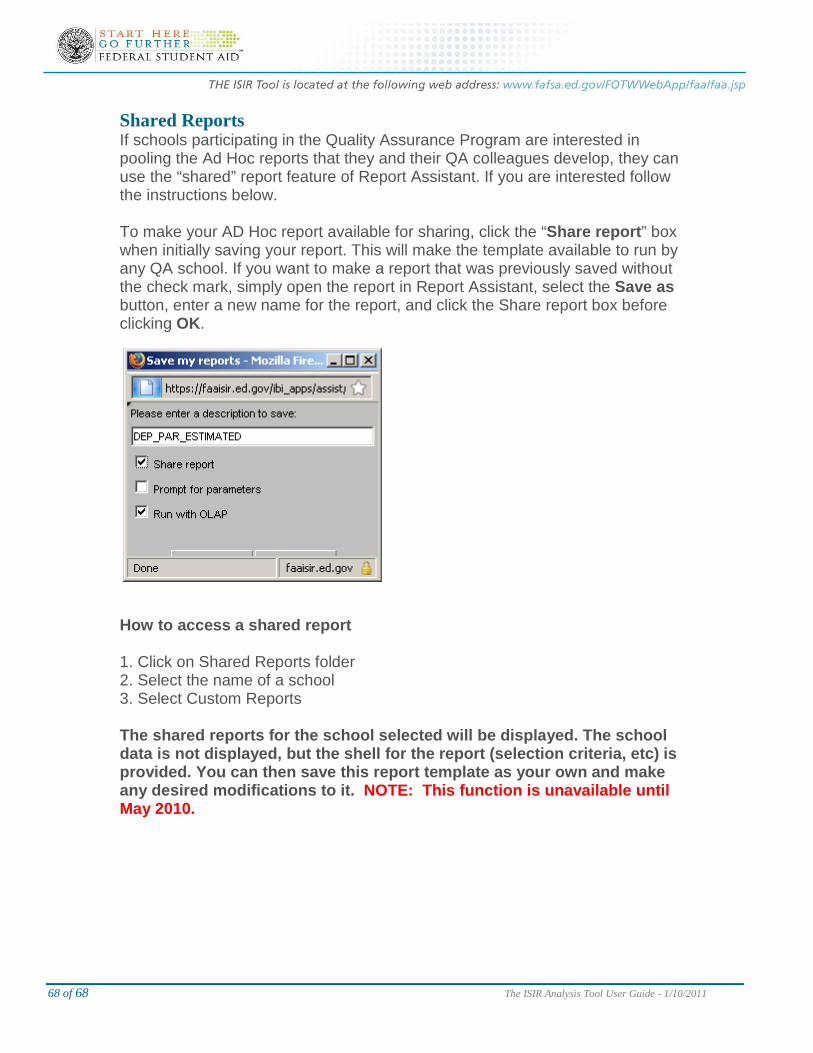
68 of 68 The ISIR Analysis Tool User Guide - 1/10/2011
Shared Reports If schools participating in the Quality Assurance Program are interested in pooling the Ad Hoc reports that they and their QA colleagues develop, they can use the “shared” report feature of Report Assistant. If you are interested follow the instructions below. To make your AD Hoc report available for sharing, click the “Share report” box when initially saving your report. This will make the template available to run by any QA school. If you want to make a report that was previously saved without the check mark, simply open the report in Report Assistant, select the Save as button, enter a new name for the report, and click the Share report box before clicking OK.
How to access a shared report
1. Click on Shared Reports folder 2. Select the name of a school 3. Select Custom Reports
The shared reports for the school selected will be displayed. The school data is not displayed, but the shell for the report (selection criteria, etc) is provided. You can then save this report template as your own and make any desired modifications to it. NOTE: This function is unavailable until May 2010.