Embed Size (px)
Citation preview
FPAR, LAI User’s Guide Terra MODIS Land Team
Last updated: 9/10/2003 Page 1 of 17
User's Guide FPAR, LAI (ESDT: MOD15A2) 8-day Composite
NASA MODIS Land Algorithm
Ranga Myneni Yuri Knyazikhin
Joseph Glassy Petr Votava
Nikolay Shabanov Contents Synopsis Acknowledgement Algorithm Description [SUMMARY] Collection Overview Applications and Derivation Scientific Data Sets File Format of FPAR, LAI Products Acquisition Materials and Methods Local Attributes Global Attributes Usage Guidance Quality Assurance Documentation Information Glossary and Acronyms Related Internet URLs References
FPAR, LAI User’s Guide Terra MODIS Land Team
Last updated: 9/10/2003 Page 2 of 17
Synopsis This User's Guide describes the Fraction-of-Photosynthetically Active Radiation (FPAR) and Leaf Area Index (LAI) MODIS AM-1 algorithm and its associated 8-day data product archived at a NASA DAAC. It is intended to provide both a broad overview and sufficient detail to allow the reader to get started working with the data immediately. Acknowledgement The MODIS LAI and FPAR Level 4 algorithms were developed jointly by personnel at Boston University and the University of Montana under contract with the National Aeronautic and Space Administration. Algorithm Description The MOD15 Leaf Area Index and Fraction of Photosynthetically Active Radiation absorbed by vegetation are 1 km at launch products provided on a daily and 8 days basis. LAI defines an important structural property of a plant canopy which is the one-sided leaf area per unit ground area. FPAR measures the proportion of available radiation in the photosynthetically active wavelengths (0.4 to 0.7 mm) that a canopy absorbs. LAI and FPAR are biophysical variables which describe canopy structure and are related to functional process rates of energy and mass exchange. Both LAI and FPAR have been used extensively as satellite derived parameters for calculation of surface photosynthesis, evapotranspiration, and annual net primary production. These products are essential in calculating terrestrial energy, carbon, water cycle processes, and biogeochemistry of vegetation. The MODIS LAI/FPAR algorithm consists of a main procedure that exploits the spectral information content of MODIS surface reflectances at up to 7 spectral bands. A three-dimensional formulation of the LAI/FPAR inverse problem underlies this procedure. Should the main algorithm fail, a back-up algorithm is triggered to estimate LAI and FPAR using vegetation indices. The algorithm requires a land cover classification. Therefore the algorithm has interfaces with the MODIS Surface Reflectance Product (MODAGAGG) and the MODIS Land Cover Product (MOD12Q1). Collection Overview The Functional Linkage of the MODIS Biophysical Land Products The MODIS biophysical land products form a tightly coupled, functionally linked set of satellite driven models. These biophysical products currently include FPAR, LAI, PSN, and NPP. MODIS radiometry inputs define the head of this product suite, taken from 1 km resolution spatially aggregated surface reflectances, via the intermediate MODAGAGG process. The MODAGAGG process transforms the 250 and or 500 meter atmospherically corrected surface reflectances into a normalized 1 km form upon which
FPAR, LAI User’s Guide Terra MODIS Land Team
Last updated: 9/10/2003 Page 3 of 17
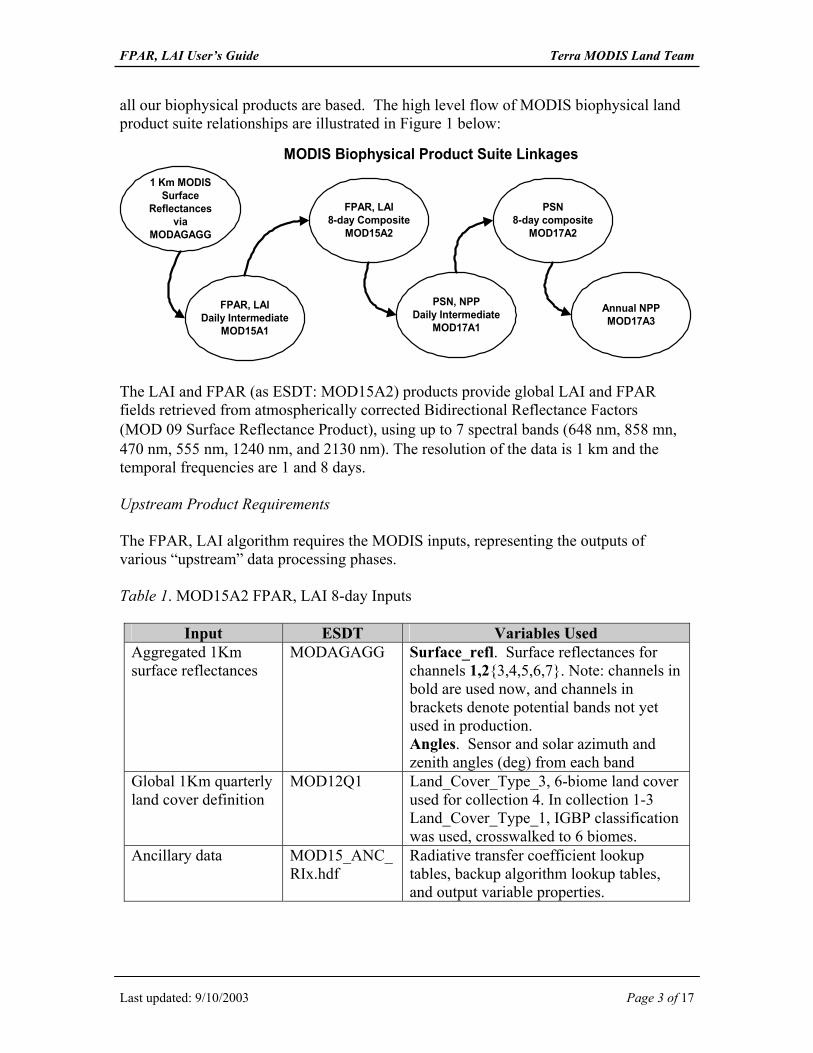
all our biophysical products are based. The high level flow of MODIS biophysical land product suite relationships are illustrated in Figure 1 below:
The LAI and FPAR (as ESDT: MOD15A2) products provide global LAI and FPAR fields retrieved from atmospherically corrected Bidirectional Reflectance Factors (MOD 09 Surface Reflectance Product), using up to 7 spectral bands (648 nm, 858 mn, 470 nm, 555 nm, 1240 nm, and 2130 nm). The resolution of the data is 1 km and the temporal frequencies are 1 and 8 days. Upstream Product Requirements The FPAR, LAI algorithm requires the MODIS inputs, representing the outputs of various “upstream” data processing phases. Table 1. MOD15A2 FPAR, LAI 8-day Inputs
Input ESDT Variables Used Aggregated 1Km surface reflectances
MODAGAGG Surface_refl. Surface reflectances for channels 1,2{3,4,5,6,7}. Note: channels in bold are used now, and channels in brackets denote potential bands not yet used in production. Angles. Sensor and solar azimuth and zenith angles (deg) from each band
Global 1Km quarterly land cover definition
MOD12Q1 Land_Cover_Type_3, 6-biome land cover used for collection 4. In collection 1-3 Land_Cover_Type_1, IGBP classification was used, crosswalked to 6 biomes.
Ancillary data MOD15_ANC_RIx.hdf
Radiative transfer coefficient lookup tables, backup algorithm lookup tables, and output variable properties.
1 Km MODISSurface
Reflectancesvia
MODAGAGG
FPAR, LAIDaily Intermediate
MOD15A1
FPAR, LAI8-day Composite
MOD15A2
PSN, NPPDaily Intermediate
MOD17A1
PSN8-day composite
MOD17A2
Annual NPPMOD17A3
MODIS Biophysical Product Suite Linkages
FPAR, LAI User’s Guide Terra MODIS Land Team
Last updated: 9/10/2003 Page 4 of 17
Applications and Derivation Usage Large-scale ecosystem modeling is used to simulate a range of ecological responses to changes in climate and chemical composition of the atmosphere, including changes in the distribution of terrestrial plant communities across the globe in response to climate changes. Leaf area index (LAI) is a state parameter in all models describing the exchange of fluxes of energy, mass (e.g., water and CO2), and momentum between the surface and the planetary boundary layer. Analyses of global carbon budget indicate a large terrestrial middle- to high-latitude sink, without which the accumulation of carbon in the atmosphere would be higher than the present rate. The problem of accurately evaluating the exchange of carbon between the atmosphere and the terrestrial vegetation therefore requires special attention. In this context the fraction of photosynthetically active radiation (FPAR) absorbed by global vegetation is a key state variable in most ecosystem productivity models and in global models of climate, hydrology, biogeochemestry, and ecology. Derivation Techniques and Algorithm The inverse problem of retrieving LAI and FPAR from atmospherically corrected Bi-directional Reflectance Distribution Function (BRDF) is formulated as follows [Knyazikhin et al., 1998a]: given sun and view directions, BRDFs at N spectral bands and uncertainties, find LAI and FPAR. The algorithm compares observed and modeled canopy reflectances for a suite of canopy structures and soil patterns that represent a range of expected natural conditions. All canopy/soil patterns for which modeled and observed BRDFs differ by an amount equivalent to or less than the corresponding uncertainty, are considered as acceptable solutions. FPAR is also calculated for each acceptable solution. The mean values of LAI and FPAR averaged over all acceptable solutions and their dispersions are taken as solutions and retrieval uncertainties [Knyazikhin et al., 1998b; Zhang et. al., 2000; Tian et. al., 2000]. If the inverse problem has a unique solution for a given set of surface reflectances, mean LAI coincides with this solution and its dispersion equals zero. If it allows for multiple solutions, the algorithm provides a weighted mean in accordance with the frequency of occurrence of a given value of LAI. The dispersion magnitude indicates the reliability of the corresponding LAI value. The accuracy of retrievals can not be improved if no additional information are available. In order to better describe natural variability of vegetation canopies a three-dimensional formulation of the LAI/FPAR inverse problem underlies the algorithm. Accounting for features specific to the problem of radiative transfer in plant canopies, we adapt powerful techniques, the Green’s function and adjoint formulation, for our retrieval algorithm. It allowed us to explicitly separate the contribution of canopy ground to the observed reflectances as well as split a complicated three-dimensional radiative transfer in vegetation canopies into two independent sub-problems, namely, the radiation field in the
FPAR, LAI User’s Guide Terra MODIS Land Team
Last updated: 9/10/2003 Page 5 of 17
canopy calculated for a black surface, and the radiation field in the same medium (with the black surface) generated by anisotropic sources located at the canopy bottom [Knyazikhin and Marshak, 2000]. Solutions to these subproblems include information on intrinsic canopy properties. This underlies the following parameterization of canopy structure. Empirical and theoretical analyses of spectral hemispherical reflectances and transmittances of individual leaves and the vegetation canopy in the case of dark ground indicate that some simple algebraic combinations of leaf and canopy spectral transmittances and reflectances eliminate their dependencies on wavelength through the specification of two canopy specific wavelength independent variables [Panferov et al., 2001, Shabanov et al., 2003]. These variables and leaf optical properties drive the short-wave energy conservation in vegetation canopies; that is, partitioning of the incoming radiation between canopy absorption, transmission and reflection. These canopy specific wavelength independent variables characterize the capacity of the canopy to intercept and transmit solar radiation under two extreme situations, namely, when individual leaves (1) are completely absorptive, and (2) totally reflect and/or transmit the incident radiation. The interactions of photons with the canopy at red and near infrared spectral bands approximate these extreme situations well. One can treat the vegetation canopy as a dynamical system and the canopy spectral interception and transmission as dynamical variables. The system has two independent states: canopies with totally absorbing and totally scattering leaves. Intermediate states are a superposition of these pure states. Such an interpretation provides powerful means to accurately specify changes in canopy structure both from ground-based measurements and remotely sensed data. The variables mentioned above, soil patterns, leaf optical properties, and solutions of the above mentioned sub-problems are stored in the form of Look-up-Table (LUT) which then used to routinely model patterns of canopy reflectances as a function of canopy structure and soil type. This approach provide convergence of the algorithm; that is, the more the spectral information and the more accurate this information is, the more reliable and accurate the algorithm output will be [Wang, et al., 2001]. Special Correction/Adjustment
Given the set of observed canopy reflectances, it may be the case the inverse problem has no solutions. A pixel for which the algorithm retrieves a value of LAI and FPAR is termed a retrieved pixel. The ratio of the number of retrieved pixels to the total number of vegetated pixels is the retrieval index (RI). The retrieval index is an important characteristic of algorithm performance and quality of the input data [Wang et al., 2000]. It is a function of uncertainties in the observed and modeled canopy reflectances and number N of spectral bands used. Generally, the retrieval index increases with increasing uncertainties. However, the quality of the LAI/FPAR product may decrease. Uncertainties are input to the algorithm and, therefore, must be carefully evaluated in order to produce optimal algorithm performance. Table 2 presents uncertainties in model and surface reflectance product currently used by the algorithm. This information should
FPAR, LAI User’s Guide Terra MODIS Land Team
Last updated: 9/10/2003 Page 6 of 17
be updated when a more accurate estimate of uncertainties in the surface reflectance product will be available.
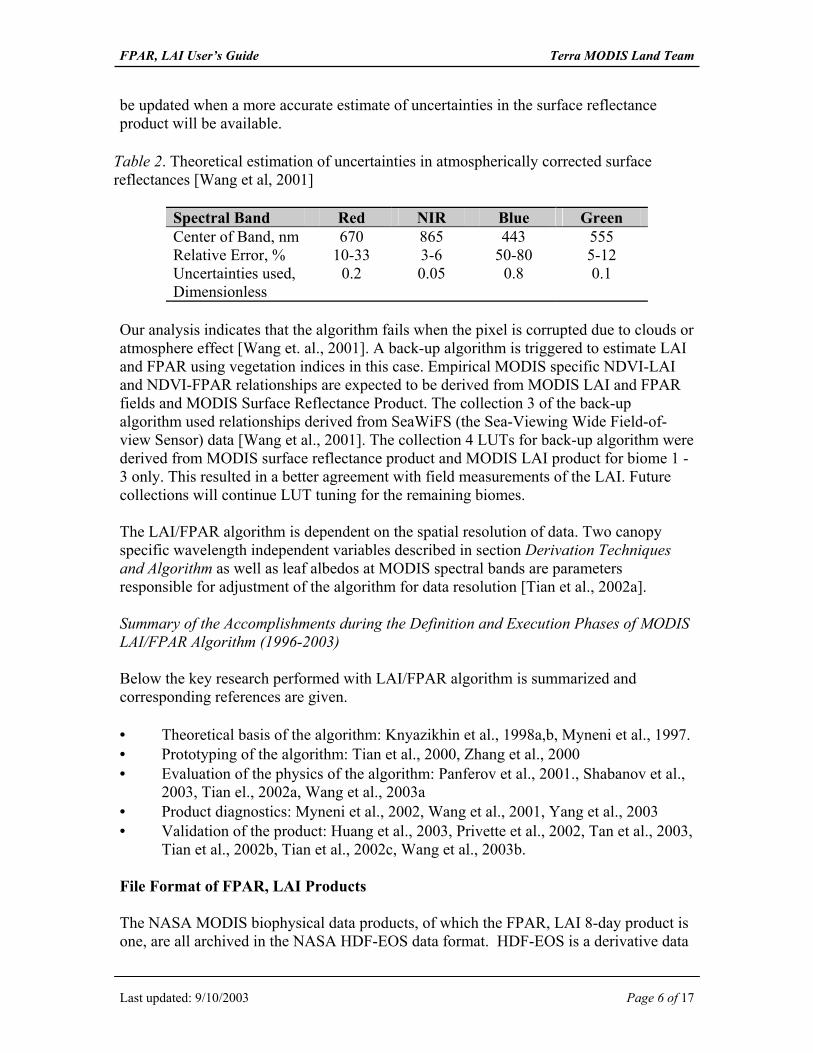
Table 2. Theoretical estimation of uncertainties in atmospherically corrected surface reflectances [Wang et al, 2001]
Spectral Band Red NIR Blue Green Center of Band, nm 670 865 443 555 Relative Error, % 10-33 3-6 50-80 5-12 Uncertainties used, Dimensionless
0.2 0.05 0.8 0.1
Our analysis indicates that the algorithm fails when the pixel is corrupted due to clouds or atmosphere effect [Wang et. al., 2001]. A back-up algorithm is triggered to estimate LAI and FPAR using vegetation indices in this case. Empirical MODIS specific NDVI-LAI and NDVI-FPAR relationships are expected to be derived from MODIS LAI and FPAR fields and MODIS Surface Reflectance Product. The collection 3 of the back-up algorithm used relationships derived from SeaWiFS (the Sea-Viewing Wide Field-of-view Sensor) data [Wang et al., 2001]. The collection 4 LUTs for back-up algorithm were derived from MODIS surface reflectance product and MODIS LAI product for biome 1 - 3 only. This resulted in a better agreement with field measurements of the LAI. Future collections will continue LUT tuning for the remaining biomes. The LAI/FPAR algorithm is dependent on the spatial resolution of data. Two canopy specific wavelength independent variables described in section Derivation Techniques and Algorithm as well as leaf albedos at MODIS spectral bands are parameters responsible for adjustment of the algorithm for data resolution [Tian et al., 2002a]. Summary of the Accomplishments during the Definition and Execution Phases of MODIS LAI/FPAR Algorithm (1996-2003) Below the key research performed with LAI/FPAR algorithm is summarized and corresponding references are given. • Theoretical basis of the algorithm: Knyazikhin et al., 1998a,b, Myneni et al., 1997. • Prototyping of the algorithm: Tian et al., 2000, Zhang et al., 2000 • Evaluation of the physics of the algorithm: Panferov et al., 2001., Shabanov et al.,
2003, Tian el., 2002a, Wang et al., 2003a • Product diagnostics: Myneni et al., 2002, Wang et al., 2001, Yang et al., 2003 • Validation of the product: Huang et al., 2003, Privette et al., 2002, Tan et al., 2003,
Tian et al., 2002b, Tian et al., 2002c, Wang et al., 2003b. File Format of FPAR, LAI Products The NASA MODIS biophysical data products, of which the FPAR, LAI 8-day product is one, are all archived in the NASA HDF-EOS data format. HDF-EOS is a derivative data
FPAR, LAI User’s Guide Terra MODIS Land Team
Last updated: 9/10/2003 Page 7 of 17
format built upon the Hierarchical Data Format (HDF) pioneered by the National Center for Supercomputer Applications (NCSA) in University of Illinois, Champaign/Urbana. The NASA HDF-EOS group offers a growing body of software tools. Several NASA web sites offering new tools are: • http://hdfeos.gsfc.nasa.gov/hdfeos/workshop.html • http://daac.gsfc.nasa.gov/CAMPAIGN_DOCS/MODIS/index.html MODIS Tile Projection Characteristics
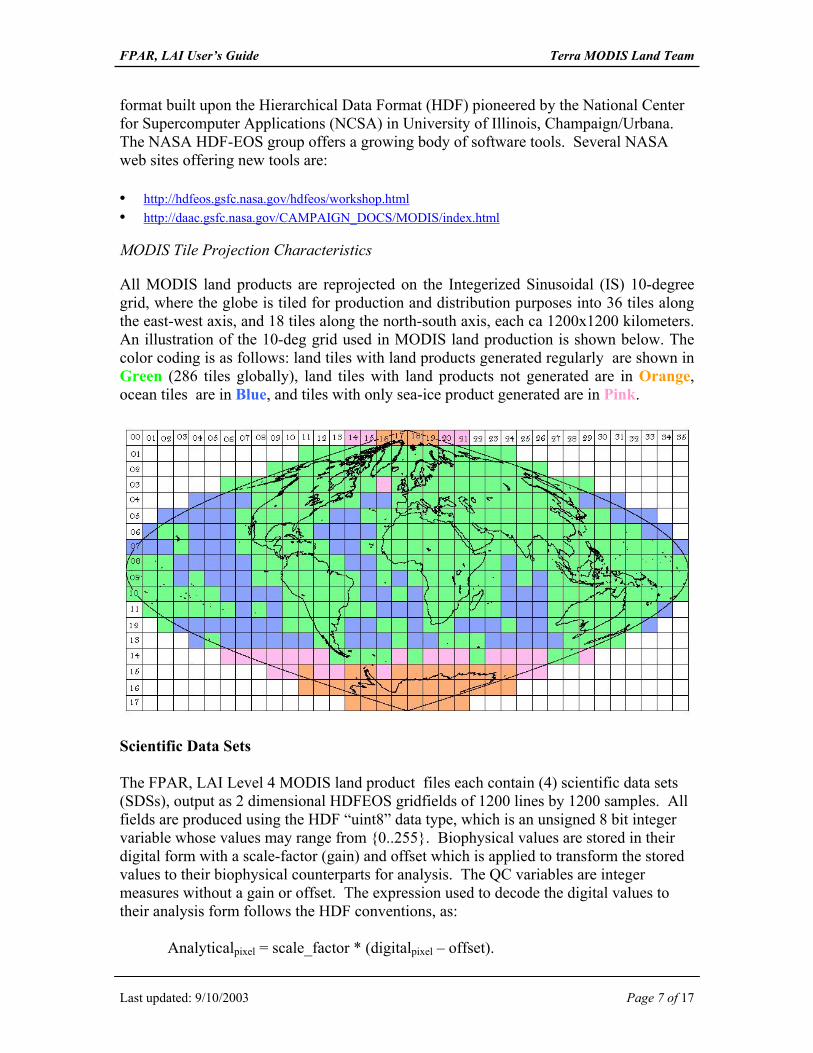
All MODIS land products are reprojected on the Integerized Sinusoidal (IS) 10-degree grid, where the globe is tiled for production and distribution purposes into 36 tiles along the east-west axis, and 18 tiles along the north-south axis, each ca 1200x1200 kilometers. An illustration of the 10-deg grid used in MODIS land production is shown below. The color coding is as follows: land tiles with land products generated regularly are shown in Green (286 tiles globally), land tiles with land products not generated are in Orange, ocean tiles are in Blue, and tiles with only sea-ice product generated are in Pink.
Scientific Data Sets The FPAR, LAI Level 4 MODIS land product files each contain (4) scientific data sets (SDSs), output as 2 dimensional HDFEOS gridfields of 1200 lines by 1200 samples. All fields are produced using the HDF “uint8” data type, which is an unsigned 8 bit integer variable whose values may range from {0..255}. Biophysical values are stored in their digital form with a scale-factor (gain) and offset which is applied to transform the stored values to their biophysical counterparts for analysis. The QC variables are integer measures without a gain or offset. The expression used to decode the digital values to their analysis form follows the HDF conventions, as:
Analyticalpixel = scale_factor * (digitalpixel – offset).
FPAR, LAI User’s Guide Terra MODIS Land Team
Last updated: 9/10/2003 Page 8 of 17
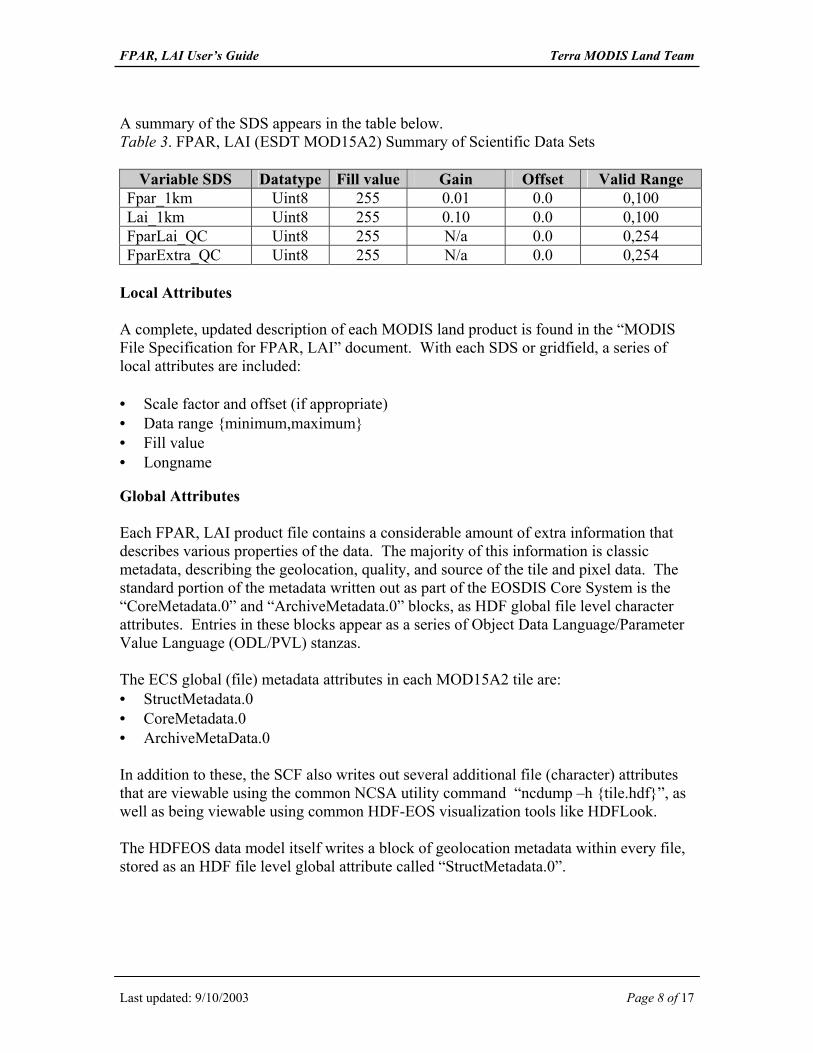
A summary of the SDS appears in the table below. Table 3. FPAR, LAI (ESDT MOD15A2) Summary of Scientific Data Sets
Variable SDS Datatype Fill value Gain Offset Valid Range Fpar_1km Uint8 255 0.01 0.0 0,100 Lai_1km Uint8 255 0.10 0.0 0,100 FparLai_QC Uint8 255 N/a 0.0 0,254 FparExtra_QC Uint8 255 N/a 0.0 0,254
Local Attributes A complete, updated description of each MODIS land product is found in the “MODIS File Specification for FPAR, LAI” document. With each SDS or gridfield, a series of local attributes are included: • Scale factor and offset (if appropriate) • Data range {minimum,maximum} • Fill value • Longname Global Attributes Each FPAR, LAI product file contains a considerable amount of extra information that describes various properties of the data. The majority of this information is classic metadata, describing the geolocation, quality, and source of the tile and pixel data. The standard portion of the metadata written out as part of the EOSDIS Core System is the “CoreMetadata.0” and “ArchiveMetadata.0” blocks, as HDF global file level character attributes. Entries in these blocks appear as a series of Object Data Language/Parameter Value Language (ODL/PVL) stanzas. The ECS global (file) metadata attributes in each MOD15A2 tile are: • StructMetadata.0 • CoreMetadata.0 • ArchiveMetaData.0 In addition to these, the SCF also writes out several additional file (character) attributes that are viewable using the common NCSA utility command “ncdump –h {tile.hdf}”, as well as being viewable using common HDF-EOS visualization tools like HDFLook. The HDFEOS data model itself writes a block of geolocation metadata within every file, stored as an HDF file level global attribute called “StructMetadata.0”.
FPAR, LAI User’s Guide Terra MODIS Land Team
Last updated: 9/10/2003 Page 9 of 17
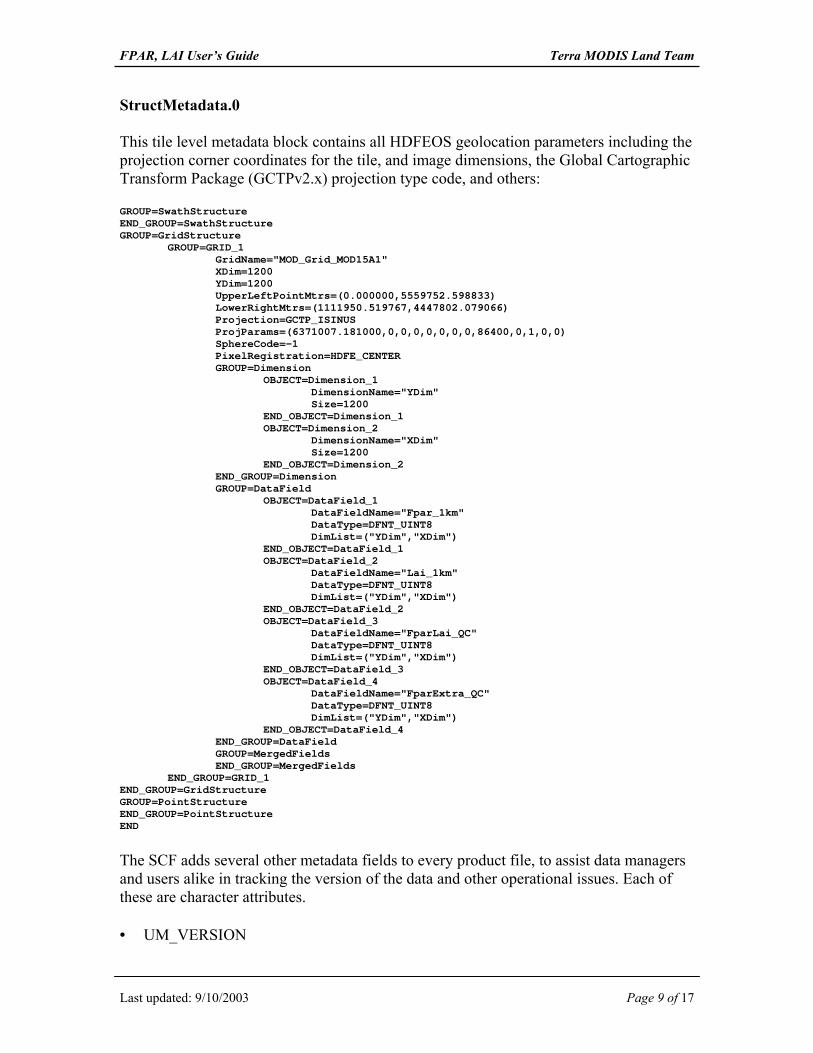
StructMetadata.0 This tile level metadata block contains all HDFEOS geolocation parameters including the projection corner coordinates for the tile, and image dimensions, the Global Cartographic Transform Package (GCTPv2.x) projection type code, and others: GROUP=SwathStructure END_GROUP=SwathStructure GROUP=GridStructure GROUP=GRID_1 GridName="MOD_Grid_MOD15A1" XDim=1200 YDim=1200 UpperLeftPointMtrs=(0.000000,5559752.598833) LowerRightMtrs=(1111950.519767,4447802.079066) Projection=GCTP_ISINUS ProjParams=(6371007.181000,0,0,0,0,0,0,0,86400,0,1,0,0) SphereCode=-1 PixelRegistration=HDFE_CENTER GROUP=Dimension OBJECT=Dimension_1 DimensionName="YDim" Size=1200 END_OBJECT=Dimension_1 OBJECT=Dimension_2 DimensionName="XDim" Size=1200 END_OBJECT=Dimension_2 END_GROUP=Dimension GROUP=DataField OBJECT=DataField_1 DataFieldName="Fpar_1km" DataType=DFNT_UINT8 DimList=("YDim","XDim") END_OBJECT=DataField_1 OBJECT=DataField_2 DataFieldName="Lai_1km" DataType=DFNT_UINT8 DimList=("YDim","XDim") END_OBJECT=DataField_2 OBJECT=DataField_3 DataFieldName="FparLai_QC" DataType=DFNT_UINT8 DimList=("YDim","XDim") END_OBJECT=DataField_3 OBJECT=DataField_4 DataFieldName="FparExtra_QC" DataType=DFNT_UINT8 DimList=("YDim","XDim") END_OBJECT=DataField_4 END_GROUP=DataField GROUP=MergedFields END_GROUP=MergedFields END_GROUP=GRID_1 END_GROUP=GridStructure GROUP=PointStructure END_GROUP=PointStructure END
The SCF adds several other metadata fields to every product file, to assist data managers and users alike in tracking the version of the data and other operational issues. Each of these are character attributes. • UM_VERSION
FPAR, LAI User’s Guide Terra MODIS Land Team
Last updated: 9/10/2003 Page 10 of 17
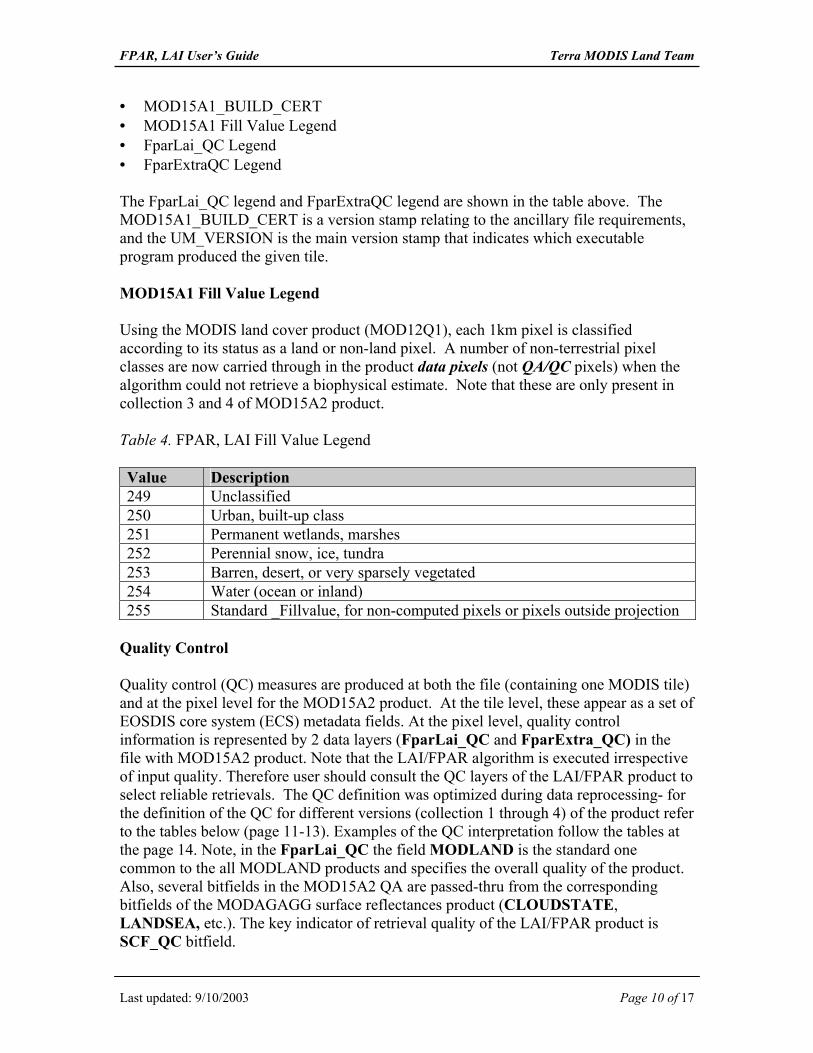
• MOD15A1_BUILD_CERT • MOD15A1 Fill Value Legend • FparLai_QC Legend • FparExtraQC Legend The FparLai_QC legend and FparExtraQC legend are shown in the table above. The MOD15A1_BUILD_CERT is a version stamp relating to the ancillary file requirements, and the UM_VERSION is the main version stamp that indicates which executable program produced the given tile. MOD15A1 Fill Value Legend Using the MODIS land cover product (MOD12Q1), each 1km pixel is classified according to its status as a land or non-land pixel. A number of non-terrestrial pixel classes are now carried through in the product data pixels (not QA/QC pixels) when the algorithm could not retrieve a biophysical estimate. Note that these are only present in collection 3 and 4 of MOD15A2 product. Table 4. FPAR, LAI Fill Value Legend Value Description 249 Unclassified 250 Urban, built-up class 251 Permanent wetlands, marshes 252 Perennial snow, ice, tundra 253 Barren, desert, or very sparsely vegetated 254 Water (ocean or inland) 255 Standard _Fillvalue, for non-computed pixels or pixels outside projection
Quality Control Quality control (QC) measures are produced at both the file (containing one MODIS tile) and at the pixel level for the MOD15A2 product. At the tile level, these appear as a set of EOSDIS core system (ECS) metadata fields. At the pixel level, quality control information is represented by 2 data layers (FparLai_QC and FparExtra_QC) in the file with MOD15A2 product. Note that the LAI/FPAR algorithm is executed irrespective of input quality. Therefore user should consult the QC layers of the LAI/FPAR product to select reliable retrievals. The QC definition was optimized during data reprocessing- for the definition of the QC for different versions (collection 1 through 4) of the product refer to the tables below (page 11-13). Examples of the QC interpretation follow the tables at the page 14. Note, in the FparLai_QC the field MODLAND is the standard one common to the all MODLAND products and specifies the overall quality of the product. Also, several bitfields in the MOD15A2 QA are passed-thru from the corresponding bitfields of the MODAGAGG surface reflectances product (CLOUDSTATE, LANDSEA, etc.). The key indicator of retrieval quality of the LAI/FPAR product is SCF_QC bitfield.
FPAR, LAI User’s Guide Terra MODIS Land Team
Last updated: 9/10/2003 Page 11 of 17
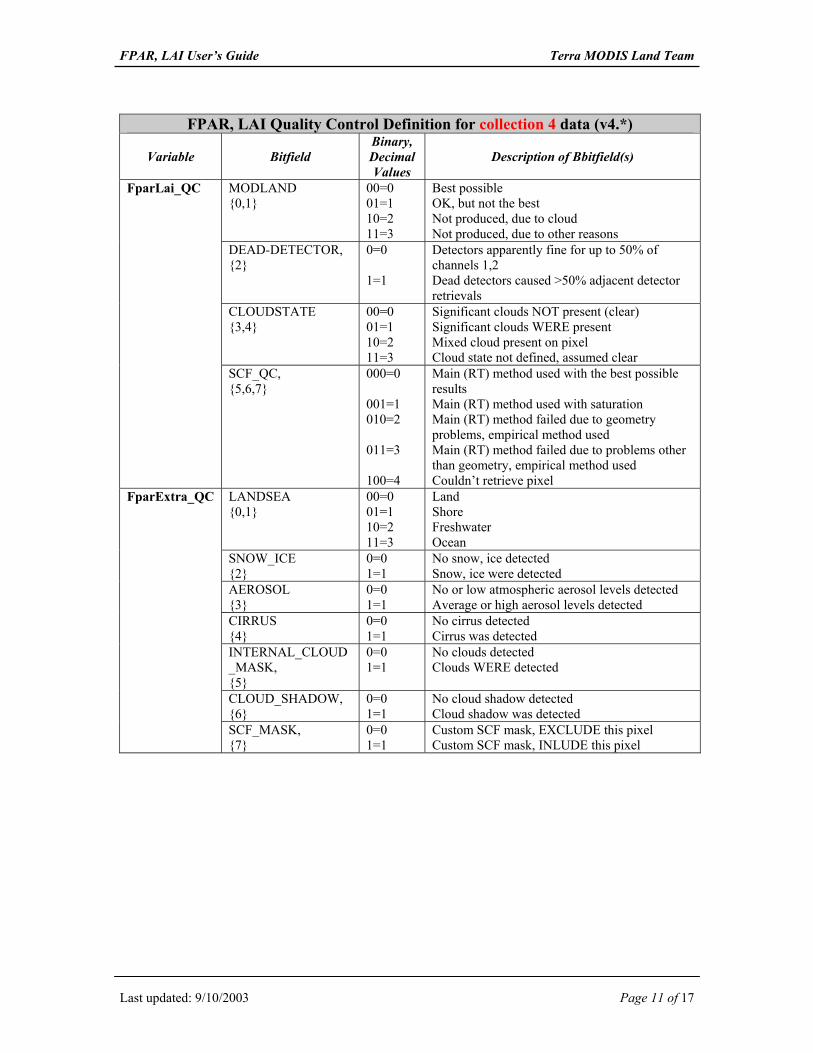
FPAR, LAI Quality Control Definition for collection 4 data (v4.*)
Variable Bitfield Binary, Decimal Values
Description of Bbitfield(s)
MODLAND {0,1}
00=0 01=1 10=2 11=3
Best possible OK, but not the best Not produced, due to cloud Not produced, due to other reasons
DEAD-DETECTOR, {2}
0=0 1=1
Detectors apparently fine for up to 50% of channels 1,2 Dead detectors caused >50% adjacent detector retrievals
CLOUDSTATE {3,4}
00=0 01=1 10=2 11=3
Significant clouds NOT present (clear) Significant clouds WERE present Mixed cloud present on pixel Cloud state not defined, assumed clear
FparLai_QC
SCF_QC, {5,6,7}
000=0 001=1 010=2 011=3 100=4
Main (RT) method used with the best possible results Main (RT) method used with saturation Main (RT) method failed due to geometry problems, empirical method used Main (RT) method failed due to problems other than geometry, empirical method used Couldn’t retrieve pixel
LANDSEA {0,1}
00=0 01=1 10=2 11=3
Land Shore Freshwater Ocean
SNOW_ICE {2}
0=0 1=1
No snow, ice detected Snow, ice were detected
AEROSOL {3}
0=0 1=1
No or low atmospheric aerosol levels detected Average or high aerosol levels detected
CIRRUS {4}
0=0 1=1
No cirrus detected Cirrus was detected
INTERNAL_CLOUD_MASK, {5}
0=0 1=1
No clouds detected Clouds WERE detected
CLOUD_SHADOW, {6}
0=0 1=1
No cloud shadow detected Cloud shadow was detected
FparExtra_QC
SCF_MASK, {7}
0=0 1=1
Custom SCF mask, EXCLUDE this pixel Custom SCF mask, INLUDE this pixel
FPAR, LAI User’s Guide Terra MODIS Land Team
Last updated: 9/10/2003 Page 12 of 17
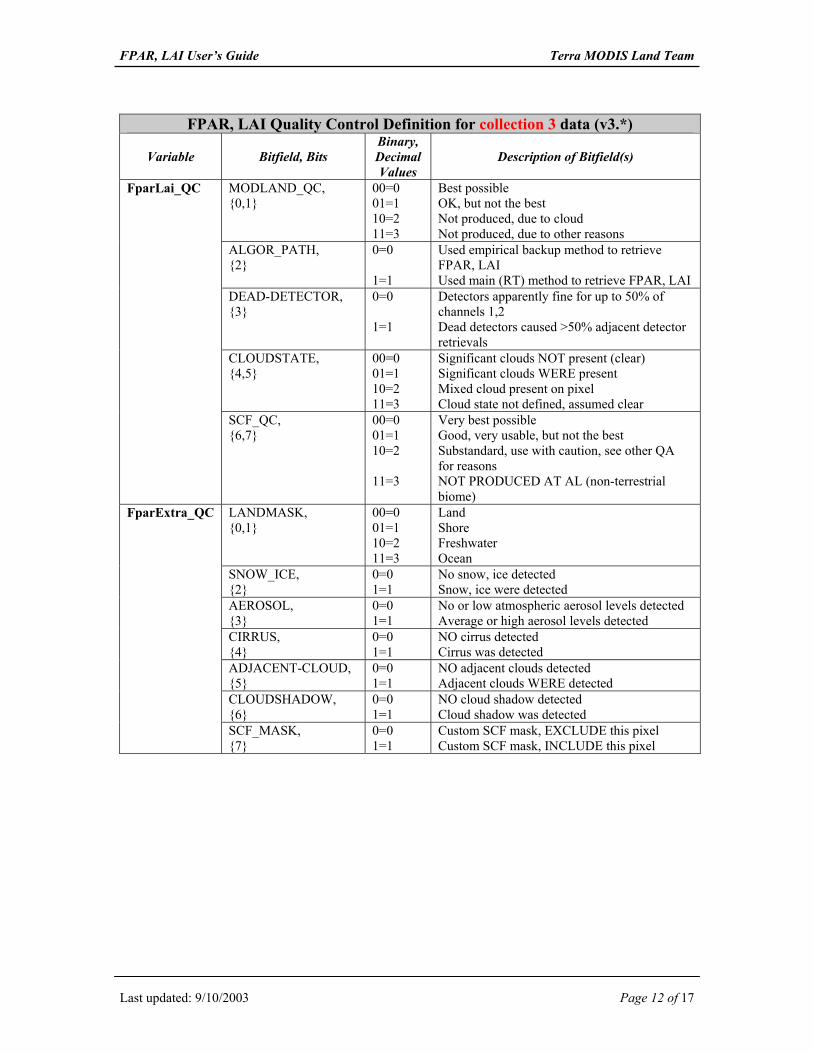
FPAR, LAI Quality Control Definition for collection 3 data (v3.*)
Variable Bitfield, Bits Binary, Decimal Values
Description of Bitfield(s)
MODLAND_QC, {0,1}
00=0 01=1 10=2 11=3
Best possible OK, but not the best Not produced, due to cloud Not produced, due to other reasons
ALGOR_PATH, {2}
0=0 1=1
Used empirical backup method to retrieve FPAR, LAI Used main (RT) method to retrieve FPAR, LAI
DEAD-DETECTOR, {3}
0=0 1=1
Detectors apparently fine for up to 50% of channels 1,2 Dead detectors caused >50% adjacent detector retrievals
CLOUDSTATE, {4,5}
00=0 01=1 10=2 11=3
Significant clouds NOT present (clear) Significant clouds WERE present Mixed cloud present on pixel Cloud state not defined, assumed clear
FparLai_QC
SCF_QC, {6,7}
00=0 01=1 10=2 11=3
Very best possible Good, very usable, but not the best Substandard, use with caution, see other QA for reasons NOT PRODUCED AT AL (non-terrestrial biome)
LANDMASK, {0,1}
00=0 01=1 10=2 11=3
Land Shore Freshwater Ocean
SNOW_ICE, {2}
0=0 1=1
No snow, ice detected Snow, ice were detected
AEROSOL, {3}
0=0 1=1
No or low atmospheric aerosol levels detected Average or high aerosol levels detected
CIRRUS, {4}
0=0 1=1
NO cirrus detected Cirrus was detected
ADJACENT-CLOUD, {5}
0=0 1=1
NO adjacent clouds detected Adjacent clouds WERE detected
CLOUDSHADOW, {6}
0=0 1=1
NO cloud shadow detected Cloud shadow was detected
FparExtra_QC
SCF_MASK, {7}
0=0 1=1
Custom SCF mask, EXCLUDE this pixel Custom SCF mask, INCLUDE this pixel
FPAR, LAI User’s Guide Terra MODIS Land Team
Last updated: 9/10/2003 Page 13 of 17
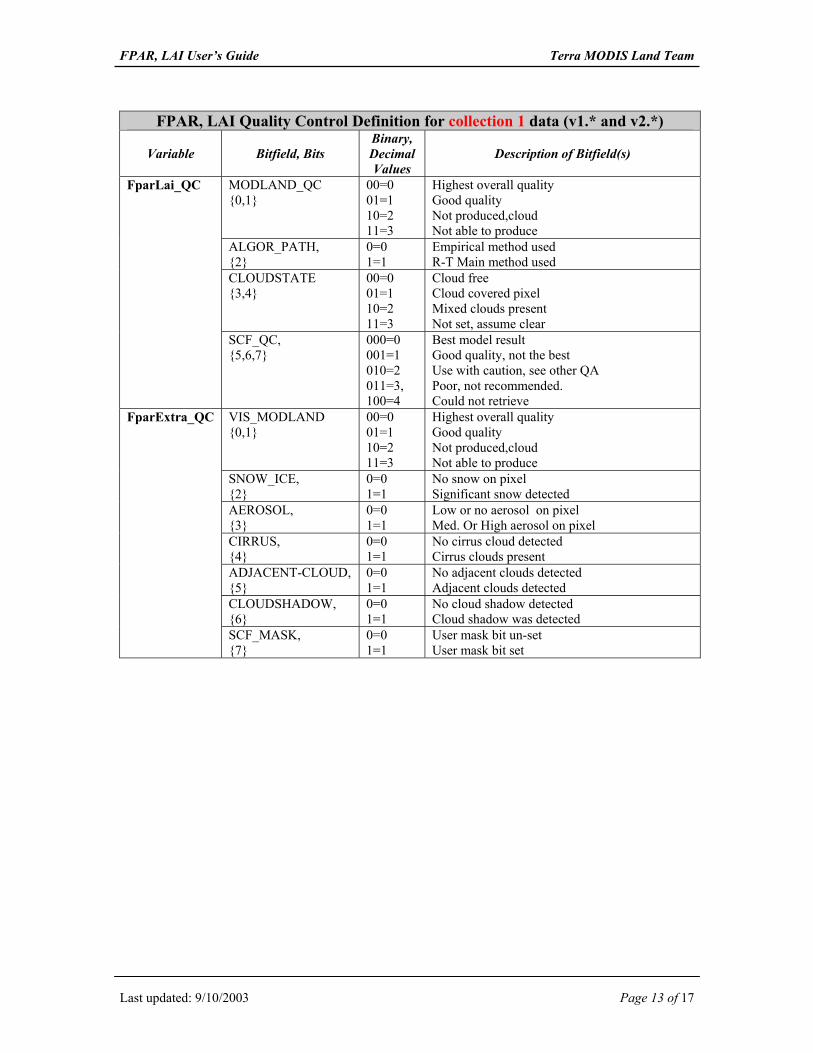
FPAR, LAI Quality Control Definition for collection 1 data (v1.* and v2.*)
Variable Bitfield, Bits Binary, Decimal Values
Description of Bitfield(s)
MODLAND_QC {0,1}
00=0 01=1 10=2 11=3
Highest overall quality Good quality Not produced,cloud Not able to produce
ALGOR_PATH, {2}
0=0 1=1
Empirical method used R-T Main method used
CLOUDSTATE {3,4}
00=0 01=1 10=2 11=3
Cloud free Cloud covered pixel Mixed clouds present Not set, assume clear
FparLai_QC
SCF_QC, {5,6,7}
000=0 001=1 010=2 011=3, 100=4
Best model result Good quality, not the best Use with caution, see other QA Poor, not recommended. Could not retrieve
VIS_MODLAND {0,1}
00=0 01=1 10=2 11=3
Highest overall quality Good quality Not produced,cloud Not able to produce
SNOW_ICE, {2}
0=0 1=1
No snow on pixel Significant snow detected
AEROSOL, {3}
0=0 1=1
Low or no aerosol on pixel Med. Or High aerosol on pixel
CIRRUS, {4}
0=0 1=1
No cirrus cloud detected Cirrus clouds present
ADJACENT-CLOUD, {5}
0=0 1=1
No adjacent clouds detected Adjacent clouds detected
CLOUDSHADOW, {6}
0=0 1=1
No cloud shadow detected Cloud shadow was detected
FparExtra_QC
SCF_MASK, {7}
0=0 1=1
User mask bit un-set User mask bit set
FPAR, LAI User’s Guide Terra MODIS Land Team
Last updated: 9/10/2003 Page 14 of 17
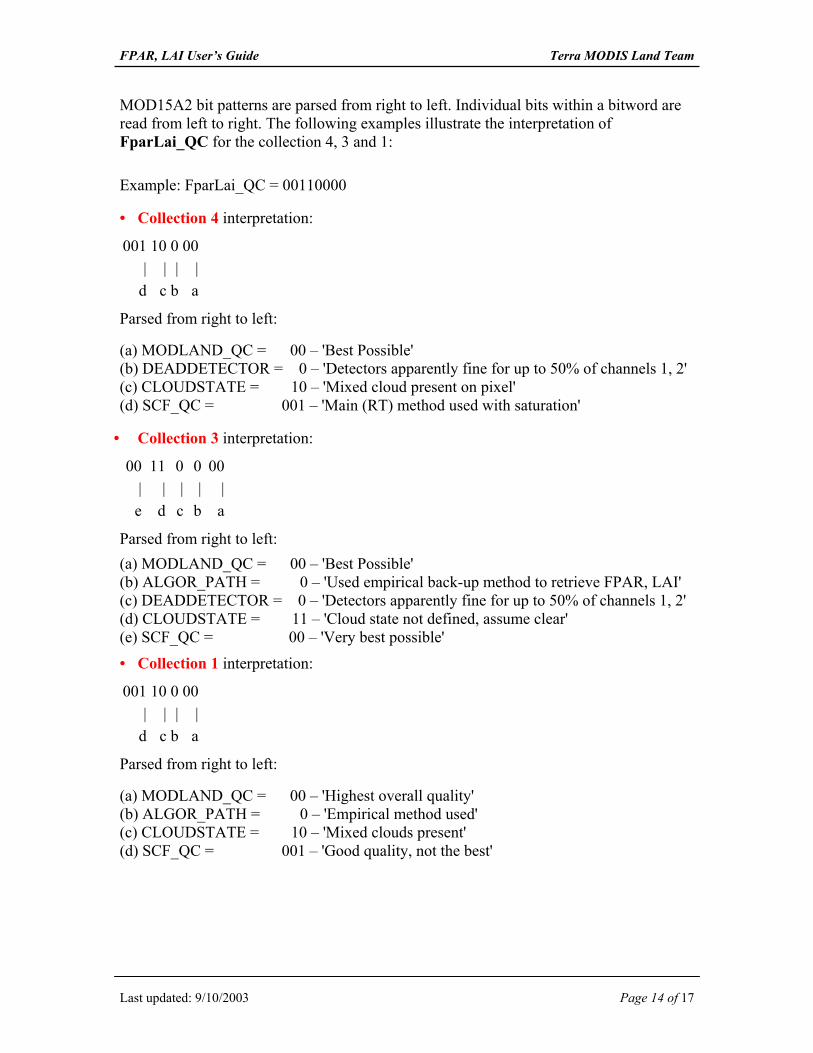
MOD15A2 bit patterns are parsed from right to left. Individual bits within a bitword are read from left to right. The following examples illustrate the interpretation of FparLai_QC for the collection 4, 3 and 1: Example: FparLai_QC = 00110000
• Collection 4 interpretation:
001 10 0 00 | | | |
d c b a
Parsed from right to left:
(a) MODLAND_QC = 00 – 'Best Possible' (b) DEADDETECTOR = 0 – 'Detectors apparently fine for up to 50% of channels 1, 2' (c) CLOUDSTATE = 10 – 'Mixed cloud present on pixel' (d) SCF_QC = 001 – 'Main (RT) method used with saturation'
• Collection 3 interpretation:
00 11 0 0 00 | | | | | e d c b a
Parsed from right to left: (a) MODLAND_QC = 00 – 'Best Possible' (b) ALGOR_PATH = 0 – 'Used empirical back-up method to retrieve FPAR, LAI' (c) DEADDETECTOR = 0 – 'Detectors apparently fine for up to 50% of channels 1, 2' (d) CLOUDSTATE = 11 – 'Cloud state not defined, assume clear' (e) SCF_QC = 00 – 'Very best possible'
• Collection 1 interpretation:
001 10 0 00 | | | |
d c b a
Parsed from right to left:
(a) MODLAND_QC = 00 – 'Highest overall quality' (b) ALGOR_PATH = 0 – 'Empirical method used' (c) CLOUDSTATE = 10 – 'Mixed clouds present' (d) SCF_QC = 001 – 'Good quality, not the best'
FPAR, LAI User’s Guide Terra MODIS Land Team
Last updated: 9/10/2003 Page 15 of 17
Document Information Several supporting documents are available for the FPAR, LAI product. The main theoretical basis of the product is described in the peer reviewed Algorithm Theoretical Basis Document (ATBD) which may be obtained at the Web site: http://modland.nascom.nasa.gov [TBD URL] References Huang, D., Yang, W., Tan, B., Shabanov, N.V., Knyazikhin, N.V., & Myneni, R.B. 2003.
Performance of the MODIS LAI & FPAR algorithm over grasslands as a function of uncertainties in the MODIS surface reflectance and land cover products. Remote Sens. Environ. (in review).
Knyazikhin, Y., J. V. Martonchik, D. J.Diner, R. B. Myneni, M. M. Verstraete, B. Pinty, and N. Gobron. 1998a. Estimation of vegetation canopy leaf area index and fraction of absorbed photosynthetically active radiation from atmosphere-corrected MISR data, J. Geophys. Res., 103: 32239-32256.
Knyazikhin, Y., J. V. Martonchik, R. B. Myneni, D. J. Diner, and S. W. Running. 1998b. Synergistic algorithm for estimating vegetation canopy leaf area index and fraction of absorbed photosynthetically active radiation from MODIS and MISR data, J. Geophys. Res., 103: 32257-32275.
Knyazikhin, Y., and Marshak, A.L. 2000. Mathematical aspects of BRDF modeling: adjoint problem and Green’s function. Remote Sens. Rev. 18: 263-280.
Marshak, A., Y. Knyazikhin, A. Davis, W. Wiscombe, and P. Pilewskie. 2000b. Cloud−vegetation interaction: use of Normalized Difference Cloud Index for estimation of cloud optical thickness, Geophys. Res. Lett., 27: 1695-1698.
Morisette, J.T., Privette, J.L. & Justice, C.O. 2002. A framework for the validation of MODIS land products. Remote Sens. Environ., 83: 77-96.
Myneni, R. B., Nemani, R. R., & Running, S.W. 1997. Algorithm for the estimation of global land cover, LAI and FPAR based on radiative transfer models. IEEE Trans. Geosc. Remote Sens., 35: 1380-1393.
Myneni, R.B., Hoffman, S., Knyazikhin, Y., Privette, J.L., Glassy, J., Tian, Y., Wang, Y., Song, X., Zhang, Y., Smith, Y., Lotsch, A., Friedl, M., Morisette, J.T., Votava, P., Nemani, R.R. and Running, S.W. 2002. Global products of vegetation leaf area and fraction absorbed PAR from year one of MODIS data. Remote Sens. Environ., 83: 214-231.
Panferov, O., Knyazikhin, Y., Myneni, R.B., Szarzynski, J., Engwald, S., Schnitzler, K.G. and Gravenhorst, G. 2001. The role of canopy structure in the spectral variation of transmission and absorption of solar radiation in vegetation canopies. IEEE Trans. Geosci. Remote Sens., 39: 241-253.
FPAR, LAI User’s Guide Terra MODIS Land Team
Last updated: 9/10/2003 Page 16 of 17
Privette, J.L., Myneni, R.B., Knyazikhin, Y., Mukelabai, M., Roberts, G., Tian, Y., Wang, W. and Leblanc, S.G. 2002. Early spatial and temporal validation of MODIS LAI product in Africa. Remote Sens. Environ., 83: 232-243.
Shabanov, N.V., Wang, Y., Buermann, W., Dong, J., Hoffman, S., Smith, G., Tian, Y., Knyazikhin, Y., Myneni, R.B. 2003. Effect of foliage spatial heterogeneity in the MODIS LAI and FPAR algorithm over broadleaf forests. Remote Sens. Environ., 85(4): 410-423.
Tan, B., Hu, J., Huang, D., Shabanov, N.V., Weiss, M., Knyazikhin, Y., & Myneni, R.B. 2003. Validation of MODIS LAI product in croplands of Alpilles, France and Bondville, USA. Remote Sens. Environ. (in review).
Tian, Y., Zhang, Y., Knyazikhin, J., Myneni, R.B., Glassy, J., Dedieu, G. and Running, S.W., 2000. Prototyping of MODIS LAI and FPAR algorithm with LASUR and LANDSAT data. IEEE Trans. Geosci. Remote Sens., 38(5): 2387-2401.
Tian, Y., Wang, Y., Zhang, Y., Knyazikhin, Y., Bogaert, J., & Myneni, R.B. 2002a. Radiative transfer based scaling of LAI/FPAR retrievals from reflectance data of different resolutions. Remote Sens. Environ., 84: 143-159.
Tian, Y., Woodcock, C.E., Wang, Y., Privette, J., Shabanov, N.V., Zhou, L., Zhang, Y., Buuermann, W., Dong, J., Veikkanen, B., Hame, T., Anderson, K., Ozdogan, M., Knyazikhin, Y., Myneni, R.B. 2002b. Multiscale analysis and validation of the MODIS LAI product over Maun, Botswana. I. Uncertainty Assessment. Remote Sens. Environ., 83: 414-430.
Tian, Y., Woodcock, C.E., Wang, Y., Privette, J., Shabanov, N.V., Zhou, L., Zhang, Y., Buuermann, W., Dong, J., Veikkanen, B., Hame, T., Anderson, K., Ozdogan, M., Knyazikhin, Y., Myneni, R.B. 2002c. Multiscale analysis and validation of the MODIS LAI product over Maun, Botswana. II. Sampling Strategy. Remote Sens. Environ., 83: 431-441.
Wang, Y., Tian, Y., Zhang, Y., El-Saleous, N., Knyazikhin, Y., Vermote, E. and Myneni, R.B., 2001. Investigation of product accuracy as a function of input and model uncertainities: case study with SeaWiFS and MODIS LAI/FPAR Algorithm. Remote Sens. Environ., 78: 296-311.
Wang, Y., Buermann, W., Stenberg, P., Smolander, H., Hame, T., Tian, Y., Hu, J., Knyazikhin, Y., & Myneni, R.B. 2003a. A new parameterization of canopy spectral response to incident solar radiation: Case study with hyperspectral data from pine dominant forest. Remote Sens. Environ. 85(3): 304-315.
Wang, Y., Woodcock, C.E., Buermann, W., Stenberg, P., Voipio, P., Smolander, H., Hame, T., Tian, Y., Hu, J., Knyazikhin, Y., & Myneni, R.B. 2003b. Validation of the MODIS LAI product in coniferous forest of Ruokolahti, Finland. Remote Sens. Environ. (in review).
Yang, Y., Huang, D., Shabanov, N.V., Stroeve, J.C., Knyazikhin, Y., & Myneni, R.B. (2003). Analysis of collection 3 MODIS LAI and FPAR products. Remote Sens. Environ. (in review).
Zhang, Y., Tian, Y., Knyazikhin, J., Martonchik, J.V., Diner, D.J., Leroy, M. and Myneni, R.B., 2000. Prototyping of MISR LAI and FPAR algorithm with POLDER data over Africa. IEEE Trans. Geosci. Remote Sens., 38(5): 2402-2418.
FPAR, LAI User’s Guide Terra MODIS Land Team
Last updated: 9/10/2003 Page 17 of 17
Glossary and Acronyms [TBD]