Embed Size (px)
Citation preview

User Guide for Cisco Unified Service Statistics ManagerCisco Unified Communications Management Suite Software Release 1.3
Americas HeadquartersCisco Systems, Inc.170 West Tasman DriveSan Jose, CA 95134-1706 USAhttp://www.cisco.comTel: 408 526-4000
800 553-NETS (6387)Fax: 408 527-0883
Text Part Number: OL-20784-01

THE SPECIFICATIONS AND INFORMATION REGARDING THE PRODUCTS IN THIS MANUAL ARE SUBJECT TO CHANGE WITHOUT NOTICE. ALL STATEMENTS, INFORMATION, AND RECOMMENDATIONS IN THIS MANUAL ARE BELIEVED TO BE ACCURATE BUT ARE PRESENTED WITHOUT WARRANTY OF ANY KIND, EXPRESS OR IMPLIED. USERS MUST TAKE FULL RESPONSIBILITY FOR THEIR APPLICATION OF ANY PRODUCTS.
THE SOFTWARE LICENSE AND LIMITED WARRANTY FOR THE ACCOMPANYING PRODUCT ARE SET FORTH IN THE INFORMATION PACKET THAT SHIPPED WITH THE PRODUCT AND ARE INCORPORATED HEREIN BY THIS REFERENCE. IF YOU ARE UNABLE TO LOCATE THE SOFTWARE LICENSE OR LIMITED WARRANTY, CONTACT YOUR CISCO REPRESENTATIVE FOR A COPY.
The Cisco implementation of TCP header compression is an adaptation of a program developed by the University of California, Berkeley (UCB) as part of UCB’s public domain version of the UNIX operating system. All rights reserved. Copyright © 1981, Regents of the University of California.
NOTWITHSTANDING ANY OTHER WARRANTY HEREIN, ALL DOCUMENT FILES AND SOFTWARE OF THESE SUPPLIERS ARE PROVIDED “AS IS” WITH ALL FAULTS. CISCO AND THE ABOVE-NAMED SUPPLIERS DISCLAIM ALL WARRANTIES, EXPRESSED OR IMPLIED, INCLUDING, WITHOUT LIMITATION, THOSE OF MERCHANTABILITY, FITNESS FOR A PARTICULAR PURPOSE AND NONINFRINGEMENT OR ARISING FROM A COURSE OF DEALING, USAGE, OR TRADE PRACTICE.
IN NO EVENT SHALL CISCO OR ITS SUPPLIERS BE LIABLE FOR ANY INDIRECT, SPECIAL, CONSEQUENTIAL, OR INCIDENTAL DAMAGES, INCLUDING, WITHOUT LIMITATION, LOST PROFITS OR LOSS OR DAMAGE TO DATA ARISING OUT OF THE USE OR INABILITY TO USE THIS MANUAL, EVEN IF CISCO OR ITS SUPPLIERS HAVE BEEN ADVISED OF THE POSSIBILITY OF SUCH DAMAGES.
CCDE, CCENT, CCSI, Cisco Eos, Cisco Explorer, Cisco HealthPresence, Cisco IronPort, the Cisco logo, Cisco Nurse Connect, Cisco Pulse, Cisco SensorBase, Cisco StackPower, Cisco StadiumVision, Cisco TelePresence, Cisco TrustSec, Cisco Unified Computing System, Cisco WebEx, DCE, Flip Channels, Flip for Good, Flip Mino, Flipshare (Design), Flip Ultra, Flip Video, Flip Video (Design), Instant Broadband, and Welcome to the Human Network are trademarks; Changing the Way We Work, Live, Play, and Learn, Cisco Capital, Cisco Capital (Design), Cisco:Financed (Stylized), Cisco Store, Flip Gift Card, and One Million Acts of Green are service marks; and Access Registrar, Aironet, AllTouch, AsyncOS, Bringing the Meeting To You, Catalyst, CCDA, CCDP, CCIE, CCIP, CCNA, CCNP, CCSP, CCVP, Cisco, the Cisco Certified Internetwork Expert logo, Cisco IOS, Cisco Lumin, Cisco Nexus, Cisco Press, Cisco Systems, Cisco Systems Capital, the Cisco Systems logo, Cisco Unity, Collaboration Without Limitation, Continuum, EtherFast, EtherSwitch, Event Center, Explorer, Follow Me Browsing, GainMaker, iLYNX, IOS, iPhone, IronPort, the IronPort logo, Laser Link, LightStream, Linksys, MeetingPlace, MeetingPlace Chime Sound, MGX, Networkers, Networking Academy, PCNow, PIX, PowerKEY, PowerPanels, PowerTV, PowerTV (Design), PowerVu, Prisma, ProConnect, ROSA, SenderBase, SMARTnet, Spectrum Expert, StackWise, WebEx, and the WebEx logo are registered trademarks of Cisco and/or its affiliates in the United States and certain other countries.
All other trademarks mentioned in this document or website are the property of their respective owners. The use of the word partner does not imply a partnership relationship between Cisco and any other company. (1002R)
Any Internet Protocol (IP) addresses used in this document are not intended to be actual addresses. Any examples, command display output, and figures included in the document are shown for illustrative purposes only. Any use of actual IP addresses in illustrative content is unintentional and coincidental.
User Guide for Cisco Unified Service Statistics Manager © 2007-2010 Cisco Systems, Inc. All rights reserved.

OL-20784-01
C O N T E N T S
Preface xi
Audience xi
Conventions xi
Product Documentation xii
Related Documentation xiii
Obtaining Documentation and Submitting a Service Request xiii
C H A P T E R 1 Getting Started with Service Statistics Manager 1-1
Service Statistics Manager Overview 1-1
Launching Service Statistics Manager 1-2
Performing the Initial Login 1-2
Viewing Product License and Version 1-3
Using the Service Statistics Manager User Interface 1-4
Using Special Characters in Names or Views, Reports, Graphs, and SLAs 1-5
Important Data Collection Concepts 1-5
What Is a Monitor? 1-5
What Is a Monitor Type? 1-6
How Does a Monitor Type Compare with an Attribute Set? 1-7
C H A P T E R 2 Using Views 2-1
Getting Started with Views 2-1
Managing Report-Based Views 2-3
Creating a Report-Based View 2-4
Changing the Order of Reports in a Report-Based View 2-4
Editing a Report-Based View 2-5
Deleting a Report-Based View 2-5
Managing Graph-Based Views 2-5
Creating a Graph-Based View 2-6
Understanding the Attribute Selection and Graph Options Page 2-7
Editing a Graph-Based View 2-7
Editing a Graph in a Graph-Based View 2-9
Deleting a Graph from a Graph-Based View 2-10
Deleting a Graph-Based View 2-10
iiiUser Guide for Cisco Unified Service Statistics Manager

Contents
Changing the Order of Graphs in a Graph-Based View 2-10
Working with Views 2-11
Working with Graph-Based Views 2-11
Manually Updating Graph-Based Views 2-12
C H A P T E R 3 Using Reports 3-1
Getting Started with Reports 3-1
Understanding the Reports Tab 3-1
Default Reports 3-3
Understanding Data Rollup and Data Retention 3-12
Understanding Reports That Are Based on Call Volume Data 3-12
Understanding and Using Reports 3-13
Understanding the Report Header 3-13
Using the Report Icons in the Title Bar 3-13
Viewing Subreports 3-14
Viewing Comments 3-14
Obtaining Additional Information from Graphs, Legends, and Drill-Downs 3-15
Adding a Comment to a Report 3-15
Adding a Report to a View 3-15
E-Mailing a Report 3-16
Using Specific Types of Reports 3-16
Using a Call Failure Summary Report 3-17
Using a Call Quality Summary Report 3-18
Using a Calls to/from Specified Number Report 3-19
Using a Capacity Trend Report 3-19
Using a Cause Code Analysis Report 3-20
Using a Custom Graph Report 3-21
Using a Group Aggregation Report 3-21
Using an Instance Aggregation Report 3-22
Using a Time Aggregation Report 3-22
Using a Top N Dialed Numbers Report 3-23
Using a Top N Calls Report 3-24
Using a Top N Users Report 3-24
Using a Top N Performers Report 3-25
Using a Traffic Summary Report 3-25
Using an SLA Capacity Trend Report 3-26
Using an SLA Compliance History Report 3-27
Using an SLA Compliance Matrix Report 3-27
Using an SLA Executive Summary Report 3-28
ivUser Guide for Cisco Unified Service Statistics Manager
OL-20784-01

Contents
Using an SLA Health Summary Report 3-29
Managing Reports 3-29
Creating a Report—Page 1 of the Report Wizard (Initial Details) 3-30
Creating a Report—Page 2 of the Report Wizard (Specific Report Type Details) 3-32
Understanding the Use of Color on Graphs in Reports 3-32
Call Failure Summary Report 3-33
Call Quality Summary Report 3-34
Calls To/From Specified Number Report 3-35
Capacity Trend Report 3-36
Cause Code Analysis Report 3-37
Custom Graph Report 3-38
Selecting Elements to Include in a Custom Graph Report 3-39
Group Aggregation Report 3-40
Instance Aggregation Report 3-41
Time Aggregation Report 3-42
Top N Calls Reports 3-43
Top N Dialed Numbers Report 3-44
Top N Users Report 3-45
Top N Performers Report 3-46
Traffic Summary Report 3-47
SLA Capacity Trend Report 3-48
SLA Compliance History Report 3-48
SLA Compliance Matrix Report 3-49
SLA Executive Summary Report 3-50
SLA Health Summary Report 3-50
Creating a Report—Page 3 of the Report Wizard (Display, Schedule, and E-Mail Options) 3-51
Editing a Report 3-53
Editing a Report—Page 1: Updating Initial Report Details 3-53
Editing a Report—Page 2: Updating Report Type-Specific Details 3-53
Editing a Report—Page 3: Updating Display, E-Mail, and Schedule Options 3-54
Deleting a Report 3-54
C H A P T E R 4 Using Custom Graphs 4-1
Getting Started with Custom Graphs 4-1
Creating Custom Graphs 4-1
Creating Line Graphs 4-1
Creating Area Graphs 4-3
Creating X-Y Graphs 4-4
Creating Top N Graphs 4-5
vUser Guide for Cisco Unified Service Statistics Manager
OL-20784-01

Contents
Using the List All Button in a Top N Graph Display 4-6
Using the Description Table in a Top N Graph Display 4-6
Creating a Graph for a Single Monitor Type 4-6
Creating Graphs for Multiple Monitor Types 4-7
Understanding and Interacting with Custom Graphs 4-8
Using the Attributes Tab to Update a Graph 4-10
Adding a Multiple-Graph (MG) Display to a View 4-10
Viewing Instance Details on the Monitor Information Tab 4-11
Using Additional Graphing Functions 4-11
Zooming In and Out 4-11
Exporting to Excel 4-12
Adding New Monitors to a Graph 4-12
Viewing More Information 4-12
Adding a Specific Graph to a View 4-13
Deleting a Graph from a Multiple-Graph Display 4-13
Graphing Restrictions and Limitations 4-13
C H A P T E R 5 Managing SLAs and Monitoring Compliance 5-1
Getting Started with SLAs 5-1
Using the Compliance Matrix 5-2
Compliance Matrix Icons 5-4
Viewing the Compliance Matrix for a Specific SLA 5-4
Viewing SLA Details (Compliance Matrix Details Column) 5-5
Viewing Element Details (SLA Details Threshold Condition Link) 5-6
Viewing Violation Details (Compliance Matrix Current Status Column) 5-6
Launching the SLA Compliance History Report (Compliance Matrix History) 5-7
Viewing Data Points for a Time Period (Compliance Matrix Time-Period-to-Date Details) 5-7
Using SLA Administration to Manage SLAs 5-8
Adding an SLA 5-8
Adding an SLA to Measure Compliance for Instances 5-9
Adding an SLA to Group Other SLAs 5-11
Adding an SLA to Measure the Compliance of a Group of SLAs 5-12
Adding an SLA Type 5-12
Editing an SLA Type 5-13
Editing an SLA 5-13
Editing a Nested SLA 5-15
Deleting an SLA 5-16
Defining Schedules 5-16
Adding a Schedule When Configuring Custom Graphs, Reports, and SLAs 5-17
viUser Guide for Cisco Unified Service Statistics Manager
OL-20784-01

Contents
Editing a Schedule When Configuring Custom Graphs, Reports, and SLAs 5-17
Deleting a Schedule 5-18
C H A P T E R 6 Using the SSM Administration Console 6-1
SSM Administration Console Overview 6-1
Launching the SSM Administration Console 6-2
SSM Administration Console Folders 6-2
Managing Groups 6-3
Adding a Group by Selecting Each Element 6-3
Searching for Group Members 6-4
Adding a Group by Selecting Groups 6-5
Defining Group Display 6-6
Editing a Group 6-6
Deleting a Group 6-6
Managing Users 6-6
Adding a User 6-7
Editing a User 6-7
Deleting a User 6-8
Managing User Roles and Privileges 6-8
Adding a Role 6-10
Editing a Role 6-12
Deleting a Role 6-12
Managing Remote Agents 6-12
Adding a Remote SSM Agent 6-13
Changing the TCP Connection Port for a Remote SSM Agent 6-14
SSM Agent Troubleshooting Tips 6-14
Understanding Communication Between an SSM Agent and the Service Statistics Manager Server 6-16
Editing an SSM Remote Agent 6-16
Deleting an SSM Agent 6-17
Connecting an SSM Agent 6-18
Disconnecting an SSM Agent 6-18
Restarting an SSM Agent 6-18
C H A P T E R 7 Using Administration 7-1
Changing Your Password 7-1
Selecting Your Dashboard View 7-1
Selecting Your Home View 7-2
viiUser Guide for Cisco Unified Service Statistics Manager
OL-20784-01

Contents
Performing Advanced Administration Tasks 7-2
Configuring Attribute Sets 7-3
Adding an Attribute Set 7-3
Editing an Attribute Set 7-4
Deleting an Attribute Set 7-5
Configuring Schedules 7-5
Adding a Schedule 7-5
Editing a Schedule 7-6
Deleting a Schedule 7-7
Configuring Phone-Based Groups 7-7
Configuring Call Quality 7-8
Integrating with Operations Manager and Service Monitor 7-9
Triggering Discovery 7-10
Retriggering Discovery 7-12
Editing Operations Manager and Service Monitor IP Addresses 7-13
Deleting a Service Monitor from Service Statistics Manager 7-15
Working with Downloads 7-15
Installing the SSM Administration Console on Another System 7-16
Installing SSM Agent on Another System 7-16
Verifying the SSM Agent and SSM Administration Console Software Version 7-17
Uninstalling a Remote SSM Agent 7-18
Uninstalling a Remote SSM Administration Console 7-18
C H A P T E R 8 Database and System Administration 8-1
Administering the Database 8-1
Understanding Database Purging 8-2
Understanding Database Archiving and Archive Files 8-2
Backing Up and Restoring the Database 8-3
Performing a Full Database Backup 8-3
(Optional) Saving an Existing Full Database Backup Before Creating a New One 8-5
Restoring the Database 8-5
Moving Service Statistics Manager Server Data to Another Disk 8-6
Recognizing Issues and Applying Workarounds 8-7
Troubleshooting Login Problems 8-11
Using an Evaluation License 8-11
Installing a License 8-11
Updating the SMTP Server and Port Number 8-12
viiiUser Guide for Cisco Unified Service Statistics Manager
OL-20784-01

Contents
A P P E N D I X A Devices, Monitor Types, and Attributes A-1
Devices and Associated Monitor Types A-1
Service Monitor Database Monitor Types A-2
Understanding Data Collection from Service Monitor A-3
Call Quality Monitor Type Attributes A-3
Call Quality by NAM Monitor Type Attributes A-4
Call Quality by Sensor Monitor Type Attributes A-4
Call Volume Monitor Type Attributes A-5
Operations Manager File-Based Monitor Types A-9
CME Performance Monitor Type Attributes A-10
CUE Performance Monitor Type Attributes A-10
Gatekeeper Performance Monitor Type Attributes A-11
Gateway Utilization Monitor Type Attributes A-11
System Utilization for IOS Router Monitor Type Attributes A-12
System Utilization for Unified CCE Monitor Type Attributes A-13
System Utilization for Unified CM Monitor Type Attributes A-13
System Utilization for Unity Monitor Type Attributes A-13
System Utilization for Unity Connection Monitor Type Attributes A-14
Trunk Utilization Monitor Type Attributes A-14
Unified CCE Performance Monitor Type Attributes A-15
Unified CM Performance Monitor Type Attributes A-15
Node-to-Node Test File-Based Monitor Types and Attributes A-16
IPSLA Data Jitter Monitor Type Attributes A-16
IPSLA Gatekeeper Registration Delay Monitor Type Attributes A-17
IPSLA Ping Echo Monitor Type Attributes A-17
IPSLA Ping Path Echo Monitor Type Attributes A-17
IPSLA UDP Echo Monitor Type Attributes A-18
A P P E N D I X B Default Report Definitions B-1
IN D E X
ixUser Guide for Cisco Unified Service Statistics Manager
OL-20784-01

Contents
xUser Guide for Cisco Unified Service Statistics Manager
OL-20784-01

Preface
This manual describes Cisco Unified Service Statistics Manager (Service Statistics Manager) and provides instructions for using and administering it.
AudienceThe audience for this document includes:
• Executives who need to assess how well the Cisco Unified Communications solution is working from a user standpoint; the volume of voice service delivery; and how voice service delivery impacts the rest of the network.
• Capacity planners
• IP telephony operations personnel who need to identify misuse and exceptions; problems that most require focused attention and issue resolution; and resources that are either redundant or in need of repair.
ConventionsThis document uses the following conventions:
Item Convention
Commands and keywords boldface font
Variables for which you supply values italic font
Displayed session and system information screen font
Information you enter boldface screen font
Variables you enter italic screen font
Menu items and button names boldface font
Selecting a menu item in paragraphs Option > Network Preferences
Selecting a menu item in tables Option > Network Preferences
xiUser Guide for Cisco Unified Service Statistics Manager
OL-20784-01

Preface
Note Means reader take note. Notes contain helpful suggestions or references to material not covered in the publication.
Caution Means reader be careful. In this situation, you might do something that could result in equipment damage or loss of data.
Product Documentation
Note The originally published printed and electronic documentation is included with your product. Any changes after original publication are reflected on Cisco.com, where you will find the most up-to-date documentation.
Table 1 describes the product documentation that is available.
Related Documentation
Note The originally published printed and electronic documentation was included with your product. Any changes after original publication are reflected on Cisco.com, where you will find the most up-to-date documentation.
Table 1 Product Documentation
Document Title Available on Cisco.com at this URL
Release Notes for Cisco Unified Service Statistics Manager 1.3
http://cisco.com/en/US/docs/net_mgmt/cisco_unified_service_statistics_manager/1.3/release/notes/ReleaseNotesforCiscoUnifiedServiceStatisticsManager1_3.html
Quick Start Guide for Cisco Unified Service Statistics Manager 1.3
http: //cisco.com/en/US/docs/net_mgmt/cisco_unified_service_statistics_manager/1.3/quick/guide/QuickStartGuideCiscoUnifiedServiceStatisticsManager1_3.html
User Guide for Cisco Unified Service Statistics Manager
http://cisco.com/en/US/docs/net_mgmt/cisco_unified_service_statistics_manager/1.3/user/guide/UserGuideforCiscoUnifiedServiceStatisticsManager.html
Context-sensitive online help Click the Help link in the upper-right corner of the window or the help button in any dialog box.
xiiUser Guide for Cisco Unified Service Statistics Manager
OL-20784-01

Preface
Table 2 describes the additional documentation that is available.
Obtaining Documentation and Submitting a Service RequestFor information on obtaining documentation, submitting a service request, and gathering additional information, see the monthly What’s New in Cisco Product Documentation, which also lists all new and revised Cisco technical documentation, at:
http://www.cisco.com/en/US/docs/general/whatsnew/whatsnew.html
Subscribe to the What’s New in Cisco Product Documentation as a Really Simple Syndication (RSS) feed and set content to be delivered directly to your desktop using a reader application. The RSS feeds are a free service and Cisco currently supports RSS version 2.0.
Table 2 Related Documentation
Document Title Cisco.com URL Where Document Is Available
Quick Start Guide for Cisco 1040 Sensor
http://www.cisco.com/en/US/docs/net_mgmt/cisco_unified_service_monitor/2.1/quick/guide/1040qs21.html
Release Notes for Cisco Unified Operations Manager 2.3
http://www.cisco.com/en/US/docs/net_mgmt/cisco_unified_operations_manager/2.3/release/notes/OM_RN23.html
Installation Guide for Cisco Unified Operations Manager 2.3(Includes Service Monitor)
http://www.cisco.com/en/US/docs/net_mgmt/cisco_unified_operations_manager/2.3/installation/guide/InstallationGuideforCiscoUnifiedOperationsManager.html
User Guide for Cisco Unified Operations Manager 2.3
http://www.cisco.com/en/US/docs/net_mgmt/cisco_unified_operations_manager/2.3/user/guide/CUOM_UserGuide23.html
Release Notes for Cisco Unified Service Monitor 2.3
http://www.cisco.com/en/US/docs/net_mgmt/cisco_unified_service_monitor/2.3/release/notes/ReleaseNotesforCiscoUnifiedServiceMonitor2_3.html
Cisco Unified Service Monitor 2.3 Compatibility Matrix
http://www.cisco.com/en/US/docs/net_mgmt/cisco_unified_service_monitor/2.3/sdt/CiscoUnifiedServiceMonitorCompatibilityMatrix23.html
Installation Guide for Cisco Unified Service Monitor 2.3
http://www.cisco.com/en/US/docs/net_mgmt/cisco_unified_service_monitor/2.3/installation/guide/InstallationGuideforCiscoUnifiedServiceMonitor23.html
User Guide for Cisco Unified Service Monitor 2.3
http://www.cisco.com/en/US/docs/net_mgmt/cisco_unified_service_monitor/2.3/user/guide/UserGuideforCiscoUnifiedServiceMonitor2_3.html
Release Notes for CiscoWorks Common Services 3.2
http://www.cisco.com/en/US/docs/net_mgmt/ciscoworks_common_services_software/3.2/release/notes/cs32rel.html
User Guide for CiscoWorks Common Services 3.2
http://www.cisco.com/en/US/docs/net_mgmt/ciscoworks_common_services_software/3.2/user/guide/cs32ug.html
xiiiUser Guide for Cisco Unified Service Statistics Manager
OL-20784-01

Preface
xivUser Guide for Cisco Unified Service Statistics Manager
OL-20784-01

User OL-20784-01
C H A P T E R 1
Getting Started with Service Statistics ManagerSee the following topics:
• Service Statistics Manager Overview, page 1-1
• Launching Service Statistics Manager, page 1-2
• Viewing Product License and Version, page 1-3
• Using the Service Statistics Manager User Interface, page 1-4
• Important Data Collection Concepts, page 1-5
Service Statistics Manager OverviewCisco Unified Service Statistics Manager (Service Statistics Manager) is a product from the Cisco Unified Communications Management Suite that uses short-term operational data—collected by other products in the suite—to perform longer-term analysis and reporting. The Service Statistics Manager product includes three components that are referred to throughout this document:
• Service Statistics Manager—Refers to both:
– The application server with the database and the backend processes that store and analyze data and create reports and graphs.
– The web server through which you can access the user interface and view reports and graphs.
For more information, see Using the Service Statistics Manager User Interface, page 1-4.
• SSM Agent—Creates monitors (data collectors) on Cisco Unified Operations Manager (Operations Manager) and Cisco Unified Service Monitor (Service Monitor) systems where it is installed; and coordinates polling for data on Operations Manager and Service Monitor systems and delivery of data to Service Statistics Manager. For more information, see Integrating with Operations Manager and Service Monitor, page 7-9.
• SSM Administration Console—Manages groups, users, roles, and SSM Agents. Only a user in the Administrator role in Service Statistics Manager can log into this console. For more information, see Using the SSM Administration Console, page 6-1.
1-1Guide for Cisco Unified Service Statistics Manager

Chapter 1 Getting Started with Service Statistics ManagerLaunching Service Statistics Manager
Launching Service Statistics Manager
Note For information about the SSM Administration Console, which enables a user in the Administrator role to configure Service Statistics Manager and control access to it, see Using the SSM Administration Console, page 6-1.
After a user in the Administrator role has performed initial configuration and provided you with a username and password, you can connect to the Service Statistics Manager server. Prior to that, see Performing the Initial Login, page 1-2.
Step 1 Open a browser and enter the appropriate address:
• To run Service Statistics Manager in secure mode, enter this:
https://servername or IP address:48443
• If you do not need to run Service Statistics Manager in secure mode, enter this:
http://servername or IP address:48101
Note If the login window fails to appear, contact your Administrator.
Step 2 In the Service Statistics Manager Login window, enter the username and password provided to you by the Administrator. The default username and password (on installation) is admin. (For more information, see Performing the Initial Login, page 1-2.)
Step 3 Click Login. If you have an evaluation license for Service Statistics Manager, a reminder message displays the number of days remaining in the evaluation period. For more information, see Using an Evaluation License, page 8-11.
Caution Avoid multiple logins using the same browser, username, and password; otherwise, results are unpredictable. For multiple logins, open separate browser instances.
Login sessions time out after 2 hours of inactivity. If a session is not used for 2 hours, you are prompted to log in again.
Performing the Initial Login If you are logging in for the first time, you can use the reserved “admin” username and password.
Note During the initial login, change the password for admin, the reserved username, and create additional users with appropriate privileges as directed in this procedure.
Step 1 Open a browser and enter the appropriate address:
• To run Service Statistics Manager in secure mode, enter this:
https://servername or IP address:48443
1-2User Guide for Cisco Unified Service Statistics Manager
OL-20784-01

Chapter 1 Getting Started with Service Statistics ManagerViewing Product License and Version
• If you do not need to run Service Statistics Manager in secure mode, enter this:
http://servername or IP address:48101
Note If the Login window fails to appear, contact your Administrator.
Step 2 Enter admin in the User Name field and the password set for admin in the Password field.
Note Contact a Service Statistics Manager user in the Administrator role if you do not know the password for admin or if you need a username and password.
Step 3 Click Login or press Enter. You are now logged in.
Note Login sessions time out after 2 hours of inactivity. If a session is not used for 2 hours, you are prompted to log in again.
Step 4 Change the admin password by selecting Administration > User ID and Password.
Step 5 Log into the SSM Administration Console. (Only a user in the Administrator role can do so; the reserved user admin is such a user. You can create additional users in the Administrator role.) See Using the SSM Administration Console, page 6-1, Managing Users, page 6-6, and Managing User Roles and Privileges, page 6-8.
Viewing Product License and Version
Note To view the SSM Agent and SSM Administration Console software versions, see Verifying the SSM Agent and SSM Administration Console Software Version, page 7-17.
Use this procedure to view the Service Statistics Manager software version and to obtain product license details.
Step 1 Click About in the upper-right corner of the Service Statistics Manager window. The About Cisco Unified Service Statistics Manager window opens, displaying the following information:
• Version—Version number of the product.
• License Type—One of the following:
– Evaluation—You have full access to the product for 90 days.
– Standard—You have limited access to the product. You will not have access to the SLA tab.
– Premium—You have full access to the product.
• Number of Phones Licensed—Number of phones for which Service Statistics Manager can gather statistics.
1-3User Guide for Cisco Unified Service Statistics Manager
OL-20784-01
Chapter 1 Getting Started with Service Statistics ManagerUsing the Service Statistics Manager User Interface
• License Expiration Date—Expiry date of the evaluation license. (Not displayed if your license type is Standard or Premium.
Step 2 Click Close.
Using the Service Statistics Manager User InterfaceThis topic provides an overview of the Service Statistics Manager user interface and the tasks that you can perform from each tab within it. After you log in, the Cisco Unified Service Statistics Manager window opens to the Views tab. (A view is a named collection of reports or graphs.) Service Statistics Manager can contain up to five tabs:
• Views—Displays an ordered group of thumbnails, each with a link to a full report or a detailed graph. By clicking a thumbnail, you can launch a report or a graph. From each report or graph, you can drill down to view underlying details on accompanying reports or graphs, drilling down successively until no more details remain for display.
When you log in, a default home view is displayed. You can:
– Configure another view as your home view.
– Select any other view to which you have access. Service Statistics Manager provides a set of default views, and access to them is security controlled.
If you have the privilege to manage views, you can also create, edit, and delete them. For more information, see Managing User Roles and Privileges, page 6-8 and Using Views, page 2-1.
• Reports—Lists available reports with links so that you can launch those that have already been generated. From a report, you can drill down to view underlying details on accompanying reports or graphs, drilling down successively until no more details remain for display.
Service Statistics Manager provides a set of default reports. If you have the privilege to manage reports, you can also create, edit, and delete them.
For more information, see Using Reports, page 3-1.
• Custom Graphs—Provides selection criteria for generating individual and multiple graphs using the graphing format that you require.
• SLAs (Service Level Agreements)—Enables you to define SLAs and measure compliance with them. You can define SLAs to measure any attribute that is being monitored—for example, percentage of ports in use on a Cisco Unity system—against user-defined goals. SLA compliance is calculated after the end of each day and is displayed in summary format on the compliance matrix. From the compliance matrix, you can immediately see where compliance is met or not met and drill down to obtain underlying details.
Note If you have a Standard license, the SLAs tab is not displayed.
If you have the privilege to manage SLAs, you can also create, edit, and delete them.
For more information, see Managing SLAs and Monitoring Compliance, page 5-1.
• Administration—Enables you to configure your user preferences (for example, select your home view and change your password); integrate Service Statistics Manager with data sources (for example, one system with Operations Manager and one or more systems with Service Monitor); and install the SSM Agent and SSM Administration Console.
1-4User Guide for Cisco Unified Service Statistics Manager
OL-20784-01

Chapter 1 Getting Started with Service Statistics ManagerImportant Data Collection Concepts
For more information, see Using Administration, page 7-1.
Options available in the upper-right corner of the Service Statistics Manager window are:
• Logout—Click to log out of Service Statistics Manager.
• Help—Click to open online help.
• About—Click to display Service Statistics Manager software version number and license information.
Throughout the user interface, Service Statistics Manager frequently provides these buttons:
• Next—Click to go to the next step on a page or in a wizard.
Note Use the browser Back function to return to an earlier page.
• Cancel—Click to exit from a multistep page or wizard without saving data.
• —Click to view context-sensitive online help for the window or pane.
Using Special Characters in Names or Views, Reports, Graphs, and SLAsTable 1-1 lists special characters that you should not use when naming a view, report, graph, or SLA.
Important Data Collection ConceptsTo understand how you can get the most out of Service Statistics Manager, it is important to understand monitors, monitor types, and attribute sets. They are described in the following topics:
• What Is a Monitor?, page 1-5
• What Is a Monitor Type?, page 1-6
• How Does a Monitor Type Compare with an Attribute Set?, page 1-7
What Is a Monitor? Service Statistics Manager receives data from monitors (data collectors) that are created by SSM Agents on an Operations Manager system and on supported, related Service Monitor systems.
Table 1-1 Special Characters
To Name Special Characters Not Allowed
View, report, SLA ` \ ” ’ < > /
Graph ` ” ’ < > #
1-5User Guide for Cisco Unified Service Statistics Manager
OL-20784-01

Chapter 1 Getting Started with Service Statistics ManagerImportant Data Collection Concepts
A monitor collects data for a specific managed element, such as a specific voice gateway or Cisco Unified Communications Manager (Unified Communications Manager). Each managed element can have multiple monitors assigned to it, each collecting a different type of data. For example, for a specific Unified Communications Manager, there will be two monitors on the Operations Manager system:
• Unified CM Performance Monitor—Collects statistics about the calls handled through Unified Communications Manager and the voice gateways and hardware and software conference resources that are registered with Unified Communications Manager.
• System Utilization for Unified CM Monitor—Collects data about the system on which the Unified Communications Manager resides.
For each specific managed element, SSM agents create one monitor for each associated monitor type. SSM agents coordinate polling for data and delivery of data to Service Statistics Manager.
What Is a Monitor Type?A monitor type defines a unique set of statistics or attributes to be collected for a device type. A monitor type includes:
• A descriptive name—for example, Gateway Utilization—that generally describes:
– The type of device for which the monitor type can collect data (in this example, a gateway). For more information, see Devices and Associated Monitor Types, page A-1.
– The type of data that you can expect from this monitor type (in this example, utilization statistics).
• A list of attributes that are available to be collected for the type of device and that conform to the expected type of data. For the example of the Gateway Utilization monitor type, the attributes are:
– T1 CAS Utilization
– E1 CAS Utilization
– T1 PRI Utilization
– E1 PRI Utilization
– FXO Utilization
– FXS Utilization
– BRI Utilization
– E and M Utilization
When SSM agents create monitors, each monitor type functions as a definition or a template for creating a monitor. Service Statistics Manager provides monitor types for Service Monitor and Operations Manager:
• The Service Monitor monitor types are:
– Call Volume
– Call Quality
– Call Quality by NAM
– Call Quality by Sensor
For the attributes—the statistics—associated with these monitor types, see Service Monitor Database Monitor Types, page A-2.
1-6User Guide for Cisco Unified Service Statistics Manager
OL-20784-01

Chapter 1 Getting Started with Service Statistics ManagerImportant Data Collection Concepts
• The Operations Manager monitor types are:
– CME Performance
– CUE Performance
– Gatekeeper Performance
– Gateway Utilization
– IPSLA Data Jitter
– IPSLA Ping Echo
– IPSLA Ping Path Echo
– IPSLA UDP Echo
– IPSLA Gatekeeper Regarding Delay
– System Utilization for IOS Routers
– System Utilization for Unified CCE
– System Utilization for Unified Communications Manager
– System Utilization for Unity
– Trunk Utilization
– Unified CCE Performance
– Unified Communications Manager Performance
For the attributes associated with these monitor types, see Operations Manager File-Based Monitor Types, page A-9.
How Does a Monitor Type Compare with an Attribute Set?Monitor types are named collections of attributes for a specific device type. See Devices and Associated Monitor Types, page A-1. Monitor types are used as templates for creating monitors and are predefined in Service Statistics Manager.
Attribute sets include one or more monitor types, each with selected attributes. Service Statistics Manager contains a few predefined attribute sets from which you can select when defining reports and SLAs. In addition, users with the privilege to do so can define attribute sets. For more information, see Configuring Attribute Sets, page 7-3. An SLA type is also an attribute set; see Adding an SLA Type, page 5-12.
Note Your license type controls whether you have access to the SLA tab.
Table 1-2 offers a comparison of monitor types and attribute sets.
Table 1-2 Monitor Types and Attribute Sets
Aspect Monitor Type Attribute Set
Descriptive Name Defined by Service Statistics Manager User-defined
1-7User Guide for Cisco Unified Service Statistics Manager
OL-20784-01

Chapter 1 Getting Started with Service Statistics ManagerImportant Data Collection Concepts
Attributes/Statistics to Collect
Defined by Service Statistics Manager User-defined
Monitoring Each relevant managed element is monitored.
User-selected managed elements are monitored. You select from a list of relevant managed elements when configuring an attribute set.
Table 1-2 Monitor Types and Attribute Sets (continued)
Aspect Monitor Type Attribute Set
1-8User Guide for Cisco Unified Service Statistics Manager
OL-20784-01
User OL-20784-01
C H A P T E R 2
Using ViewsThe Views tab displays an ordered group of thumbnails, each with a link to a full report or a detailed graph. You can launch reports, view graphs, or select another view to display. If you have the privilege to manage views, you can also create, edit, and delete them.
This section includes the following topics:
• Getting Started with Views, page 2-1
• Managing Report-Based Views, page 2-3
• Managing Graph-Based Views, page 2-5
• Working with Views, page 2-11
Getting Started with ViewsViews enable you to organize displays that present only the reports and graphs that you want to see. You can use different views to help you perform particular tasks, such as:
• Assess the overall status and level of voice service delivered to users.
• Determine which gateways, trunks, Cisco Unified Communications Managers, and Unified Communications Manager Express systems are the most heavily utilized.
• Identify misuse and exceptions in your phone system.
Access to views is controlled and configured through the SSM Administration Console, where user roles are defined. Your user role determines which views you can access and whether you can manage views (adding, editing, and deleting them). For more information, see Using the SSM Administration Console, page 6-1.
Each user has a home view that appears on the Views tab at login and each time the Views tab is selected. By default, your home view is based on your user role; however, you can select your own home view from those that are accessible to you. For more information, see Selecting Your Home View, page 7-2.
You can also select one view, called a Dashboard View, to be displayed at the top of the Reports tab. To select this view, see Selecting Your Dashboard View, page 7-1.
2-1Guide for Cisco Unified Service Statistics Manager

Chapter 2 Using ViewsGetting Started with Views
Table 2-1 lists default views that Service Statistics Manager provides.
Table 2-1 User Role Access to Default Views and the Reports in Each Default View
Default Views and User Role Access Reports Included in the View
Capacity Planner User Role
Capacity Planner Home
Note This is the default home view for the Capacity Planner user role.
Top 5 Gateways by Utilization—Monthly
Top 5 Trunks by Utilization—Monthly
Utilization Gateway Utilization—Daily
Gateway Utilization—Weekly
Gateway Utilization—Monthly
Trunk Utilization—Daily
Trunk Utilization—Weekly
Trunk Utilization—Monthly
Executive User Role
Call Duration Average Call Duration Across Clusters—Monthly
Call Duration Across Clusters—Monthly
Call Volume Call Volume Across Clusters—Monthly
Call Volume Over Time Across Clusters—Weekly
Call Traffic and Duration Across Clusters—Daily
Call Volume Across Clusters by Location—Monthly
Executive Home
Note This is the default home view for the Executive user role.
Call Volume Across Clusters—Monthly
Service Availability Across Clusters—Weekly
Service Quality Distribution Across Clusters—Monthly
Service Availability Call Completion Rate Across Clusters—Monthly
Service Availability Across Clusters—Weekly
Top 5 Service Availability Across Clusters by Time—Monthly
Service Quality Distribution of Service Quality Across Clusters by Time—Monthly
Percentage Distribution of Service Quality Across Clusters by Time—Weekly
Service Quality Distribution Across Clusters—Monthly
Service Quality Percentage Distribution Across Clusters—Monthly
2-2User Guide for Cisco Unified Service Statistics Manager
OL-20784-01

Chapter 2 Using ViewsManaging Report-Based Views
If you have the privilege to manage views, you can manage both report-based views and graph-based views. (See Managing Report-Based Views, page 2-3 and Managing Graph-Based Views, page 2-5.)
If you cannot manage views, you can still launch them, viewing the reports and graphs that they contain; for more information, see these topics:
• Working with Views, page 2-11
• Working with Graph-Based Views, page 2-11
Managing Report-Based Views
Note If you have the privilege to manage views, you can manage both graph-based and report-based views. For more information, see Managing Graph-Based Views, page 2-5.
This section contains the following topics:
• Creating a Report-Based View, page 2-4
• Changing the Order of Reports in a Report-Based View, page 2-4
Operations User Role
Call Analysis Call Completion Rate Across Clusters—Monthly
Call Failure Summary—Daily
Distribution of Service Quality Across Clusters by Time—Monthly
Percentage Distribution of Service Quality Across Clusters by Time—Weekly
Service Quality Distribution Across Clusters—Monthly
Service Quality Percentage Distribution Across Clusters—Monthly
Operations Home
Note This is the default home view for the Operations user role.
Call Completion Rate Across Clusters—Monthly
Call Service Quality Summary—Weekly
Traffic Summary—Hour of Day
Traffic Summary—Day of Week
Traffic Summary—Day of Month
Trunk Traffic Over Time
Performance Detailed Performance—Daily
Top N Top N Calls Based on Duration
Top N Dialed Numbers Based on Call Count
Top N Dialed Numbers Based on Call Duration
Top N Users
Table 2-1 User Role Access to Default Views and the Reports in Each Default View (continued)
Default Views and User Role Access Reports Included in the View
2-3User Guide for Cisco Unified Service Statistics Manager
OL-20784-01

Chapter 2 Using ViewsManaging Report-Based Views
• Editing a Report-Based View, page 2-5
• Deleting a Report-Based View, page 2-5
Creating a Report-Based View
Note If you have the privilege to manage views, then you have unrestricted access to view reports, add them to views, and delete them from views, irrespective of your access to the reports.
Step 1 On the Views tab, click Create.
Step 2 On the Create View page, enter data and make selections for the following:
a. View Title—Enter a unique name.
b. View Type—Select Report based.
c. Layout Type—Select the number of columns to display.
Step 3 Click Add Reports. The reports page appears.
Step 4 On the Reports page:
a. Select individual check boxes in the Select column, or select the Select All check box. (Optionally, use the filters to retrieve the reports as required.)
b. Click Add to View. The Create View page appears, displaying the selected reports.
Step 5 (Optional) After you select reports, you can:
• Change the order in which the reports will be displayed by clicking Order. See Changing the Order of Reports in a Report-Based View, page 2-4.
• Delete reports from the view by selecting the check box in the Delete column and clicking Delete Selected. A confirmation window appears; click OK.
Step 6 Click Finish.
Note If reports are not generated by default, they are generated when they are added to views.
Changing the Order of Reports in a Report-Based ViewYou can modify the order of your reports so that the most important ones are at the top of the list and, consequently, displayed toward the top of the view. Perform this procedure from the Create View or Edit View page. (See Creating a Report-Based View, page 2-4 or Editing a Report-Based View, page 2-5.)
Step 1 Click Order. The Order reports in the view—View Name page is displayed.
Step 2 Highlight a report and use the arrow buttons to move it up or down.
Step 3 Click Apply to return to the previous page.
2-4User Guide for Cisco Unified Service Statistics Manager
OL-20784-01

Chapter 2 Using ViewsManaging Graph-Based Views
Editing a Report-Based View
Step 1 On the Views tab, select a view from the list.
Step 2 Click Edit. The Edit View page appears.
Step 3 Do any of the following:
• (Optional) Update the report name.
• Delete reports from the view by selecting the check box in the Delete column and clicking Delete Selected. A confirmation window appears. Click OK.
• Reorder the reports by clicking Order. For more information, see Changing the Order of Reports in a Report-Based View, page 2-4.
• Add reports by clicking Add Reports. The Reports page appears.
Note You will not be able to change the layout type (number of columns).
Step 4 If you are adding reports to the view, do the following on the Reports page:
a. (Optional) Use the filters to retrieve the reports as required.
b. Select individual check boxes in the Select column, or select the Select All check box.
c. Click Add to View. The Create View page appears, displaying the selected reports.
Step 5 Click Finish after making the required changes.
Deleting a Report-Based View
Step 1 On the Views, tab, select a view from the list.
Step 2 Click Delete View. A confirmation window appears.
Step 3 Click OK. A confirmation message is displayed on the Views tab.
Managing Graph-Based Views
Note If you have the privilege to manage views, you can manage both graph-based and report-based views. For more information, see Managing Report-Based Views, page 2-3.
A graph-based view includes one or more custom graphs that you define while adding or editing a graph-based view. The following sections are included:
• Creating a Graph-Based View, page 2-6
• Understanding the Attribute Selection and Graph Options Page, page 2-7
• Editing a Graph-Based View, page 2-7
2-5User Guide for Cisco Unified Service Statistics Manager
OL-20784-01

Chapter 2 Using ViewsManaging Graph-Based Views
• Editing a Graph in a Graph-Based View, page 2-9
• Deleting a Graph from a Graph-Based View, page 2-10
• Deleting a Graph-Based View, page 2-10
• Changing the Order of Graphs in a Graph-Based View, page 2-10
Creating a Graph-Based View
Step 1 On the Views tab, click Create.
Step 2 On the Create View page, enter data and make selections for the following:
a. View Title—Enter a unique name.
b. View Type—Select Graph based.
c. Layout Type—Select the number of columns to display.
d. Update Frequency—Select Daily, Hourly, or Manually.
Step 3 Click Add Graph. A Custom Graphs page is displayed.
Step 4 Create the graph:
a. Select one graph type: Line, Area, X-Y, or Top N.
b. (Optional) Select one group.
c. Select one or more monitor types.
d. Click Next. Monitored elements are displayed in list boxes at the bottom of the page in a new, scrollable pane. There is one list box for each monitor type that you selected.
Note A monitored element is a device for which a monitor exists (of the selected monitor type). For more information, see Devices and Associated Monitor Types, page A-1.
e. Select one or more monitored elements from each list box, scrolling down until you reach the Apply button.
f. Click Apply. A page appears that displays attributes and additional options that you must specify to complete the graph definition.
Step 5 Select attributes and complete the graph definition:
a. Select attributes for each monitored element, up to the maximum number specified at the top of each attribute list. (Of the attributes you select, there is a limit of two units of measure.) For more information, see Understanding the Attribute Selection and Graph Options Page, page 2-7.
b. If you selected one attribute only for an element, you can also select one or more indicators to display the minimum, maximum, and average values for the period. For each indicator that you select, a line is displayed on the graph.
c. Select a schedule. Only data collected during the time periods included on the schedule will be included in the graph.
d. Select one of these Graph Options:
– Show All Attributes on a Single Graph
– Show Each Monitor Element on a Separate Graph
2-6User Guide for Cisco Unified Service Statistics Manager
OL-20784-01

Chapter 2 Using ViewsManaging Graph-Based Views
– Show Each Attribute on a Separate Graph
e. Select Graph Duration—Select up to 3 months of data to include in the graph.
f. Enter a name for the graph.
g. Click Add to View. The system updates the view details and returns to the Create page. Repeat the procedure to add more graphs to the view.
You can arrange the graphs to be displayed in a particular order. See Changing the Order of Graphs in a Graph-Based View, page 2-10. You can also delete a graph from the view. See Deleting a Graph from a Graph-Based View, page 2-10.
Step 6 Click Finish to save the view. The new view is available in the View list on the Views tab. After you select the view, the graphs are displayed as thumbnails on the Views page.
Understanding the Attribute Selection and Graph Options PageWhen you create or edit a graph-based view, after you select the monitor types and the monitored elements, you must select the attributes to be graphed for each monitored element. For each monitored element that you selected, the page presented to you displays the following:
• A numbered heading—Identifies the monitored element; that is, the device. The number provides a running count of the monitored elements that you selected.
• A table with more device-specific information—Displays the IP address or DNS name and the name of the SSM agent that coordinates the monitoring of this device for the particular type of information, in addition to other details.
• A table of attributes—Lists the attributes (statistics and information) for the device. The table heading displays the maximum number of attributes that you can select and the maximum number of units of measure.
Toward the bottom of the page, under the area in which the information for each monitored element is presented, you can select a schedule, select graph options, and provide the name and duration for the graph.
Editing a Graph-Based ViewTo change the attributes to plot in a graph in a view, or to change the name or duration of such a graph, see Editing a Graph in a Graph-Based View, page 2-9.
To change view properties, and to add, delete, and order graphs in a view, use this procedure.
Step 1 From the Views tab, select a graph-based view and click Edit. The Edit Views page appears, displaying a table that lists the graphs that are included in the view.
Step 2 You can change any of these:
• View Title—Enter a title.
• Layout Type—Select 1, 2, or 4 columns.
• Update Frequency—Select Daily, Hourly, or Manually.
• Graphs in View:
2-7User Guide for Cisco Unified Service Statistics Manager
OL-20784-01

Chapter 2 Using ViewsManaging Graph-Based Views
To delete graphs from the view, select them and click Delete Selected. A confirmation window is displayed. Click Close.
To change the order in which the graphs are displayed, click Order. For more information, see Changing the Order of Graphs in a Graph-Based View, page 2-10.
To add graphs to the view, complete Step 3 and Step 4.
If you are done making changes, continue to Step 5.
Step 3 To add a graph to the view, click Add Graph. A Custom Graphs page is displayed.
a. Select one graph type: Line, Area, X-Y, or Top N.
b. (Optional) Select one group.
c. Select one or more monitor types.
d. Click Next. Monitored elements are displayed in list boxes at the bottom of the page in a new, scrollable pane. There is one list box for each monitor type that you selected.
Note A monitored element is a device for which a monitor exists (of the selected monitor type). For more information, see Devices and Associated Monitor Types, page A-1.
e. Select one or more monitored elements from each list box, scrolling down until you reach the Apply button.
f. Click Apply. A page appears that displays attributes and additional options that you must specify to complete the graph definition.
Step 4 Select attributes and complete the graph definition:
a. Select attributes for each monitored element that you selected, up to the maximum number specified at the top of each attribute list. (Of the attributes you select, there is a limit of two units of measure.) For more information, see Understanding the Attribute Selection and Graph Options Page, page 2-7.
b. If you are editing a line graph and selected only one attribute, you can select one or more indicators (lines) that show the minimum, maximum, and average value for the period.
c. Select a schedule. Only data collected during the time periods included on the schedule will be included in the graph.
d. Select one of these Graph Options:
– Show All Attributes on a Single Graph
– Show Each Monitor Element on a Separate Graph
– Show Each Attribute on a Separate Graph
e. Select Graph Duration—Select up to 3 months of data to include in the graph.
f. Enter a name for the graph.
g. Click Add to View. The system updates the view details and returns to the Edit View page.
Step 5 Click Finish.
2-8User Guide for Cisco Unified Service Statistics Manager
OL-20784-01

Chapter 2 Using ViewsManaging Graph-Based Views
Editing a Graph in a Graph-Based ViewTo update view properties and to change the order in which graphs are displayed, see Editing a Graph-Based View, page 2-7.
To select different or additional attributes to plot in a particular graph, or to change the graph name or duration, use this procedure.
Step 1 From the Views tab, select a graph-based view and click Edit. The Edit Views page appears, displaying the list of graphs that are included in a table.
Step 2 Click the Edit link for the graph. A Custom Graph page displays the graph in a three-tabbed pane.
Note If multiple graphs are defined, you can edit one or more of them, scrolling down until you find the graph that you want to edit.
Step 3 Select the Attributes tab for the graph and select different or additional attributes. The heading above the list displays the maximum number of attributes that you can select and the maximum number of units of measure.
If you are editing a line graph and have selected only one attribute, you can select one or more indicators to introduce lines that show the minimum, maximum, and average value for the period.
Note Optionally, you can make additional changes, using the icons to the right of the graph. For more information, see Table 4-1, Additional Options on the Graph Tab.
Step 4 After you complete all changes, click Generate Graph.
Step 5 Click Update in View. The Update in View window opens:
a. (Optional) Update the Graph Name and Graph Duration fields.
b. Click Update in View. Service Statistics Manager confirms successful update.
c. Click OK. Service Statistics Manager returns to the Custom Graphs page. The view is updated.
To see the result, select the Views tab and select the view.
Alternatively, you can edit a graph-based view using this procedure.
Step 1 From the Views tab, select a graph-based view. The view is displayed.
Step 2 Click a graph thumbnail. A Custom Graph page displays the graph in a three-tabbed pane.
Note If multiple graphs are defined, you can edit one or more of them, scrolling down until you find the graph that you want to edit.
Step 3 Select the Attributes tab for the graph and select different or additional attributes. The heading above the list displays the maximum number of attributes that you can select and the maximum number of units of measure.
2-9User Guide for Cisco Unified Service Statistics Manager
OL-20784-01

Chapter 2 Using ViewsManaging Graph-Based Views
Note Optionally, you can make additional changes, using the icons to the right of the graph. For more information, see Table 4-1, Additional Options on the Graph Tab.
Step 4 After you complete all changes, click Generate Graph.
Step 5 Click Update in View. The Update in View window opens:
a. (Optional) Update data in the Graph Name and Graph Duration fields.
b. Click Update in View. Service Statistics Manager confirms successful update.
c. Click OK. Service Statistics Manager returns to the Custom Graphs page. The view is updated.
To see the result, select the Views tab and select the view.
Deleting a Graph from a Graph-Based View
Step 1 From the Views tab, select the view from the View list. The view is displayed.
Step 2 Click the Edit button. Graphs in the view are listed in a table in the lower portion of the window.
Step 3 In the table, select the Delete check box corresponding to the graph.
Step 4 Click Delete Selected. A confirmation message is displayed.
Step 5 Click OK.
Deleting a Graph-Based View
Step 1 On the Views tab, select the view from the View list. The view is displayed.
Step 2 Click Delete View. A confirmation window appears.
Step 3 Click OK. A confirmation message is displayed on the Views tab.
Changing the Order of Graphs in a Graph-Based ViewYou can modify the order of your graphs so that the most important ones are at the top of the list and, consequently, displayed toward the top of the view. Perform this procedure from the Create View or Edit View page. (See Creating a Graph-Based View, page 2-6 or Editing a Graph-Based View, page 2-7.)
Step 1 Click Order. The Order graphs in the view—View Name page is displayed.
Step 2 Highlight a graph and use the arrow buttons to move it up or down.
Step 3 Click Apply to return to the previous page.
2-10User Guide for Cisco Unified Service Statistics Manager
OL-20784-01

Chapter 2 Using ViewsWorking with Views
Working with ViewsA view is a named collection of reports or custom graphs. Views provide rapid access to information, in an easy-to-interpret, concise manner. From a view, you can drill down into the data to gain insight to specific areas.
On the Views tab, select one view at a time from the View list. A thumbnail graph is displayed for each report or custom graph that is included in the view. Thumbnails provide a high-level picture of each report or graph in the view. A thumbnail is displayed with Y-axis labels and without gridlines. (Gridlines appear only on full-size graphs that have a single Y-axis.)
Click a thumbnail or the link under it to open a window that displays more details and to continue to drill down to successively lower levels of underlying details.
Note Due to the graphing tick policy, sometimes thumbnails might show 120% as the Y-axis maximum value (because the multiplication factor is 40), but the actual graph or report might show 100% as the maximum Y-axis value.
If data for the entire report or graph period is not yet available, the report or graph is not yet generate. In this case, an inverted triangle thumbnail (see Figure 2-1) is displayed as a placeholder.
Figure 2-1 Inverted Triangle Thumbnail
An inverted triangle is replaced with another thumbnail after the necessary data has been obtained. If you click an inverted triangle thumbnail in a report-based view, the inverted triangle appears on the report page; you might also see additional information, such as the elements names for which data is being collected in the report description table.
Views are either of the following:
• Report-based—Report-based views include graphs or tables or both for the monitor types, attributes, and monitors selected in the report definition. Service Statistics Manager defines many default reports; see Default Reports, page 3-3 and Using the Report Icons in the Title Bar, page 3-13. To define additional reports, see Managing Reports, page 3-29.
• Graph-based—Graph-based views include custom graphs. The monitors and attributes included on these graphs are selected when defining the custom graph. See Managing Graph-Based Views, page 2-5 and Using Custom Graphs, page 4-1. If you have defined multiple graphs, MG is displayed to the left of the graph name.
Working with Graph-Based ViewsA graph is labeled according to the monitored attributes, elements, and time period that the graph covers. Service Statistics Manager provides different graph format options: line, area, X-Y, and Top N. For more information, see Creating Custom Graphs, page 4-1.
2-11User Guide for Cisco Unified Service Statistics Manager
OL-20784-01

Chapter 2 Using ViewsWorking with Views
You can interact with the graph by selecting different attributes and time periods; see Understanding and Interacting with Custom Graphs, page 4-8. You can also update the graphs in the view or create a new view from the Custom Graph window; see the following:
• Adding a Multiple-Graph (MG) Display to a View, page 4-10
• Adding a Specific Graph to a View, page 4-13
To determine when a graph was last updated, open the graph by clicking a thumbnail or the link below it on the Views tab. At the lower-left corner of the graph tab, check the Graph Generated on date (to the left of the Legend link). To update graphs in a view, see Manually Updating Graph-Based Views, page 2-12.
Manually Updating Graph-Based ViewsDepending on the update frequency that you defined for a graph-based view, all graphs in the view are updated hourly, daily, or manually. On the Views tab, thumbnails display data from the last hourly, daily, or manual update, and, accordingly, might not always represent the most current data.
To update a single graph—or one multiple graph (labeled MG)—use this procedure.
Step 1 Select Views and select the graph-based view.
Step 2 Open the graph or graphs by clicking the thumbnail or the link under it. A Custom Graph page appears displaying one or more graphs.
Step 3 Click Generate Graph. Updated graphs are displayed; the Graph Generated on date is also updated. From the Custom Graph page, you can display additional information; see Understanding and Interacting with Custom Graphs, page 4-8.
To manually update all graphs in a graph-based view, do this.
Step 1 Select Views and select a graph-based view.
Step 2 Click Update. A message appears explaining that updating the view could be time-consuming.
Step 3 Click OK. All graphs in the view are updated.
Step 4 Click a thumbnail or the link below it to view an updated graph.
2-12User Guide for Cisco Unified Service Statistics Manager
OL-20784-01

User OL-20784-01
C H A P T E R 3
Using Reports• Getting Started with Reports, page 3-1
• Understanding and Using Reports, page 3-13
• Managing Reports, page 3-29
Getting Started with ReportsFrom the Reports tab, you can launch any report that has already been generated, by clicking the hyperlinked report name. Reports are generated once daily.
The Reports tab lists all reports, including:
• Default reports—Include all applicable elements. For more information, see Default Reports, page 3-3.
• Default reports generated for a specific group of elements only—Include only elements that belong to the group; they are available if a user in the Administrator role has done both of the following:
– Created a group.
– Enabled automatic report generation for the group.
For more information, see Managing Groups, page 6-3.
• Reports that you have created and reports that others have created (if they have chosen to share)—Include elements selected in the report definition. For more information, see Managing Reports, page 3-29.
For information about the data on which reports are based, see Understanding Data Rollup and Data Retention, page 3-12.
Understanding the Reports TabThe Reports tab lists all reports defined in Service Statistics Manager and provide links to launch any reports that have been generated.
3-1Guide for Cisco Unified Service Statistics Manager

Chapter 3 Using ReportsGetting Started with Reports
Note Reports are not generated until enough time has passed to process data for the time period encompassed in the report (daily, weekly, or monthly). A report is generated when data for a full day, week, or month has been collected. Optionally, a user with the privilege to manage reports can edit the report and select Generate report immediately; however, this is not a suggested practice.
The Reports tab has up to three distinct portions:
• Dashboard View—(Optional) Thumbnails and links to reports that are included in the view. You can configure a dashboard view using the Administration tab.
• Filter area—Located above the report table. To find a report more quickly or to display only a certain type of report, fill in any of the fields above the report table and click Filter. The report table is displayed again with only reports that match the filter.
Note Create, Edit, and Delete buttons are also displayed above the report table if you have the privilege to manage reports.
• Report table—By default, all available reports are displayed. However, the actual display changes based on the filters that you apply. Report details are displayed under the following columns:
– Report Title—Name of the report; if the report has been generated, click the link to view it.
– Report Type—Report type on which the report is based; for a list of report types, see Table 3-6.
– Frequency—Frequency at which the report is generated: daily, weekly, or monthly.
– Category—General or SLA.
Note SLA reports are available only if you have a Premium license.
– Schedule—The period for which data is considered for inclusion in the report. One of the following:
No Filter—No schedule was selected for the report. Data from all time periods is included for this report.
A schedule name—Service Statistics Manager provides default schedules 24x7 and Business Hours. (You can create additional schedules; for more information, see Defining Schedules, page 5-16.)
24x7—Includes data collected throughout the day for the entire week (including Saturday and Sunday).
Business Hours—Includes data collected daily, Monday through Friday, from 8:00 a.m. to 5:00 p.m.
Mixed—Displayed for an SLA-based report; each SLA included in the report can have a different schedule.
Hyphen (-)—Displayed if the schedule is not applicable.
– Owner—Username of the report owner (user who created the report).
For more information, see the following topics:
• Default Reports, page 3-3
• Understanding Data Rollup and Data Retention, page 3-12
3-2User Guide for Cisco Unified Service Statistics Manager
OL-20784-01

Chapter 3 Using ReportsGetting Started with Reports
Default Reports
Note If you deleted a default report and would like to recreate it, see Default Report Definitions, page B-1.
Table 3-2 lists and describes all default reports. Many report names include Daily, Weekly, or Monthly, which indicate the frequency with which the report is generated and the duration of data included in the report. (See Table 3-1.) For report type descriptions, see Table 3-6.
Table 3-1 Daily, Weekly, and Monthly Reports
A Report that is Labeled... Is Generated...
And Includes Data for the Previous...
And Initially Presents Data Incremented by the...
Daily Once a day 1 day Hour
Weekly Once a week 7 days Day
Note Drill down to view data over shorter time increments.
Monthly Once a month 30 days
Table 3-2 Default Reports by Report Type
Name Description Subreports Included
Call Failure Summary
Call Failure Summary—Daily For all phones, aggregates the calls that ended due to each cause code that is considered as failure. For more information, see Using a Call Failure Summary Report, page 3-17.
Call Failure Summary
Call Quality Summary
Call Service Quality Summary—Weekly
For all phones and all call categories, aggregates calls by quality of service.
Table includes:
• Quality of Service (Good, Fair, Acceptable, Poor)
• No. of Calls
• Percentage of Calls
• Duration (hh:mm:ss)
See Call Quality Monitor Type Attributes, page A-3.
Call Service Quality Summary
Group Aggregation
Call Volume Across Clusters by Location—Monthly1
For all groups, aggregates attributes by cluster. For attributes included, see Call Volume Across Clusters—Monthly in this table under Instance Aggregation.
Note No data is available for this report until at least one group of call volume monitors is defined. (Groups are completely user-defined. See Managing Groups, page 6-3.)
Call Volume by Location
3-3User Guide for Cisco Unified Service Statistics Manager
OL-20784-01

Chapter 3 Using ReportsGetting Started with Reports
Instance Aggregation
Average Call Duration Across Clusters—Monthly
For each cluster, aggregates these attributes:
• Voicemail–Average Duration (sec)
• International–Average Duration (sec)
• Emergency–Average Duration (sec)
• Long distance–Average Duration (sec)
• Local–Average Duration (sec)
See Call Volume Monitor Type Attributes, page A-5.
Average Call Duration Across Clusters
Average Call Duration vs. Volume Across Clusters—Monthly
For each cluster, aggregates average call duration in seconds and volume (number of calls). For attributes included, see:
• Average Call Duration Across Clusters
• Call Volume Across Clusters—Monthly
• Call Duration Across Clusters
• Call Volume Across Clusters
Average Duration of Calls Across Clusters—Monthly
For each cluster, aggregates the All Categories–Average Duration (sec) attribute.
See Call Volume Monitor Type Attributes, page A-5.
Average Duration of Calls Across Clusters
Call Completion Rate Across Clusters—Monthly
For each cluster, aggregates these attributes:
• All Categories–Number of Completed Calls (#)
• All Categories–Number of Failed Calls (#)
See Call Volume Monitor Type Attributes, page A-5.
Call Completion Rate Across Clusters
Call Duration Across Clusters—Monthly
For all clusters, aggregates these attributes:
• Voicemail–Duration of Calls (sec)
• International–Duration of Calls (sec)
• Emergency–Duration of Calls (sec)
• Long distance–Duration of Calls (sec)
• Local–Duration of Calls (sec)
See Call Volume Monitor Type Attributes, page A-5.
Call Duration Across Clusters
Call Traffic and Duration Across Clusters
Note This is a daily report.
For all phones, aggregated by cluster, includes two 3-dimensional graphs:
• Call traffic—Aggregates these attributes:
– All Categories–Number of Calls (#)
• Call duration—Aggregates these attributes:
– All Categories–Duration of Calls (sec)
– All Categories–Average Duration (sec)
See Call Volume Monitor Type Attributes, page A-5.
• Call Traffic (for All Elements)
• Call Duration (for All Elements)
Table 3-2 Default Reports by Report Type (continued)
Name Description Subreports Included
3-4User Guide for Cisco Unified Service Statistics Manager
OL-20784-01

Chapter 3 Using ReportsGetting Started with Reports
Call Volume Across Clusters—Monthly
For each cluster, aggregates these attributes:
• Voicemail–Number of Calls (#)
• International–Number of Calls (#)
• Emergency–Number of Calls (#)
• Long distance–Number of Calls (#)
• Local–Number of Calls (#)
See Call Volume Monitor Type Attributes, page A-5.
Call Volume Across Clusters
Detailed Performance—Daily For all Unified Communications Managers, aggregates data and displays day-by-day values in six subreports. For attributes included, see Unified CM Performance Monitor Type Attributes, page A-15.
• Unified CM Performance (for All Elements)
• Unified CM Utilization Performance (for All Elements)
• Unified CM Ports Active (for All Elements)
• Unified CM Channels Active (for All Elements)
• Unified CM CTI Performance (for All Elements)
• Unified CM Calls Attempted (for All Elements)
Failed Calls Across Clusters—Monthly
For all clusters, aggregates these attributes:
• All Categories–Number of Completed Calls (#)
• All Categories–Number of Failed Calls (#)
See Call Volume Monitor Type Attributes, page A-5.
Failed Calls Across Clusters
IPSLA Test Statistics
Note This is a monthly report.
For all devices on which node-to-node tests (defined in Operations Manager) run, aggregates data for the supported test type.
See Node-to-Node Test File-Based Monitor Types and Attributes, page A-16.
• IPSLA Data Jitter Statistics
• IPSLA Ping Echo Statistics
• IPSLA Ping Path Echo Statistics
• IPSLA UDP Echo Statistics
• IPSLA Gatekeeper Reg Delay Statistics
Table 3-2 Default Reports by Report Type (continued)
Name Description Subreports Included
3-5User Guide for Cisco Unified Service Statistics Manager
OL-20784-01

Chapter 3 Using ReportsGetting Started with Reports
Service Availability Across Clusters—Weekly
For all clusters, aggregates All Call Categories: Number of Completed Calls (#).
See Call Volume Monitor Type Attributes, page A-5.
Service Availability Across Clusters
Service Quality Distribution Across Clusters—Monthly
For all clusters, aggregates these attributes:
• Number of Good Calls (#)
• Number of Fair Calls (#)
• Number of Poor Calls (#)
• Number of Acceptable Calls (#)
See Call Quality Monitor Type Attributes, page A-3.
Service Quality Distribution Across Clusters
Service Quality Distribution Across NAMs—Monthly
For all NAMs, aggregates these attributes:
• Number of Good Call Streams (#)
• Number of Fair Call Streams (#)
• Number of Poor Call Streams (#)
• Number of Acceptable Call Streams (#)
See Call Quality by NAM Monitor Type Attributes, page A-4.
Service Quality Distribution Across NAMs
Service Quality Distribution Across Sensors—Monthly
For all Cisco 1040 Sensors, aggregates these attributes:
• Number of Good Call Streams (#)
• Number of Fair Call Streams (#)
• Number of Poor Call Streams (#)
• Number of Acceptable Call Streams (#)
See Call Quality by NAM Monitor Type Attributes, page A-4.
Note Service Monitor supports these sensors: Cisco 1040s and NAMs. For the corresponding default report for NAMs, see Service Quality Distribution Across NAMs, page 3-6.
Service Quality Distribution Across Sensors
Service Quality Percentage Distribution Across Clusters—Monthly
For all clusters, displays these attributes as a percentage
• Number of Good Calls (#)
• Number of Fair Calls (#)
• Number of Poor Calls (#)
• Number of Acceptable Calls (#)
See Call Quality Monitor Type Attributes, page A-3.
Service Quality Percentage Distribution Across Clusters
Table 3-2 Default Reports by Report Type (continued)
Name Description Subreports Included
3-6User Guide for Cisco Unified Service Statistics Manager
OL-20784-01

Chapter 3 Using ReportsGetting Started with Reports
Service Quality Percentage Distribution Across NAMs—Monthly
For all NAMs, displays these attributes as a percentage:
• Number of Good Call Streams (#)
• Number of Fair Call Streams (#)
• Number of Poor Call Streams (#)
• Number of Acceptable Call Streams (#)
See Call Quality by NAM Monitor Type Attributes, page A-4.
Service Quality Percentage Distribution Across NAMs
Service Quality Percentage Distribution Across Sensors—Monthly
For all Cisco 1040 Sensors, displays these attributes as a percentage:
• Number of Good Call Streams (#)
• Number of Fair Call Streams (#)
• Number of Poor Call Streams (#)
• Number of Acceptable Call Streams (#)
See Call Quality by NAM Monitor Type Attributes, page A-4.
Note For the corresponding default report for NAMs, see Service Quality Percentage Distribution Across NAMs—Monthly, page 3-7.
Service Quality Percentage Distribution Across Sensors
Total Duration Across Clusters—Monthly
For all clusters, aggregates All Categories—Duration (sec). See Call Volume Monitor Type Attributes, page A-5.
Total Duration Across Clusters
Time Aggregation
• CME Performance—Daily
• CME Performance— Monthly
• CME Performance— Weekly
For all instances of Cisco Unified Communications Manager Express, aggregates these attributes:
• Registered Ephones (#)
• Ephones Registered (%)
• Registered Key Ephones (#)
• Key Ephones Registered (%)
See CME Performance Monitor Type Attributes, page A-10.
CME Performance Aggregated Across All Elements
• CUE Performance—Daily
• CUE Performance— Monthly
• CUE Performance— Weekly
For all instances of Cisco Unity Express, aggregates these attributes:
• Allocated Capacity (min)
• Capacity of Voicemail (min)
• Free Capacity (min)
• Orphaned Mailboxes (%)
• Storage Capacity Utilization (%)
See CUE Performance Monitor Type Attributes, page A-10.
CUE Performance Aggregated Across All Elements
Call Volume Over Time Across Clusters—Weekly
For attributes included, see Call Volume Across Clusters—Monthly in this table under Instance Aggregation.
Call Volume Over Time Across Clusters
Table 3-2 Default Reports by Report Type (continued)
Name Description Subreports Included
3-7User Guide for Cisco Unified Service Statistics Manager
OL-20784-01

Chapter 3 Using ReportsGetting Started with Reports
Call Volume Report on H.323 Gateways—Daily
For all H.323 gateways, aggregates these attributes:
• H.323 Gateway—Inbound Calls (#)
• H.323 Gateway—Outbound Calls (#)
• H.323 Gateway—Tandem Calls (#)
• See Call Volume Monitor Type Attributes, page A-5.
Call Volume Report on H.323 Gateways
Distribution of Service Quality Across Clusters by Time—Monthly
For all clusters, aggregates these attributes:
• Number of Good Calls (#)
• Number of Fair Calls (#)
• Number of Acceptable Calls (#)
• Number of Poor Calls (#)
See Call Quality Monitor Type Attributes, page A-3.
Distribution of Service Quality (Aggregated Across All Elements)
Distribution of Service Quality Across NAMs by Time—Monthly
For all NAMs, aggregates these attributes:
• Number of Good Call Streams (#)
• Number of Fair Call Streams (#)
• Number of Acceptable Call Streams (#)
• Number of Poor Call Streams (#)
See Call Quality by NAM Monitor Type Attributes, page A-4.
Distribution of Service Quality (Aggregated Across All Elements)
Distribution of Service Quality Across Sensors by Time—Monthly
For all Cisco 1040 Sensors, aggregates these attributes:
• Number of Good Call Streams (#)
• Number of Fair Call Streams (#)
• Number of Acceptable Call Streams (#)
• Number of Poor Call Streams (#)
See Call Quality by NAM Monitor Type Attributes, page A-4.
Note For the corresponding default report for NAMs, see Distribution of Service Quality Across NAMs by Time—Monthly, page 3-8.
Distribution of Service Quality (Aggregated Across All Elements)
• Gatekeeper Performance—Daily
• Gatekeeper Performance— Weekly
• Gatekeeper Performance— Monthly
For all gatekeepers, aggregates these attributes:
• Local Zone Bandwidth (%)
• Interzone Bandwidth (%)
• Admission Confirmations for Local Zone (#)
• Admission Rejections for Local Zone (#)
See Gatekeeper Performance Monitor Type Attributes, page A-11.
Gatekeeper Performance (Aggregated Across All Elements)
Table 3-2 Default Reports by Report Type (continued)
Name Description Subreports Included
3-8User Guide for Cisco Unified Service Statistics Manager
OL-20784-01

Chapter 3 Using ReportsGetting Started with Reports
• Gateway Utilization—Daily
• Gateway Utilization—Monthly
• Gateway Utilization—Weekly
For all gateways, aggregates these attributes:
• BRI Utilization (%)
• E&M Utilization (%)
• E1 CAS Utilization (%)
• E1 PRI Utilization (%)
• FXO Utilization (%)
• FXS Utilization (%)
• T1 CAS UtilizatIon (%)
• T1 CAS Utilization (%)
See Gateway Utilization Monitor Type Attributes, page A-11.
Gateway Utilization (Aggregated Across All Elements)
Percentage Distribution of Service Quality Across Clusters by Time—Weekly
For each cluster, aggregates these attributes by day, displaying them as a percentage:
• Number of Good Calls (#)
• Number of Fair Calls (#)
• Number of Poor Calls (#)
• Number of Acceptable Calls (#)
See Call Quality Monitor Type Attributes, page A-3.
Percentage Distribution of Service Quality Across Clusters by Time
Percentage Distribution of Service Quality Across NAMs by Time—Weekly
For each NAM aggregates these attributes by day, displaying them as a percentage:
• Number of Good Call Streams (#)
• Number of Fair Call Streams (#)
• Number of Poor Call Streams (#)
• Number of Acceptable Call Streams (#)
See Call Quality by NAM Monitor Type Attributes, page A-4.
Percentage Distribution of Service Quality Across NAMs by Time
Percentage Distribution of Service Quality Across Sensors by Time—Weekly
For each Cisco 1040 Sensor, aggregates these attributes by day, displaying them as a percentage:
• Number of Good Call Streams (#)
• Number of Fair Call Streams (#)
• Number of Poor Call Streams (#)
• Number of Acceptable Call Streams (#)
See Call Quality by Sensor Monitor Type Attributes, page A-4.
Note For the corresponding default report for NAMs, see Percentage Distribution of Service Quality Across NAMs by Time—Weekly, page 3-9.
Percentage Distribution of Service Quality Across Sensors by Time
Table 3-2 Default Reports by Report Type (continued)
Name Description Subreports Included
3-9User Guide for Cisco Unified Service Statistics Manager
OL-20784-01

Chapter 3 Using ReportsGetting Started with Reports
• System Utilization for IOS Routers—Daily
• System Utilization for IOS Routers—Monthly
• System Utilization for IOS Routers—Weekly
For all Cisco IOS routers, aggregates these attributes:
• Available Memory (MB)
• CPU Utilization (%)
• System Memory Utilization (%)
• Total Memory (MB)
See System Utilization for IOS Router Monitor Type Attributes, page A-12.
System Utilization for IOS Routers (Aggregated Across All Elements)
Trunk Traffic over Time
Note This is a monthly report.
For all voice gateways, aggregates call count (#) on trunks day by day for a month.
See Trunk Utilization Monitor Type Attributes, page A-14.
Trunk Traffic (Aggregated Across All Elements)
• Trunk Utilization—Daily
• Trunk Utilization—Monthly
• Trunk Utilization—Weekly
For all voice gateways, aggregates trunk utilization (%).
See Trunk Utilization Monitor Type Attributes, page A-14.
Trunk Utilization (Aggregated Across All Elements)
• Unified CCE Performance—Daily
• Unified CCE Performance—Monthly
• Unified CCE Performance—Weekly
For all instances of Cisco Unified Contact Center Express, aggregates these attributes:
• Calls in Progress (#)
• Agents Currently Logged In (#)
• Inbound Calls (# per second)
See Unified CCE Performance Monitor Type Attributes, page A-15.
Unified CCE Performance (Aggregated Across All Elements)
Top N Calls
Top N Calls Based on Duration
Note This is a weekly report.
For all phones and from all call categories, displays in a table the five longest calls. (See Using a Top N Calls Report, page 3-24.)
Top N Calls Based on Duration
Top N Dialed Numbers
Top N Dialed Numbers Based on Call Count
Note This is a weekly report.
For all phones and from all call categories, displays in a table the five directory numbers that received the most calls. (See Using a Top N Dialed Numbers Report, page 3-23.)
Top N Dialed Numbers (All Call Categories)
Top N Dialed Numbers Based on Call Duration
Note This is a weekly report.
For all phones and from all call categories, displays in a table the five directory numbers that received the longest calls. (See Using a Top N Dialed Numbers Report, page 3-23.)
Top N Dialed Numbers (All Call Categories)
Table 3-2 Default Reports by Report Type (continued)
Name Description Subreports Included
3-10User Guide for Cisco Unified Service Statistics Manager
OL-20784-01

Chapter 3 Using ReportsGetting Started with Reports
Top N Performers
Top N Gateways by Utilization—Monthly
Reports the five gateways with the highest average of these attributes:
• E1 CAS utilization (%)
• E1 PRI utilization (%)
• T1 CAS utilization (%)
• T1 PRI utilization (%)
Along with highest average, displays highest value for each of the top five gateways.
See Gateway Utilization Monitor Type Attributes, page A-11.
• Top N Gateway Utilization—E1 CAS Utilization
• Top N Gateway Utilization—E1 PRI Utilization
• Top N Gateway Utilization—T1 CAS Utilization
• Top N Gateway Utilization—T1 PRI Utilization
Top N Service Availability Across Clusters by Time—Monthly
Reports the five clusters with the highest average percentage of calls completed. Along with highest averages, displays highest value for each of the top five clusters.
Top N Service Availability—All Categories—Based on Number of Completed Calls
Top N Trunks by Utilization—Monthly
Shows the highest average percent utilization and the highest percent utilization within the past 30 days for five trunks in a bar graph and a table.
Top N Trunk Utilization
Top N Dialed Users
Top N Users
Note This is a weekly report.
For all phones and from all call categories, displays in a table the five directory names that received the longest calls. (See Using a Top N Users Report, page 3-24.)
Top N Users (All Call Categories)
Traffic Summary
• Traffic Summary—Day of Month
• Traffic Summary—Day of Week
• Traffic Summary—Hour of Day
For all phones, shows number of calls in each call category by:
• Day of the month
• Day of the week
• Hour of the day
Note Calls can belong to multiple call categories. Therefore, if you add the total calls reported in each category, your sum can be greater than the reported total.
Traffic Summary
1. For more information, see Understanding Reports That Are Based on Call Volume Data, page 3-12.
Table 3-2 Default Reports by Report Type (continued)
Name Description Subreports Included
3-11User Guide for Cisco Unified Service Statistics Manager
OL-20784-01

Chapter 3 Using ReportsGetting Started with Reports
Understanding Data Rollup and Data RetentionService Statistics Manager collects two types of data:
• Operations Manager file-based data—Monitors collect this data, aggregate it, and deliver it to Service Statistics Manager. Service Statistics Manager aggregates the data and stores it in the database. To optimize database storage and performance, the raw data is rolled up hourly for longer-term storage:
– Multiple data points gathered in an hour are rolled into a single data point. For example, if there are two data points for a monitor in an hour, at the end of each hour, these two data points are rolled up into a single data point.
– Rolled-up data is also known as rate data. All available reports in Service Statistics Manager are based on rate data.
Note You can view raw data for the previous day only; to do so, create a custom graph or a graph in a graph-based view that includes only a single monitor type. See Managing Graph-Based Views, page 2-5 and Creating a Graph for a Single Monitor Type, page 4-6.
For more information about Operations Manager file-based data, see Operations Manager File-Based Monitor Types, page A-9.
• Service Monitor database-based data—Monitors collect this data and deliver it as is to Service Statistics Manager. Service Statistics Manager rolls the data up.
For more information about Service Monitor database-based data, see Service Monitor Database Monitor Types, page A-2.
Table 3-3 lists data retention periods.
For more information, see Understanding Database Purging, page 8-2.
Understanding Reports That Are Based on Call Volume DataCall volume reports display the number of calls in each call category and can also display the total number of calls on which the report is based. A call can be included in more than one call category; for example, an Internal call can also be a Conference call. Therefore, if you add the number of calls in each category, the sum can be greater than the reported total number of calls.
Table 3-3 Data Retention
Type of Data Raw Data Retention Rolled Up Data Retention
Operations Manager file-based 8 days 90 days
Service Monitor database-based:
Cluster-based data 30 days 90 days
Cisco 1040 Sensor-based data 24 hours
NAM-based data
3-12User Guide for Cisco Unified Service Statistics Manager
OL-20784-01

Chapter 3 Using ReportsUnderstanding and Using Reports
Note Service Monitor classifies calls into system-defined and user-configurable call categories. For more information, see User Guide for Cisco Unified Service Monitor 2.3.
Understanding and Using ReportsTo open a report, select Reports and click the hyperlinked report name. For information about specific report types, see Using Specific Types of Reports, page 3-16. These topics explain report features that you can use when viewing any report type:
• Understanding the Report Header, page 3-13
• Using the Report Icons in the Title Bar, page 3-13
• Viewing Subreports, page 3-14
• Viewing Comments, page 3-14
• Obtaining Additional Information from Graphs, Legends, and Drill-Downs, page 3-15
• Adding a Comment to a Report, page 3-15
• Adding a Report to a View, page 3-15
• E-Mailing a Report, page 3-16
Understanding the Report HeaderYou can display the report header or hide it; for more information, see Using the Report Icons in the Title Bar, page 3-13. When displayed, these report details appear at the top or the bottom of the page, depending on the report definition:
• Report Type—The type of report; see Table 3-6.
• Report Period—Dates and duration of the report; for example, 2/14/2008-2/15/2008 (1 day).
• Date Generated—Date; for example, 2/15/2008.
• Group Filter—Either No Filter or the name of the group. For more information, see Managing Groups, page 6-3.
• Author—Username of the user who defined the report; for a default report (defined by Service Statistics Manager), the author is admin.
• Contact—Contact information as specified in the report definition; if there is no contact information, as is the case for default reports, a dash (-) is displayed.
• Report Frequency—Daily, Weekly, or Monthly.
• Schedule—Either No Filter or a schedule name.
Using the Report Icons in the Title BarThe title bar for each report includes a series of icons. Table 3-4 lists the available options.
3-13User Guide for Cisco Unified Service Statistics Manager
OL-20784-01

Chapter 3 Using ReportsUnderstanding and Using Reports
Viewing SubreportsWhen viewing a report, continue to scroll down to see the graph (or table or both) that is displayed for each subreport. For more details, refer to the particular report.
Viewing CommentsComments are displayed at the top or the bottom of the report (as specified in the report definition). Comments that you add while creating or editing a report are displayed in all instances of the report. To add an instance-specific comment, click the Add Comment icon (see Adding a Comment to a Report, page 3-15).
Table 3-4 Report Icons
Icon Name Description
Show Report Header To show report details. For more information, see Understanding the Report Header, page 3-13.
Hide Report Header To hide report details.
Report Instances To select another generated report instance, if available.
Add Comment To add comment to the report. For more information, see Adding a Comment to a Report, page 3-15.
Add to View To add the report to a view. For more information, see Adding a Report to a View, page 3-15.
Generate Report To generate the report immediately.
Note It is not recommended that you do this on a regular basis. Service Statistics Manager generates reports daily.
Edit Report To edit the report. For more information, see Editing a Report, page 3-53.
Note Your user role determines whether you have the privilege to perform this task.
PDF To view the report as a PDF.
CSV To export the report details to a comma-separated value file.
Mail This Page To mail the report. For more information, see E-Mailing a Report, page 3-16.
3-14User Guide for Cisco Unified Service Statistics Manager
OL-20784-01

Chapter 3 Using ReportsUnderstanding and Using Reports
Obtaining Additional Information from Graphs, Legends, and Drill-DownsIn many reports, you can successively drill down to get more information about the element instances for which data is included in the aggregated information. To do so, you can:
• Click links in the table (if a table is present in the report).
• Hover your mouse over points, bars, or pie wedges in the graph (if a graph is present in the report).
• Click the graphs. If drill-downs are defined, you will be presented with a Drill Down page that lists the instances (elements). A clickable link for an instance opens a Graph Display page.
For information about the drill-downs that are available from each report type, see Using Specific Types of Reports, page 3-16.
Adding a Comment to a Report
Note A comment made using this procedure will be displayed only on the particular instance of the report to which you added the comment.
Step 1 Click the Add Comment icon (see Table 3-4). The Report Instance Comments window appears.
Step 2 Enter comments in the Comments box. To include a URL in the comment, enter it between these tags:
• <url>
• </url>
For example, <url>http://www.cisco.com</url>.
Note Clicking the URL Tag button inserts the tags for you.
Step 3 Configure the font size and location:
• To change the font size, enter a number in the Font size field.
• Select Show Comments at and select either Top of the Page or Bottom of the Page.
Step 4 Click OK. A confirmation window is displayed.
Step 5 Click OK.
Adding a Report to a View Use the Add to View icon (see Table 3-4).
Step 1 Click the Add to View icon (see Table 3-4). The Add This Report to View window appears, displaying the report name.
Step 2 In the Add to View field, if you select:
• Create New View—Enter a name in the View Name field and select a number from the Layout Type list (1, 2,or 4).
3-15User Guide for Cisco Unified Service Statistics Manager
OL-20784-01

Chapter 3 Using ReportsUnderstanding and Using Reports
• An existing view—The view name appears in the View Name field; you will not be able to edit the Layout Type.
Step 3 Click Add To View. A confirmation window is displayed.
Step 4 Click Close.
E-Mailing a Report
Step 1 Click the Mail This Page icon. (See Table 3-4)
Step 2 Enter the e-mail address for the sender in the From field.
Step 3 (Optional) Update the Subject field. (By default, this field displays Report Type Report Name.)
Step 4 In the E-Mail Address field, enter one or more addresses for recipients, separated by commas.
Step 5 Click Send. A confirmation window is displayed.
Step 6 Click Close.
Using Specific Types of ReportsThese section includes the following topics:
• Using a Call Failure Summary Report, page 3-17
• Using a Call Quality Summary Report, page 3-18
• Using a Calls to/from Specified Number Report, page 3-19
• Using a Capacity Trend Report, page 3-19
• Using a Cause Code Analysis Report, page 3-20
• Using a Custom Graph Report, page 3-21
• Using a Group Aggregation Report, page 3-21
• Using an Instance Aggregation Report, page 3-22
• Using a Time Aggregation Report, page 3-22
• Using a Top N Dialed Numbers Report, page 3-23
• Using a Top N Calls Report, page 3-24
• Using a Top N Users Report, page 3-24
• Using a Top N Performers Report, page 3-25
• Using a Traffic Summary Report, page 3-25
• Using an SLA Capacity Trend Report, page 3-26
• Using an SLA Compliance History Report, page 3-27
• Using an SLA Compliance Matrix Report, page 3-27
• Using an SLA Executive Summary Report, page 3-28
• Using an SLA Health Summary Report, page 3-29
3-16User Guide for Cisco Unified Service Statistics Manager
OL-20784-01

Chapter 3 Using ReportsUnderstanding and Using Reports
Using a Call Failure Summary Report
A Call Failure Summary Report displays that total number of failed calls and aggregates failed calls by cause code description in a table that contains this information:
• Cause Code Description—Reason that the call failed (provided by Unified Communications Manager)
• Number of Occurrences— By default, the table is sorted by this number of occurrences.
A call is considered good when each endpoint clears the call successfully. Table 3-5 lists the cause codes that designate success; any other cause code designates failure. A call is included in a Call Failure Analysis type of report when the cause code for either endpoint is not one of those listed in Table 3-5.
Display Options
Only a table is displayed.
Drilling Down from a Call Failure Summary Report
To drill down, click the number of occurrences for a particular cause code. The drill-down shows a table that includes these columns:
• Originating User—Caller (can be a directory number where the call originated)
• Destination Number—Called number
• Orig Time—Date and time
• Orig Cause—Termination cause code on the originating endpoint
• Dest Cause—Termination cause code on the destination endpoint
Default Report of This Type
Call Failure Summary - Daily
Table 3-5 Cause Codes for Successfully Cleared Calls
Cause Code Description
0 No error
1 Unallocated (unassigned) number
2 No route to specified transit network (national use)
3 No route to destination
16 Normal call clearing
17 User busy
31 Normal, unspecified
127 Interworking, unspecified
393216 Call split
458752 Drop any party/drop last party
262144 Conference Full
3-17User Guide for Cisco Unified Service Statistics Manager
OL-20784-01

Chapter 3 Using ReportsUnderstanding and Using Reports
Using a Call Quality Summary Report
A Call Quality Summary report summarizes all calls based on their service quality for the report period. The report consists of a pie chart and a table. The pie chart shows the percentage distribution of calls in different service categories.
Service categories are predefined and they are categorized as:
• Good
• Fair
• Acceptable
• Poor
• NA (Not Applicable)—Calls in this service category of two types:
– Short duration—The call was too short for MOS to be calculated.
– MOS Unavailable—Not all endpoints support the CVTQ algorithm without which MOS is not calculated.
Note The following limitations exist with the CallQualityRanges link on Call Quality Summary reports:
• If you click the CallQualityRanges link, a window opens on which you can configure ranges. After you click Apply or Cancel, the Administration tab opens. To return to the report, you must navigate back to it.
• If you create a PDF of the report and you click the CallQualityRanges link in the PDF file, a Page not found error is displayed in the browser.
• If you email the report and the recipient clicks the CallQualityRanges link, a Page not found error is displayed in the browser.
For more information, see Configuring Call Quality, page 7-8.
Note If you click the CallQualityRanges link on the reports page, after you click Apply or Cancel, you are sent to the Administration tab. The report remains available in a separate window.
The table shows the number of calls in each service category and the duration of each call, displaying these columns:
• Quality of Service
• Number of Calls
• Percentage of Calls
• Duration
Display Options
By default, a graph and a table are displayed.
Note A user with the privilege to manage reports can edit the report to display only a graph, only a table, or both.
3-18User Guide for Cisco Unified Service Statistics Manager
OL-20784-01

Chapter 3 Using ReportsUnderstanding and Using Reports
Drilling Down from a Call Quality Summary Report
You can drill down to see details of the calls that are in these service categories:
• Poor
• NA
Default Report of This Type
Call Service Quality Summary—Weekly
Using a Calls to/from Specified Number Report
The Calls To/From Specified Number report summarizes calls to or from a specified phone number, displaying a table that includes these columns:
• Originating User—Directory number that the call came from.
• Time—When the call started.
• Duration (hh:mm:ss)—How long the call lasted.
• Category—All or Selected Categories.
Note Calls can belong to multiple call categories. Therefore, if you add the total calls reported in each category, your sum can be greater than the reported total.
Display Options
A table is displayed.
Drilling Down from a Calls To/From Specified Number Report
There is no drill-down for this report.
Default Report of This Type
There is no default report of this type.
Using a Capacity Trend Report
A Capacity Trend report lists all element-attribute pairs that are predicted to violate a threshold—and that have violated a threshold—in a specified time period. The threshold (an attribute value) and the time period (from 7 days to 2 months) are configurable when creating or editing the report. The report displays a table and a bar graph.
In the graph, the Y axis indexes the instance-attribute pairs that have violated a threshold and that are predicted to violate a threshold in the specified time period. The X axis shows the number of days—if any remain—until the threshold violation occurs. (The maximum number of bars to display is specified while creating the report.)
The table displays these columns:
• Index—A clickable link that opens a Graph Display page with a line graph for the element-attribute pair.
• Monitor Info—Instance information.
• Threshold Condition—Greater than or less than the threshold value.
3-19User Guide for Cisco Unified Service Statistics Manager
OL-20784-01

Chapter 3 Using ReportsUnderstanding and Using Reports
• Days to Violation—The number of days until the threshold violation occurs. If the threshold has already been violated, Violated is displayed instead.
Figure 3-1 provides an example.
Figure 3-1 Example Capacity Trend Report
In Figure 3-1, three instances have already violated the threshold condition and two instances are predicted to violate the threshold condition in 3 days and 7 days.
Display Options
A table is displayed.
Drilling Down from a Capacity Trend Report
To drill down, in the table, click an index link for a monitor to open a graph for the monitor. A Graph Display page appears with a line graph; the Y axis shows attribute values and the X axis shows time. The line graph includes these lines:
• Threshold value—A solid line.
• Projected attribute values—A dotted line from the last data point to the threshold line. The intersection point is at the predicted violation time.
• Predicted violation time—A dotted line connects the intersection point (where the attribute value is predicted to hit the threshold) with the X axis.
For more information, see Understanding and Interacting with Custom Graphs, page 4-8.
Default Report of This Type
There is no default report of this type.
Using a Cause Code Analysis Report
A Cause Code Analysis report summarizes user-selected cause codes in a pie chart and a table. Each slice of the pie corresponds to a single cause code. To see the number of occurrences of the cause code and its percentage in the graph, place your cursor over a slice of the pie chart.
The table below the graph contains this information:
3-20User Guide for Cisco Unified Service Statistics Manager
OL-20784-01

Chapter 3 Using ReportsUnderstanding and Using Reports
• Cause Code—Numeric code provided in the information from Unified Communications Manager.
• Description—Reason that the call ended (corresponds to the cause code).
• Number of Occurrences— By default, the table is sorted by this number of occurrences.
Display Options
A graph (pie chart) and table are displayed.
Drilling Down from a Cause Code Analysis Report
There is no drill-down for this report.
Default Report of This Type
None
Using a Custom Graph Report
A custom graph report includes one or more custom graphs. The following types of graphs can be displayed:
• Line
• Area
• X-Y
Depending on the report definition, custom graphs include data for one or more monitor types and one or more attributes. For more information, see Understanding and Interacting with Custom Graphs, page 4-8.
Note No legend is displayed in a Custom Graph report.
Display Options
One or more graphs is displayed.
Drilling Down from a Custom Graph Report
There is no drill-down for this report.
Default Report of This Type
There is no default report of this type.
Using a Group Aggregation Report
A Group Aggregation report aggregates the values of selected attributes for elements that belong to selected groups. From a Group Aggregation report, you can drill down to an Instance Aggregation report that displays the aggregated values over the instances. From an Instance Aggregation report, you can drill down to a Time Aggregation report that shows the values over time for an instance.
Note Groups are user-defined in Service Statistics Manager.
3-21User Guide for Cisco Unified Service Statistics Manager
OL-20784-01

Chapter 3 Using ReportsUnderstanding and Using Reports
The columns in the table are:
• Group Name—Group name
• <One column for each selected attribute> with attribute name and attribute value.
Display Options
By default, a graph and a table are displayed.
Note A user with the privilege to manage reports can edit the report to display only a graph, only a table, or both.
Drilling Down from a Group Aggregation Report
When you click the graph and table entries, an Instance Aggregation report appears. For more information, see Using an Instance Aggregation Report, page 3-22.
Default Report of This Type
Call Volume Across Clusters by Location—Monthly
Using an Instance Aggregation Report
An Instance Aggregation report graphs aggregated values for selected attributes over instances of the selected monitor types. From an Instance Aggregation report, you can drill down to a Time Aggregation report that displays values over time. The columns in the table are:
• Element Name—Name of an instance.
• <One column for each selected attribute> with attribute name and attribute value.
Display Options
By default, a graph and a table are displayed.
Note A user with the privilege to manage reports can edit the report to display only a graph, only a table, or both.
Drilling Down from an Instance Aggregation Report
When you click the graph and table entries, a related time aggregation report appears. For more information, see Using a Time Aggregation Report, page 3-22.
Default Reports of This Type
Numerous instance aggregation default reports are listed in Table 3-2 on page 3-3.
Using a Time Aggregation Report
A Time Aggregation report enables you to view data aggregated by the hour, day, week, or month for one or more elements. Data for the selected attributes is aggregated across all elements or across selected elements (depending on the report definition). By clicking the graph, you can drill down to a Graph Display page that includes a line graph for an element.
3-22User Guide for Cisco Unified Service Statistics Manager
OL-20784-01

Chapter 3 Using ReportsUnderstanding and Using Reports
The columns in the table are:
• Time—The hour, day, week, or month
• <One column for each selected attribute> with attribute name and attribute value.
Display Options
By default, a graph and a table are displayed.
Note A user with the privilege to manage reports can edit the report to display only a graph, only a table, or both.
Drilling Down from a Time Aggregation Report
If Aggregate Data Across All Elements is selected in the report definition, when you click the graph, a Drill Down page appears, displaying a table that lists the instances. When you click an instance, a Graph Display page opens, showing a line graph for the given instance; values of the attributes are distributed over the selected time increment (hour, day, week, or month).
When Aggregate Data Across All Elements is not selected in the report definition, drilling down takes you directly to a Graph Display page with a line graph for the particular instance. To drill down, click a table entry.
Default Reports of This Type
Numerous time aggregation default reports are listed in Table 3-2 on page 3-3.
Using a Top N Dialed Numbers Report
A Top N Dialed Numbers report lists the top N phones that received calls. These phones were:
• Called the greatest number of times or
• Engaged for the longest duration
The table includes the following columns:
• Destination Number
• Total Calls to Destination Number
• Duration
Display Options
A table is displayed.
Drilling Down from a Top N Dialed Numbers Report
You can drill down from the destination extension numbers to view details of the calls placed to that particular number. A table is displayed that includes the following details of calls placed to the Top N Dialed Numbers:
• Originating User
• Time
• Category
• Duration
3-23User Guide for Cisco Unified Service Statistics Manager
OL-20784-01

Chapter 3 Using ReportsUnderstanding and Using Reports
Default Reports of This Type
• Top N Dialed Numbers Based on Call Count
• Top N Dialed Numbers Based on Call Duration
Using a Top N Calls Report
A Top N Calls report lists top calls based on duration of calls made from the source phone to any other phone. The table includes the following columns:
• Originating User
• Time
• Destination Number
• Duration
Note Call records where the originating user is blank are omitted from this report. The originating user can be blank when the external caller ID is blocked and the call might be coming in from FXO or T1 /CAS gateways.
Display Options
A table is displayed.
Drilling Down from a Top N Calls Report
There is no drill-down for this report.
Default Report of This Type
Top N Calls Based on Duration
Using a Top N Users Report
A Top N Users report lists top source phones (phones from which calls originated) based on total duration of all calls made from the phone to any other phone. The table includes the following columns:
• Originating User
• Number of Calls
• Duration
Display Options
A table is displayed.
Drilling Down from a Top N Users Report
There is no drill-down for this report.
Default Report of This Type
Top N Users
3-24User Guide for Cisco Unified Service Statistics Manager
OL-20784-01

Chapter 3 Using ReportsUnderstanding and Using Reports
Using a Top N Performers Report
A Top N Performers report compares selected attributes for a monitor type (for example, Unified CM Performance) for instances that belong to a group (for example, Finance Department). You can compare up to 15 attributes, in terms of the average value, low value, or high value over a specified time period, in the form of a bar graph. Both the graph and the table are sorted on the average value.
The table includes these columns:
• Monitor Information
• Average
• High (if selected)
• Low (if selected)
Display Options
By default, a graph and a table are displayed.
Note A user with the privilege to manage reports can edit the report to display only a graph, only a table, or both.
Drilling Down from a Top N Performers Report
Drilling down from graph and table entries leads to the individual line graphs for the attribute/monitored element.
Default Reports of This Type
• Top N Gateways by Utilization—Monthly
• Top N Service Availability Across Clusters by Time—Monthly
• Top N Trunks by Utilization—Monthly
Using a Traffic Summary Report
A Traffic Summary report displays the distribution of calls belonging to different call categories as a stacked bar graph and in a table. One stack of the bar corresponds to a particular call category. When you highlight the stacked bar graph, it shows the total number of calls for the given category, aggregated over the hour or the day.
The columns in the table vary based on the whether the report is hourly or daily across available call categories. Each row in the table corresponds to time, based on the time increment of aggregation. By default, Traffic Summary is sorted based on the time. The columns in the table are:
• Time—Time (date and, if reporting hourly, hour).
• Column Name <number of columns based on the Categories selected>—Number of calls that occur in a particular time period, for the given call category.
• Total—Sum of all the calls across call categories selected, for a particular time increment (hour or day).
Note Calls can belong to multiple call categories. Therefore, if you add the total calls reported in each category, your sum can be greater than the reported total.
3-25User Guide for Cisco Unified Service Statistics Manager
OL-20784-01

Chapter 3 Using ReportsUnderstanding and Using Reports
Display Options
By default, a graph and a table are displayed.
Note A user with the privilege to manage reports can edit the report to display only a graph, only a table, or both.
Drilling Down from a Traffic Summary Report
There is no drill-down for this report.
Default Report of This Type
• Traffic Summary—Day of Month
• Traffic Summary—Day of Week
• Traffic Summary—Hour of Day
Using an SLA Capacity Trend Report
An SLA Capacity Trend report lists all SLA attribute pairs that are predicted to violate the SLA threshold during the specified time period.
Note You can update SLA thresholds at any time. When an SLA report is generated, it measures against the latest threshold value.
This report displays the following information:
• Index
• SLA Name
• SLA Type
• Device
• Resource
• Schedule
• Threshold Capacity
• Days to Capacity
• SLA Details
Display Options
There are no display options for this report.
Drilling Down from an SLA Capacity Trend Report
Click (the SLA Details icon) to view SLA Details. See Viewing SLA Details (Compliance Matrix Details Column), page 5-5.
Drill down on the monitor instance of SLA in the table to display a line graph for the selected attribute along with the threshold line. The line graph is projected using a dotted line from the last data point to the SLT line, and the intersection point is at the predicted violation time. A dotted line from the intersection point to the X axis is also present.
3-26User Guide for Cisco Unified Service Statistics Manager
OL-20784-01

Chapter 3 Using ReportsUnderstanding and Using Reports
Note If there are no SLAs that violate thresholds during the specified time, the thumbnail view for an SLA Capacity Trend report does not show an X axis.
Default Report of This Type
There is no default report of this type.
Using an SLA Compliance History Report
Note You can update SLA thresholds at any time. When an SLA report is generated, it measures against the latest threshold value.
The SLA Compliance History report shows how SLAs have been performing, in terms of meeting SLA objectives.
Display Options
There are no display options for this report.
Drilling Down from an SLA Compliance History Report
When you click the graph, a SLA Health Summary Report opens. For more information, see Using an SLA Health Summary Report, page 3-29.
Default Report of This Type
There is no default report of this type.
Using an SLA Compliance Matrix Report
Note You can update SLA thresholds at any time. When an SLA report is generated, it measures against the latest threshold value.
An SLA Compliance Matrix report displays the compliance summary of selected SLAs including their current status. The report can be used to compare SLA performance details for different time periods that you select.
This report displays the following information:
• SLA Name—Name.
• SLA Type—(Optional) Name.
• Details—Click the icon to open an SLA Details page.
• History—Click the icon to open an SLA Compliance Report.
• Objective
• The time periods included in the report are configurable and can include these:
– Previous Day
– Previous Week
3-27User Guide for Cisco Unified Service Statistics Manager
OL-20784-01

Chapter 3 Using ReportsUnderstanding and Using Reports
– Previous Month
– Week to Date
– Month to Date
– Quarter to Date
– Year to Date
Display Options
When configuring this report type, a user can select whether to display the SLA Type and can select the time periods to display.
Drilling Down from an SLA Compliance Matrix Report
Click the SLA Details icon to view the SLA Details. See Viewing SLA Details (Compliance Matrix Details Column), page 5-5.
Click the icon in the History column to open an SLA Compliance History Report. See Using an SLA Compliance History Report, page 3-27.
Click the SLA Name link to drill down to details of that particular SLA. See Viewing the Compliance Matrix for a Specific SLA, page 5-4.
Click the graph icon to open a graph. (From the graph page, click Go to Custom Graph Generator to drill down to individual line graphs. See Understanding and Interacting with Custom Graphs, page 4-8.
Default Report of This Type
There is no default report of this type.
Using an SLA Executive Summary Report
Note You can update SLA thresholds (service-level objectives) at any time. When an SLA report is generated, it measures against the latest threshold value.
The SLA Executive Summary report is a Top N report. It presents a list of SLAs, sorted based on their performance. This report displays the following information:
• Index—Click to open an SLA Compliance History Report.
• SLA Name—Name.
• SLA Type—Name.
• Objective—Expected value.
• Compliance—Percent of time that the expected value was met.
• Delta—Difference between the objective and the actual compliance.
• SLA Details—Click the icon to open the SLA Details page.
Display Options
A user who defines this report can select the sort order (best or worst) and whether to omit the delta value (by selecting Absolute).
3-28User Guide for Cisco Unified Service Statistics Manager
OL-20784-01

Chapter 3 Using ReportsManaging Reports
Drilling Down from an SLA Executive Summary Report
Click the SLA Details icon to view the SLA Details.
When you click the graph and table entries, you drill down to the SLA Compliance History Report Display screen. For more information, see Using an SLA Compliance History Report, page 3-27.
Default Report of This Type
There is no default report of this type.
Using an SLA Health Summary Report
Note You can update SLA thresholds at any time. When an SLA report is generated, it measures against the latest threshold value.
An SLA Health Summary report shows all SLA instances in order of worst (at the left) to best (at the right) in terms of violations over a specified time period.
This report displays the following information:
• Index—Click to open a Graph Display page for the device and attribute in this row.
• Device Information—IP addresses and other relevant information.
• Attribute—The attribute that is being measured.
• Schedule—The time period during which the attribute is being measured.
• Service Level Objective—Condition and value to meet.
• Violation Time—Duration of the violation.
• Compliance %—Percent compliance with the service-level objective.
• Total Duration—Time period that this report covers.
• Peak—Highest value.
• Average—Average value.
Display Options
There are no display options for this report.
Drilling Down from an SLA Health Summary Report
This report drills down to individual line graphs.
Default Report of This Type
There is no default report of this type.
Managing ReportsA user with the privilege to manage reports can do the following:
• Create reports—When you create or edit a report, a report wizard presents three pages:
– Creating a Report—Page 1 of the Report Wizard (Initial Details), page 3-30
3-29User Guide for Cisco Unified Service Statistics Manager
OL-20784-01
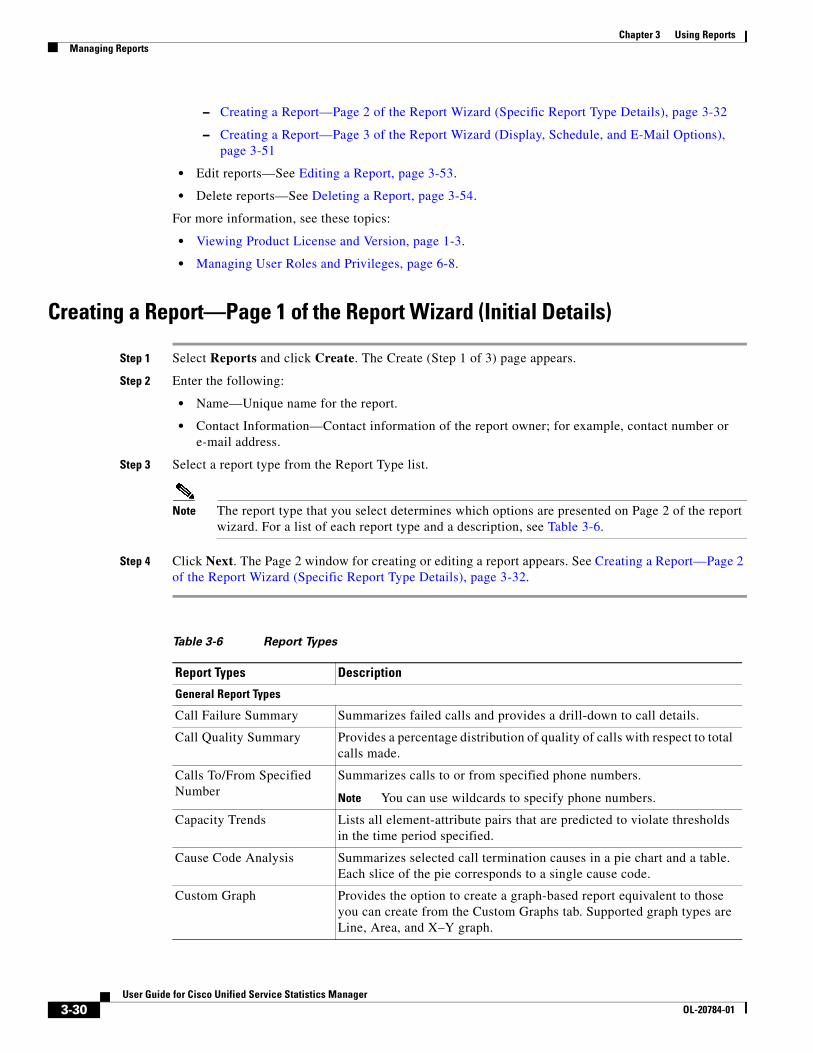
Chapter 3 Using ReportsManaging Reports
– Creating a Report—Page 2 of the Report Wizard (Specific Report Type Details), page 3-32
– Creating a Report—Page 3 of the Report Wizard (Display, Schedule, and E-Mail Options), page 3-51
• Edit reports—See Editing a Report, page 3-53.
• Delete reports—See Deleting a Report, page 3-54.
For more information, see these topics:
• Viewing Product License and Version, page 1-3.
• Managing User Roles and Privileges, page 6-8.
Creating a Report—Page 1 of the Report Wizard (Initial Details)
Step 1 Select Reports and click Create. The Create (Step 1 of 3) page appears.
Step 2 Enter the following:
• Name—Unique name for the report.
• Contact Information—Contact information of the report owner; for example, contact number or e-mail address.
Step 3 Select a report type from the Report Type list.
Note The report type that you select determines which options are presented on Page 2 of the report wizard. For a list of each report type and a description, see Table 3-6.
Step 4 Click Next. The Page 2 window for creating or editing a report appears. See Creating a Report—Page 2 of the Report Wizard (Specific Report Type Details), page 3-32.
Table 3-6 Report Types
Report Types Description
General Report Types
Call Failure Summary Summarizes failed calls and provides a drill-down to call details.
Call Quality Summary Provides a percentage distribution of quality of calls with respect to total calls made.
Calls To/From Specified Number
Summarizes calls to or from specified phone numbers.
Note You can use wildcards to specify phone numbers.
Capacity Trends Lists all element-attribute pairs that are predicted to violate thresholds in the time period specified.
Cause Code Analysis Summarizes selected call termination causes in a pie chart and a table. Each slice of the pie corresponds to a single cause code.
Custom Graph Provides the option to create a graph-based report equivalent to those you can create from the Custom Graphs tab. Supported graph types are Line, Area, and X–Y graph.
3-30User Guide for Cisco Unified Service Statistics Manager
OL-20784-01

Chapter 3 Using ReportsManaging Reports
Group Aggregation Aggregates selected attributes for a user-defined group of instances. From a group aggregation report, you can drill down to an instance aggregation report. (See Instance Aggregation in this table.) From an instance aggregation report you can drill down to a time aggregation report. (See Time Aggregation in this table.)
Here is an example of creating and using a group aggregation report:
1. Define a group, such as Location, that includes instances of the Gateway Utilization monitor type that are located, for example, at remote sites.
2. Define a group aggregation report and select Location as the group filter. Because Location includes instances of the Gateway Utilization monitor type, from the Gateway Utilization monitor type attributes, select Call Count.
3. Open the group aggregation report that you created. The call count for the all gateways in the group is displayed. Drill down to see the call count for each gateway in the group. Drill down again to see the call count for one gateway over time.
Instance Aggregation Aggregates data for an attribute (for example, Allocated Capacity) of a given monitor type (for example, CUE Performance) for each selected element; enables comparison across instances.
When you open an instance aggregation report, you can drill down to view data for an instance over time; see Time Aggregation in this table.
Time Aggregation Aggregates data for selected attributes (for example, Number of Calls—Internal) of a given monitor type (for example, Call Quality) for the aggregation time increment selected (for example, by Day) for a report period.
Top N Calls Lists top N calls by duration.
Top N Dialed Numbers Lists the top N phones, for which one of the following was true:
• Called the most times.
• Engaged in a call for the longest duration.
Top N Performers For a given attribute (for example, Number of Calls—Internal) of a monitor type (for example, Call Volume), this report lists the top N or bottom N elements of the selected monitor type. See Top N Performers Report, page 3-46.
Top N Users Lists top N phones that were used to place a call and were in a call for the longest duration.
Traffic Summary Gives the distribution of calls belonging to different call categories, over time, as a stacked bar graph and table.
SLA Report Types (To Create and Report on SLAs, Service Statistics Manager Requires a Premium License)
SLA Capacity Trend Lists all instance–attribute pairs that are predicted to violate an SLA threshold in the specified time period.
SLA Compliance History Shows how SLAs have been performing, in terms of meeting SLA objectives.
Table 3-6 Report Types (continued)
Report Types Description
3-31User Guide for Cisco Unified Service Statistics Manager
OL-20784-01

Chapter 3 Using ReportsManaging Reports
Creating a Report—Page 2 of the Report Wizard (Specific Report Type Details)The information that you must enter during this step varies based on the report type that you selected in Creating a Report—Page 1 of the Report Wizard (Initial Details), page 3-30:
• Call Failure Summary Report, page 3-33
• Call Quality Summary Report, page 3-34
• Calls To/From Specified Number Report, page 3-35
• Capacity Trend Report, page 3-36
• Cause Code Analysis Report, page 3-37
• Custom Graph Report, page 3-38
• Selecting Elements to Include in a Custom Graph Report, page 3-39
• Group Aggregation Report, page 3-40
• Instance Aggregation Report, page 3-41
• Time Aggregation Report, page 3-42
• Top N Calls Reports, page 3-43
• Top N Dialed Numbers Report, page 3-44
• Top N Users Report, page 3-45
• Top N Performers Report, page 3-46
• Traffic Summary Report, page 3-47
• SLA Capacity Trend Report, page 3-48
• SLA Compliance History Report, page 3-48
• SLA Compliance Matrix Report, page 3-49
• SLA Executive Summary Report, page 3-50
• SLA Health Summary Report, page 3-50
Understanding the Use of Color on Graphs in Reports
In many cases, on page 2 of the report wizard, you select attributes to include in the report. When you select an attribute, a color is assigned to it that will be used to represent the attribute on the graph shown in the report. If you select one attribute, dark green is assigned to it. If you select more than one attribute, colors are assigned to the selected attributes in the following sequence:
• Dark Green
• Red
SLA Compliance Matrix Provides a compliance summary for selected SLAs.
SLA Executive Summary Presents a list of SLAs, sorted based on their performance.
SLA Health Summary Shows all SLA instances (in order of worst at the left to best at the right) in terms of violations over a specified time period.
Table 3-6 Report Types (continued)
Report Types Description
3-32User Guide for Cisco Unified Service Statistics Manager
OL-20784-01

Chapter 3 Using ReportsManaging Reports
• Orange
• Light Purple
• Medium Blue
• Gray
• Cyan
• Teal
• Brown
• Light Green
• Yellow
• Pink
Call Failure Summary Report
This report type summarizes failed calls by cause code. Initially, the default report definition includes all phones. When creating or editing a call failure summary report type, you can use filtering to limit the phones that are included. You can include multiple subreports in your report definition.
Note For default reports of this type, see Using a Call Failure Summary Report, page 3-17.
In the upper half of this window, define one or more subreports. As you define subreports, they are displayed in the lower half of the window, where you can:
• Change the order in which they are displayed
• Delete them.
Add one or more subreports using this procedure.
Step 1 Select the filter that can best produce the list of phones that you want to include in the report. See Selecting Filters to Retrieve Phones for Reports, page 3-33.
Step 2 Complete the subreport by:
a. Entering a name in the Subreport Title Field.
b. Clicking Add Subreport. The subreport definition appears in the Added Subreport section, where you can:
– Move it up or down in order by using the arrow keys at the right.
– Select it and delete it by clicking Delete.
Step 3 Repeat steps 1 through 3 until you have added all desired subreports.
Step 4 Click Next. The Page 3 window for creating or editing a report appears. See Creating a Report—Page 3 of the Report Wizard (Display, Schedule, and E-Mail Options), page 3-51.
Selecting Filters to Retrieve Phones for Reports
When you create or edit a report, you can apply filters so that only certain phones are included for these report types:
3-33User Guide for Cisco Unified Service Statistics Manager
OL-20784-01

Chapter 3 Using ReportsManaging Reports
• Call Failure Summary
• Call Quality Summary
• Cause Code Analysis
• Top N Dialed Numbers
• Top N Calls
• Top N Users
• Traffic Summary
Select one of the following filters:
• No Filter—Include any phone in the report.
• Phone Groups—Select a phone group to include only those phones that belong to the selected phone group. (A phone group can contain specific phone numbers, a range of phone numbers, or regular expressions that filter out phone numbers that do not match the expression. For more information, see Configuring Phone-Based Groups, page 7-7.)
• Phone Numbers—Enter a phone number or an expression to include only phone numbers that match the specified expression.
• Filter by Cluster—When you select Filter by Cluster, you must also select one of these:
– Group Filter—Select a group. Only those clusters that belong to the selected group are used to filter phones considered for report processing.
– Select Elements—Select one or more elements; only those clusters that you select are used to filter phones considered for report processing.
Selecting Elements for a Subreport
Step 1 Select both of these: Filter by Cluster and Select Elements. The list of elements remains empty.
Step 2 Click Add. The Select Element(s) to add window appears, displaying a list of elements for which data is being collected for this report type. For more information, see Devices and Associated Monitor Types, page A-1.
Step 3 Select one or more elements using the Ctrl and Shift keys to make multiple selections.
Step 4 Click Add and click Close. The selected elements appear in the list.
Call Quality Summary Report
This report type provides the percentage distribution of call quality—good, fair, acceptable, poor—with respect to total calls made in various call categories. Initially, default report definitions include all phones and all call categories, such as local and long distance; for more information, see User Guide for Cisco Unified Service Monitor 2.3.
When creating or editing a call quality summary report type, you can limit the phones that are included (through filtering) and you can limit the report to selected call categories. You can include multiple subreports in your report definition.
Note For default reports of this type, see Using a Call Quality Summary Report, page 3-18.
3-34User Guide for Cisco Unified Service Statistics Manager
OL-20784-01

Chapter 3 Using ReportsManaging Reports
In the upper half of this window, define one or more subreports. As you define subreports, they are displayed in the lower half of the window, where you can:
• Change the order in which they are displayed
• Delete them.
Add one or more subreports using this procedure.
Step 1 Select the filter that can best produce the list of phones that you want to include in the report. See Selecting Filters to Retrieve Phones for Reports, page 3-33.
Step 2 Select one of the following:
• Consider All Call Categories.
• Consider Selected Call Categories—If you select this radio button, call categories are displayed. Select one or use the Ctrl and Shift keys to make multiple selections.
Note For more information, see Configuring Call Classification in User Guide for Cisco Unified Service Monitor 2.3.
Step 3 Complete the subreport by:
a. Entering a name in the Subreport Title Field.
b. Clicking Add Subreport. The subreport definition appears in the Added Subreport section, where you can:
– Move it up or down in order by using the arrow keys at the right.
– Select it and delete it by clicking Delete.
Step 4 Repeat steps 1 through 3 until you have added all desired subreports.
Step 5 Click Next. The Page 3 window for creating or editing a report appears. See Creating a Report—Page 3 of the Report Wizard (Display, Schedule, and E-Mail Options), page 3-51.
Calls To/From Specified Number Report
This report type summarizes calls to or from specified phone numbers. You can limit the calls to only those in specific call categories.
In the upper half of this window, define one or more subreports. As you define subreports, they are displayed in the lower half of the window, where you can:
• Change the order in which they are displayed
• Delete them.
Add one or more subreports using this procedure.
Step 1 Select one:
• Calls Made To
• Call Made From
3-35User Guide for Cisco Unified Service Statistics Manager
OL-20784-01

Chapter 3 Using ReportsManaging Reports
Note To report on calls made to and from the same number, create two subreports: one with calls to the number and another with calls from it.
Step 2 In the Extension field, enter:
• A complete extension number
• A partial extension number and wildcards:
– X—Signifies a single digit
– * (asterisk)—Signifies multiple digits
Step 3 Select one of the following:
• Consider All Call Categories
• Consider Selected Call Categories—If you select this radio button, call categories are displayed. Select one or use the Ctrl and Shift keys to make multiple selections.
Note Calls are aggregated in the subreport and not listed separately for each call category that you select. To display calls for a particular call category, include that call category in a subreport and title the subreport with the call category name.
Step 4 Complete the subreport by:
a. Entering a name in the Subreport Title Field.
b. Clicking Add Subreport. The subreport definition appears in the Added Subreport section, where you can:
– Move it up or down in order by using the arrow keys at the right.
– Select it and delete it by clicking Delete.
Step 5 Repeat steps 1 through 3 until you have added all desired subreports.
Step 6 Click Next. The Page 3 window for creating or editing a report appears. See Creating a Report—Page 3 of the Report Wizard (Display, Schedule, and E-Mail Options), page 3-51.
Capacity Trend Report
Use this report type to specify attributes—such as utilization—that you want to trend and for which you will define thresholds that the attributes should not violate. This report type lists all element-attribute pairs that are predicted to violate the thresholds that you define in the time period that you specify.
Step 1 Specify Group Selection by selecting one of these:
• No Filter—Include all applicable instances in the system.
• Selected Groups—If you select this, select one or more groups from the Available Groups list and transfer them to the Selected Groups list. You can use the Search option to find the groups that you want to select.
3-36User Guide for Cisco Unified Service Statistics Manager
OL-20784-01

Chapter 3 Using ReportsManaging Reports
Step 2 Specify the attributes to trend in the report, by selecting one of these:
• Single Attribute—Limit the report to a single attribute for one monitor type. Monitor types are listed independently from the group selected previously.
• Attribute Set—(Default option) Limit the report to only those attributes present in an attribute set, a named collection of attributes, that will be used for generating this report. Do one of the following:
– Select an existing attribute set. To update the attribute set, click Edit.
– Define a new attribute set. To do so, click New.
Note Do not select the Availability attribute (of Call Volume monitor type). Database availability cannot be forecast.
Step 3 To specify the Capacity Threshold, select Above or Below and enter the threshold value.
Step 4 Specify the Report Options:
• Hide Attribute Name Column—If this option is selected, the Attribute column is not included in the report table.
• Show Instance that Will Violate in the Next—This is the forecast period. Only instances that are predicted to violate capacity thresholds in this time period appear in the report. By default, 7 days is selected. The maximum forecast period is any of these:
– Days: 45
– Weeks: 6
– Months: 2
• Use Data for the Last—This option controls which set of data points are used for forecasting. The default value is 14 days. The maximum values are 30 days, 4 weeks, or 1 month.
• Maximum Number of Bars in Graph—Specify the maximum number of bars to display in the bar graph. The maximum number of bars cannot exceed 20. The default value is 20.
Step 5 Click Next. The Page 3 window for creating or editing a report appears. See Creating a Report—Page 3 of the Report Wizard (Display, Schedule, and E-Mail Options), page 3-51.
Cause Code Analysis Report
This report type summarizes user-selected cause codes in a pie chart and a table. Initially, the default report definitions include all phones and all cause codes. When creating or editing a cause code analysis report type, you can use filtering to limit the phones that are included, and you can limit the number of cause codes. You can include multiple subreports in your report definition.
Note For default reports of this type, see Using a Cause Code Analysis Report, page 3-20.
In the upper half of this window, define one or more subreports. As you define subreports, they are displayed in the lower half of the window, where you can:
• Change the order in which they are displayed
• Delete them.
Add one or more subreports using this procedure.
3-37User Guide for Cisco Unified Service Statistics Manager
OL-20784-01

Chapter 3 Using ReportsManaging Reports
Step 1 Select the filter that can best produce the list of phones that you want to include in the report. See Selecting Filters to Retrieve Phones for Reports, page 3-33.
Step 2 Select one or more cause codes using the Ctrl and Shift keys to make multiple selections.
Note Cause codes conform to ITU specification Q850 or, if specified by Cisco, are noted.
Step 3 Complete the subreport by:
a. Entering a name in the Subreport Title Field.
b. Clicking Add Subreport. The subreport definition appears in the Added Subreport section, where you can:
– Move it up or down in order by using the arrow keys at the right.
– Select it and delete it by clicking Delete.
Step 4 Repeat steps 1 through 3 until you have added all desired subreports.
Step 5 Click Next. The Page 3 window for creating or editing a report appears. See Creating a Report—Page 3 of the Report Wizard (Display, Schedule, and E-Mail Options), page 3-51.
Custom Graph Report
Use this report type to define graph-based reports that are similar to custom graphs (for more information, see Getting Started with Custom Graphs, page 4-1).
In the upper half of this window, define one or more subreports. As you define subreports, they are displayed in the lower half of the window, where you can:
• Change the order in which they are displayed
• Delete them.
Add one or more subreports using this procedure.
Step 1 Select the graph type.
Step 2 Select the attributes to graph:
a. Click Add to add the attributes. See Selecting Elements to Include in a Custom Graph Report, page 3-39.
b. Use the Clear button to discard all selections and start over.
c. If you selected only one attribute, you can also select one or more indicators to show the minimum, maximum, or average value during the period.
Step 3 To include data for a specific period only, select a schedule other than No Filter (default) by doing one of the following:
• Select an existing schedule. To update it, click Edit (see Editing a Schedule When Configuring Custom Graphs, Reports, and SLAs, page 5-17).
• Create a new schedule by clicking New (see Adding a Schedule When Configuring Custom Graphs, Reports, and SLAs, page 5-17).
3-38User Guide for Cisco Unified Service Statistics Manager
OL-20784-01

Chapter 3 Using ReportsManaging Reports
Step 4 Complete the subreport by:
a. Entering a name in the Subreport Title Field.
b. Clicking Add Subreport. The subreport definition appears in the Added Subreport section, where you can:
– Move it up or down in order by using the arrow keys at the right.
– Select it and delete it by clicking Delete.
Step 5 Repeat steps 1 through 4 until you have added all desired subreports.
Step 6 Click Next. The Page 3 window for creating or editing a report appears. See Creating a Report—Page 3 of the Report Wizard (Display, Schedule, and E-Mail Options), page 3-51.
Selecting Elements to Include in a Custom Graph Report
When you are creating a custom graph report, one of the following windows is displayed:
• Select Elements for Line Graph
• Select Elements for Area Graph
• Select Elements for X-Y Graph
Use this procedure to select elements for a line, area, or X-Y graph.
Step 1 (Optional) Select a group.
Step 2 Select one or more monitor types from the Monitor Type list.
Note For an X-Y graph, select only one monitor type.
Step 3 Click Next. One or more Monitor Element lists appear on the page. For a line graph or an area graph, one Monitor Element list appears for each monitor type that you selected.
Step 4 Select one or more elements from each Monitor Element list.
Note For an X-Y graph, select one element from each list.
Step 5 Click Apply. The window is refreshed, showing the following for each monitored element that you selected:
• A numbered heading—Identifies the monitored element; that is, the device. The number provides a running count of the monitored elements that you selected.
• A table with more device-specific information—Displays the IP address or DNS name and the name of the SSM agent that coordinates the monitoring of this device for the particular type of information in addition to other details.
• A table of attributes—Lists the attributes for the device.
Note The table heading displays the maximum number of attributes that you can select and the maximum number of units of measure.
3-39User Guide for Cisco Unified Service Statistics Manager
OL-20784-01

Chapter 3 Using ReportsManaging Reports
Step 6 Select attributes for each monitored element, limiting the number of attributes and units of measure to no more than the maximums.
Step 7 Click Add Elements at the bottom of the page. You are returned to Custom Graph Report, page 3-38.
Group Aggregation Report
This report type aggregates data for all elements that belong to one or more groups. Using this report type, for example, you can compare utilization (attributes) across clusters in different locations (groups). All groups are user-defined. To create a group—such as Location—you must be a user in the Administrator role; for more information, see Managing Groups, page 6-3.
Note For default reports of this type, see Using a Group Aggregation Report, page 3-21.
In the upper half of this window, define one or more subreports. As you define subreports, they are displayed in the lower half of the window, where you can:
• Change the order in which they are displayed
• Delete them.
Add one or more subreports using this procedure.
Step 1 Select one of the following:
• Show Only Graph—If selected, select a graph type: Line, 2D Bar, 3D Bar, 2D Stacked Bar, or 3D Stacked Bar.
• Show Only Table.
• Show Table along with Graph—If selected, select a graph type: Line, 2D Bar, 3D Bar, 2D Stacked Bar, or 3D Stacked Bar.
Step 2 Select a monitor type. For the selected monitor type, any associated groups are dynamically populated under Available Groups.
Step 3 Select one of the following from Available Groups:
• No Filter—Include all groups to which the monitor type is associated.
• Selected Groups—If you select this, select one or more groups from the Available Groups list and transfer them to the Selected Groups list. You can use the Search option to find the groups that you want to select.
Step 4 Select attributes from the Available Attributes list and transfer them to the Selected Attributes list.
Step 5 To display the data as a percentage distribution for the selected attributes, select Select Aggregate Data as Percentage of the Selected Attributes.
Step 6 Complete the subreport by:
a. Entering a name in the Subreport Title Field.
b. Clicking Add Subreport. The subreport definition appears in the Added Subreport section, where you can:
– Move it up or down in order by using the arrow keys at the right.
– Select it and delete it by clicking Delete.
3-40User Guide for Cisco Unified Service Statistics Manager
OL-20784-01

Chapter 3 Using ReportsManaging Reports
Step 7 Repeat steps 1 through 6 until you have added all desired subreports.
Step 8 Click Next. The Page 3 window for creating or editing a report appears. See Creating a Report—Page 3 of the Report Wizard (Display, Schedule, and E-Mail Options), page 3-51.
Instance Aggregation Report
This report type aggregates data for a given monitor type (for example, call volume) for one or more monitor instances. When creating or editing an instance aggregation report, you can limit the number of elements and select only the attributes that you want to see.
Note For default reports of this type, see Using an Instance Aggregation Report, page 3-22. Initially, default report definitions include all elements.
In the upper half of this window, define one or more subreports. As you define subreports, they are displayed in the lower half of the window, where you can:
• Change the order in which they are displayed
• Delete them.
Add one or more subreports using this procedure.
Step 1 Select one of the following:
• Show Only Graph—If selected, select a graph type: Line, 2D Bar, 3D Bar, 2D Stacked Bar, or 3D Stacked Bar.
• Show Only Table.
• Show Table along with Graph—If selected, select a graph type: Line, 2D Bar, 3D Bar, 2D Stacked Bar, or 3D Stacked Bar.
Step 2 Select a monitor type.
Step 3 Select one of the following:
• Consider All Elements of the monitor type.
• Group Filter—If you select this option and select a group, only those elements that belong to the selected group are considered for report processing.
• Select Elements—If you select this option, the list of elements remains empty. Do the following:
– Click Add. The Select Element(s) to add window appears, displaying a list of elements for which data is being collected for this report type. For more information, see Devices, Monitor Types, and Attributes, page A-1.
– Select one or more elements using the Ctrl and Shift keys to make multiple selections.
– Click Add and then click Close. The selected elements appear in the list.
Step 4 To display data as a percentage distribution for the selected attributes, select Select Aggregate Data as Percentage of the Selected Attributes.
Step 5 Select attributes from the Available Attributes list and transfer them to the Selected Attributes list.
Step 6 Complete the subreport by:
a. Entering a name in the Subreport Title Field.
3-41User Guide for Cisco Unified Service Statistics Manager
OL-20784-01

Chapter 3 Using ReportsManaging Reports
b. Clicking Add Subreport. The subreport definition appears in the Added Subreport section, where you can:
– Move it up or down in order by using the arrow keys at the right.
– Select it and delete it by clicking Delete.
Step 7 Repeat steps 1 through 6 until you have added all desired subreports.
Step 8 Click Next. The Page 3 window for creating or editing a report appears. See Creating a Report—Page 3 of the Report Wizard (Display, Schedule, and E-Mail Options), page 3-51.
Time Aggregation Report
This report type aggregates data for a given monitor type (for example, call quality by sensor) for one or more monitor instances (for example, one or more sensors) for a period of time. For the default time aggregation reports that Service Statistics Manager creates, see Using a Time Aggregation Report, page 3-22.
In the upper half of this window, define one or more subreports. As you define subreports, they are displayed in the lower half of the window, where you can:
• Change the order in which they are displayed
• Delete them.
Add one or more subreports using this procedure.
Step 1 Select one of the following:
• Show Only Graph—If selected, select a graph type: Line, 2D Bar, 3D Bar, 2D Stacked Bar, or 3D Stacked Bar.
• Show Only Table.
• Show Table along with Graph—If selected, select a graph type: Line, 2D Bar, 3D Bar, 2D Stacked Bar, or 3D Stacked Bar.
Step 2 Select a monitor type.
Step 3 Select one of the following:
• Consider All Elements of the monitor type.
• Group Filter—If you select this option and select a group, only those elements that belong to the selected group are considered for report processing.
• Selected Elements—If you select this option, the list of elements remains empty. Do the following:
– Click Add. The Select Element(s) to add window appears, displaying a list of elements.
– Select one or more elements using the Ctrl and Shift keys to make multiple selections.
– Click Add and then click Close. The selected elements appear in the list.
Step 4 Select attributes from the Available Attributes list and transfer them to the Selected Attributes list.
Step 5 If you checked Selected Elements in Step 3, you can optionally deselect Aggregate Data Across All Elements.
3-42User Guide for Cisco Unified Service Statistics Manager
OL-20784-01

Chapter 3 Using ReportsManaging Reports
Note A maximum of 12 instance-attribute pairs are displayed on line and bar graphs. If you select multiple attributes and you deselect Aggregate Data Across All Elements, some of the instance-attribute pairs might not be displayed.
Step 6 To display data as a percentage distribution for the selected attributes, select Aggregate Data as Percentage of the Selected Attributes.
Note You can select Aggregate Data as a Percentage of the Selected Attributes only if you select the 2D Stacked Bar or 3D Stacked Bar graph type in Step 1.
Step 7 Complete the subreport by:
a. Entering a name in the Subreport Title Field.
b. Clicking Add Subreport. The subreport definition appears in the Added Subreport section, where you can:
– Move it up or down in order by using the arrow keys at the right.
– Select it and delete it by clicking Delete.
Step 8 Repeat steps 1 through 7 until you have added all desired subreports.
Step 9 Select how to aggregate data: by hour, day, week or month.
Step 10 Click Next. The Page 3 window for creating or editing a report appears. See Creating a Report—Page 3 of the Report Wizard (Display, Schedule, and E-Mail Options), page 3-51
Top N Calls Reports
This report type lists top N phones that were used to place a call and were in a call for the longest duration. When creating or editing a Top N Calls report, you can limit the phones that are included (through filtering) and you can limit the report to selected call categories. You can include multiple subreports in your report definition.
Note For default reports of this type, see Using a Top N Calls Report, page 3-24.
In the upper half of this window, define one or more subreports. As you define subreports, they are displayed in the lower half of the window, where you can:
• Change the order in which they are displayed
• Delete them.
Add one or more subreports using this procedure.
Step 1 Select the filter that can best produce the list of phones that you want to include in the report. See Selecting Filters to Retrieve Phones for Reports, page 3-33.
Step 2 Select one of the following:
• Consider All Call Categories.
• Consider Selected Call Categories—If you select this, all categories are displayed; select one.
3-43User Guide for Cisco Unified Service Statistics Manager
OL-20784-01

Chapter 3 Using ReportsManaging Reports
Note Calls are aggregated in the subreport and not listed separately for each call category that you select. To display calls for a particular call category, include that call category in a subreport and title the subreport with the call category name.
Step 3 For Show Top N, select from 1 to 15 to include the desired number of most dialed numbers.
Step 4 Complete the subreport by:
a. Entering a name in the Subreport Title Field.
b. Clicking Add Subreport. The subreport definition appears in the Added Subreport section, where you can:
– Move it up or down in order by using the arrow keys at the right.
– Select it and delete it by clicking Delete.
Step 5 Repeat steps 1 through 4 until you have added all desired subreports.
Step 6 Click Next. The Step 3 window for creating or editing a report appears. See Creating a Report—Page 3 of the Report Wizard (Display, Schedule, and E-Mail Options), page 3-51.
Top N Dialed Numbers Report
The Top N Dialed Numbers report lists the top N phones that received calls across all call categories. When creating or editing a Top N Dialed Numbers report, you can limit the phones that are included (through filtering) and you can limit the call categories. You can include multiple subreports in your report definition.
Note For default reports of this type, see Using a Top N Calls Report, page 3-24.
In the upper half of this window, define one or more subreports. As you define subreports, they are displayed in the lower half of the window, where you can:
• Change the order in which they are displayed
• Delete them.
Add one or more subreports using this procedure.
Step 1 Select the filter that can best produce the list of phones that you want to include in the report. See Selecting Filters to Retrieve Phones for Reports, page 3-33.
Step 2 Select one of the following:
• Consider All Call Categories.
• Consider Selected Call Categories—If you select this, all categories are displayed; select one.
Note For more information, see configuring call classification in User Guide for Cisco Unified Service Monitor 2.3.
Step 3 For Show Top N, select from 1 to 15 to include the desired number of most dialed numbers.
Step 4 (Optional) Select one or more of the following:
3-44User Guide for Cisco Unified Service Statistics Manager
OL-20784-01

Chapter 3 Using ReportsManaging Reports
• Called numbers more than N times—Enter the number.
• Duration longer than N mins—Enter the number of minutes.
Step 5 For Sort Subreport by, select one of the following:
• Call Duration—Sort by length of call.
• Call Count—Sort by number of times called.
Step 6 Complete the subreport by:
a. Entering a name in the Subreport Title Field.
b. Clicking Add Subreport. The subreport definition appears in the Added Subreport section, where you can:
– Move it up or down in order by using the arrow keys at the right.
– Select it and delete it by clicking Delete.
Step 7 Repeat steps 1 through 6 until you have added all desired subreports.
Step 8 Click Next. The Step 3 window for creating or editing a report appears. See Creating a Report—Page 3 of the Report Wizard (Display, Schedule, and E-Mail Options), page 3-51.
Top N Users Report
The Top N Users report type lists top N phones that were used to place a call and were in a call for the longest duration. When creating or editing a Top N Users report, you can limit the number of phones and select only the call categories that you want to see. You can include multiple subreports in your report definition.
Note For default reports of this type, see Using a Top N Users Report, page 3-24.
In the upper half of this window, define one or more subreports. As you define subreports, they are displayed in the lower half of the window, where you can:
• Change the order in which they are displayed
• Delete them.
Add one or more subreports using this procedure.
Step 1 Select the filter that can best produce the list of phones that you want to include in the report. See Selecting Filters to Retrieve Phones for Reports, page 3-33.
Step 2 Select one of the following:
• Consider All Call Categories.
• Consider Selected Call Categories—If you select this, categories are displayed; select one.
Note Calls are aggregated in the subreport and not listed separately for each call category that you select. To display calls for a particular call category, include that call category in a subreport and title the subreport with the call category name.
Step 3 For Show Top N, select from 1 to 15 to include the desired number of users.
3-45User Guide for Cisco Unified Service Statistics Manager
OL-20784-01

Chapter 3 Using ReportsManaging Reports
Step 4 Complete the subreport by:
a. Entering a name in the Subreport Title Field.
b. Clicking Add Subreport. The subreport definition appears in the Added Subreport section, where you can:
– Move it up or down in order by using the arrow keys at the right.
– Select it and delete it by clicking Delete.
Step 5 Repeat steps 1 through 4 until you have added all desired subreports.
Step 6 Click Next. The Step 3 window for creating or editing a report appears. See Creating a Report—Page 3 of the Report Wizard (Display, Schedule, and E-Mail Options), page 3-51.
Top N Performers Report
This report lists instances with the highest or lowest average value for an attribute. You can compare the value of an attribute for up to fifteen instances of a selected monitor type. You can also view the highest and lowest values of the attribute for the instances during the report period. When you define this report, the first step—which is mandatory—is to select a group. (See Step 1.) Groups are user-defined and can be created by a user in the Administrator role.
You can include multiple subreports in your report definition. Including multiple subreports enables you to group together relevant data and divide the report into subsections.
Note For default reports of this type, see Using a Top N Performers Report, page 3-25.
In the upper half of this window, define one or more subreports. As you define subreports, they are displayed in the lower half of the window, where you can:
• Change the order in which they are displayed
• Delete them.
Add one or more subreports using this procedure.
Step 1 Select a group—Select the group that contains the elements or the monitor types that you want to compare.
Step 2 Select the attribute to compare:
a. Select the monitor type from the first list.
b. Select the attribute from the second list.
Step 3 Select the type: Top N or Bottom N.
Step 4 Select the number of bars to display, up to a maximum of 15.
Step 5 Select the values to display:
• High—Selected by default for Top N report type.
• Average—Selected by default for Top N and Bottom N report types.
• Low—Selected by default for Bottom N report type.
Step 6 Select one of the following:
3-46User Guide for Cisco Unified Service Statistics Manager
OL-20784-01

Chapter 3 Using ReportsManaging Reports
• Show Graph only
• Show Table only
• Show both Graph and Table
Step 7 To complete the subreport:
a. Enter a name in the Subreport Title Field.
b. Click Add Subreport. The subreport definition appears in the Added Subreport section, where you can:
– Move it up or down in order by using the arrow keys at the right.
– Select it and delete it by clicking Delete.
Step 8 Repeat steps 1 through 7 until you have added all desired subreports.
Step 9 Click Next. The Step 3 window for creating or editing a report appears. See Creating a Report—Page 3 of the Report Wizard (Display, Schedule, and E-Mail Options), page 3-51.
Traffic Summary Report
A Traffic Summary report provides the distribution of calls belonging to different call categories, over time. When creating or editing a traffic summary report, you can limit the number of phones and select only the call categories that you want to see. You can include multiple subreports in your report definition.
Note For default reports of this type, see Using a Traffic Summary Report, page 3-25.
In the upper half of this window, define one or more subreports. As you define subreports, they are displayed in the lower half of the window, where you can:
• Change the order in which they are displayed
• Delete them.
Add one or more subreports using this procedure.
Step 1 Select the filter that can best produce the list of phones that you want to include in the report. See Selecting Filters to Retrieve Phones for Reports, page 3-33.
Step 2 Select one of the following:
• Consider All Call Categories.
• Consider Selected Call Categories—If you select this, call categories are displayed; select one.
Note For more information, see configuring call classification in User Guide for Cisco Unified Service Monitor 2.3.
Step 3 Complete the subreport by:
a. Entering a name in the Subreport Title Field.
b. Clicking Add Subreport. The subreport definition appears in the Added Subreport section, where you can:
3-47User Guide for Cisco Unified Service Statistics Manager
OL-20784-01
Chapter 3 Using ReportsManaging Reports
– Move it up or down in order by using the arrow keys at the right.
– Select it and delete it by clicking Delete.
Step 4 Repeat steps 1 through 3 until you have added all desired subreports.
Step 5 Click Next. The Step 3 window for creating or editing a report appears. See Creating a Report—Page 3 of the Report Wizard (Display, Schedule, and E-Mail Options), page 3-51.
SLA Capacity Trend Report
This report lists all SLA–attribute pairs that are predicted to violate the SLA threshold in the specified time period.
Step 1 Select the SLAs to be considered while generating the report. You can select multiple SLA names or a single SLA name by selecting one of the following:
• All SLAs—Use the SLA Type filter to select the SLA types. This filter is available only when all SLAs are being considered for the report. Click New to add an SLA type or Edit to edit the existing SLA type.
• Selected SLAs—Select the SLA to be considered from the Available SLAs box and transfer to the Selected SLAs box. Use the Ctrl and Shift keys to make multiple selections. Alternatively, use the Search For box to locate a specific SLA.
Step 2 Complete the Report Options section:
• Hide Resource Column—Select this option if you do not want the Resource column to appear in the report.
• Show instances which will violate in next—This is the forecast period. Any instance predicted to violate the SLA threshold in this time period appears in the report. Any violations outside this forecast period are not considered.
• Use Data for the last—Specify the time period for which data points are to be used for forecasting.
• Maximum number of bars in graph—Specify the maximum number of bars that are to be displayed in the bar graph.
Step 3 Click Next. The Step 3 window for creating or editing a report appears. See Creating a Report—Page 3 of the Report Wizard (Display, Schedule, and E-Mail Options), page 3-51.
SLA Compliance History Report
This report shows how SLAs have been performing in terms of meeting SLA objectives.
3-48User Guide for Cisco Unified Service Statistics Manager
OL-20784-01

Chapter 3 Using ReportsManaging Reports
Step 1 Select the SLAs to be considered while generating the report. You can select multiple SLA names or a single SLA name by selecting one of the following:
• All SLAs—Use the SLA Type filter to select the SLA types. This filter is available only when all SLAs are being considered for the report. Click New to add an SLA type or Edit to edit the existing SLA type.
• Selected SLAs—Select the SLA to be considered from the Available SLAs box and transfer to the Selected SLAs box. Use the Ctrl and Shift keys to make multiple selections. Alternatively, use the Search For box to locate a specific SLA.
Step 2 Complete the Report Options section by specifying the time increment for bars displayed in the graph. For Show Data Broken Down by, select Day, Week, Month, or Quarter.
Step 3 Click Next. The Step 3 window for creating or editing a report appears. See Creating a Report—Page 3 of the Report Wizard (Display, Schedule, and E-Mail Options), page 3-51.
SLA Compliance Matrix Report
This report type presents the compliance summary of selected SLAs.
Step 1 Select the SLAs to be considered while generating the report. You can select multiple SLA names or a single SLA name by selecting one of the following:
• All SLAs—Use the SLA Type filter to select the SLA types. This filter is available only when all SLAs are being considered for the report. Click New to add an SLA type or Edit to edit the existing SLA type.
• Selected SLAs—Select the SLA to be considered from the Available SLAs box and transfer to the Selected SLAs box. Use the Ctrl and Shift keys to make multiple selections. Alternatively, use the Search For box to locate a specific SLA.
Step 2 Complete the Report Options section:
• Hide SLA Type Column—Select this option if you do not want the SLA Type column to be listed in the report.
• Show Icons Instead of Numbers for SLA Compliance Values—Select this option to display icons instead of numbers to depict SLA compliance values.
• Select one or more history periods to display in the report:
– Previous Day—Creates the report based on SLA compliance values of the previous day.
– Previous Week—Creates the report based on SLA compliance values of the previous week.
– Previous Month—Creates the report based on SLA compliance values of the previous month.
– Week to Date—Creates the report based on SLA compliance values of the last seven days, excluding the current day.
– Month to Date—Creates the report based on SLA compliance values collected over the past thirty days, excluding the current day.
– Quarter to Date—Creates the report based on SLA compliance values of the past three months, excluding the current day.
– Year to Date—Creates the report based on data collected over the past year.
3-49User Guide for Cisco Unified Service Statistics Manager
OL-20784-01

Chapter 3 Using ReportsManaging Reports
Step 3 Click Next. The Step 3 window for creating or editing a report appears. See Creating a Report—Page 3 of the Report Wizard (Display, Schedule, and E-Mail Options), page 3-51.
SLA Executive Summary Report
This report type presents a list of SLAs that are sorted based on their performance.
Step 1 Select the SLAs to be considered while generating the report. You can select multiple SLA names or a single SLA name by selecting one of the following:
• All SLAs—Use the SLA Type filter to select the SLA types. This filter is available only when all SLAs are being considered for the report. Click New to add an SLA type or Edit to edit the existing SLA type.
• Selected SLAs—Select the SLA to be considered from the Available SLAs box and transfer to the Selected SLAs box. Use the Ctrl and Shift keys to make multiple selections. Alternatively, use the Search For box to locate a specific SLA.
Step 2 Complete the Report Options section:
• Sort Criterion—Specify the sort (Best/Worst) criteria. Based on this selection, either the best performing SLAs or the worst performing SLAs (among the selected SLAs) will be graphed from left to right.
• Sort Based on—Specify the sort criterion (absolute/delta) to be used when calculating the SLA performance. Absolute implies that the actual compliance values for the SLA over the specified time period will be used for reporting. Delta implies that the difference between the compliance objective and the compliance value for the SLA over the specified time period will be used for reporting.
• Max. No. of SLAs—This is the maximum number of SLAs that will be displayed in the graph. The maximum supported number is 20.
• Show All SLAs in Table—Select or clear the check box to enable or disable the option to show all SLAs in the table. If the check box is clear, then only details of SLAs present in the graph are displayed in the table.
Step 3 Click Next. The Step 3 window for creating or editing a report appears. See Creating a Report—Page 3 of the Report Wizard (Display, Schedule, and E-Mail Options), page 3-51.
SLA Health Summary Report
The SLA Health Summary report shows all SLA instances from worst to best in terms of violation over a specified time period.
In the upper half of this window, define one or more subreports. As you define subreports, they are displayed in the lower half of the window, where you can:
• Change the order in which they are displayed
• Delete them.
Add one or more subreports using this procedure.
3-50User Guide for Cisco Unified Service Statistics Manager
OL-20784-01

Chapter 3 Using ReportsManaging Reports
Step 1 Select the SLA.
Step 2 To include all instances, select Show All Instances.
Step 3 To display a summary bar graph, select Show Graph Along with Table.
Step 4 Select the columns to be displayed in the report.
Step 5 Complete the subreport by:
a. Entering a name in the Subreport Title Field.
b. Clicking Add Subreport. The subreport definition appears in the Added Subreport section, where you can:
– Move it up or down in order by using the arrow keys at the right.
– Select it and delete it by clicking Delete.
Step 6 Repeat steps 1 through 5 until you have added all desired subreports.
Step 7 Complete the Report Options section:
• Show Only Rows with Duration Greater than—Select to view only those violations greater than the specified time period. This option is applicable only for subreports added without selecting the Show All Instances option.
• Flag Rows with Duration Greater than—Select to flag rows in the generated report table based on the specified criteria.
• Maximum Number of Entries to Be Displayed in Table—Enter the maximum number of instances to be displayed in the table.
Step 8 Click Next. The Step 3 window for creating or editing a report appears. See Creating a Report—Page 3 of the Report Wizard (Display, Schedule, and E-Mail Options), page 3-51.
Creating a Report—Page 3 of the Report Wizard (Display, Schedule, and E-Mail Options)
On the Create Report Screen (Step 3 of 3), complete this procedure.
Step 1 Under Report Display Options, enter:
• Number of Rows per Page (applicable for tables)—Enter the number of rows to be displayed on a single page.
• Show Report Details at—Select this check box to display report details. Additionally, specify the location (top or bottom of the page) to display the report details.
• Show Comments at—Select this check box to display global comments and report instance comments on the report. Additionally, specify the location (top or bottom of the page) to display comments. If you add text to the Global Comments field, this option is selected automatically. If you do not select this option but specify comments for a report instance, then the selections made on the Report Instance Comments window are automatically applied here.
3-51User Guide for Cisco Unified Service Statistics Manager
OL-20784-01
Chapter 3 Using ReportsManaging Reports
• Global Comments—Use this field to type in any information or content that you want to associate with the report. If you select the Show Comments at option, comments that you enter here are displayed on all instances of the report. Global comments always precede report instance comments.
• Select the font size for display of comments. Click URL Tag to enclose URLs that you include in comments in tags. The URL tags cause hyperlinks for URLs to be created in report comments.
Step 2 Under E-Mail Options enter:
• Enter E-Mail Address—Specify the e-mail address to send the report to via e-mail. Additionally, you can select the format in which the report needs to be sent from the list. Currently, HTML and PDF formats are supported.
• Click Add to add the e-mail address and e-mail format.
All applicable e-mail addresses and their associated e-mail formats are listed in the E-Mail Addresses box. Repeat the procedure to add more e-mail addresses and mail preferences.
Step 3 Select the schedule options:
a. Select one of these times to generate the report:
– Scheduled—This option saves the report in the system and schedules it for generation based on the report frequency.
– On Demand—Displays the generated report based on the specified inputs. When selected, additional fields become accessible; from them, select either a predefined time period from the list or use the From and To fields to define any other period.
b. Select from the Schedule list the schedule during which the data that you want to include was recorded:
– No Filter—Any time.
– 24x7—24 hours a day and 7 days a week.
– Business Hours—9:00 a.m. to 5:00 p.m., Monday through Friday.
Note You can define additional schedules. You can edit a schedule by clicking Edit (see Editing a Schedule When Configuring Custom Graphs, Reports, and SLAs, page 5-17) or create a new schedule by clicking New (see Adding a Schedule When Configuring Custom Graphs, Reports, and SLAs, page 5-17).
c. Select the number of days to include in the report from the Report Period list.
Note This list is not available for SLA Capacity Trend, SLA Compliance Matrix, and Capacity Trend report types.
d. Select how often to generate the report from Report Frequency: daily, weekly, or monthly.
e. Select one of the following sharing options:
– Share This Report with Everybody
– Share This Report with My User Group
Note User groups correspond to user roles. All users with the same role form a user group.
– Do Not Share This Report
3-52User Guide for Cisco Unified Service Statistics Manager
OL-20784-01

Chapter 3 Using ReportsManaging Reports
f. To generate this report immediately, select the Generate This Report Immediately After Adding to the Schedule check box, and then click Generate.
Editing a Report See the following topics:
• Editing a Report—Page 1: Updating Initial Report Details, page 3-53
• Editing a Report—Page 2: Updating Report Type-Specific Details, page 3-53
• Editing a Report—Page 3: Updating Display, E-Mail, and Schedule Options, page 3-54
Editing a Report—Page 1: Updating Initial Report Details
Step 1 Select the Reports tab.
Step 2 In the table, select a check box for a report and click Edit. The Edit (Step 1 of 3) page appears.
Step 3 Update either of the following:
• Name—Unique name for the report.
• Contact Information—Specify the contact information of the report owner; for example, Contact number, e-mail address, and so on.
Step 4 Select a report type from the Report Type list.
Note The report type that you select determines which options are presented on Page 2. For a list of each report type and a description, see Table 3-6.
Step 5 Click Next. Page 2 of the report wizard appears. See Editing a Report—Page 2: Updating Report Type-Specific Details, page 3-53.
Editing a Report—Page 2: Updating Report Type-Specific Details
When you edit a report, the data that appears on page 2 of the report wizard varies with the report type that you selected on page 1. These topics describe performing step 2 of the report wizard:
• Call Failure Summary Report, page 3-33
• Call Quality Summary Report, page 3-34
• Calls To/From Specified Number Report, page 3-35
• Capacity Trend Report, page 3-36
• Cause Code Analysis Report, page 3-37
• Custom Graph Report, page 3-38
• Group Aggregation Report, page 3-40
• Instance Aggregation Report, page 3-41
3-53User Guide for Cisco Unified Service Statistics Manager
OL-20784-01

Chapter 3 Using ReportsManaging Reports
• Time Aggregation Report, page 3-42
• Top N Dialed Numbers Report, page 3-44
• Top N Calls Reports, page 3-43
• Top N Users Report, page 3-45
• Top N Performers Report, page 3-46
• Traffic Summary Report, page 3-47
• SLA Capacity Trend Report, page 3-48
• SLA Compliance History Report, page 3-48
• SLA Compliance Matrix Report, page 3-49
• SLA Executive Summary Report, page 3-50
• SLA Health Summary Report, page 3-50.
Editing a Report—Page 3: Updating Display, E-Mail, and Schedule Options
Step 3 of the report wizard for editing a report is similar to step 3 when creating a report. For more information, see Creating a Report—Page 3 of the Report Wizard (Display, Schedule, and E-Mail Options), page 3-51.
Deleting a Report
Step 1 Select the Reports tab.
Step 2 In the table, select one or more check boxes for reports and click Delete. A confirmation window is displayed.
Step 3 Click OK.
.
3-54User Guide for Cisco Unified Service Statistics Manager
OL-20784-01

User OL-20784-01
C H A P T E R 4
Using Custom Graphs• Getting Started with Custom Graphs, page 4-1
• Creating Custom Graphs, page 4-1
• Understanding and Interacting with Custom Graphs, page 4-8
Getting Started with Custom GraphsCustom graphs enable you to generate graphs for elements that are monitored by Service Statistics Manager. Custom graphs offer flexibility. You select a combination of monitor types, monitored elements, and attributes to correlate data effectively. For example, you can create graphs with data from:
• A single monitor type, comparing one or more attributes across monitored elements.
• Multiple monitor types, comparing a single attribute from each, but viewing the statistics from multiple sites.
Custom graphs that focus on a single monitor type enable you to view raw data for the previous day, for a single monitor type. See Creating a Graph for a Single Monitor Type, page 4-6.
Custom graphs that focus on multiple monitor types enable you to compare data across sites. See Creating Graphs for Multiple Monitor Types, page 4-7.
Creating Custom GraphsOn the Custom Graphs tab, you can select from the following format options for creating your graph:
• Line Graphs—Most commonly used.
• Area Graphs—Use when creating a graph for a single monitored element and a single attribute.
• X-Y Graphs—Use to correlate two metrics.
• Top N Graphs—Compare top N or bottom N elements for a single monitor type.
Creating Line GraphsLine graphs are the most common type of graphs that plot linear relationships.
4-1Guide for Cisco Unified Service Statistics Manager

Chapter 4 Using Custom GraphsCreating Custom Graphs
Figure 4-1 Line Graph Icon
Step 1 Select the Custom Graphs tab.
Step 2 Select the line graph icon as the graph type.
Step 3 Select a group filter.
Step 4 Select one or more monitor types from the Monitor Type list.
Step 5 Click Next. One ore more Monitor Element lists appear, showing elements available for each monitor type that you selected.
Step 6 Select monitor elements.
Step 7 Click Apply. The Custom Graphs (Line Graphs) page appears. A list of attributes is displayed for each monitor type that you selected in Step 5.
Step 8 Select the attributes to plot.
Step 9 If you selected only one attribute, you can also select one or more indicators to display the minimum, maximum, and average values for the period. For each indicator that you select, a line is displayed on the graph.
Step 10 From the Schedule list, select the schedule during which the data that you want to include was recorded:
• No Filter—Any time.
• 24x7—24 hours a day and 7 days a week.
• Business Hours—9:00 a.m. to 5:00 p.m., Monday through Friday.
Note You can define additional schedules. Create a new schedule by clicking New or edit a schedule by clicking Edit. (See Adding a Schedule When Configuring Custom Graphs, Reports, and SLAs, page 5-17 and Editing a Schedule When Configuring Custom Graphs, Reports, and SLAs, page 5-17.)
Step 11 Select one of the following as the graph option:
• Show All Attributes on a Single Graph—All attributes that you select are plotted on one graph.
• Show Each Monitor Element on a Separate Graph—If you select more than one element, each element is plotted on a separate graph.
• Show Each Attribute on a Separate Graph—If you select more than one attribute, each attribute is plotted on a separate graph.
Step 12 Click Generate Graph. A graph appears on the lower part of the page. (If you created multiple graphs, view them by scrolling down.)
Step 13 (Optional) You can also:
• Change the time window that’s being displayed. by using the paging icons to move the time window backward or forward.
• Change the attributes that are being displayed.
4-2User Guide for Cisco Unified Service Statistics Manager
OL-20784-01
Chapter 4 Using Custom GraphsCreating Custom Graphs
• Perform other functions using the icons located to the right of the graph. For more information, see Understanding and Interacting with Custom Graphs, page 4-8.
Creating Area GraphsArea graphs are specialized line graphs. You can use them to plot a graph for only a single instance and a single attribute.
Figure 4-2 Area Graph Icon
Step 1 Select the Custom Graphs tab.
Step 2 Select the area graph icon as the graph type.
Step 3 Select a group filter.
Step 4 Select one or more monitor types from the Monitor Type list.
Step 5 Click Next. One ore more Monitor Element lists appear, showing elements available for each monitor type that you selected.
Step 6 Select monitor elements.
Step 7 Click Apply. The Custom Graphs (Area Graph) page is displayed.
Step 8 Select the attributes to plot. Separate attributes are available for each selected monitor.
Step 9 From the Schedule list, select the schedule during which the data that you want to include was recorded:
• No Filter—Any time.
• 24x7—24 hours a day and 7 days a week.
• Business Hours—9:00 a.m. to 5:00 p.m., Monday through Friday.
Note You can define additional schedules. Create a new schedule by clicking New or edit a schedule by clicking Edit. (See Adding a Schedule When Configuring Custom Graphs, Reports, and SLAs, page 5-17 and Editing a Schedule When Configuring Custom Graphs, Reports, and SLAs, page 5-17.)
Step 10 Select one of the following as the graph option:
• Show All Attributes on a Single Graph—All attributes that you select are plotted on one graph.
• Show Each Monitor Element on a Separate Graph—If you select more than one element, each element is plotted on a separate graph.
• Show Each Attribute on a Separate Graph—If you select more than one attribute, each attribute is plotted on a separate graph.
Step 11 Click Generate Graph. A graph appears in the lower half of the page. (If you created multiple graphs, view them by scrolling down.)
4-3User Guide for Cisco Unified Service Statistics Manager
OL-20784-01

Chapter 4 Using Custom GraphsCreating Custom Graphs
Step 12 (Optional) You can also:
• Change the time window that’s being displayed. by using the paging icons to move the time window backward or forward.
• Change the attributes that are being displayed.
• Perform other functions using the icons located to the right of the graph. For more information, see Understanding and Interacting with Custom Graphs, page 4-8.
Creating X-Y GraphsUse an X-Y graph to show a correlated view of two metrics. An X-Y graph is especially useful for related metrics where the dependency is not very clearly known. Displaying this graph over a period of time can give you a visual representation of the relationship. A good example for online stores might be to correlate a business metric (such as dollars per hour) with web server performance. This allows IT groups to justify performance improvements on IT hardware and software.
All such scenarios, where the relationship between two metrics needs to be qualified, are appropriate for X-Y graphs.
Figure 4-3 X-Y Graph Icon
Step 1 Select the Custom Graphs tab.
Step 2 Select the X-Y graph icon as the graph type.
Step 3 Select a group filter.
Step 4 Select up to two monitor types from the Monitor Type list.
Step 5 Click Next. Two Monitor Element lists appear, showing elements available for the monitor type that you selected.
Step 6 Select a monitored element for the X axis and another for the Y axis.
Step 7 Click Apply.
Step 8 On the Custom Graphs (X-Y Graphs) page, select one attribute to plot for the X axis and one attribute to plot for the Y axis.
Step 9 From the Schedule list, select the schedule during which the data that you want to include was recorded:
• No Filter—Any time.
• 24x7—24 hours a day and 7 days a week.
• Business Hours—9:00 a.m. to 5:00 p.m., Monday through Friday.
Note You can define additional schedules. Create a new schedule by clicking New or edit a schedule by clicking Edit. (See Adding a Schedule When Configuring Custom Graphs, Reports, and SLAs, page 5-17 and Editing a Schedule When Configuring Custom Graphs, Reports, and SLAs, page 5-17.)
4-4User Guide for Cisco Unified Service Statistics Manager
OL-20784-01

Chapter 4 Using Custom GraphsCreating Custom Graphs
Step 10 Click Generate Graph(s). A graph appears on the bottom half of the page. (If you created multiple graphs, view them by scrolling down.)
Step 11 Optional) You can also:
• Change the time window that’s being displayed. by using the paging icons to move the time window backward or forward.
• Change the attributes that are being displayed.
• Perform other functions using the icons located to the right of the graph. For more information, see Understanding and Interacting with Custom Graphs, page 4-8.
Creating Top N Graphs A Top N graph is a Pareto bar chart used to compare top N or bottom N elements.
Figure 4-4 Top N Graph Icon
Top N graphs compare monitored elements based on a common measurement (a single attribute). The resulting Pareto bar chart displays the elements with the highest or lowest average in order based on the common measurement. A table under the graph lists the elements that correspond to the bars and provides links to individual graphs.
Step 1 Select the Custom Graphs tab.
Step 2 Select the Top N graph icon as the graph type.
Step 3 Select a group filter.
Step 4 Select one monitor type.
Step 5 Click Next. The system populates the attributes from which to select.
Step 6 Select one attribute.
Step 7 Click Apply. The Custom Graphs (Top N Graph) page opens.
Step 8 Select the graph options:
• Graph Type—Select Top N or Bottom N.
• Number of Bars—Select from 1 to 15.
• Duration—Enter the number and select Days or Hours.
Note Depending on the monitor type that you selected, data is generally available for 30 to 90 days. For more information, see Understanding Data Rollup and Data Retention, page 3-12.
• Values to Be Displayed—Select one:
– Average and High
– Average and Low
4-5User Guide for Cisco Unified Service Statistics Manager
OL-20784-01

Chapter 4 Using Custom GraphsCreating Custom Graphs
Step 9 Select a graph preference—2 Dimensional or 3 Dimensional.
Step 10 From the Schedule list, select a schedule during which the data that you want to include was recorded:
• No Filter—Any time.
• 24x7—24 hours a day and 7 days a week.
• Business Hours—9:00 a.m. to 5:00 p.m., Monday through Friday.
Note You can define additional schedules. Create a new schedule by clicking New or edit a schedule by clicking Edit. (See Adding a Schedule When Configuring Custom Graphs, Reports, and SLAs, page 5-17 and Editing a Schedule When Configuring Custom Graphs, Reports, and SLAs, page 5-17.)
Step 11 Click Generate Graph.
Note The paging icons that enable you to move the time window backward or forward are not available for Top N graphs.
Using the List All Button in a Top N Graph Display
Most monitored categories, such as Availability and Utilization, contain numerous devices, interfaces, and services. Clicking List All at the bottom of the Top N table expands the table to list all elements that comprise the selected category. A list of sources used to compile the graph is displayed. The List All feature allows you to generate a maximum of 100 items per page. You can also generate individual graphs from each of these items.
Using the Description Table in a Top N Graph Display
The description table located below the graph lists the elements of the Top N graph. The Num column provides a link from which you can open the individual graph for the element. To modify the graph, see Using the Attributes Tab to Update a Graph, page 4-10 and Understanding and Interacting with Custom Graphs, page 4-8.
Do the following to view a stacked graph for any of the listed instances.
Step 1 Select the box corresponding to the monitored elements.
Step 2 Click Show Graphs.
Creating a Graph for a Single Monitor Type
Step 1 Select the Custom Graphs tab.
Step 2 Select the graph type.
Step 3 Select a group filter.
4-6User Guide for Cisco Unified Service Statistics Manager
OL-20784-01

Chapter 4 Using Custom GraphsCreating Custom Graphs
Choosing a filter limits your choices to elements in the selected group and provides a means of organizing your data. Choosing No Filter enables you to generate a graph from all elements in the system, regardless of whether or not they are in a group.
Step 4 Select only one monitor type.
Step 5 Click Next. The Monitor Element lists appear, showing elements available for the monitor type that you selected.
Step 6 Select the elements to monitor, and click Apply. The Custom Graphs page is displayed.
Step 7 Select the time period for which you want to plot data from one of the following:
• Show Graph for the Last—Select from 1 hour up to 3 months.
• From—Select a time range using the To and From lists. This enables you to select a particular day and hour or a particular duration of time, such as the last 4 hours.
Step 8 For each monitored element, select the attributes to graph.
The attributes that are displayed vary depending on the monitor type that you selected. You can plot up to 12 attributes per graph. However, you are limited to 2 units of measure; for example, number (#) and milliseconds (ms).
Step 9 If you selected only one attribute, you can also select one or more indicators to display the minimum, maximum, and average values for the period. For each indicator that you select, a line is displayed on the graph.
Step 10 Select one of the following as the graph option:
• Show All Attributes on a Single Graph—All attributes that you select are plotted on one graph.
• Show Each Monitor Element on a Separate Graph—If you select more than one element, each element is plotted on a separate graph.
• Show Each Attribute on a Separate Graph—If you select more than one attribute, each attribute is plotted on a separate graph.
Step 11 Click Generate Graph. The graph displays attributes selected. (If you created multiple graphs, view them by scrolling down.)
Step 12 Optional) You can also:
• Change the time window that’s being displayed. by using the paging icons to move the time window backward or forward.
• Change the attributes that are being displayed.
• Perform other functions using the icons located to the right of the graph. For more information, see Understanding and Interacting with Custom Graphs, page 4-8.
Creating Graphs for Multiple Monitor Types
Step 1 On the Custom Graphs tab, select a graph type.
Step 2 Select a group filter.
Choosing a filter limits your choices to elements in the selected group and provides a means of organizing your data. Choosing No Filter enables you to generate a graph from all elements in the system, regardless of whether they are in a group or not.
4-7User Guide for Cisco Unified Service Statistics Manager
OL-20784-01

Chapter 4 Using Custom GraphsUnderstanding and Interacting with Custom Graphs
Step 3 Select more than one monitor type and click Next. The Monitor Element area appears, displaying one list of elements for each monitor type that you selected.
Step 4 Select elements from each Monitor Element list and click Apply. The Custom Graph page appears.
Step 5 Select the time period for which you want to plot data from one of the following:
• Show Graph for the Last—Select from 1 hour up to 3 months.
• From—Select a time range using the To and From lists. This enables you to select a particular day and hour or a particular duration of time, such as the last 4 hours.
Step 6 Select appropriate options in the Attributes section.
Select the attributes that you want to graph for each instance and monitor. Attributes available vary depending on the monitor types that you selected. As with graphs for single monitor types, you can plot up to 12 attributes per graph and you are limited to 2 units of measure; for example, number (#) and milliseconds (ms).
Step 7 If you selected only one attribute, you can also select one or more indicators to display the minimum, maximum, and average values for the period. For each indicator that you select, a line is displayed on the graph.
Step 8 Select one of the following as the graph option:
• Show All Attributes on a Single Graph—All attributes you select are plotted on one graph.
• Show Each Monitor Element on a Separate Graph—If you selected more than one element, each element is plotted on a separate graph.
• Show Each Attribute on a Separate Graph—If you select more than one attribute, each is plotted separately on separate graphs.
Step 9 Click Generate Graph. A graph for one instance is displayed on the lower part of the page.
Step 10 Use arrow keys to view additional graphs, one per instance.
You can dynamically change the attributes displayed in the graph; see Using the Attributes Tab to Update a Graph, page 4-10. You can also use the icons located to the right of the graph to perform other graphing functions. See Understanding and Interacting with Custom Graphs, page 4-8.
Understanding and Interacting with Custom GraphsMost graphs are displayed in a tabbed area of either a Graph Display page or a Custom Graphs page. X-Y graphs provide the same information and flexibility without using a tabbed display. You can interact with and customize graphs from three areas, Graph, Attributes, and Monitor Information:
• Graph—Displays the detailed graph that you generated or that you launched, for example, from a thumbnail on the Views tab. If there is no data for the selected time period, No Data Available is displayed over an inverted triangle instead.
To the right of the graph are icons that enable you to do more. (See Table 4-1.) The available icons change depending on the type and status of the graph.
4-8User Guide for Cisco Unified Service Statistics Manager
OL-20784-01

Chapter 4 Using Custom GraphsUnderstanding and Interacting with Custom Graphs
At the bottom of the page, there are three buttons:
– Generate Graph(s)—Generates graphs after you have selected options.
– Add Graph—Adds another graph to the set of graphs that are already plotted.
– Add All to View—Adds all displayed graphs to a view. See Adding a Multiple-Graph (MG) Display to a View, page 4-10.
• Attributes—Enables you to change the data displayed for the element by changing the attributes, or the start and end time of the current graph. Data is available for the last 30 to 90 days (see Understanding Data Rollup and Data Retention, page 3-12). You can use the options on the Attributes tab to: view data that is not currently part of the display; or, focus on a specific type of data to analyze and isolate a problem. See Using the Attributes Tab to Update a Graph, page 4-10.
Note For an X-Y graph, attributes are displayed below the graph.
• Monitor Information—Displays pertinent information about monitored elements. See Viewing Instance Details on the Monitor Information Tab, page 4-11.
Note For an X-Y graph, monitor information is displayed at the top of the graph.
When you select two monitored elements—each of a different monitor type—and include them in a single graph:
• Raw data might be plotted for one element and rate data might be plotted for the other element. This can happen due to differences in raw data retention periods.
• Rate data can be plotted for both elements. In this case, Condensed is displayed on the Y axis of the graph.
Table 4-1 Additional Options on the Graph Tab
Icon Reference
Zooming In and Out, page 4-11
Exporting to Excel, page 4-12
Adding New Monitors to a Graph, page 4-12
Viewing More Information, page 4-12
Adding a Specific Graph to a View, page 4-13
Deleting a Graph from a Multiple-Graph Display, page 4-13
4-9User Guide for Cisco Unified Service Statistics Manager
OL-20784-01

Chapter 4 Using Custom GraphsUnderstanding and Interacting with Custom Graphs
Using the Attributes Tab to Update a GraphOn Custom Graph and Graph Display pages, the Attributes tab enables you to dynamically change the statistical data displayed in the graph that you are viewing. The attributes that are displayed vary based on the monitor type. (For an X-Y graph, attributes are displayed below the graph instead of on a tab.)
Step 1 Select up to twelve attributes and two units of measure.
Step 2 If you are updating a line graph and have selected only one attribute, you can also select one or more indicators. An indicator introduces an additional line that shows the minimum, maximum, or average value for the period, depending on which you select.
Step 3 Click Generate Graph. The graph redisplays and includes data for the attributes and units of measure that you selected.
Adding a Multiple-Graph (MG) Display to a ViewYou can add a set of graphs that you always want to see together to a view. In this case, MG is displayed to the left of the thumbnail link on the Views tab.
Note You can also add a single graph to a view using this procedure. If, in Step 1, you create one graph instead of multiple graphs, you can add the graph to a view; MG is not displayed with the thumbnail.
Step 1 Create multiple graphs. (You can do so from the Custom Graphs tab. Alternatively, while viewing a graph, you can add graphs, beginning by clicking Add Graph on a Custom Graph or Graph Display page.)
Step 2 At the bottom of the Custom Graph or Graph Display page, click Add All to View. The Add This Graph to View window appears.
Step 3 In the Add This Graph to View window, fill in these fields:
• Graph Name—Enter a name.
• Graph Duration—Select from 1 hour to 3 months.
• Add to View—Select the view to which you want to add graphs. (To add the graphs to a new view, select Create New View.)
Step 4 Click Add to View. If you selected an existing view, a message is displayed and the graph is now part of the selected view; click OK. If you selected Create New View, the Create View window appears:
a. Fill in these fields:
– View Title—Enter a title.
– Layout Type—Select the number of columns to display.
– Update—Select one: Hourly, Daily, Manually.
b. Click Add to View. A confirmation window appears.
c. Click OK.
4-10User Guide for Cisco Unified Service Statistics Manager
OL-20784-01

Chapter 4 Using Custom GraphsUnderstanding and Interacting with Custom Graphs
Viewing Instance Details on the Monitor Information Tab On Custom Graph and Graph Display pages, the Monitor Information tab provides more information for the monitored element. A description table lists pertinent information for the selected element. In some cases, the table contains these items:
• Device IP/device name—Device IP address or DNS name.
• Instance name—Device IP address or name plus any additional detail.
• Monitor version—Version; usually 1.0.
• Port or card name—Name or None.
• Source agent—IP address where the SSM agent is collecting data—on an Operations Manager or Service Monitor system—and the port being used.
• Collect data—True or false.
• Statistics poll interval—Number of seconds between start of SSM agent polling.
• Statistics poll timeout—Number of seconds after which the SSM agent times out on the polling request.
Other information—such as gateway type, trunk type, or trunk name—can be displayed depending on the monitor type.
Using Additional Graphing FunctionsWhen a graph is generated, you will notice a series of icons located to the right of the graph. These are additional options that you can select:
• Zoom In/Out
• Add New Monitors to This Graph
• Add This Graph to View
• Delete Graph
In addition, to view the exact value for any point in the graph, move the cursor to that point. Service Statistics Manager displays the value as a tool tip.
Zooming In and Out
Use the Zoom function to adjust the vertical axis of the graph for viewing data more closely or from a higher level. The left axis is Y1 and the right axis is Y2.
Figure 4-5 Zoom In/Out Icon
Step 1 Click the Zoom icon to display a separate window.
Step 2 Based on the values used to plot the graph, enter the maximum and minimum values to use to zoom the graph. By default, the graphs are auto-scaled.
4-11User Guide for Cisco Unified Service Statistics Manager
OL-20784-01

Chapter 4 Using Custom GraphsUnderstanding and Interacting with Custom Graphs
Step 3 Click the Zoom icon to view results.
You can view only one axis change at a time and, the Zoom option does not permanently change the graph.
The browser instance might sometimes cache the zoomed view of a graph. Using the browser navigation buttons can result in the display of cached pages. To avoid this, use the navigation options provided within Service Statistics Manager.
Exporting to Excel
Use the Export to Excel icon to export all data to an Excel file for viewing outside Service Statistics Manager. This icon launches a File Download window from which you can select:
• Open—Launch the Excel application and display all data in the .csv file.
• Save—Save the .csv file to the local disk.
Note In some systems or browsers, launching Excel directly might not work for Call Volume monitor types due to file length restrictions. In this case, save the file on the local disk before opening it.
Figure 4-6 Export to Excel Icon
Adding New Monitors to a Graph
Use the Add New Monitors to This Graph icon to add new monitors to a graph.
When you click this icon, the Custom Graph page appears. Follow the same procedure as creating a Custom Graph; see Creating Custom Graphs, page 4-1.
Figure 4-7 Add New Monitors to This Graph Icon
Viewing More Information
You can use the More Information icon to see any additional information for a monitor; for example, whether any errors have occurred.
Figure 4-8 More Information Icon
This icon launches the More Information for Graph table, which provides information about the graph and the possible error. If the table contains more than 25 rows, click Next to bring up additional items.
4-12User Guide for Cisco Unified Service Statistics Manager
OL-20784-01

Chapter 4 Using Custom GraphsUnderstanding and Interacting with Custom Graphs
Adding a Specific Graph to a View
Use the Add This Graph to View icon to add a particular graph to a view.
Figure 4-9 Add This Graph to View Icon
This icon launches the Add This Graph to View popup window.
Step 1 Open the graph to be added to an existing view.
Step 2 On the Graph Display page, click the Add This Graph to View icon to the right of the graph.
Step 3 Enter the following information in the Add Graph to View page:
• Graph Name
• Graph Duration
• Add to View—Select the view to which you want to add the graph. If you select Create New View, the Create View page displays to allow you to add a new view.
Step 4 Click Add to View. The graph is now part of the selected view.
Step 5 On the Views tab, select the view to which you added the graph. The graph now appears in the view.
Deleting a Graph from a Multiple-Graph Display
This icon is displayed only when there are two or more graphs on the Custom Graph or Graph Display page. You can use this icon to delete a graph from a multiple-graph view.
Figure 4-10 Delete Icon
Graphing Restrictions and LimitationsWhen creating graphs, keep the following limitations in mind:
• Only twelve attributes and two measurement types can be included for a line graph.
For example, while creating a line graph, if two statistics are measured in percentage and two in seconds, then all four appear in the graph. Service Statistics Manager labels both Y axes, Y1 and Y2, each with on unit of measure, supporting two measurement types in each graph. However, if you have three statistics, one measured in percentage, one measured in units, and one measured in time, an error message appears and the graph does not display.
• The graph displays the NO_DATA image (see Figure 2-1) when there are no data available for the total graph period.
• Due to the graphing tick policy, sometimes thumbnails may show 120% as the Y-axis maximum value (because the multiplication factor is 40), but the actual graph may show 100% as the maximum Y-axis value.
4-13User Guide for Cisco Unified Service Statistics Manager
OL-20784-01

Chapter 4 Using Custom GraphsUnderstanding and Interacting with Custom Graphs
4-14User Guide for Cisco Unified Service Statistics Manager
OL-20784-01

User OL-20784-01
C H A P T E R 5
Managing SLAs and Monitoring ComplianceNote If you have a Premium license, an SLA tab is available from Service Statistics Manager.
Using the SLA tab, you can define service level agreements (SLAs) and measure and verify them based on collected statistics. This section includes:
• Getting Started with SLAs, page 5-1
• Using the Compliance Matrix, page 5-2
• Using SLA Administration to Manage SLAs, page 5-8
Getting Started with SLAsYou can create SLAs to measure any attributes of elements managed by Service Statistics Manager. However, to do so, you must have the privilege to manage SLAs, which also enables you to update and delete them. For more information, see Using SLA Administration to Manage SLAs, page 5-8.
An SLA definition includes an SLA type that specifies the monitor types and attributes to measure in the SLA. An SLA also includes the following:
• Instance-Attribute pairs—Each pair includes a monitored element and an attribute to measure.
• Service-level objectives—For each instance-attribute pair, specifies:
– Value—Acceptable value or range of values for the attribute.
– Duration—Amount of time for which the value can remain outside of the acceptable range before being considered in violation.
– Weight—Relative importance of the measurements for this instance-attribute pair compared with others in the SLA. The weight is used when computing the weighted average percent compliance of all service-level objectives. (Service Statistics Manager compares the result of the computation with the SLA compliance objective.)
Note You can specify value, duration, and weight individually, for each instance-attribute pair, or use the same value, duration, and weight for all instance-attribute pairs in the SLA.
5-1Guide for Cisco Unified Service Statistics Manager

Chapter 5 Managing SLAs and Monitoring ComplianceUsing the Compliance Matrix
• SLA compliance objective—The expected average percent compliance. To meet the SLA compliance objective, when weighted and averaged, the number of data points in violation over the total number of data points for each service-level objective must be greater than or equal to the SLA compliance objective.
When you define SLAs, Service Statistics Manager computes SLA compliance after the end of each day; computation occurs at 00:30 daily. For example, the computation of compliance for February 18, 2008 becomes available after 12:30 a.m. on February 19, 2008. You can review the results of compliance computations on the Compliance Matrix page. For more information, see Using the Compliance Matrix, page 5-2.
Some SLA management tasks can affect the data that goes into compliance calculations:
• Adding an SLA:
– If an SLA is added in the middle of the month, month-to-date compliance includes only the days for which compliance has been calculated.
– Irrespective of the exact time that you create an SLA, when computing compliance, Service Statistics Manager includes all data points for the day. However, violation records—if any—are available immediately after SLA creation.
• Updating an SLA—Entering new values for SLA compliance and service-level objectives does not affect previously calculated values. New calculations are based on the current values. However, on all pages that display the results of compliance calculations, the current value of the objective and threshold is shown even when some calculations were made using older values.
• Selecting a schedule for an SLA—If an SLA uses a schedule other than the full day schedule, then the number of violated points from the calculation might not match the number of violated points illustrated on the Violation Details page.
The following also affect calculations:
• In case of server restart, the number of violated points in violation details might not match the number of violated points used in the calculation.
• For values not calculated, Service Statistics Manager displays a dash (-). The dash is displayed when there is a gap between the time of SLA creation and calculations that are made the next day.
• NO DATA data points are not considered in calculations.
• NO RESPONSE data points are considered as violations.
Using the Compliance MatrixThe compliance matrix—displayed when you click the SLA tab—provides a quick visual indication of the compliance of all SLAs, currently, and for the previous day, week-, month-, quarter-, and year-to-date. For each time period, an icon indicates status: a green icon indicates no violations and a red icon indicates that a service-level threshold violation has occurred at some level of the SLA.
The compliance matrix displays all top-level SLAs, those that include other SLAs (nested SLAs) and those that stand alone. From the compliance matrix that is initially displayed on the SLA tab, you can open additional compliance matrixes that similarly provide a quick visual status of instance-attribute pairs in an SLA or of SLAs (in a nested SLA). You can continue to drill down to see more detailed information, such as instance-attribute pair violations for an SLA (on the SLA Details page) and violation data for an instance-attribute pair over the past 24 hours (on the Element Details page).
Table 5-1 describes the compliance matrix and the links that you can use to obtain relevant data. Table 5-2 lists the icons displayed on the compliance matrix.
5-2User Guide for Cisco Unified Service Statistics Manager
OL-20784-01

Chapter 5 Managing SLAs and Monitoring ComplianceUsing the Compliance Matrix
Table 5-1 Compliance Matrix Links
Column Description/Action
SLA Name of the SLA. Click it to launch a compliance matrix for the SLA. See Viewing the Compliance Matrix for a Specific SLA, page 5-4.
Type One of these:
• Dash (-)—Displayed for a nested SLA.
• Name of the SLA type.
Details Click the icon to open the SLA Details page. See Viewing SLA Details (Compliance Matrix Details Column), page 5-5.
Current Status Reflects real-time violations, if any. Displays one of the following:
• Green icon—No violations.
• Red icon—A service-level threshold violation has occurred at some level of the SLA; click to launch the Violation Details page. See Viewing Violation Details (Compliance Matrix Current Status Column), page 5-6.
• Dash (-)—Compliance has not been calculated yet or is not available.
History Click the icon to open an SLA Compliance History Report page from which you can generate bar charts for different periods (depending on the data that has been collected to date). See Using an SLA Compliance History Report, page 3-27.
Objective Expected average percent compliance for the SLA as a whole.
Previous Day Compliance values as of end of previous day. Displays one of the following:
• Green icon—No violations.
• Red icon—A service-level threshold violation has occurred at some level of the SLA.
• Dash (-)—Compliance has not been calculated yet or is not available.
• One or more up or down arrows—Trending up or down is based on the change in values over the past three time units. For example, two downward-pointing arrows indicate two consecutive time units where the value has degraded.
Click to open a compliance matrix for the time period. See Viewing Data Points for a Time Period (Compliance Matrix Time-Period-to-Date Details), page 5-7.
• Week to Date
• Month to Date
• Quarter to Date
• Year to Date
Compliance values as of end of previous week, month, quarter, or year. Displays one of the following:
• Green icon—No violations.
• Red icon—A service-level threshold violation has occurred at some level of the SLA.
• Dash (-)—Compliance has not been calculated yet or is not available.
Click to open a compliance matrix for the time period. See Viewing Data Points for a Time Period (Compliance Matrix Time-Period-to-Date Details), page 5-7.
5-3User Guide for Cisco Unified Service Statistics Manager
OL-20784-01

Chapter 5 Managing SLAs and Monitoring ComplianceUsing the Compliance Matrix
Compliance Matrix Icons Service Statistics Manager displays a series of icons on the header of the Compliance Matrix page. Availability of these additional options is based on the content of the page.
Viewing the Compliance Matrix for a Specific SLAWhen you click the entry in the Compliance Matrix SLA column, what you see next depends upon the content of the SLA:
• If an SLA is composed of SLAs (child SLAs), the child SLAs are displayed; the resulting display looks like the compliance matrix that is described in Using the Compliance Matrix, page 5-2.
• If an SLA is composed of instance-attribute pairs, a compliance matrix is displayed for them; the information that is available is described in Table 5-3.
Table 5-2 SLA Compliance Matrix Icons
Icon Icon Name Description
Show Report Header Show report details.
Hide Report Header Hide report details.
Schedule Report Schedule a report for the SLA.
Show Compliance Matrix Report
Display a compliance matrix report.
PDF View report as PDF.
CSV Export the report details to Microsoft Excel.
Mail This Page Mail the report.
Table 5-3 Columns in a Compliance Matrix for a Specific SLA
Column Description/Action
SLA Element IP address or DNS name; if available, other information that identifies the instance is displayed; for example, if the instance is a Cisco IOS router, the type, such as H323, is displayed.
Attribute Name of the attribute.
Details icon Click to open an element details page for the instance-attribute pair. See Viewing Element Details (SLA Details Threshold Condition Link), page 5-6.
5-4User Guide for Cisco Unified Service Statistics Manager
OL-20784-01

Chapter 5 Managing SLAs and Monitoring ComplianceUsing the Compliance Matrix
Viewing SLA Details (Compliance Matrix Details Column)An SLA Details page displays the status of each instance-attribute pair that are included in the SLA. To open an SLA Details page, click the icon in the Details column from a compliance matrix or a Violation Details page by. An SLA Details page include three panes:
• SLA Information—Includes:
– Compliance objective, owner, contact information, and dates.
– Comments—Click Edit to add comments to the SLA.
• Compliance summary—Graphical representation of compliance over time; the calculated percent compliance for the period appears above the graph.
• SLA Violation History—A scrollable table that includes:
– SLA Element—Instance name.
– Threshold Condition—The attribute being measured and the expected value are displayed as a link. Click it to display element details. (See Viewing Element Details (SLA Details Threshold Condition Link), page 5-6.)
– Weight—Weighting factor for this instance-attribute pair; a positive integer.
– Current Status—An icon that is either red (if a violation is open) or green (if there is no current violation). If a red icon is displayed, click it to open a Violation Details page. (See Viewing Violation Details (Compliance Matrix Current Status Column), page 5-6.)
Current Status One of these:
• Red icon—Click to open the violation details page. See Viewing Violation Details (Compliance Matrix Current Status Column), page 5-6.
• Green icon—There are no violations.
Graph Click the line graph icon to open a Graph Display page.
Weight An integer that represents the relative importance of the instance-attribute pair compared with other instance-attribute pairs in the SLA; used in calculating the average percent compliance of the whole SLA.
Previous Day SLA compliance for the previous day.
Click the icon in this column to see details. (For more information, see Viewing Data Points for a Time Period (Compliance Matrix Time-Period-to-Date Details), page 5-7.)
Week to Date SLA compliance from the first day of this week up to the current date. Click the icon in this column to see details.
Month to Date SLA compliance from the first day of this month up to the current date. Click the icon in this column to see details.
Quarter to Date SLA compliance from the first day of the current quarter up to the current date. Click the icon in this column to see details.
Year to Date SLA compliance from the first day of the current year up to the current date. Click the icon in this column to see details.
Table 5-3 Columns in a Compliance Matrix for a Specific SLA (continued)
Column Description/Action
5-5User Guide for Cisco Unified Service Statistics Manager
OL-20784-01

Chapter 5 Managing SLAs and Monitoring ComplianceUsing the Compliance Matrix
– SLA History—A bar graph, representing the status over time. To see when a violation was opened, mouse over any red portion of the bar.
To generate a report, click the Generate Health Summary Report icon in the header. (For more information, see Using an SLA Health Summary Report, page 3-29.)
Viewing Element Details (SLA Details Threshold Condition Link)To open an element details page, either click the threshold condition link from an SLA Details page or click the icon in the Details column from a compliance matrix for an SLA. The Element Details page include three panes:
• Element Information—Includes:
– Element name, schedule name, and service-level objective value.
– Current Status—Open (red) or closed (green). If red, click the dot to open a Violation Details page for the element. See Viewing Violation Details (Compliance Matrix Current Status Column), page 5-6.
– SLA 24-Hour Status—A bar that represents status over time.
– Last Time Violated—A date.
– Service Level Objective Duration—The time for which the service-level objective can be in violation before being reported as in violation.
– Weight—Weighting factor for this instance in the SLA; a positive integer.
– SLA Name—Click to open an SLA Details page. See Viewing SLA Details (Compliance Matrix Details Column), page 5-5.
• Last 24 hrs—A line graph.
• Violations table with the following information:
– Time—The time that the violation occurred.
– Status—Either open (the value is currently in violation) or closed.
– Duration—The amount of time that the violation was open.
– Violated Points—Number of data points that were in violation of the service-level objective.
Viewing Violation Details (Compliance Matrix Current Status Column) You can open a Violation Details page from a compliance matrix and from an Element Details page by clicking a red icon in the Current Status column or field. Table 5-4 lists the information displayed on the Violation Details page.
Table 5-4 Violation Detail Columns
Column Description/Action
Time Time at which the violation was recorded.
SLA Name Name.
SLA Type Name.
SLA Details Click to open the SLA Details page. See Viewing SLA Details (Compliance Matrix Details Column), page 5-5.
5-6User Guide for Cisco Unified Service Statistics Manager
OL-20784-01
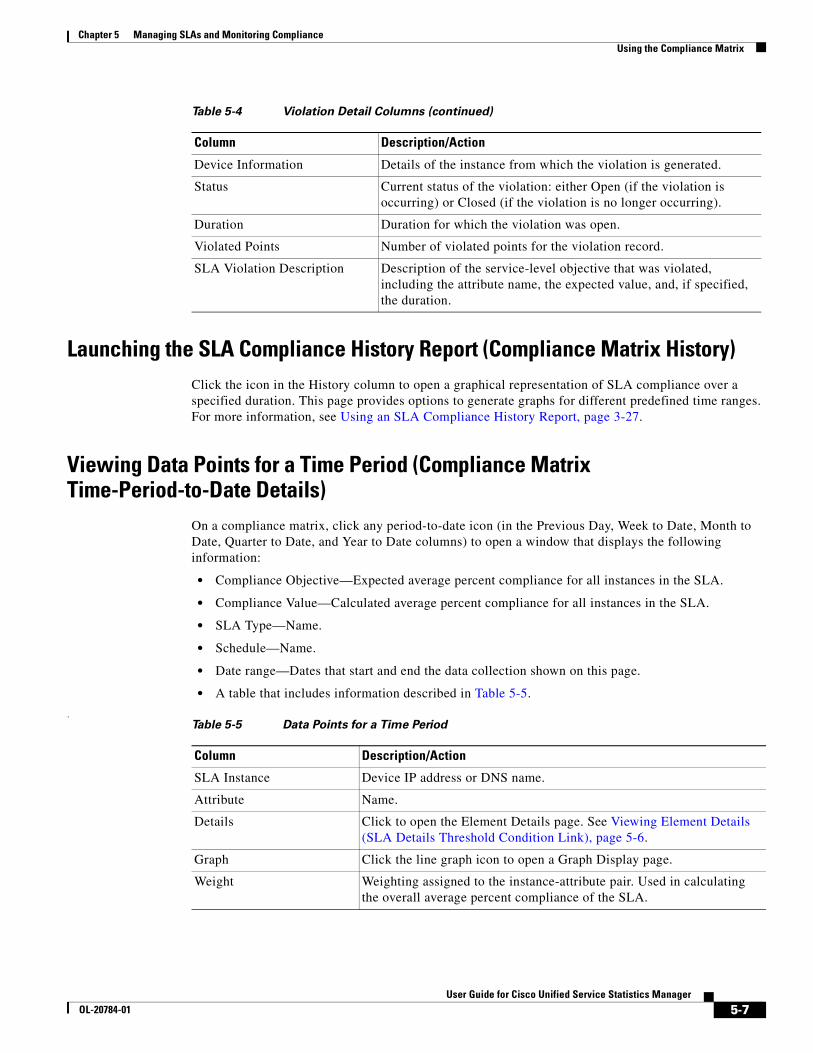
Chapter 5 Managing SLAs and Monitoring ComplianceUsing the Compliance Matrix
Launching the SLA Compliance History Report (Compliance Matrix History) Click the icon in the History column to open a graphical representation of SLA compliance over a specified duration. This page provides options to generate graphs for different predefined time ranges. For more information, see Using an SLA Compliance History Report, page 3-27.
Viewing Data Points for a Time Period (Compliance Matrix Time-Period-to-Date Details)
On a compliance matrix, click any period-to-date icon (in the Previous Day, Week to Date, Month to Date, Quarter to Date, and Year to Date columns) to open a window that displays the following information:
• Compliance Objective—Expected average percent compliance for all instances in the SLA.
• Compliance Value—Calculated average percent compliance for all instances in the SLA.
• SLA Type—Name.
• Schedule—Name.
• Date range—Dates that start and end the data collection shown on this page.
• A table that includes information described in Table 5-5.
.
Device Information Details of the instance from which the violation is generated.
Status Current status of the violation: either Open (if the violation is occurring) or Closed (if the violation is no longer occurring).
Duration Duration for which the violation was open.
Violated Points Number of violated points for the violation record.
SLA Violation Description Description of the service-level objective that was violated, including the attribute name, the expected value, and, if specified, the duration.
Table 5-4 Violation Detail Columns (continued)
Column Description/Action
Table 5-5 Data Points for a Time Period
Column Description/Action
SLA Instance Device IP address or DNS name.
Attribute Name.
Details Click to open the Element Details page. See Viewing Element Details (SLA Details Threshold Condition Link), page 5-6.
Graph Click the line graph icon to open a Graph Display page.
Weight Weighting assigned to the instance-attribute pair. Used in calculating the overall average percent compliance of the SLA.
5-7User Guide for Cisco Unified Service Statistics Manager
OL-20784-01

Chapter 5 Managing SLAs and Monitoring ComplianceUsing SLA Administration to Manage SLAs
Using SLA Administration to Manage SLAsAfter you define SLAs, Service Statistics Manager monitors and reports on their various aspects. With a Premium license, a user with the privilege to manage SLAs can do the following:
• Adding an SLA, page 5-8
• Editing an SLA, page 5-13
• Deleting an SLA, page 5-16
For more information, see these related topics:
• Defining Schedules, page 5-16
• Viewing Product License and Version, page 1-3
• Managing User Roles and Privileges, page 6-8
Adding an SLAYou can add SLAs to:
• Categorize or organize other SLAs. Such an SLA includes a group of SLAs but does not impose an overall compliance objective on them. See Adding an SLA to Group Other SLAs, page 5-11.
• Impose an overall compliance objective on other SLAs. In such an SLA, the average percent compliance of the child SLAs must meet the compliance objective specified in the parent SLA. See Adding an SLA to Measure the Compliance of a Group of SLAs, page 5-12.
• Select instances and specify attributes and individual service-level objectives that the attribute values must meet. In such an SLA, the average percent compliance achieved by instances must meet the compliance objective for the SLA. See Adding an SLA to Measure Compliance for Instances, page 5-9.
Violated/Total Points Number of data points that violated the service-level objective over the total number of data points recorded during for the time period (day, week, month, quarter, or year).
Note Only data that is recorded during the SLA schedule is included in the violated and total points. A schedule that includes all hours of the day includes all data point regardless of when they were recorded. A schedule that is limited to business hours includes only data recorded during business hours.
Compliance Objective Expected average percent compliance for all instances in the SLA.
Compliance Value Percent of time that the instance-attribute pair met the service-level objective during the time period.
Table 5-5 Data Points for a Time Period (continued)
Column Description/Action
5-8User Guide for Cisco Unified Service Statistics Manager
OL-20784-01

Chapter 5 Managing SLAs and Monitoring ComplianceUsing SLA Administration to Manage SLAs
Adding an SLA to Measure Compliance for Instances
Step 1 Select the SLA tab and click the SLA Administration link. The SLA Administration page appears.
Step 2 Click Add. The Create SLA Wizard page appears.
Step 3 Enter data as follows:
• Name—Enter a unique name.
• Owner—(Optional) Enter the name of the owner.
• Contact Information—(Optional) Enter the e-mail ID or phone number of the SLA owner.
• SLA Content—Select the Instances radio button.
Note After you create an SLA, you cannot change the selection for SLA content.
Step 4 Select the SLA Type.
Note After you create an SLA, you cannot change its SLA type.
Step 5 Do one of the following:
• Select an SLA type or a global attribute set from the list. Service Statistics Manager provides the following global attribute sets:
– Gateway Utilization
– System Utilization (for Unity)
– Trunk Utilization
– Unified CM Performance
• Click New to add a new SLA type; after adding the SLA type, select it from the list. (See Adding an SLA Type, page 5-12.)
• Click Edit to edit an existing SLA type before selecting it from the list. (See Editing an SLA Type, page 5-13.)
Step 6 Select one or more schedules to apply:
a. Select the Single or Multiple radio button.
Selecting more than one schedule enables you to set different service-level objectives for different time periods. For example, response-time service-level objectives might be different during business and nonbusiness hours.
Note After you create an SLA, you cannot change the number of schedules associated with it.
b. Select a schedule (or schedules). If you selected the Multiple radio button, select and move schedules from Available Schedules to Selected Schedules.
Optionally, you can edit an existing schedule or add a schedule:
– Click Edit o edit an existing schedule before selecting it from the list. (See Editing a Schedule When Configuring Custom Graphs, Reports, and SLAs, page 5-17.)
5-9User Guide for Cisco Unified Service Statistics Manager
OL-20784-01

Chapter 5 Managing SLAs and Monitoring ComplianceUsing SLA Administration to Manage SLAs
– Click New to add a new schedule; after adding the schedule, select it. (See Adding a Schedule When Configuring Custom Graphs, Reports, and SLAs, page 5-17.)
Step 7 Enter a percentage for SLA Compliance Objective.
Step 8 Click Next. Service Statistics Manager displays the Create SLA (Step 2 of 3) page.
Note The SLA type that you select governs the availability of monitor type and related monitor elements (instances) on the Create SLA (Step 2 of 3) page.
Step 9 Select the following to include in the SLA:
a. Group Filter—Select No Filter; alternatively, to select groups, use the Shift or Ctrl key. Optionally, use the Search field to find a group.
b. Monitor Types—Select the monitor types to associate with the SLA.
Step 10 Click Next. The Monitor Elements selection box appears.
Step 11 Select the monitor elements to associate with the SLA.
Step 12 Click Next. Service Statistics Manager displays the Create SLA (Step 3 of 3) page.
For each schedule that you selected on page 1, a table identifies the attributes for the selected instances in these columns:
• Monitor Type—Monitor type.
• Device Name—Instance name.
• Element—Instance IP address.
• Attribute—An attribute that is included in the selected SLA type.
Additional columns are included; you will enter data in them in Step 13 to set service-level objectives for the particular schedule.
Step 13 Set the service-level objectives for each instance-attribute pair. To provide the same values for multiple instance-attribute pairs, go to Step 14. Otherwise, modify values for any row of instance-attribute pairs:
• Service Level Objective Condition—Select one:
– Less than or equal
– Greater than or equal
• Service Level Objective Value—Enter a value that the attribute must meet to be in compliance.
• Minimum Duration—Enter the number of minutes that the value must remain outside of the service-level objective before is it reported as a violation.
• Weighting—To ignore any violations on a particular instance, enter zero. Otherwise, enter a whole number greater than zero to define the relative importance of the attribute within the SLA; weighting is used in calculating the average compliance of all instances in the SLA.
• Financial Impact—Enter the amount of financial loss (per hour) that will be caused if the service-level objective is not met.
Step 14 To provide the same values for more than one instance-attribute pair, use this procedure:
a. Select the instances or select the Select All check box.
b. Under the Update the Rows Selected Above Using the Following Values heading, enter values in these fields:
– Condition—Select Greater than or equal or Less than or equal from the list.
5-10User Guide for Cisco Unified Service Statistics Manager
OL-20784-01

Chapter 5 Managing SLAs and Monitoring ComplianceUsing SLA Administration to Manage SLAs
– Value—Enter the service-level objective value for the selected instance-attribute pairs.
– Duration—Enter the number of minutes that the service-level objective value must remain in the violation range before is it reported as a violation.
– Weighting—To ignore any violations on the selected instances, enter zero. Otherwise, enter a whole number greater than zero to define the relative importance of the attribute within the SLA. Weighting is used in SLA computation. For example, attributes A, B, and C have associated weighting of 5, 10, and 15. In this case, attribute C is three times as important as A, and B is twice as important as A.
– Financial Impact—Enter the amount of financial loss (per hour) that will be caused if the service-level objective is not met.
c. Click Apply.
Step 15 Click Finish. Service Statistics Manager creates the new SLA and returns to the SLA Administration page, displaying the new SLA in the list.
While creating the SLA, Service Statistics Manager also creates alarm thresholds for all listed monitor elements with the duration specified and the corresponding service-level objective (condition and value).
Adding an SLA to Group Other SLAs
Use this procedure to create an SLA that includes a group of SLAs but does not impose an overall compliance objective on them.
Step 1 Select the SLA tab and click the SLA Administration link. The SLA Administration page appears.
Step 2 Click Add. The Create SLA Wizard page appears.
Step 3 Enter data as follows:
• Name—Enter a unique name.
• Owner—(Optional) Enter name of the owner.
• Contact Information—(Optional) Enter the e-mail ID or phone number of the SLA owner.
• SLA Content—Select the SLAs radio button.
Note After you create an SLA, you cannot change the selection for SLA content.
• Use this SLA for grouping only and not to calculate Aggregate Compliance values—Select this check box.
Step 4 Click Next. Service Statistics Manager displays the Create SLA (Step 2 of 2) page.
Step 5 Select the SLAs to include; use the arrows to move them between Available SLAs and Selected SLAs.
Step 6 Click Finish.
5-11User Guide for Cisco Unified Service Statistics Manager
OL-20784-01

Chapter 5 Managing SLAs and Monitoring ComplianceUsing SLA Administration to Manage SLAs
Adding an SLA to Measure the Compliance of a Group of SLAs
This SLA will measure the average compliance of other SLAs against a compliance objective that you set.
Step 1 Select the SLA tab and click the SLA Administration link. The SLA Administration page appears.
Step 2 Click Add. The Create SLA Wizard page appears.
Step 3 Enter data as follows:
• Name—Enter a unique name.
• Owner—(Optional) Enter name of the owner.
• Contact Information—(Optional) Enter e-mail ID or phone number of the SLA owner.
• SLA Content—Select the SLAs radio button.
Note After you create an SLA, you cannot change the selection for SLA content.
• Use this SLA for grouping only and not to calculate Aggregate Compliance values—Ensure that this check box is cleared.
• Compliance Objective—Enter the expected average compliance (%) for the SLAs that you plan to include.
Step 4 Click Next. Service Statistics Manager displays the Create SLA (Step 2 of 3) page.
Step 5 Select the SLAs to include; use the arrow to move them from Available SLAs to Selected SLAs.
Step 6 Click Next. Service Statistics Manager displays the Create SLA (Step 3 of 3) page with the selected SLAs in a table that includes these columns: SLA, SLA Type, and Weight.
Step 7 Enter a weight for each SLA. (Default value: 1). To ignore any violations on a particular SLA, enter zero (0). Otherwise, enter a whole number greater than zero to define the relative importance of the attribute within the SLA; weighting is used to calculate the average percent compliance.
Step 8 Click Finish.
Adding an SLA Type
An SLA type is an attribute set that is used only when defining an SLA. An SLA type specifies the monitor types from which you can select instances to include in an SLA. AN SLA type also specifies attributes to measure for each monitor type.
This procedure explains how to create an SLA type while you are creating an SLA.
Note You can also create an SLA type by adding an attribute set and selecting SLA Type as the attribute set type; to do so, see Adding an Attribute Set, page 7-3.
Step 1 Navigate to the Create SLA (Step 1 of 3) window.
Step 2 For SLA type, click New. Service Statistics Manager displays the Add Attribute Set window.
Step 3 Select monitor types to associate with the SLA type by doing one of the following:
5-12User Guide for Cisco Unified Service Statistics Manager
OL-20784-01

Chapter 5 Managing SLAs and Monitoring ComplianceUsing SLA Administration to Manage SLAs
• Select from the list
• Use the Search for field to find and select monitor types.
Step 4 Click Next. Service Statistics Manager populates the attributes list with corresponding attributes.
Note If you selected multiple monitor types, an attributes list is displayed for each monitor type, one above another.
Step 5 Scroll down to each attribute list and select the attributes to associate with the SLA type in one of these ways:
• Using the list—For multiple selections, use the Ctrl and Shift keys.
• Using the Search for field to find and select monitor types.
Step 6 Click Next. Service Statistics Manager records the selection and displays the next page.
Step 7 Complete the attribute set:
a. Enter a name.
b. Select all attributes to include in this set.
c. Click Finish. A confirmation message is displayed and the SLA Administration page appears.
Editing an SLA Type
Step 1 On the Create SLA (Step 1 of 3) page, select the SLA type to edit from the list.
Step 2 Click Edit. Service Statistics Manager displays the Edit/View SLA Type page.
Step 3 Click Add Attributes to add new attributes to the existing SLA Type. Adding attributes is similar to Custom SLA Type creation.
• Click Delete to remove the selected Attributes.
• Click Cancel to exit.
• Click Finish to complete editing.
Editing an SLAWhat you can change when you edit an SLA depends on the SLA content type—SLAs, SLAs for grouping only, or Instances. You cannot change the SLA content type.
Step 1 Select the SLA tab and click the SLA Administration link. The SLA Administration page appears, displaying SLAs in a table.
Note If the SLA type is a dash, the SLA is a nested SLA; go to Editing a Nested SLA, page 5-15.
Step 2 Click the Edit button that corresponds with the SLA that you want to edit. The Edit SLA Wizard page appears.
5-13User Guide for Cisco Unified Service Statistics Manager
OL-20784-01

Chapter 5 Managing SLAs and Monitoring ComplianceUsing SLA Administration to Manage SLAs
Step 3 Update any of the following values:
• Name—Unique name for the SLA.
• Owner—Name of the owner.
• Contact Information—E-mail ID or phone number of the SLA owner.
• Schedule—You can select schedules different from those that are currently selected. (You cannot change the number of schedules that are associated with this SLA.)
• SLA Compliance Objective—Enter the compliance measure for the SLA. For the SLA to be in compliance, the calculated average percent compliance of the instances in the SLA must meet or exceed this value.
Step 4 Click Next. Service Statistics Manager displays the next page.
Step 5 From here, you can add or delete elements:
To add an element, click Add. The SLA SLA Name—Select Elements page appears; do the following:
a. Select the Group Filter to associate with the SLA. To select multiple group filters, use the Shift or Ctrl keys. Alternatively, use the Search for field to search for and select a group.
b. Select the monitor types to associate with the SLA. To select multiple monitor types, use the Shift or Ctrl keys. Alternatively, use the Search for field to search for and select monitor types.
c. Select the monitor elements to add to the SLA—These are instances of the monitor type.
d. Click Apply.
To delete an element:
a. Select the element and click Delete. Service Statistics Manager displays a confirmation message.
b. Click OK.
Step 6 Click Next. Service Statistics Manager displays the next page of the wizard. You can modify service-level objectives and costs for the instances from here.
Step 7 To provide the same values for one or more instances, go to Step 8. Otherwise, use this procedure to modify the values for each instance-attribute pair individually:
a. Change any of these values:
– Service Level Objective Condition—Select the condition from the list.
– Service Level Objective Value—Enter the expected value for the instance-attribute pair.
– Minimum Duration—Enter the number of minutes that the service-level objective value must remain in the violation range before is it reported as a violation.
– Weighting—To ignore any violations on a particular SLA instance, enter zero. Otherwise, enter a whole number greater than zero to define the relative importance of the attribute within the SLA; weighting is used in computation. For example, attributes A, B, and C have associated weighting of 5, 10, and 15. In this case, attribute C is three times as important as A, and B is twice as important as A.
– Financial Impact—Enter the amount of financial loss (per hour) that will be caused if the service-level objective is not met.
b. Click Apply.
5-14User Guide for Cisco Unified Service Statistics Manager
OL-20784-01

Chapter 5 Managing SLAs and Monitoring ComplianceUsing SLA Administration to Manage SLAs
Step 8 To provide the same values for multiple monitor types, use this procedure:
a. Select the Select All check box or select individual check boxes in the Update column.
b. Under the Update the Rows Selected Above Using the Following Values heading, enter values in these fields:
– Condition—Select the Service Level Objective condition from the list.
– Value—Enter the service-level objective value.
– Duration—Enter the number of minutes that the service-level objective value must remain in the violation range before is it reported as a violation.
– Weighting—Enter an integer; the default value is 1.
– Financial Impact—Enter the amount of financial loss (per hour) that will be caused if the service-level objective is not met.
c. Click Apply.
Step 9 Click Finish. Service Statistics Manager updates the SLA and returns to the SLA Administration page.
Editing a Nested SLAA nested SLA contains other SLAs. The SLA type for a nested SLA is a dash; you can see the SLA type displayed on the SLA Administration page and on the Compliance Matrix page.
Note When you edit an SLA, you cannot change the SLA content type.
Step 1 Select the SLA tab and click the SLA Administration link. The SLA Administration page appears, displaying SLAs in a table.
Note If the SLA type is not a dash, the SLA is not nested; instead, use the procedure Editing an SLA, page 5-13.
Step 2 Click the Edit button that corresponds with the SLA that you want to edit. The Edit SLA Wizard page appears.
Step 3 Update any of the following values:
• Name—Unique name for the SLA.
• Owner—Name of the owner.
• Contact Information—E-mail ID or phone number of the SLA owner.
• Compliance Objective—This field appears only if the SLA is used to calculate aggregated compliance for other SLAs. Enter the expected average compliance (%) for the SLAs that are included in this SLA.
Step 4 Click Next. Service Statistics Manager displays the Create SLA (Step 2 of n) page.
Step 5 Select the SLAs to include; use the arrows to move them between Available SLAs and Selected SLAs.
5-15User Guide for Cisco Unified Service Statistics Manager
OL-20784-01

Chapter 5 Managing SLAs and Monitoring ComplianceUsing SLA Administration to Manage SLAs
Step 6 If the SLA is used to calculate aggregated compliance for other SLAs:
a. Click Next. Service Statistics Manager displays the Create SLA (Step3 of n) page, displaying SLAs in a table with these columns: SLA, SLA Type, and Weight.
b. Enter a weight for each SLA. (Default value: 1). To ignore any violations on a particular SLA, enter zero (0). Otherwise, enter a whole number greater than zero to define the relative importance of the attribute within the SLA; weighting is used to calculate the average percent compliance.
Step 7 Click Finish.
Deleting an SLA
Step 1 Select the check box under the Select column corresponding to the SLA that you want to delete.
Step 2 Click Delete. If the SLA is not included in a nested SLA, Service Statistics Manager deletes it and refreshes the SLA Administration page.
Step 3 If the SLA is included in a nested SLA, Service Statistics Manager displays a table listing the affected SLAs. Click OK or click Cancel.
Defining SchedulesService Statistics Manager collects data without reference to schedules. Schedules, however, enable you to select from the collected data only the values that were recorded during the specific time windows that are defined in a schedule.
Service Statistics Manager provides some default schedules:
• 24x7—Includes all monitored attribute values recorded at any time during the entire week.
• Business—Includes only monitored attribute values that were recorded between 9:00 a.m. and 5:00 p.m., Monday through Friday.
A schedule includes one or more defined time periods. Schedule criteria can be inclusive (including selected hours of the day and days of the week) and exclusive (excluding, for example, a selected hour).
You can also define your own schedules within the Service Statistics Manager user interface:
• From the Administration tab—See Configuring Schedules, page 7-5.
• From windows where you can create or edit:
– SLAs—An SLA can have one or more schedules associated with it. When making SLA computations, Service Statistics Manager uses the schedules to determine which monitored attribute values to include. Schedules help put SLA compliance computation in the right perspective without distorting the values by including invalid periods.
– Reports—A report can have one schedule associated with it.
– Custom graphs and graph-based views—A graph can have one schedule associated with it.
When configuring an SLA, a report, or a custom graph, you must select a schedule; at that point, you can also click the New button and open the Create New Schedule page.
5-16User Guide for Cisco Unified Service Statistics Manager
OL-20784-01

Chapter 5 Managing SLAs and Monitoring ComplianceUsing SLA Administration to Manage SLAs
Adding a Schedule When Configuring Custom Graphs, Reports, and SLAs
Use this procedure to create a new schedule from the Create New Schedule window.
Step 1 Enter a name for the schedule.
Step 2 Define times to include in the schedule by selecting the Inclusion radio button and selecting the Select All Days check box; or, to define a time range for a single day:
a. Select the check box for one of the days (listed beside Days).
b. Select the start time and end time from the list.
c. Click Add. Service Statistics Manager adds the new time range to the table in the lower portion of the window.
Step 3 To define an exclusion period:
a. Select the Exclusion radio button.
b. Select one of the following, and the criteria for it:
– One Time Setting—Select the From and To time and date period to exclude.
– Monthly—Select the number of days, the week of the month (First, Second...), and the hours to exclude.
c. Click Add. Service Statistics Manager adds the new time range to the table in the lower portion of the window.
Note If you define an exclusion period, it takes precedence over defined inclusion periods.
Step 4 Repeat Step 2 or Step 3 until you have ensured that the computation timings for all days are correct.
Step 5 Click Done. Service Statistics Manager displays a confirmation message.
Step 6 Click Close. Service Statistics Manager updates the database and returns to the previous window. The new schedule is available in the list.
Editing a Schedule When Configuring Custom Graphs, Reports, and SLAs
Note You can alternatively edit a schedule from the Advanced pane of the Administration tab. See Editing a Schedule, page 7-6.
When adding or editing an SLA, report, or custom graph, you must select a schedule. The procedures to configure SLAs, reports, and custom graphs are different from one another:
• Adding an SLA, page 5-8
• Editing an SLA, page 5-13
• Creating Custom Graphs, page 4-1
• Creating a Report—Page 3 of the Report Wizard (Display, Schedule, and E-Mail Options), page 3-51
• Editing a Report, page 3-53
5-17User Guide for Cisco Unified Service Statistics Manager
OL-20784-01

Chapter 5 Managing SLAs and Monitoring ComplianceUsing SLA Administration to Manage SLAs
However, in each procedure, when you must select a schedule, you can use this procedure to edit an existing schedule.
Note Any changes that you make to a schedule affect all reports, custom graphs, and SLAs that are associated with the schedule. Unless you are sure that the change is appropriate for all, consider creating a new schedule or using a different schedule for your purpose.
Step 1 When configuring an SLA, a report, or a custom graph and you must select a schedule, to edit an existing schedule, select it and click the Edit button that is displayed next to the schedule list. If the schedule is associated with another SLA, report, or custom graph, a confirmation window lists them and asks whether you want to continue. If appropriate, click OK.
Service Statistics Manager displays the Edit Schedule window. Existing schedule criteria are displayed in the table in the lower portion of the window.
Step 2 Update the schedule as needed:
• To delete criteria from the schedule, select them from the table and click the Delete button above and to the right of the table.
Caution Be sure to click the Delete button above and to the right of the table. The Delete Schedule button below the table deletes the entire schedule.
• To add criteria to the schedule, select the Inclusion or Exclusion radio button, select the appropriate time period to include or exclude, and click Add.
Step 3 When you have finished updating the schedule, click Done. Service Statistics Manager stores the changes and closes the window.
Deleting a Schedule
When configuring an SLA, a report, or a custom graph and you must select a schedule, you can also delete a schedule at that time.
Step 1 When configuring an SLA, a report, or a custom graph and you must select a schedule, select the schedule that you want to delete and click the Edit button that is displayed next to the schedule list. If the schedule is associated with another SLA, report, or custom graph, a confirmation window lists them and asks whether you want to continue. If appropriate, click OK.
Step 2 Click the Delete Schedule button beneath the table. Service Statistics Manager displays a confirmation message:
• If the schedule is still associated with an SLA or report, these are listed. You cannot complete this procedure. You must either delete these SLAs and reports or reconfigure them to use a different schedule before you try to delete the schedule again.
• If the schedule is not associated with an SLA or a report, click OK.
5-18User Guide for Cisco Unified Service Statistics Manager
OL-20784-01

User OL-20784-01
C H A P T E R 6
Using the SSM Administration ConsoleYour user role controls whether you can access the SSM Administration Console. The following information is included in this section:
• SSM Administration Console Overview, page 6-1
• Launching the SSM Administration Console, page 6-2
• Managing Groups, page 6-3
• Managing Users, page 6-6
• Managing User Roles and Privileges, page 6-8
• Managing Remote Agents, page 6-12
SSM Administration Console OverviewThe SSM Administration Console is a user interface that is launched separately from Service Statistics Manager. The SSM Administration Console is used to configure:
• Users—Service Statistics Manager supports two classes of user: Administrator (users in this class access Service Statistics Manager and SSM Administration Console); and User (users in this class can access Service Statistics Manager only).
• Roles—Permissions.
• Groups—Used in reporting and in access control.
• SSM Agents—Perform data collection functions on remote systems where they are installed.
The SSM Administration Console is automatically installed on the system where Service Statistics Manager resides. You can also install the SSM Administration Console on another Windows system. For more information, see Installing the SSM Administration Console on Another System, page 7-16.
The SSM Administration Console connects with and updates the Service Statistics Manager database.
Only a user with a role in the Administration user class can log in to the SSM Administration Console. Such a user can also access all functions in Service Statistics Manager.
After initial installation:
• You must change the password for the default admin user from admin. You can do so from the Administration tab (see Changing Your Password, page 7-1) or from the SSM Administration Console (see Editing a User, page 6-7.)
• You must log into the SSM Administration Console to create additional users with appropriate roles.
6-1Guide for Cisco Unified Service Statistics Manager

Chapter 6 Using the SSM Administration ConsoleLaunching the SSM Administration Console
Launching the SSM Administration Console
Note Only a user in the Administrator role in Service Statistics Manager can log into the SSM Administration Console.
Step 1 Log in—directly or by using VNC—to the system where the SSM Administration Console is installed.
Step 2 On the Windows desktop, select one of the following:
• Start > All Programs > Cisco Unified Service Statistics Manager > Cisco Unified Service Statistics Manager Admin
• Start > All Programs > Cisco Unified Service Statistics Manager Admin 1.1 > Cisco Unified Service Statistics Manager Admin
A Command Prompt window is displayed briefly and the SSM Administration Console login window appears momentarily.
Step 3 Enter information in the following fields:
• Host—DNS name or IP address of the Service Statistics Manager system that you want to administer.
• User—Username with access rights to the Service Statistics Manager system.
• Password—Password for the username.
Click Log in. Status information is displayed during login. On successful validation, the SSM Administration Console is displayed.
Note If you have an evaluation license for Service Statistics Manager, a reminder message displays the number of days remaining in the evaluation period. For more information, see Using an Evaluation License, page 8-11.
SSM Administration Console FoldersThe SSM Administration Console is organized into folders:
• Root—The container or top-level folder.
• Group—Groups for reporting purposes. See Managing Groups, page 6-3.
• User—User management. See Managing Users, page 6-6.
• Advanced Options:
– Role—Access control for each role to Service Statistics Manager reports. See Managing User Roles and Privileges, page 6-8.
– Agent—SSM Agents from which this Service Statistics Manager obtains data. See Managing Remote Agents, page 6-12.
Expand each folder to view its contents; right-click the folder entries for menu options.
6-2User Guide for Cisco Unified Service Statistics Manager
OL-20784-01

Chapter 6 Using the SSM Administration ConsoleManaging Groups
Managing GroupsA group is a collection of monitored resources. To create a group, you select individual Unified Communication Managers, call clusters, and other elements and provide a unique name for the group. Use groups to organize elements; for example, by location, department, or resource type. You can then select groups to:
• Create custom graphs for a selected group.
• Grant or deny user access to information for a selected group.
Before creating a group, add all corresponding elements to the Service Statistics Manager database by invoking the discovery feature. (See Triggering Discovery, page 7-10 and Retriggering Discovery, page 7-12.)
There is no limit on the number of groups that you can define. However, you should avoid creating a single group with hundreds or thousands of monitors. (One or more monitors exists for each device. For more information, see Devices and Associated Monitor Types, page A-1.)
When creating a group that encompasses a large number of elements, it is best to create it from smaller groups that have real meaning in terms of function, dependency, or topological relationships and add these smaller groups to a top-level group.
You can create a group using either of these methods:
• Adding a Group by Selecting Each Element, page 6-3
• Adding a Group by Selecting Groups, page 6-5
Adding a Group by Selecting Each Element
Step 1 Right-click the Group folder and select Add Group. The Add Group window is displayed.
Step 2 Enter data in these fields:
• Group Name—Unique name with a maximum length of 30 characters and no spaces.
• Group Description—(Optional) Meaningful description.
Note If you create a group that includes, for example, managed elements from a specific location, provide a name or description indicative of the location.
Step 3 Select the Group made by selecting each Managed Object radio button and click Next. The Monitored Resources/Group Members window is displayed.
Step 4 Populate the Group Members table using any combination of the following methods:
• Expand folders in the Monitored Resources panel, select one or more devices (Ctrl plus click), and select Add.
• Enter a device name or IP address in the Search for Devices field and click Go. Select one or more devices and select Add.
• Select Search…. The Search for Members window is displayed. For more information, see Searching for Group Members, page 6-4.
• Remove any objects by selecting them and clicking Remove.
6-3User Guide for Cisco Unified Service Statistics Manager
OL-20784-01

Chapter 6 Using the SSM Administration ConsoleManaging Groups
Step 5 Select the Auto Create Reports check box to automatically generate appropriate reports for this group during the daily report generation cycle. Selecting this check box enables Service Statistics Manager to generate a new set of reports that includes data only for the managed elements that you selected in Step 4. The set of reports depends on the type of managed elements selected. For more information on monitor types and their auto-created reports, see Table 6-1.
Step 6 Click Finish.
Searching for Group Members
When you add or edit a group (see Editing a Group, page 6-6) and click Search, the Search for Members window appears. You can use it to specify filters, find matching monitors, and add them to the group that you are working with.
Table 6-1 Monitor Types and Reports that Are Automatically Created for a Group
Monitor Type Default Reports that Service Statistics Manager Creates Automatically
Call Quality Percentage Distribution of Service Quality Clusters by Time—Weekly
Distribution of Service Quality Across Clusters by Time—Monthly
Service Quality Distribution Across Clusters—Monthly
Service Quality Percentage Distribution Across Clusters—Monthly
Call Volume Average Call Duration Across Clusters—Monthly
Average Call Duration versus Volume Across Clusters—Monthly
Average Duration of Calls Across Clusters—Monthly
Call Completion Rate Across Clusters—Monthly
Call Duration Across Clusters—Monthly
Call Traffic and Duration Across Clusters—Daily
Call Volume Across Clusters by Location—Monthly
Call Volume Across Clusters—Monthly
Call Volume Report on H.323 Gateways —Daily
Failed Calls Across Clusters—Monthly
Service Availability Across Clusters—Weekly
Top N Service Availability Across Clusters by Time—Monthly
Total Duration Across Clusters—Monthly
IPSLA Data Jitter IPSLA Data Jitter Statistics
IPSLA Gatekeeper RD IPSLA Gatekeeper Reg Delay Statistics
IPSLA Ping Echo IPSLA Ping Echo Statistics
IPSLA Ping Path Echo IPSLA Ping Path Echo Statistics
IPSLA UDP Echo IPSLA UDP Echo Statistics
Unified CM Performance
Detailed Performance—Daily
6-4User Guide for Cisco Unified Service Statistics Manager
OL-20784-01

Chapter 6 Using the SSM Administration ConsoleManaging Groups
Step 1 Select one radio button and select a filter from the associated list:
• Group—If you have defined groups, select one group to obtain a list of all monitors in it.
• Source Agent— Select an SSM Agent from those installed on Operations Manager or Service Monitor systems to obtain a list of all monitor types and devices on the selected system. For more information, see Service Monitor Database Monitor Types, page A-2 and Operations Manager File-Based Monitor Types, page A-9.
• Target Device—Select a device from those associated with Service Statistics Manager to obtain a list of monitors for the selected device. For more information, see Devices and Associated Monitor Types, page A-1.
• Monitor Type—Select one to find all monitors of this type.
Note If you select Monitor Type, you can further refine your search by using the Attribute, Operator, and Attribute Value fields.
Step 2 Click OK. The Search Results window displays a table with the following:
• Type—Monitor type.
• Path Name—The system and the device or IPSLA test name in this format: System name\Device IP or IPSLA test name.
Step 3 To remove entries from the Search Results window, select them and click Remove. The Search Results window displays the remaining entries.
Step 4 Select the entries that you want to move from the Search Results window to the Search Members window and click Add. The Search Results window closes and the Search Members window is displayed.
Adding a Group by Selecting GroupsChoose from other groups (child groups) to create a parent group. You can display parent and child groups hierarchically on the SSM Administration Console; for more information, see Defining Group Display, page 6-6.
Step 1 Right-click the Group folder and select Add Group. The Add Group window is displayed.
Step 2 Enter data in these fields:
• Group Name—Unique name with a maximum length of 30 characters and no spaces.
• Group Description—(Optional) Meaningful description.
Step 3 Select the Group made by grouping existing groups radio button and click Next. The Add Group window is displayed.
Step 4 To populate the Child Groups list, click Add. The Group Chooser dialog box appears.
Step 5 Select the Auto Create Reports check box to automatically generate appropriate reports for this group during the daily report generation cycle. Selecting this check box enables Service Statistics Manager to generate a new set of reports that includes data only for the managed elements that you selected in Step 4. The set of reports will depend on the type of managed elements selected. For more information on monitor types and their auto-created reports, see Table 6-1.
6-5User Guide for Cisco Unified Service Statistics Manager
OL-20784-01

Chapter 6 Using the SSM Administration ConsoleManaging Users
Note You can select Auto Create Reports only when you add a group.
Step 6 Select groups and click OK. The Group Chooser dialog box closes.
Step 7 Click Finish.
Defining Group DisplayBy default, groups are displayed in a flat list. You can alternatively display groups as a hierarchy. In a hierarchical display, you must expand parent group folders to view child groups.
Right-click the Group folder; select Display Group and select one of the following:
• Flat—To display all groups in a list.
• Hierarchical—To display a hierarchy of parent and child groups.
Editing a GroupYou can select or deselect the Auto Create Reports check box only when you add a group, not when you edit one. However, you can change anything else about the group, including the group name and whether the group is composed of groups or individually selected managed elements.
Step 1 Right-click the group and click Edit Group. The Edit Group window is displayed.
Step 2 Editing a group is similar to adding a group. For more information, see one of these topics:
• Adding a Group by Selecting Each Element, page 6-3
• Adding a Group by Selecting Groups, page 6-5
Deleting a GroupIf you delete a parent group, the child groups remain.
Step 1 Right-click the group and select Delete. The Confirm Deletion window is displayed.
Step 2 Click OK.
Managing UsersThe User folder contains Service Statistics Manager administrator and user accounts, enabling you to control and identify who has access to the system. From this folder, you can add, edit, and delete administrator and user accounts and you can edit roles. When you add or edit a user, you must assign a role or access control for the user. Roles control:
6-6User Guide for Cisco Unified Service Statistics Manager
OL-20784-01

Chapter 6 Using the SSM Administration ConsoleManaging Users
• Which groups and views a user can access.
• Whether a user can access the SSM Administration Console.
For more information, see Managing User Roles and Privileges, page 6-8.
User activity on Service Statistics Manager is recorded in the access log file, access.log, which is available in this directory:
Installation Directory/pronto/logs/
Adding a User
Step 1 Right-click the User folder and select Add User. The Add User window is displayed.
Step 2 Enter data:
• Login—Username for logging into Service Statistics Manager; enter at least 5 characters.
Note The default login name and password for Administrators is admin.
• Password—Password for the username.
• Re-enter Password—Password again for verification.
• Email Address—User’s e-mail address.
• Force Change Password—Select to force the user to change the password at first login.
Step 3 Select the role that should govern this user account. System-defined roles are:
• Administrator
• Capacity Planner
• Executive
• Operations
To add more roles, click Add (adjacent to the Role field). For more information, see Adding a Role, page 6-10.
To view or edit an existing role, click View/Edit (adjacent to the Role field). For more information, see Editing a Role, page 6-12.
Users obtain access rights from the selected role. Therefore, select the role appropriately. Select Administrator to assign access to the SSM Administration Console and full configuration privileges to the Service Statistics Manager system and SSM Agents.
Step 4 Click Add to add the new user. A confirmation message is displayed.
Step 5 Click Done to exit the Add User window after adding all required users.
Editing a UserUse this procedure to reset the user password or to change the user role. You can change any user information except the username.
6-7User Guide for Cisco Unified Service Statistics Manager
OL-20784-01

Chapter 6 Using the SSM Administration ConsoleManaging User Roles and Privileges
Step 1 Expand the User folder.
Step 2 Right-click the user to edit, and click Edit. The Edit User window is displayed.
Step 3 The procedure to edit a user is similar to that of adding a new user. After making the required changes, click OK. For more information, see Adding a User, page 6-7.
Deleting a User
Note After you delete a user, SLAs and reports created by the user remain. However, the owner for these SLAs and reports is displayed as None.
Step 1 Expand the User folder.
Step 2 Right-click the user to delete, and click Delete. A confirmation window appears.
Step 3 Click OK.
Managing User Roles and PrivilegesEvery user is assigned a role. Roles control user access to views, groups, reports, and SLAs in Service Statistics Manager. Roles also control user access to the SSM Administration Console. There are two classes of roles:
• Administrator Class—A role in the Administrator class enables access to both the SSM Administration Console and Service Statistics Manager. Service Statistics Manager provides one default:
– Role in the Administrator class—The default role is also named Administrator.
– User in the Administrator role—The default username is admin.
The default user admin—and any other user with a role in the Administrator class—can create additional users and additional roles (as well as use all features of the SSM Administration Console.)
• User Class—A role in the User class does not provide access to the SSM Administration Console, but does enable some access to Service Statistics Manager. Service Statistics Manager provides three default roles in the User class:
– Capacity Planner
– Executive
– Operations
Table 6-2 lists default roles by class, Service Statistics Manager tasks and components, and default access granted to each role.
6-8User Guide for Cisco Unified Service Statistics Manager
OL-20784-01

Chapter 6 Using the SSM Administration ConsoleManaging User Roles and Privileges
Table 6-2 Default Roles and Privileges for Service Statistics Manager Tasks and Components
Task or Component
Administrator Class User Class
Administrator Role Capacity Planner Role Executive Role Operations Role
SSM Administrator Console
Note A user in a role in the Administrator Class can access this component and all of its features. This is the only component or task that is exclusive to a user role in the Administrator class.
X — — —
Service Statistics Manager Administration Tab—Selected Advanced Administration Tasks
Note If you want to configure a role in the User class with the privilege to perform these tasks, you can do so.
• Allow Auto Discovery
• Allow Configure Call Quality Ranges
• Allow Configure Phone Based Groups
Note A user who has privileges to manager either SLAs or Reports can also manage attribute sets and schedules.
X — — —
Service Statistics Manager Views Tab
Manage Views (Add, Edit, Delete) X X X X
Access All Views or Selected Views
Note The selected views listed in this table are those that are selected by default when you first install Service Statistics Manager.
All All Selected:
• Call Duration
• Call Volume
• Executive Home
• Service Availability
• Service Quality
Selected:
• Call Analysis
• Operations Home
• Performance
• Top N
Service Statistics Manager Groups
Note Groups are user-defined; users with access to the SSM Administration Console can create groups. Service Statistics Manager does not provide default groups.
Access All Groups or Selected Groups All All All All
6-9User Guide for Cisco Unified Service Statistics Manager
OL-20784-01

Chapter 6 Using the SSM Administration ConsoleManaging User Roles and Privileges
Adding a Role
Note Service Statistics Manager provides these default roles Administrator, Executive, Capacity Planner, and Operations. For more information, see Managing User Roles and Privileges, page 6-8.
Step 1 Expand the Advanced Options folder.
Step 2 Right-click the Role folder and select Add Role. The Add Role window opens to the General tab.
Step 3 Enter a unique name for the role.
Step 4 Update selections on the General Tab:
• User Class—Select one of these:
– Administrator—A role in this user class provides access to both the SSM Administration Console and Service Statistics Manager.
– User—A role in this user class enables a user to access Service Statistics Manager only.
• Allow Auto Discovery—For more information, see Integrating with Operations Manager and Service Monitor, page 7-9.
• Allow Configure Call Quality Ranges—For more information, see Configuring Call Quality, page 7-8.
• Allow Configure Phone Based Groups—For more information, see Configuring Phone-Based Groups, page 7-7.
Step 5 Select the Views tab:
• Select or deselect Allow View Management—Enables users in this role to create, edit, and delete views in Service Statistics Manager.
Service Statistics Manager SLAs Tab
Note Users on a system with a Standard license cannot access the SLA tab and cannot manage or access SLAs. SLAs are user-defined; Service Statistics Manager does not provide default SLAs.
Manage SLAs (Add, Edit, Delete) X — — —
Access All SLAs or Selected SLAs. All All All All
Service Statistics Manager Reports Tab
Manage Reports (Add, Edit, Delete) X — — —
Access Available Reports or Selected Reports
Available Reports—Service Statistics Manager provides default reports; for a list, see Default Reports, page 3-3.
Note A report defined in Service Statistics Manager can be private (accessible only to the creator of the report) or shared with the user group—that is, users in the same role—or shared with everyone. A user in a role with access to selected reports cannot access shared reports unless they have been added to the list of selected reports for the role.
Table 6-2 Default Roles and Privileges for Service Statistics Manager Tasks and Components (continued)
Task or Component
Administrator Class User Class
Administrator Role Capacity Planner Role Executive Role Operations Role
6-10User Guide for Cisco Unified Service Statistics Manager
OL-20784-01

Chapter 6 Using the SSM Administration ConsoleManaging User Roles and Privileges
• Select one of these:
– All Views—Provide users in this role with access to all views.
– Selected Views—Provide users in this role with access to those on the Allowed Views list only. Move views between All Views and Allowed Views using the Add >> and Remove << buttons.
Step 6 Select the Groups tab and select one of these:
• All Groups—Provide users in this role with access to all groups.
• Selected Groups—Provide users in this role with access to groups on the Allowed Groups list. Move groups between the All Groups and Allowed Groups lists using the Add >> and Remove << buttons.
Step 7 Select the SLAs tab:
• Manage SLAs—Select or deselect. Enables users in this role to create, edit, and delete:
– SLAs—For more information, see Using SLA Administration to Manage SLAs, page 5-8.
– Schedules—For more information, see Configuring Schedules, page 7-5.
– Attribute Sets—For more information, see Configuring Attribute Sets, page 7-3.
• Select one of these:
– All SLAs—Provide users in this role with access to all SLAs.
– Selected SLAs—Select to provide user access to selected SLAs in the system. Move SLAs between the All SLAs and Allowed SLAs lists using the Add >> and Remove << buttons.
Step 8 Select the Reports tab:
• Manage Reports (create, edit, delete)—Select or deselect. Enables users in this role to create, edit, and delete:
– Reports specified on this tab—For more information, see Managing Reports, page 3-29.
– Schedules—For more information, see Configuring Schedules, page 7-5.
– Attribute Sets—For more information, see Configuring Attribute Sets, page 7-3.
• Select one of these to specify reports:
– Available Reports—Provides access for users in this role to all reports created with either the Share this report with everybody or Share this report with my user group option, available to users with this access control.
Note Private reports are available only to the report owner (the user who created the report). Report access (private/public/user group) can be specified while configuring the report. For more information, see Managing Reports, page 3-29. My user group refers to all users that have the same user role. For more information, see Managing Users, page 6-6.
– Selected Reports—Click to choose reports that must be available to users with this access control. Users with this access control can view or manage only those reports that are selected here. A report created with the Share this report with everybody option can be viewed by users only if the report is made available to them.
Move reports between the All Reports and Allowed Reports lists using the Add >> and Remove << buttons.
Step 9 Click Add to save the settings and finish defining the role.
6-11User Guide for Cisco Unified Service Statistics Manager
OL-20784-01

Chapter 6 Using the SSM Administration ConsoleManaging Remote Agents
Editing a Role
Caution It is highly recommended that you do not change the default roles Administrator, Capacity Planner, Executive, and Operations.
Step 1 Expand the Advanced Options folder and expand the Role folder.
Step 2 Right-click the role that you want to edit and select Edit. The Edit Role window is displayed. For a description of each tab and the options on each, see Adding a Role, page 6-10.
Deleting a Role
Note Service Statistics Manager will not permit you to delete the Administrator role.
Caution Do not delete the default roles Capacity Planner, Executive, and Operations. If you delete a role, users assigned to that role are also deleted.
Step 1 Expand the Advanced Options folder and expand the Role folder.
Step 2 Right-click the role that you want to delete and select Delete. A confirmation window appears.
Step 3 Click OK.
Managing Remote AgentsSSM Agents spawn the creation of monitors, collect data, and deliver it to Service Statistics Manager for storage in the database.
Remote SSM Agents are those agents that reside on systems outside the Service Statistics Manager server. An SSM Agent cannot be connected to more than one Service Statistics Manager server simultaneously. After an SSM Agent is disconnected from a Service Statistics Manager server, the SSM Agent can be connected to any other Service Statistics Manager server.
Note If a server with Service Statistics Manager or SSM Agent is rebooted or shut down for any reason, or if the network goes down, the server and SSM agents reconnect automatically on restart.
Local Agents versus Remote Agents
Generally, all monitors that require direct access to Operations Manager or Service Monitor local resources require an agent on that same system. For example, to parse a log file, the agent must reside on the system where the log file exists in order to access it.
6-12User Guide for Cisco Unified Service Statistics Manager
OL-20784-01

Chapter 6 Using the SSM Administration ConsoleManaging Remote Agents
Note The SSM Agent that resides on the Service Statistics Manager server is named SSMServer and must retain this name.
Adding a Remote SSM AgentThe normal procedure for adding a remote SSM Agent is:
1. Install the SSM agent software on the remote system. For more information, see Installing SSM Agent on Another System, page 7-16.
2. Run discovery. For more information, see Triggering Discovery, page 7-10 or Retriggering Discovery, page 7-12.
If discovery fails to add a remote SSM Agent:
1. Ensure that a valid username and password for Operations Manager is provided during discovery. If necessary, supply another username and password and run discovery again; see Retriggering Discovery, page 7-12.
2. If discovery continues to fail, perform the tasks in SSM Agent Troubleshooting Tips, page 6-14.
3. Use the following procedure to add the remote SSM Agent.
Step 1 Expand the Advanced Options folder, right-click the SSM Agents folder, and select Add SSM Agent. The Add Device and Agent window appears, opened to the Configuration tab.
Step 2 Enter the following required information:
• Device Type—Select Server.
• Device Name—Enter a descriptive name for the agent.
Note Do not give the name SSMServer to a remote SSM Agent. SSMServer is reserved for use only as the name of the local SSM Agent on the Service Statistics Manager server.
• IP Address—Enter the IP address or hostname (if using DNS) of the Operations Manager or Service Monitor server with the SSM Agent that you want to add to Service Statistics Manager.
Step 3 Click Next.
Step 4 (Optional) Select a group on the Groups Tab. (Groups are user-defined in the SSM Administration Console; see Managing Groups, page 6-3.) If you select a group, the monitors that the SSM Agent creates will also be added to this group.
Step 5 Click Next. The Add Device and Agent window displays fields listed in the next step.
Step 6 Provide data in these fields:
• Control Port—The default control port (TCP connection port) is 12124. It is highly recommended that you use the default control port unless there is no other alternative. If you must change the port, click Close, complete the task Changing the TCP Connection Port for a Remote SSM Agent, page 6-14, and return to Step 1.
• Agent Name—The default value is the device name specified on the previous screen.
• Agent IP Address—The default value is the IP address (or name of the agent if using DNS) entered in the IP Address field.
6-13User Guide for Cisco Unified Service Statistics Manager
OL-20784-01

Chapter 6 Using the SSM Administration ConsoleManaging Remote Agents
• Associated Device—Lists devices with the same IP address as the IP address entered in Step 2, which is selected by default.
• Connection to Server—Select Direct Access using TCP/IP. (The SSM agent does not use SSL TCP/IP.)
Step 7 Click Next to create the agent. After the agent is created, a second Add Agent window is displayed to allow selection of monitors for the system.
Step 8 Select the monitors. For a list of the monitor types that are associated with the devices in Operations Manager and Service Monitor, see Devices and Associated Monitor Types, page A-1.
Step 9 To view the new agent, close the SSM Agents folder and expand it again.
Step 10 Click Finish. Service Statistics Manager registers the new agent and creates the specified monitors. The status of each action is listed on the screen.
Step 11 Click OK.
Changing the TCP Connection Port for a Remote SSM Agent
You must specify the control port for each remote SSM Agent that you add or edit.
Note It is highly recommended that you use the default control port, 12124, unless there is no other alternative.
If you must change the control port, use the following procedure.
Procedure
Step 1 Log in as a Windows system administrator to the system where the SSM Agent resides.
Step 2 Open the pronet.conf file in this folder:
Installation Directory\agent\pronto\conf\
Step 3 Change the port number in this property:
pronet.apps.agent.port=number
Step 4 Close the pronet.conf file and restart the SSM Agent; see Restarting an SSM Agent, page 6-18.
SSM Agent Troubleshooting TipsIf you have more than one NIC enabled on your system, see Recovering from Discovery Failure, page 6-16.
If an error message is displayed while discovery is running or while you are trying to connect SSM agent with the Service Statistics Manager server, see Recovering from Agent Not Active Error, page 6-16.
If your system is not correctly configured, various problems can occur:
• SSM Agent status can be inactive
• Discovery can fail
6-14User Guide for Cisco Unified Service Statistics Manager
OL-20784-01

Chapter 6 Using the SSM Administration ConsoleManaging Remote Agents
• Login can fail
Use the following procedure to determine the problem and resolve it.
Step 1 From the Service Statistics Manager system, ping the SSM Agent machine. If the SSM Agent machine does not respond, continue to Step 2.
Step 2 As a Windows administrator, log into the SSM Agent system and check the port number used by the pronet_agent process (the SSM Agent):
a. Open the pronet.conf file in this folder:
Install Directory\agent\pronto\conf\
b. Look for this property:
pronet.apps.agent.port=number
c. Verify that the pronet.apps.agent.port number matches the port number in the SSM Agent object instance (displayed in the SSM Administration Console folder under Advanced Options > SSM Agent). If the port number is the same, proceed to Step 3.
d. Do one of the following:
– Change the pronet.apps.agent.port number in the pronet.conf file and restart the SSM Agent (see Restarting an SSM Agent, page 6-18).
– Change the SSM Agent object by deleting and recreating it. See Deleting an SSM Agent, page 6-17 and Adding a Remote SSM Agent, page 6-13.
Step 3 Check whether another licensed Service Statistics Manager server has already connected to this agent; on the agent machine, issue this command:
netstat -an
The connection is OK if the port number matches the port number listed in the cntlmod.ini file and the port is in the listen state. In the example below, port number 12124 is in the listen state; the connection is OK.
*.12124 *.* 0 00 0 LISTEN
If the connection is OK, proceed to Step 4.
A conflict exists if the netstat command shows a connection with another Service Statistics Manager. In the example below, the second IP address is a second Service Statistics Manager.
207.20.93.203.12124 207.20.93.189.34708 8760 08760 0 ESTABLISHED
Disable the connection from one of the Service Statistics Managers. See Disconnecting an SSM Agent, page 6-18.
Step 4 Check whether the SSM Agent is behind a firewall. If so, check whether the port that the SSM Agent is using is disabled on the firewall.
Step 5 Check whether the port is being used by another application on the SSM Agent machine.
6-15User Guide for Cisco Unified Service Statistics Manager
OL-20784-01

Chapter 6 Using the SSM Administration ConsoleManaging Remote Agents
Note Service Statistics Manager supports SSM Agent installation only on systems with applications from the Cisco Unified Communications Management Suite, such as Operations Manager and Service Monitor.
Recovering from Discovery Failure
If discovery fails, confirm that only one NIC is enabled on your system. If more than one NIC is enabled, do this:
1. Disable all but one NIC.
2. From the SSM Administration Console, delete the SSM Agent. (See Deleting an SSM Agent, page 6-17.)
3. Start discovery again; see Retriggering Discovery, page 7-12.
Recovering from Agent Not Active Error
The following error might be displayed when running discovery or connecting an SSM Agent to the Service Statistics Manager server.
The Agent has been created but is not active. Monitors will not be added.
This can be caused by (1) Agent slow in initializing (2) Agent not properly installed on device (3) Agent Version being higher than Server Version.
If (1), you can click on the ‘Next’ button to re-connect so that you can add monitors. Or
If (2), you can re-type the correct information and click ‘Next”. Or, hit the ‘Close’ button and add the monitors at a later time.
If you continue without correcting the information, the SSM Agent is added to the SSM Agents folder, but the SSM Agent is not connected. You should:
1. Delete the inactive SSM Agent:
a. In the SSM Administration Console, right-click the SSM Agent.
b. Select Delete.
2. Correct problems (see troubleshooting information).
3. Retry making the connection (retrigger discovery or add the agent again).
Understanding Communication Between an SSM Agent and the Service Statistics Manager Server
SSM Agent connection and communication occur over TCP. A TCP agent passively waits for a connection from the server by listening on a TCP port (port 12124 by default). When adding an SSM Agent, the Service Statistics Manager server tries to contact the agent and establish a connection with it.
Editing an SSM Remote AgentTo resume data collection after the system date and time has been changed on the system where an SSM Agent is installed, you must restart the SSM Agent; see Restarting an SSM Agent, page 6-18.
Step 1 Expand the Advanced Options and SSM Agents folders.
6-16User Guide for Cisco Unified Service Statistics Manager
OL-20784-01

Chapter 6 Using the SSM Administration ConsoleManaging Remote Agents
Step 2 Right-click the SSM Agent to be edited and select Edit. The Edit SSM Agent window is displayed.
Step 3 Update data in any of these fields:
• Control Port—Control Port—The default control port (TCP connection port) is 12124. It is highly recommended that you use the default control port unless there is no other alternative. If you must change the port, click Close, complete the task Changing the TCP Connection Port for a Remote SSM Agent, page 6-14, and return to Step 1.
• Agent Name—Enter a descriptive name.
Note Do not change the name of the local SSM Agent; it must retain the name SSMServer.
• Agent IP Address—Enter the IP address of the system where the SSM Agent is installed.
• Associated Device—Device associated with this agent.
Step 4 Click OK.
Note If you have changed any values, click OK. If you do not click OK, changes will not be saved.
Deleting an SSM AgentWhen you delete an SSM Agent, the monitors that the agent created and for which the agent coordinated data collection are also deleted. When you delete an SSM Agent, the SSM Administration Console displays the following confirmation message: All monitors associated with this SSM Agent will be deleted.
To completely and permanently remove an SSM Agent, you should also uninstall the SSM Agent software; see Uninstalling a Remote SSM Agent, page 7-18.
Step 1 Expand the Advanced options and the SSM Agents folder.
Step 2 Right-click the agent to delete, and select Delete.
Note If the SSM Agent is currently monitoring applications, a warning message is displayed.
Caution Do not delete SSMServer. This is the local SSM Agent on the Service Statistics Manager server; it must always appear in the SSM Agents folder.
A confirmation window is displayed.
Step 3 Click OK.
Step 4 To confirm that the agent has been deleted, close and then expand the SSM Agents folder.
6-17User Guide for Cisco Unified Service Statistics Manager
OL-20784-01

Chapter 6 Using the SSM Administration ConsoleManaging Remote Agents
Connecting an SSM Agent
Step 1 Expand the Advanced Options and SSM Agents folders.
Step 2 Right-click the SSM Agent and select Connect Agent.
If an error is displayed, see Recovering from Agent Not Active Error, page 6-16
Disconnecting an SSM Agent
Step 1 Expand the Advanced Options and SSM Agents folders.
Step 2 Right-click the SSM Agent and select Disconnect Agent.
Note If Disconnect Agent is grayed out, the agent is already disconnected.
Note After you disconnect an SSM Agent from one Service Statistics Manager server, you can connect the SSM Agent to another Service Statistics Manager server.
Restarting an SSM Agent
Step 1 Expand the Advanced Options and SSM Agents folders.
Step 2 Verify that the agent status is Connection Active:
a. Right-click the SSM Agent and select Edit. The Edit SSM Agent window appears.
b. See Agent Status at the top of the window. If Agent Status is Connection Active, continue to Step 3. You cannot restart the agent until Agent Status is Connection Active; see SSM Agent Troubleshooting Tips, page 6-14.
Step 3 Right-click the SSM Agent and select Restart Agent.
6-18User Guide for Cisco Unified Service Statistics Manager
OL-20784-01

User OL-20784-01
C H A P T E R 7
Using AdministrationService Statistics Manager offers a series of configurable options for setting user preferences under the Administration tab. The Administration tab has various options that work interactively to manage and customize your Service Statistics Manager work environment. The following topics are included in this section:
• Changing Your Password, page 7-1
• Selecting Your Dashboard View, page 7-1
• Selecting Your Home View, page 7-2
• Performing Advanced Administration Tasks, page 7-2
• Working with Downloads, page 7-16
Changing Your PasswordChange the password for the admin user using this procedure.
Step 1 Select the Administration tab; then, in the User ID and Password pane, click the Edit link. The Change Password window appears.
Step 2 Enter appropriate passwords in each of these fields:
• Enter Old Password
• Enter New Password
• Confirm New Password
Step 3 Click Apply.
Selecting Your Dashboard ViewViews provide rapid access to information in an easy-to-interpret and concise manner. From a view, you can drill down into the data to gain insight into specific areas. If you select a dashboard view, it is displayed at the top of the Reports tab. Each user can select a different view for use as a dashboard view.
Step 1 Select the Administration tab and scroll to Dashboard View.
7-1Guide for Cisco Unified Service Statistics Manager

Chapter 7 Using AdministrationSelecting Your Home View
Step 2 Select a view from Show Dashboard View.
Note Only views that you have access to appear in the list. Contact a user in the Administration role to request access to additional views.
Step 3 Click Apply.
Selecting Your Home ViewYour home view is displayed on the Views tab at login and each time you select the Views tab. If you do not select a home view, the default home view for your role is displayed; for more information, see Table 2-1.
Step 1 Select the Administration tab and scroll to Home View.
Step 2 Select a view from Show Home View.
Note Only views to which you have access appear in the list. Contact a user in the Administration role to request access to additional views.
Step 3 Click Apply.
Performing Advanced Administration TasksFrom the Advanced pane on the Administration tab, you can add, edit, or delete attribute sets, schedules, phone-based groups, call quality ranges, and Operations Manager and Service Monitor details. In addition, for Service Statistics Manager to classify calls correctly, you should configure dial plans (and call classification), gateway codes, toll-free numbers, and service numbers in Service Monitor. For more information, see User Guide for Cisco Unified Service Monitor 2.3.
If a lock icon appears next to a task name in the Advanced pane, you do not have the necessary privileges to perform the task. For more information, see Managing User Roles and Privileges, page 6-8.
• Configuring Attribute Sets, page 7-3
• Configuring Schedules, page 7-5
• Configuring Phone-Based Groups, page 7-7
• Configuring Call Quality, page 7-8
• Integrating with Operations Manager and Service Monitor, page 7-10
7-2User Guide for Cisco Unified Service Statistics Manager
OL-20784-01

Chapter 7 Using AdministrationPerforming Advanced Administration Tasks
Configuring Attribute Sets
Note To configure attribute sets, you must have the privilege to do so; for more information, see Managing User Roles and Privileges, page 6-8.
An attribute set includes attributes—types of data, such as database availability, number of good calls, or trunk utilization—that Service Statistics Manager can collect for monitor types, such as call volume monitors, call quality monitors, and trunk utilization monitors. For monitor types and the attributes of each, see the following:
• Service Monitor Database Monitor Types, page A-2
• Operations Manager File-Based Monitor Types, page A-9
To configure an attribute set, see the following:
• Adding an Attribute Set, page 7-3
• Editing an Attribute Set, page 7-4
• Deleting an Attribute Set, page 7-5
Adding an Attribute Set
Step 1 Select the Administration tab and scroll to Advanced.
Step 2 In the Attribute Sets row, click the Edit link. (If there is no Edit link, you do not have the necessary privileges. For more information, see Managing User Roles and Privileges, page 6-8.)
The Attribute Set Administration window appears, displaying any existing attribute set by name and type.
Step 3 Click Add. The Add Attribute Set page appears.
Step 4 Select one of these attribute set types:
• Global—Can be used to configure reports and SLAs.
• Reports—Can be used to configure reports only.
• SLA Type—Can be used to configure SLAs only.
Note After you add the attribute set, you cannot update its attribute set type.
Step 5 Select one or more monitor types from the Monitor Type list; use the Ctrl and Shift keys to make multiple selections. Optionally, enter a monitor type in the Search field to find a specific type.
Step 6 Click Next. Service Statistics Manager displays one list of attributes for each monitor type that you selected.
Step 7 Select attributes from each list:
a. (Optional) Enter an attribute name or part of an attribute name in the Search field to filter the attributes.
b. Use the Ctrl and Shift keys to make multiple selections.
Step 8 Click Next. The Add Attribute Set window appears.
Step 9 Enter a name in the Attribute Set Name field.
7-3User Guide for Cisco Unified Service Statistics Manager
OL-20784-01

Chapter 7 Using AdministrationPerforming Advanced Administration Tasks
Step 10 Click Finish. The window closes and the newly added attribute set is listed in the Attribute Set Administration window.
Editing an Attribute Set
You can edit any attribute sets that you have added as well as the default attribute sets that Service Statistics Manager provides. Default attribute sets include:
• Gateway Utilization
• System Performance (for Unity)
• Trunk Utilization
• Unified CM Performance
Step 1 To open the Edit Attribute Set window, do the following:
a. Select the Administration tab and scroll to Advanced.
b. In the Attribute Sets row, click the Edit link. (If there is no Edit link, you do not have the necessary privileges. For more information, see Managing User Roles and Privileges, page 6-8.)
The Attribute Set Administration window appears.
c. Locate the attribute set that interests you and click the Edit link. The Edit Attribute Set window appears, displaying the monitor type and the selected attributes in a table.
Step 2 To add attributes, click Add Attributes. The Edit Attribute Set window remains open, displaying a Monitor Types list:
a. Select one or more monitor types from the list—Use the Ctrl and Shift keys to make multiple selections. Optionally, enter a monitor type in the Search field to find a specific type.
(For a list monitor types and the attributes that are available for them, see Service Monitor Database Monitor Types, page A-2 and Operations Manager File-Based Monitor Types, page A-9.)
b. Click Next. Service Statistics Manager displays one list of attributes for each monitor type that you selected.
c. Select attributes:
– (Optional) Enter an attribute name or part of an attribute name to filter the attribute list.
– Use the Ctrl and Shift keys to make multiple selections.
d. Click Next. The Edit Attribute Set window displays a table with the monitor types and attributes that are included in the set.
Step 3 To delete monitor types and attributes from the set, select them and click Delete.
Note At least one monitor type and attribute must remain in the set. To completely delete an attribute set, see Deleting an Attribute Set, page 7-5.
Step 4 Repeat steps 2 and 3 to add or delete additional attributes.
Step 5 Click Finish to save the changes to the attribute set.
7-4User Guide for Cisco Unified Service Statistics Manager
OL-20784-01

Chapter 7 Using AdministrationPerforming Advanced Administration Tasks
Deleting an Attribute Set
You cannot delete the default attribute sets that Service Statistics Manager provides:
• Gateway Utilization
• Trunk Utilization
• System Utilization (for Unity)
• Unified CM Performance
You can delete any user-created attribute set.
Step 1 Select the Administration tab and scroll to Advanced.
Step 2 In the Attribute Sets row, click the Edit link. (If there is no Edit link, you do not have the necessary privileges. For more information, see Managing User Roles and Privileges, page 6-8.)
The Attribute Set Administration window appears, displaying a list of attribute sets.
Step 3 Select desired check boxes.
Step 4 Click Delete. Service Statistics Manager displays a confirmation message.
Step 5 Click OK.
Configuring Schedules
Note To configure schedules, you must have the privilege to do so. If you have the privilege to manage reports or SLAs, then you also have the privilege to configure schedules. For more information, see Managing User Roles and Privileges, page 6-8.
Schedules are used to limit the data that is included in a report, a graph, or in SLA computations to only the data that was collected during the time specified in the schedule. You select a schedule for a report or an SLA when you configure the report or SLA. Service Statistics Manager provides two default schedules: 24x7 and Business Hours (8:00 a.m. to 5:00 p.m., Monday through Friday). Changes that you make to a schedule affect each report, custom graph (in a graph-based view), or SLA that uses the schedule.
If you are permitted to configure schedules, you can do so:
• When you configure reports or SLAs—You can add or update schedules from the page where you are required to select a schedule. For related procedures, see Defining Schedules, page 5-16.
• From the Administration tab—See the following procedures:
– Adding a Schedule, page 7-5
– Editing a Schedule, page 7-6
– Deleting a Schedule, page 7-7
Adding a Schedule
Step 1 Select the Administration tab and scroll to Advanced.
7-5User Guide for Cisco Unified Service Statistics Manager
OL-20784-01

Chapter 7 Using AdministrationPerforming Advanced Administration Tasks
Step 2 In the Schedules row click the Edit link. (If there is no Edit link, you do not have the necessary privileges. For more information, see Managing User Roles and Privileges, page 6-8.)
The Schedule Administration window appears.
Step 3 Click Add. The Create New Schedules window appears.
Step 4 Enter a name for the schedule.
Step 5 Define schedule criteria:
• You must define at least one inclusion period; see Step 6.
• You can define one or more exclusion periods; see Step 7.
Note If you define an exclusion period, it takes precedence over inclusion periods.
Step 6 Define times to include in the schedule by selecting the Inclusion radio button and selecting the Select All Days check box or to define a time range for a single day:
a. Select the check box for one of the days (listed beside Days).
b. Select the Start Time and End Time from the list.
c. Click Add. Service Statistics Manager adds the new time range to the table in the lower portion of the window.
Step 7 To define an exclusion period:
a. Select the Exclusion radio buttons
b. Select one of these and define criteria for it:
– One Time Setting—Select the From and To time and date period to exclude.
– Monthly—Select the day of the month (1, 2...31) or the week of the month (First, Second...), and the hours to exclude.
c. Click Add. Service Statistics Manager adds the schedule criteria to the table in the lower portion of the window.
Step 8 Repeat Step 6 and Step 7 until schedules for all days are correct.
Step 9 Click Done. Service Statistics Manager displays a confirmation message and displays the Schedule Administration window.
Editing a Schedule
Note Any changes you make to a schedule affect all reports and SLAs that are associated with the schedule. Unless you are sure that the change is appropriate for all, consider creating a new schedule or using a different schedule for your purpose.
Step 1 Select the Administration tab and scroll to Advanced.
Step 2 In the Schedules row, click the Edit link. (If there is no Edit link, you do not have the necessary privileges. For more information, see Managing User Roles and Privileges, page 6-8.)
The Schedule Administration window appears.
7-6User Guide for Cisco Unified Service Statistics Manager
OL-20784-01

Chapter 7 Using AdministrationPerforming Advanced Administration Tasks
Step 3 Click the Edit link for a schedule. If the schedule is in use—associated with a report or an SLA—a confirmation window lists the associated items and asks whether you want to continue.
If appropriate, click OK. Service Statistics Manager displays the Edit Schedule window. Existing schedule criteria are displayed in the table in the lower portion of the window.
Step 4 To change the schedule name, enter a new name.
If the schedule is used elsewhere—associated with another SLA or a report for example—a confirmation window lists them and asks whether you want to continue. If appropriate, click OK.
Service Statistics Manager displays the Edit Schedule window. Existing schedule criteria are displayed in the table in the lower portion of the window.
Step 5 Update the schedule as needed:
• To delete criteria from the schedule, select them from the table and click the Delete button above and to the right of the table.
Caution Be sure to click the Delete button above and to the right of the table. The Delete Schedule button below the table deletes the entire schedule.
• To add criteria to the schedule, select the Inclusion or Exclusion radio button, select the appropriate time period to include or exclude, and click Add.
Step 6 When you have finished updating the schedule, click Done. Service Statistics Manager stores the changes and displays the Schedule Administration window.
Deleting a Schedule
Step 1 Select the Administration tab and scroll to Advanced.
Step 2 In the Schedules row, click the Edit link. (If there is no Edit link, you do not have the necessary privileges. For more information, see Managing User Roles and Privileges, page 6-8.)
The Schedule Administration window appears.
Step 3 Select desired check boxes.
Step 4 Click Delete. Service Statistics Manager displays a confirmation message:
• If the schedule is still associated with SLAs or reports, they are listed. You cannot complete this procedure. You must either delete these SLAs or reports, or reconfigure them to use a different schedule before you try to delete the schedule again.
• If the schedule is not associated with SLAs or reports, click OK. Service Statistics Manager deletes the schedule and displays the Schedule Administration window.
Configuring Phone-Based GroupsYou can use phone-based groups to include only certain phones on the following reports:
• Cause Code Analysis
• Call Quality Summary
7-7User Guide for Cisco Unified Service Statistics Manager
OL-20784-01
Chapter 7 Using AdministrationPerforming Advanced Administration Tasks
• Top N Dialed Numbers
• Top N Calls
• Top N Users
• Traffic Summary
Step 1 Select the Administration tab and scroll to Advanced.
Step 2 In the Phone-Based Groups row, click the Edit link. (If there is no Edit link, you do not have the necessary privileges. For more information, see Managing User Roles and Privileges, page 6-8.)
The Phone-Based Groups window appears, displaying a text box in which you can add, edit, and delete phone-based groups.
Step 3 To add or edit a phone-based group, define it following this template:
GroupName = Phone numbers belonging to PhoneGroup
• GroupName—Do not include any special characters (a white space is considered a special character).
• Phone numbers belonging to PhoneGroup—Enter any combination of the following, separated by commas:
– Range of phone numbers—Specify a range using a hyphen (-) between two numbers expressed numerically. For example, (56005200-56005230) means all phone numbers from 56005200 to 56005230.
– Phone numbers specified using an exclamation mark (!) as a regular expression—the exclamation mark represents any alphanumeric character, and can appear any number of times. For example:
5610!—Matches phone number 5610 or any phone number that starts with 5610.
!60!52!—Matches phone number 6052 or any phone number that includes both 60 and 52 in it.
– Individual phone numbers can also be specified; for example, 56005210.
Note Phone-based groups support phone numbers with up to 18 digits.
Step 4 To delete a phone group, select the entire definition for the group (GroupName = Phone numbers belonging to PhoneGroup) and delete it.
Step 5 Click Apply.
Configuring Call QualityCall quality is determined by the Mean Opinion Score (MOS) of the call. MOS is a scale from zero (0) to five (5) with 0 being the worst and 5 being the best call quality. Call quality reports classify the quality of service as good, fair, acceptable, or poor based upon default values.
Note Sensor-based data reports on multiple 60-second intervals (call streams) rather than reporting on complete calls. Cluster-based data reports on complete calls. The MOS values you set for call quality also apply to both calls and call streams.
7-8User Guide for Cisco Unified Service Statistics Manager
OL-20784-01

Chapter 7 Using AdministrationPerforming Advanced Administration Tasks
If the MOS value for a call is between:
• 4 and 5—Call quality is good.
• 3 and 4—Call quality is fair.
• 2 and 3—Call quality is acceptable.
• 0 and 2 —Call quality is poor.
A MOS value that does not fall in the zero to five range is categorized as Not Applicable. (For more information, see Call Quality Ranges and Service Statistics Manager Reports, page 7-9.)
To change these values, use this procedure.
Step 1 Select the Administration tab and scroll to Advanced.
Step 2 In the Call Quality row, click the Edit link. (If there is no Edit link, you do not have the necessary privileges. For more information, see Managing User Roles and Privileges, page 6-8.)
The Call Quality Ranges window appears.
Step 3 Enter the minimum or maximum (or both) MOS value for any quality:
• Good
• Fair
• Acceptable
• Poor
Step 4 Click Apply. A message is displayed, explaining that you must restart the SSM Agent service to put the changes into effect.
Step 5 Click OK.
Step 6 Restart the SSM Agent service.
Call Quality Ranges and Service Statistics Manager Reports
The settings on the Call Quality Ranges window affect how call quality is categorized in the following reports:
• Call Service Quality Summary—Weekly
• Service Quality Distribution Across Clusters—Monthly
• Service Quality Percentage Distribution Across Clusters—Monthly
• Distribution of Service Quality Across Clusters by Time—Monthly
• Percentage Distribution of Service Quality Across Clusters by Time—Weekly
• Service Quality Distribution Across Sensors—Monthly
• Service Quality Percentage Distribution Across Sensors—Monthly
• Percentage Distribution of Service Quality Across Sensors by Time—Weekly
• Distribution of Service Quality Across Sensors by Time—Monthly
7-9User Guide for Cisco Unified Service Statistics Manager
OL-20784-01

Chapter 7 Using AdministrationPerforming Advanced Administration Tasks
Integrating with Operations Manager and Service MonitorEnsure that the SSM Agent software is installed on any remote Operations Manager or Service Monitor system from which you expect to collect data; see Installing SSM Agent on Another System, page 7-17. After the SSM Agent software is installed, run discovery to connect the SSM Agents to Service Statistics Manager.
You must have privileges to perform the tasks described in these topics:
• Triggering Discovery, page 7-10
• Retriggering Discovery, page 7-12
• Editing Operations Manager and Service Monitor IP Addresses, page 7-13
• Deleting a Service Monitor from Service Statistics Manager, page 7-15
Triggering Discovery
Before running discovery for the first time, ensure that:
• SSM Agent software is installed on each of the following:
– The Operations Manager system from which you will obtain data.
– Any Service Monitor system that has been added to the Operations Manager.
For more information, see Installing SSM Agent on Another System, page 7-17.
• You have run the command described in Configuring Service Statistics Manager to Connect with Operations Manager, page 7-11.
Discovery connects the SSM Agents that are installed on the Operations Manager and Service Monitor systems to the Service Statistics Manager server and creates the appropriate monitors on the agents.
Note During initial discovery only, Service Statistics Manager collects ten records for the previous hour from Service Monitor.
(After you run discovery for the first time, to run it again, see Retriggering Discovery, page 7-12.)
Step 1 Disable Cisco Security Agent:
a. If Cisco Security Agent is running on your system, disable it.
b. If the Operations Manager or the Service Monitors that are being discovered are on other systems, disable Cisco Security Agent on those systems too.
Step 2 Select the Administration tab and scroll to Advanced.
Step 3 In the Operations Manager/Service Monitor Details row, click the Show link. The Operations Manager/Service Monitor Details window appears.
Step 4 Click the Discover button. The Discovery window appears.
Note The Discover button is displayed only if you have the correct privilege. For more information, see Managing User Roles and Privileges, page 6-8.
Step 5 In the Operations Manager IP Address/Hostname field, enter the IP address or the hostname of the server where Operations Manager resides.
7-10User Guide for Cisco Unified Service Statistics Manager
OL-20784-01

Chapter 7 Using AdministrationPerforming Advanced Administration Tasks
Step 6 Enter the username for an Operations Manager user that has both of these privileges:
• Network Administrator
• System Administrator
Note Ensure that you enter a valid username and password for Operations Manager. Discovery fails if the information that you enter is not correct or if the user does not have the correct privileges. Service Statistics Manager does not verify this information when you enter it. For more information, see Selecting an Operations Manager Username and Maintaining an Up-to-Date Password in Service Statistics Manager, page 7-12.
Step 7 Enter the password for the user.
Step 8 Click Discover to trigger discovery. Service Statistics Manager displays a confirmation message.
Step 9 Click Close.
Discovery takes some time to complete. During this period, all the buttons on this screen are disabled. After discovery completes, the buttons are enabled.
When discovery is complete, the required SSM Agents are connected to the Service Statistics Manager server and monitors are created. SSM Agent status is displayed as follows:
• Green—Agent is added and connected to the Service Statistics Manager server.
• Red—Agent is either disconnected or not added to the Service Statistics Manager server.
Step 10 If you disabled Cisco Security Agent (in Step 1), re-enable it on the Service Statistics Manager server and any other server on which you disabled it.
Configuring Service Statistics Manager to Connect with Operations Manager
You must perform this procedure before you run discovery for the first time so that Service Statistics Manager obtains the necessary security certificate from Operations Manager. If you reinstall Operations Manager, you must also perform this procedure afterward to ensure that Service Statistics Manager obtains an updated security certificate. If Service Statistics Manager does not have an up-to-date security certificate, discovery will not complete; in this case, errors indicate license invalidity.
Note The procedure below is also included in Quick Start Guide for Cisco Unified Service Statistics Manager (post-installation configuration steps). If you are not sure whether the command has been run, it is OK to run it.
Step 1 Determine whether Operations Manager uses an SSL port other than 443 (the default SSL port).
Step 2 If Operations Manager uses an SSL port other than 443, perform these steps:
• Navigate to this directory: Installation Directory\pw\pronto\conf
• Edit the pronet.conf file and, find this line: pronet.ssm.om.port.https=443
• Replace 443 with the SSL port that Operations Manager uses
Step 3 Restart the Service Statistics Manager server. From the command prompt, type: pw sys start
Step 4 Close any existing browser sessions.
7-11User Guide for Cisco Unified Service Statistics Manager
OL-20784-01

Chapter 7 Using AdministrationPerforming Advanced Administration Tasks
Step 5 Start your browser again and log in to Service Statistics Manager.
Selecting an Operations Manager Username and Maintaining an Up-to-Date Password in Service Statistics Manager
The Operations Manager username and password that you must enter for Service Statistics Manager to perform discover are defined in Common Services on the Operations Manager server:
• Username—Must have Network Administrator and System Administrator privileges.
• Password—Must not contain any of these characters: tilde (~), percent sign (%), ampersand (&), underscore (_), plus sign (+), apostrophe (’), or comma (,).
Note If the password contains any of the characters listed above, discovery will fail.
The default Operations Manager administrative user, admin, has the necessary privileges. Although you can enter admin as the username in Service Statistics Manager, be aware that, during upgrade and reinstallation, Operations Manager users might be prompted to change the password for the admin user.
If the password changes for the Operations Manager user that you entered, Service Statistics Manager can no longer access Operations Manager. Although privileged Operations Manager users can add, update, and delete usernames and passwords at any time, in practice, it might not occur frequently. The password for the admin user can be changed during any re-installation or upgrade to Operations Manager which, likewise, might not occur frequently.
For more information, including how to reset the password for the Operations Manager user in Service Statistics Manager, see Release Notes for Cisco Unified Service Statistics Manager 1.2.
What to Do if SSM Agent Status Is Red
If SSM Agent status is red, do the following:
1. Verify that you have a valid username and password for Operations Manager. If you receive a new username and password, enter them when retriggering discovery. See Retriggering Discovery, page 7-12.
2. Contact a user with Windows system administrator privilege who can perform the tasks listed in SSM Agent Troubleshooting Tips, page 6-14.
3. Contact a Service Statistics Manager user in the Administration role; such a user can log into the SSM Administration Console and perform tasks listed in Managing Remote Agents, page 6-12.
Retriggering Discovery
You can retrigger discovery any time to add new agents or create new monitors.
Note If you reinstalled Operations Manager, you must perform the procedure documented in Configuring Service Statistics Manager to Connect with Operations Manager, page 7-11 before you retrigger discovery.
Step 1 Disable Cisco Security Agent:
a. If Cisco Security Agent is running on your system, disable it.
7-12User Guide for Cisco Unified Service Statistics Manager
OL-20784-01

Chapter 7 Using AdministrationPerforming Advanced Administration Tasks
b. If the Operations Manager or the Service Monitors that are being discovered are on other systems, disable Cisco Security Agent on those systems too.
Step 2 Select the Administration tab and scroll to Advanced.
Step 3 Click the Operations Manager/Service Monitor Details Show link. The Operations Manager/Service Monitor Details window appears.
Step 4 Click Discover. The Discovery window appears.
Note The Discover button is displayed only if you have the correct privilege. For more information, see Managing User Roles and Privileges, page 6-8.
Step 5 In the Operations Manager IP Address/Hostname field, the IP address or the hostname for Operations Manager is displayed.
Note If the IP address has changed, see Editing Operations Manager and Service Monitor IP Addresses, page 7-13.
Step 6 Enter the username for an Operations Manager user.
Note Ensure that you enter a valid username and password for Operations Manager. Discovery fails if the information that you enter is not correct or if the user does not have the correct privileges. Service Statistics Manager does not verify this information when you enter it. For more information, see Selecting an Operations Manager Username and Maintaining an Up-to-Date Password in Service Statistics Manager, page 7-12.
Step 7 Enter the password for the user.
Step 8 Click Discover. Service Statistics Manager displays a confirmation message. Discovery takes some time to complete. During this period, a progress bar is displayed and the buttons on this screen are disabled. After discovery completes, the buttons are enabled.
When discovery is complete, the required SSM Agents are connected to the Service Statistics Manager server and monitors are created. SSM Agent status is displayed as follows:
• Green—Agent is added and connected to the Service Statistics Manager server.
• Red—Agent is either disconnected or not added to the Service Statistics Manager server. See What to Do if SSM Agent Status Is Red, page 7-12.
Step 9 If you disabled Cisco Security Agent (in Step 1), re-enable it on the Service Statistics Manager server and any other server on which you disabled it.
Editing Operations Manager and Service Monitor IP Addresses
Editing the IP addresses for Operations Manager and Service Monitor enables you to preserve existing data and continue reporting from a new IP address after any of the following occurs:
• You change the IP address of the server where Operations Manager or Service Monitor is installed.
• You move Operations Manager and/or Service Monitor to a different server and, consequently, to a different IP address.
7-13User Guide for Cisco Unified Service Statistics Manager
OL-20784-01

Chapter 7 Using AdministrationPerforming Advanced Administration Tasks
Note How to maintain Operations Manager and Service Monitor while changing the IP address on the server or moving the product to a different server is outside of the scope of this document.
To change the IP address for Operations Manager only or Service Monitor use only the appropriate procedure:
• Editing the IP Address for the SSM Agent on the Operations Manager Server, page 7-14
• Editing the IP Address for an SSM Agent on a Server Where Service Monitor Is Installed, page 7-15
To change the IP address when Operations Manager and Service Monitor are running on the same server, perform both of these procedures:
• Editing the IP Address for the SSM Agent on the Operations Manager Server, page 7-14
• Editing the IP Address for an SSM Agent on a Server Where Service Monitor Is Installed, page 7-15
Editing the IP Address for the SSM Agent on the Operations Manager Server
After the IP address for the Operations Manager server has changed, update the IP address for Operations Manager in Service Statistics Manager. (To also update Service Monitor, if present, see Editing the IP Address for an SSM Agent on a Server Where Service Monitor Is Installed, page 7-15.)
Step 1 Select the Administration tab and scroll to Advanced.
Step 2 Click the Operations Manager/Service Monitor Details Show link. The Operations Manager/Service Monitor Details window appears.
Step 3 Select the check box for Operations Manager.
Step 4 Click Edit. The Edit Operations Manager IP Address/Hostname window appears.
Note The Edit button is displayed only if you have the correct privilege. For more information, see Managing User Roles and Privileges, page 6-8.
Step 5 Update the address or hostname in the Operations Manager IP Address/Hostname field.
Step 6 Enter the username for an Operations Manager user.
Note Ensure that you enter a valid username and password for Operations Manager. Discovery fails if the information that you enter is not correct or if the user does not have the correct privileges. Service Statistics Manager does not verify this information when you enter it. For more information, see Selecting an Operations Manager Username and Maintaining an Up-to-Date Password in Service Statistics Manager, page 7-12.
Step 7 Enter the password for the user.
7-14User Guide for Cisco Unified Service Statistics Manager
OL-20784-01

Chapter 7 Using AdministrationPerforming Advanced Administration Tasks
Step 8 Click Apply. A confirmation window is displayed.
Step 9 Click OK. A progress message is displayed. Service Statistics Manager takes some time to update and move Operations Manager monitors to the new IP address.
Note To move Service Monitor monitors also, see Editing the IP Address for an SSM Agent on a Server Where Service Monitor Is Installed, page 7-15
Editing the IP Address for an SSM Agent on a Server Where Service Monitor Is Installed
After the IP address changes for the server where Service Monitor is installed, update the IP address for Service Monitor in Service Statistics Manager. You can use this procedure to update and move Service Monitor monitors from a server where Service Monitor only is installed or where Service Monitor and Operations Manager are installed. (To move Operations Manager monitors, see Editing the IP Address for the SSM Agent on the Operations Manager Server, page 7-14.)
Step 1 Select the Administration tab and scroll to Advanced.
Step 2 Click the Operations Manager/Service Monitor Details Show link. The Operations Manager/Service Monitor Details window appears.
Step 3 Select the check box for the Service Monitor.
Step 4 Click Edit. The Edit Service Monitor IP window appears.
Note The Edit button is displayed only if you have the correct privilege. For more information, see Managing User Roles and Privileges, page 6-8.
Step 5 Update the address in the Service Monitor IP field.
Step 6 Click Apply. Service Statistics Manager displays a confirmation window.
Step 7 Click OK. A progress message is displayed while Service Statistics Manager updates the monitors and moves them to the new IP address. This will take some time.
Deleting a Service Monitor from Service Statistics Manager
Step 1 Select the Administration tab and scroll to Advanced.
Step 2 Click the Operations Manager/Service Monitor Details Show link. The Operations Manager/Service Monitor Details window appears.
Step 3 Select the check box for the Service Monitor.
Step 4 Click Delete. Service Statistics Manager displays a confirmation message and deletes the Service Monitor.
7-15User Guide for Cisco Unified Service Statistics Manager
OL-20784-01

Chapter 7 Using AdministrationWorking with Downloads
Note The Delete button is displayed only if you have the correct privilege. For more information, see Managing User Roles and Privileges, page 6-8.
Working with DownloadsYou can install the following downloads from the Administration tab:
• SSM Administration Console—Enables a user in the Administrator role to maintain users, groups, and access controls and to reset SSM Agents on remote systems.
• SSM Agent—Periodically polls for data on Operations Manager and Service Monitor systems and sends data to Service Statistics Manager.
Installing the SSM Administration Console on Another SystemThe SSM Administration Console is automatically installed on the system with Service Statistics Manager. However, you can install it on another system.
Step 1 Log in to the system where you want to install the SSM Administration Console.
Step 2 Download the image and start the installation:
a. Log in to Service Statistics Manager and select the Administration tab.
b. Under Downloads, click Admin.exe. A File Download window appears.
c. Click Save and save Admin.exe to the desktop.
Note Alternatively, click Open and go to Step 3.
d. Double-click Admin.exe to start the installation. An InstallShield window appears with a Welcome message.
Step 3 Click Next. A License Agreement window appears.
Step 4 Click Accept. An Information window appears.
Step 5 Click Next. A Choose Destination Location window appears, displaying the default destination directory.
Step 6 (Optional) To install the SSM Administration Console in a different directory, enter the full path to the directory or click Browse to select it.
Click Next. The Start Copying Files window displays information about current settings.
Step 7 Click Next. The Setup Status window displays information during the installation; the Setup complete window appears with the Launch SSM Administration Console check box selected.
Step 8 (Optional) Deselect the Launch SSM Administration Console check box. Click Finish. (For more information, see Launching the SSM Administration Console, page 6-2.)
7-16User Guide for Cisco Unified Service Statistics Manager
OL-20784-01

Chapter 7 Using AdministrationWorking with Downloads
Installing SSM Agent on Another SystemSSM Agent is already automatically installed on the system with Service Statistics Manager. You must install SSM Agent on any other system where it is required but not yet installed. SSM Agent must be installed on:
• The single Operations Manager 2.2 system that Service Statistics Manager supports. If Operations Manager is installed on a system that is remote from Service Statistics Manager, you must install SSM Agent on the remote system.
Note After you install SSM Agent on the Operations Manager system, you must add Operations Manager to Service Statistics Manager. See Triggering Discovery, page 7-10.
• Each Service Monitor 2.2 system that has been added to the Operations Manager system. If Service Monitor is installed on a system that is remote from Service Statistics Manager, you must install SSM Agent on the remote system.
Step 1 Log in to the system where you want to install SSM Agent.
Step 2 Download the image and start the installation:
a. Log in to Service Statistics Manager and select the Administration tab.
b. Under Downloads, click Agent.exe. A File Download window appears.
c. Click Save and save Agent.exe to the desktop.
Note Alternatively, click Open and go to Step 3.
d. Double-click Agent.exe to start the installation. An InstallShield window appears with a Welcome message.
Step 3 Click Next. A License Agreement window appears.
Step 4 Click Accept. An Information window appears.
Step 5 Click Next. A Choose Destination Location window appears, displaying the default destination directory.
Note If you are installing SSM Agent on a system where SSM Administration Console is installed, do not install SSM Agent in the directory with the SSM Administration Console.
Step 6 To change the destination location, enter a new one or click Browse to find one.
Step 7 Click Next. A Start Copying Files window appears.
Step 8 Review settings for the installation; if they are correct, click Next. A Setup Status window appears, displaying setup progress. An Edit Data window appears.
Step 9 Enter an unused port number for the agent and click Next. If you assign a port that is already in use, a message is displayed asking you to specify an unused port number. An Edit Data window appears.
Step 10 Enter a display name for the agent and click Next. (The display name will appear on Windows Services and on Add/ Remove Programs displays.) The InstallShield Wizard Complete window appears.
7-17User Guide for Cisco Unified Service Statistics Manager
OL-20784-01

Chapter 7 Using AdministrationWorking with Downloads
Step 11 Click Finish.
Verifying the SSM Agent and SSM Administration Console Software VersionThis procedure is provided for your information. You might not need to execute it.
Step 1 On the desktop, select Start > All Programs > Accessories > Notepad. The system opens an untitled Notepad window.
Step 2 Select File > Open and navigate to the installation directory for SSM Agent or SSM Administration Console. The default paths are, respectively:
• C:\Program Files\ Service Statistics Manager Agent\pronto\bin\
• C:\Program Files\ Service Statistics Manager Admin\agent\pronto\bin\version
The exact path might vary based on the actual installation.
Step 3 Select All Files in the Files of type field.
Step 4 Open the file for the component to see the software version number:
• SSM Agent—AGENT_VERSION
• SSM Admininistration Console—Version
Uninstalling a Remote SSM AgentTo uninstall the local SSM Agent, see Quick Start Guide for Cisco Unified Service Statistics Manager 1.1 and follow the instructions for uninstalling Service Statistics Manager.
Note It is possible to uninstall only one instance of SSM Agent at a time.
Step 1 Log on to the system as a Windows system administrator.
Step 2 Select Start > Settings > Control Panel.
Step 3 Double-click Add or Remove Programs.
Step 4 In the Add or Remove Programs window, scroll to Cisco Unified Service Statistics Manager Agent and click Change/Remove. The system displays a confirmation message.
Step 5 Click OK.
Step 6 Follow the prompts on the Maintenance screen to complete the process.
Step 7 From your desktop, navigate to the folder where you installed SSM Agent (for example, C:\Program Files\Service Statistics Manager Agent).
Step 8 Delete the folder. Service Statistics Manager uninstalls all installed features of the agent, and the Maintenance Complete message is displayed.
7-18User Guide for Cisco Unified Service Statistics Manager
OL-20784-01

Chapter 7 Using AdministrationWorking with Downloads
Step 9 Click Finish.
Uninstalling a Remote SSM Administration ConsoleTo uninstall the local SSM Administration Console, see Quick Start Guide for Cisco Unified Service Statistics Manager 1.1 and follow the instructions for uninstalling Service Statistics Manager.
Step 1 Log in to the system as a Windows system administrator.
Step 2 Select Start > Settings > Control Panel.
Step 3 Double-click Add or Remove Programs.
Step 4 In the Add or Remove Programs window, scroll to Cisco Unified Service Statistics Manager Admin and click Change/Remove. The system displays a confirmation message.
Step 5 Click OK.
Step 6 Follow the prompts on the Maintenance screen to complete the process.
Step 7 Click Finish.
7-19User Guide for Cisco Unified Service Statistics Manager
OL-20784-01

Chapter 7 Using AdministrationWorking with Downloads
7-20User Guide for Cisco Unified Service Statistics Manager
OL-20784-01

User OL-20784-01
C H A P T E R 8
Database and System AdministrationThis information is provided for a system administrator who has Windows administrator privileges and is responsible for maintaining the server on which Service Statistics Manager resides:
• Administering the Database, page 8-1
• Recognizing Issues and Applying Workarounds, page 8-7
• Troubleshooting Login Problems, page 8-11
• Using an Evaluation License, page 8-11
• Installing a License, page 8-11
• Updating the SMTP Server and Port Number, page 8-12
Note The Service Statistics Manager server restarts weekly on Sunday. If any problem occurs, email is sent to the address that was entered during the installation.
Administering the DatabaseService Statistics Manager automatically performs the tasks described in these topics:
• Understanding Database Purging, page 8-2
• Understanding Database Archiving and Archive Files, page 8-2
To perform additional database and server backups, see Backing Up and Restoring the Database, page 8-3. To move Service Statistics Manager data to another disk, see Moving Service Statistics Manager Server Data to Another Disk, page 8-6.
8-1Guide for Cisco Unified Service Statistics Manager

Chapter 8 Database and System AdministrationAdministering the Database
Understanding Database PurgingDatabase purging deletes older data from the database, helping to restrict database growth. Service Statistics Manager reports operate on two types of data:
• Aggregated data—Data collectors (monitors) process the following:
– File-based Operations Manager data.
– Sensor-based Service Monitor data.
Service Statistics Manager imports the aggregated data into the database, where it is retained for 90 days. Database purging deletes aggregated data that is older than 90 days.
• CDR data—Call detail records obtained from Service Monitor are imported into the database as is; no aggregation is performed. CDR data is retained for 30 days. Database purging deletes CDR data that is older than 30 days.
For more information, see Understanding Data Rollup and Data Retention, page 3-12.
Understanding Database Archiving and Archive FilesService Statistics Manager automatically performs weekly full database backups. A full backup stores a snapshot of the database and transaction log files in the database archive directory and, on completion, purges older data from the transaction log. The existing archive and transaction log are temporarily stored before the archive job starts and are deleted on successful completion of the backup process. A full backup will:
• Require extra disk space—Because the existing archive and transaction log are stored temporarily while the archive runs and deleted after successful completion, the archive job requires enough space for two complete database backups. If there is not enough space to back up the database to the archive directory, an e-mail alert is sent.
• Recover from a failed backup attempt—If the archive job fails for any reason, such as insufficient disk space, the original files are restored so that there is no data loss.
Note If the specified archive directory does not have enough disk space to archive the database, the utility also sends an e-mail alert.
Table 8-1 lists files that are related to Service Statistics Manager database archive and restore.
Table 8-1 Service Statistics Manager Database-Related Files
Database-Related Files and Directories Description
storm_hostname.db in Installation Directory\pw\sybase
Service Statistics Manager database.
pronto.log in Installation Directory\pw\sybase
Current transaction log file; stores database transactions that have occurred since the previous full backup.
8-2User Guide for Cisco Unified Service Statistics Manager
OL-20784-01

Chapter 8 Database and System AdministrationAdministering the Database
Backing Up and Restoring the Database Backing up (archiving) the Service Statistics Manager database is highly recommended as part of regular maintenance, to:
• Provide a measure of safety against hardware failure or administrative errors.
• Maintain optimal system performance by removing older data from the transaction log, preventing the log from becoming unmanageably large.
Service Statistics Manager automatically backs up the database weekly. A full backup runs as this scheduled task: pn_WeeklyJob_ArchiveDB0530.
For more information, see Understanding Database Archiving and Archive Files, page 8-2.
Note Database archiving does not interrupt data collection or stop any Service Statistics Manager process.
Service Statistics Manager uses the pw database archive utility to perform backups. You can use the utility from the command line to do additional database backups and to restore the database. See Performing a Full Database Backup, page 8-3.
Performing a Full Database Backup
You can use the pw database archive command to do full database backups that are in addition to the weekly full database backups that Service Statistics Manager performs.
The pw database archive command stores transaction log files and a snapshot of the Service Statistics Manager database in an archive directory. The archive directory can be specified as an input parameter or entered in response to a prompt. The command and options are:
pw database archive [archive directory] [send-email]
If you simply enter the following command:
pw database archive
you are prompted for an archive directory and the utility performs a full database backup.
BackupLocation in Installation Directory\pw\dbarchive
A plain text file that contains the location of the most recent full backup of the database.
Note Do not edit the BackupLocation file. Whenever a full backup is done, the contents of this file and all existing incremental backup files are deleted.
Installation Directory\pw\dbarchive Directory where Service Statistics Manager stores the weekly full database archive and transaction log.
Note If, in addition to the weekly full backup, you perform a full database backup from the command line, you can specify another archive directory. The BackupLocation file is updated with the name of the archive directory that you used.
Table 8-1 Service Statistics Manager Database-Related Files (continued)
Database-Related Files and Directories Description
8-3User Guide for Cisco Unified Service Statistics Manager
OL-20784-01

Chapter 8 Database and System AdministrationAdministering the Database
Table 8-2 describes command-line options and provides links to important information.
Example: Performing a Full Database Backup to a Specific Disk
Follow either of these examples:
• Example with a command-line argument:
pw database archive C:\tmp\archive
This command saves the archive in C:\tmp\archive.
• Example without a command-line argument:
pw database archive
The output of this command will be:
About 6 MB free diskspace is needed to archive the databaseD:\Program Files\CUSSM\pw\dbarchive has sufficient space for database backup.Do you want to specify another location to backup the database (Y/N) [Default is n]:
Entering a “y” here produces the following:
Checking Drives to archiveFollowing drives have diskspace greater than 6 MB-----------------------------------------------------------------Drive Available DiskSpace----- -----------------------C: 7386 MBD: 21715 MBEnter the archive directory for Cisco Unified Service Statistics Manager [default is D:\Program Files\CUSSM\pw\dbarchive ]:Pressing Enter produces the following result: Taking backup of the database and the transaction log ..
Table 8-2 Database Archive Command Arguments
Command-Line Options Description
[archive directory] Places backup files in the specified archive directory.
Caution If this directory exists, it is overwritten without warning. For more information, see (Optional) Saving an Existing Full Database Backup Before Creating a New One, page 8-5.
Note It is recommended that you archive the database to a disk other than the one on which the database resides; if the database resides on drive C and you have a drive D, archive to it; for example:
pw database archive D:\tmp\archive
Note If the default directory (Installation Directory\pw\dbarchive) cannot be specified with the pw database archive command, specify another directory.
[send-email] Sends e-mail if the specified archive directory does not have enough disk space to archive the database.
8-4User Guide for Cisco Unified Service Statistics Manager
OL-20784-01

Chapter 8 Database and System AdministrationAdministering the Database
Backup CompletedBackup Directory is D:\Program Files\CUSSM\pw\dbarchiveArchive log file is relocated at D:\Program Files\CUSSM\pw\pronto\logs\dbarchive.log for administration.
(Optional) Saving an Existing Full Database Backup Before Creating a New One
You might want to save an existing full database backup to:
• Keep more than one weekly full database backup—After the weekly full database backup completes successfully, Service Statistics Manager deletes the previous full backup file.
• Preserve the current weekly full backup along with any full backup that you do in the interim—If you perform a full database backup from the command line and do not specify a location different from the default archive directory, the most recent weekly full backup is overwritten without warning.
To save a full database backup, use Windows Explorer to copy the dbarchive directory to a new name. For example, copy this directory:
Installation Directory\pw\dbarchive
and paste it to this directory:
Installation Directory\pw\dbarchive01
Restoring the Database
Note • Running the database restore command stops all Service Statistics Manager processes. After the restore completes successfully, all Service Statistics Manager processes are started.
• If the transaction log file pronto.log is moved from the directory Installation Directory\pw\sybase, restart Service Statistics Manager and do a full backup of the database.
You can restore the database using this command:
pw database restore
The utility obtains the location of the full backup file from the Installation Directory\pw\dbarchive\BackupLocation file.
To restore the database from the previous full backup, use this command:
pw database restore -full
This operation restores the storm_hostname.db and pronto.log files from the Installation Directory\pw\dbarchive directory to Installation Directory\pw\sybase directory.
Example: Restoring a Database from a Full Backup File
To restore the database using the full backup file, enter the following command:
pw database restore -full
The output of this command will be:
Restoring data can take a long time for a large system.This requires that data collection be shutdown temporarilywhile this operation takes place. Continue (y/n)[default is 'n']?
8-5User Guide for Cisco Unified Service Statistics Manager
OL-20784-01

Chapter 8 Database and System AdministrationAdministering the Database
Entering a “y” here produces the following output:
Stopping SSM Server...Successfully stopped SSM Server...Restoring the database only using the full backup files.Backup directory specified: D:\Program Files\CUSSM\pw\dbarchiveRemoving the existing database file storm_procis1.db and the transaction log pronto.logRestoring database to D:\Program Files\CUSSM\pw\sybase, please wait ...done.Database Restored.Stopping SSM Server...Starting SSM Server...Successfully brought up SSM Server...Taking the full backup to D:\Program Files\CUSSM\pw\dbarchive after restoring the database.About 5 MB free diskspace is needed to archive the databaseTaking backup of the database and the transaction log ..Backup CompletedBackup Directory is D:\Program Files\CUSSM\pw\dbarchive
Moving Service Statistics Manager Server Data to Another DiskService Statistics Manager regularly performs database backups. However, the reports and the views that Service Statistics Manager generates are stored outside of the database. To move Service Statistics Manager to a different disk or server, use this procedure to back up and restore the database and the generated reports and views.
Note Moving Service Statistics Manager to a different server requires steps in addition to those listed in the procedure below. To obtain the complete steps and a product license for the new server, open a service request. (To obtain the product license, you must provide the MAC address of the new server.)
Step 1 From the command line, shut down the Service Statistics Manager server. Enter this command:
pw system stop
Step 2 Ensure that all processes are stopped. Enter this command:
pw process list
If processes are running, wait and run the command again. Do not proceed until the command shows that no processes are running.
Caution Proceeding while processes run will result in a corrupt database.
Step 3 Take a complete backup of the Installation Directory\pw folder.
Note Failure to copy the entire directory structure can result in unrecoverable database corruption and loss of data.
8-6User Guide for Cisco Unified Service Statistics Manager
OL-20784-01
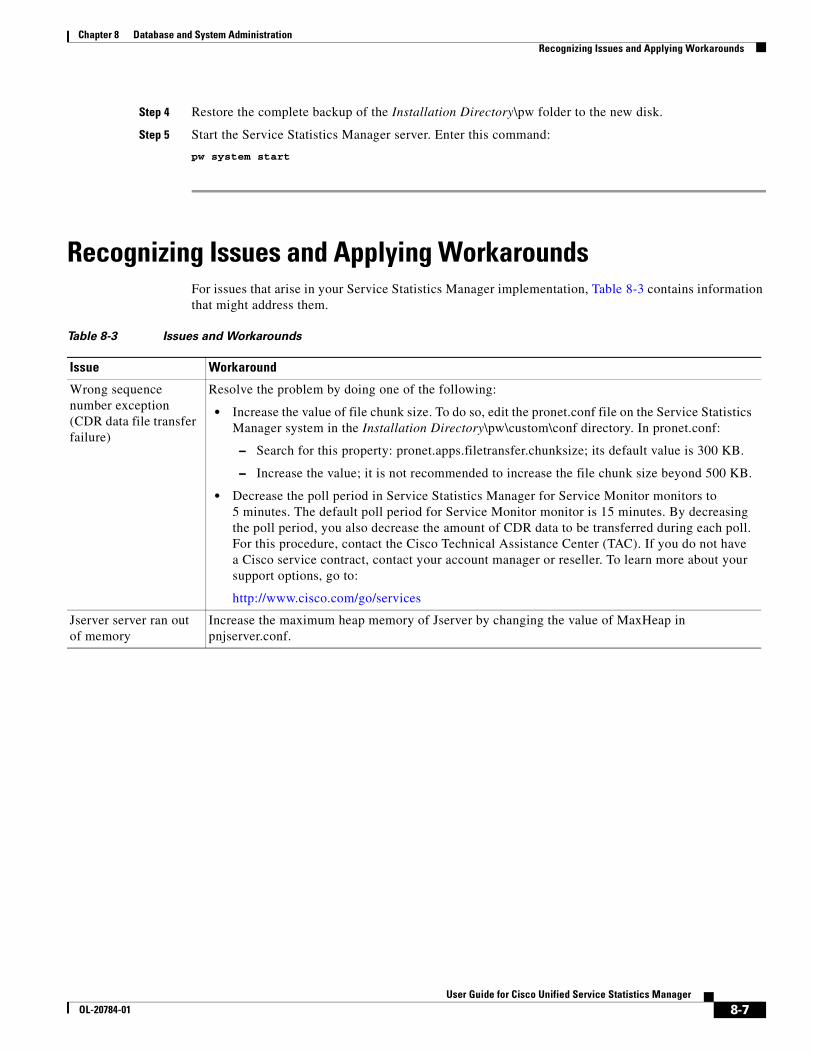
Chapter 8 Database and System AdministrationRecognizing Issues and Applying Workarounds
Step 4 Restore the complete backup of the Installation Directory\pw folder to the new disk.
Step 5 Start the Service Statistics Manager server. Enter this command:
pw system start
Recognizing Issues and Applying WorkaroundsFor issues that arise in your Service Statistics Manager implementation, Table 8-3 contains information that might address them.
Table 8-3 Issues and Workarounds
Issue Workaround
Wrong sequence number exception (CDR data file transfer failure)
Resolve the problem by doing one of the following:
• Increase the value of file chunk size. To do so, edit the pronet.conf file on the Service Statistics Manager system in the Installation Directory\pw\custom\conf directory. In pronet.conf:
– Search for this property: pronet.apps.filetransfer.chunksize; its default value is 300 KB.
– Increase the value; it is not recommended to increase the file chunk size beyond 500 KB.
• Decrease the poll period in Service Statistics Manager for Service Monitor monitors to 5 minutes. The default poll period for Service Monitor monitor is 15 minutes. By decreasing the poll period, you also decrease the amount of CDR data to be transferred during each poll. For this procedure, contact the Cisco Technical Assistance Center (TAC). If you do not have a Cisco service contract, contact your account manager or reseller. To learn more about your support options, go to:
http://www.cisco.com/go/services
Jserver server ran out of memory
Increase the maximum heap memory of Jserver by changing the value of MaxHeap in pnjserver.conf.
8-7User Guide for Cisco Unified Service Statistics Manager
OL-20784-01
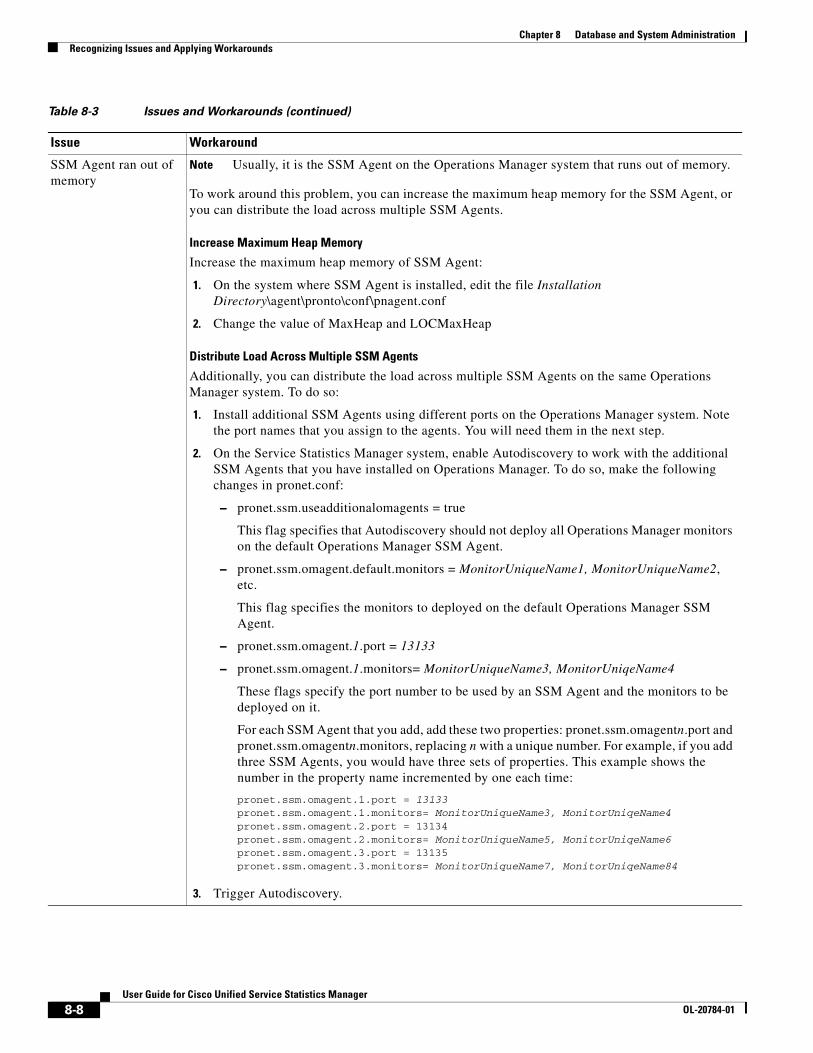
Chapter 8 Database and System AdministrationRecognizing Issues and Applying Workarounds
SSM Agent ran out of memory
Note Usually, it is the SSM Agent on the Operations Manager system that runs out of memory.
To work around this problem, you can increase the maximum heap memory for the SSM Agent, or you can distribute the load across multiple SSM Agents.
Increase Maximum Heap Memory
Increase the maximum heap memory of SSM Agent:
1. On the system where SSM Agent is installed, edit the file Installation Directory\agent\pronto\conf\pnagent.conf
2. Change the value of MaxHeap and LOCMaxHeap
Distribute Load Across Multiple SSM Agents
Additionally, you can distribute the load across multiple SSM Agents on the same Operations Manager system. To do so:
1. Install additional SSM Agents using different ports on the Operations Manager system. Note the port names that you assign to the agents. You will need them in the next step.
2. On the Service Statistics Manager system, enable Autodiscovery to work with the additional SSM Agents that you have installed on Operations Manager. To do so, make the following changes in pronet.conf:
– pronet.ssm.useadditionalomagents = true
This flag specifies that Autodiscovery should not deploy all Operations Manager monitors on the default Operations Manager SSM Agent.
– pronet.ssm.omagent.default.monitors = MonitorUniqueName1, MonitorUniqueName2, etc.
This flag specifies the monitors to deployed on the default Operations Manager SSM Agent.
– pronet.ssm.omagent.1.port = 13133
– pronet.ssm.omagent.1.monitors= MonitorUniqueName3, MonitorUniqeName4
These flags specify the port number to be used by an SSM Agent and the monitors to be deployed on it.
For each SSM Agent that you add, add these two properties: pronet.ssm.omagentn.port and pronet.ssm.omagentn.monitors, replacing n with a unique number. For example, if you add three SSM Agents, you would have three sets of properties. This example shows the number in the property name incremented by one each time:
pronet.ssm.omagent.1.port = 13133pronet.ssm.omagent.1.monitors= MonitorUniqueName3, MonitorUniqeName4pronet.ssm.omagent.2.port = 13134pronet.ssm.omagent.2.monitors= MonitorUniqueName5, MonitorUniqeName6pronet.ssm.omagent.3.port = 13135pronet.ssm.omagent.3.monitors= MonitorUniqueName7, MonitorUniqeName84
3. Trigger Autodiscovery.
Table 8-3 Issues and Workarounds (continued)
Issue Workaround
8-8User Guide for Cisco Unified Service Statistics Manager
OL-20784-01

Chapter 8 Database and System AdministrationRecognizing Issues and Applying Workarounds
Some monitors stop collecting data on a loaded SSM Agent after restarting the SSM Agent
The agent controller process disconnects the agent if it does not respond to poll requests. A loaded SSM Agent might not respond to poll requests from the agent controller.
To work around this problem, increase values related to the polling period (using the procedure below) and then use the procedure Distribute Load Across Multiple SSM Agents, page 8-8 in the previous row of this table.
Increase Values Related to the Polling Period
Edit pronet.conf on the Service Statistics Manager system and increase the values of these properties:
• pronet.apps.agent.pollperiod—Increase the agent polling period on the Service Statistics Manager system.
• pronet.apps.agent.pollperiod.allowednoreplies.tcp—Increase the number of No Replies allowed during agent polling.
• pronet.apps.agent.pollperiod.initnoreplies—Increase the number of No Replies allowed during agent initialization.
Table 8-3 Issues and Workarounds (continued)
Issue Workaround
8-9User Guide for Cisco Unified Service Statistics Manager
OL-20784-01

Chapter 8 Database and System AdministrationRecognizing Issues and Applying Workarounds
Loading CDR data to Service Statistics Manager database fails with a Read timed out exception
This problem can occur in the following cases:
• When running an SQL query on SSM_CDR_TABLE or SSM_CMR_TABLE using SQL tools such as Sybase Interactive SQL, and you do not close the tool.
Workaround:
Close the Sybase Interactive SQL or any other SQL tool that is open.
• When a CDR report is being generated at the same time.
Workaround:
Edit pronet.conf on the Service Statistics Manager system and change the values of these properties:
– pronet.agentcontroller.ssm.dim.DBStatementExecTimeoutInSeconds—Increase the timeout period for execution of database statements. If the value of this property is set to -1, then no timeout is set for database statement execution.
– pronet.agentcontroller.ssm.dim.LoadDBRetries—Increase the number of retries.
– pronet.agentcontroller.ssm.dim.LoadDBRetryWaitTimeInSeconds—Set the appropriate time to wait before doing a retry.
Database server process does not start
If the database process does not start, you can troubleshoot the problem as follows:
1. Restart the SSM server process. If Service Statistics Manager does not function properly after restart, continue to step 2.
2. Check whether the dbsrv process is running by entering the following command:
pw process list
The command lists each process and the process status in this format: process name status. If the dbsrv process is not running, it is displayed as follows:
dbsrv !Not Running!
If dbsrv is not running, continue to step 3.
3. Start the dbsrv process by entering this command:
pw p r dbsrv
If the database starts successfully, you are done. If the database does not start and you see an error “Assertion failed”, the database is probably corrupt and you need to replace it with a backup as directed in step 4.
Note The instructions in the next step explain how to replace the corrupted database with the most recent weekly archive that Service Statistics Manager automatically created.
4. Copy the storm_hostname.db and pronto.log files from the Installation Directory\pw\dbarchive directory to the Installation Directory\pw\sybase directory.
5. Start the SSM server.
Table 8-3 Issues and Workarounds (continued)
Issue Workaround
8-10User Guide for Cisco Unified Service Statistics Manager
OL-20784-01

Chapter 8 Database and System AdministrationTroubleshooting Login Problems
Troubleshooting Login ProblemsIf users cannot log in to Service Statistics Manager, try to find and resolve the problem using the information in Table 8-4.
Using an Evaluation LicenseAn evaluation license displays a message at login, showing the number of days remaining until the license expires. When the license expires, a final message is displayed and you can no longer use Service Statistics Manager until you purchase the product, obtain a license file, and install the license file on the Service Statistics Manager system.
Installing a LicenseTo be operationally valid, the license for Service Statistics Manager must support at least as many phones as the license for the associated Operations Manager. To add support for additional phones to Service Statistics Manager, you can purchase incremental licenses. To install a license, perform the following procedure.
Step 1 Copy the new license file to the Service Statistics Manager server into this directory: Installation Directory\pw\licenses\cisco\etc\licenses.
Step 2 Restart the server by selecting Start > All Programs > Cisco Unified Service Statistics Manager Server > Start Server.
Table 8-4 How to Verify Licenses, Credentials, and SSM Agent to Enable Login
Items to Verify Verification Steps
Service Statistics Manager license Confirm that your Service Statistics Manager license is valid. For more information, see Using an Evaluation License, page 8-11 and Installing a License, page 8-11.
Operations Manager license 1. Log in to Operations Manager.
2. Select CiscoWorks > Server > Administration > Licensing to examine the Name, Version, Size, Status, and Expiration date for the OM license. For Operations Manager product versions with which Service Statistics Manager is compatible, see Quick Start Guide for Cisco Unified Service Statistics Manager 2.2.
Service Statistics Manager discovery credentials
Log in to Operations Manager using the credentials that you provided in Service Statistics Manager to trigger discovery. If you are unable to log in:
1. Update the credentials in Operations Manager. (If the credential includes the username admin and the password no longer works, see Release Notes for Cisco Unified Service Statistics Manager 2.2.)
2. Enter the updated credentials in Service Statistics Manager from the Administration tab. See Retriggering Discovery, page 7-12.
SSM Agent status See SSM Agent Troubleshooting Tips, page 6-14.
8-11User Guide for Cisco Unified Service Statistics Manager
OL-20784-01

Chapter 8 Database and System AdministrationUpdating the SMTP Server and Port Number
For more information, see Quick Start Guide for Cisco Unified Service Statistics Manager.
Updating the SMTP Server and Port NumberThe SMTP server that Service Statistics Manager uses is selected during installation. If you need to change it, use this procedure.
Step 1 As an Windows administrator, log into the system where Service Statistics Manager is installed.
Step 2 Edit the pronet.conf file (located in the /Installation Directory/pw/custom/conf/ directory) and enter an
IP address or DNS name and a port number for the following properties:
pronet.api.emailer.smtp.host= pronet.api.emailer.smtp.port=
Step 3 Restart the server:
a. Select Start > All Programs > Cisco Unified Service Statistics Manager Server > Stop Server.
b. Select Start > All Programs > Cisco Unified Service Statistics Manager Server > Start Server.
8-12User Guide for Cisco Unified Service Statistics Manager
OL-20784-01

User Guide OL-20784-01
A
P P E N D I X A Devices, Monitor Types, and AttributesThis topic includes the following:
• Devices and Associated Monitor Types, page A-1
• Service Monitor Database Monitor Types, page A-2
• Operations Manager File-Based Monitor Types, page A-9
Devices and Associated Monitor TypesService Statistics Manager collects data for managed elements: the devices and applications listed in Table A-1. Table A-1 also lists the monitor types associated with each managed element. Monitor types define a set of attributes—or types of data—to collect for the managed element.
Table A-1 Devices and Associated Monitor Types
Managed Element Associated Monitor Types
Service Monitor1
Cisco Unified Communications Manager cluster (also referred to as a call cluster in this document)
• Call Volume
• Call Quality
Cisco 1040 Sensor Call Quality by Sensor
Cisco NAM Call Quality by NAM
Operations Manager 2
Cisco Unified Communications Manager • System Utilization for Unified CM
• Unified CM Performance
Cisco Unified Communications Manager Express CME Performance
Cisco Unified Contact Center Express • Unified CCE Performance
• System Utilization for Unified CCE
Cisco Unity Express (CUE) • CUE Performance
• System Utilization for IOS Router
Cisco Unity (Unity) • System Utilization for Unity
A-1for Cisco Unified Service Statistics Manager

Appendix A Devices, Monitor Types, and AttributesService Monitor Database Monitor Types
Note Service Statistics Manager can also collect data from node-to-node test files on the Operations Manager system. Operations Manager stores the data from node-to-node tests in CSV files. For more information, see Node-to-Node Test File-Based Monitor Types and Attributes, page A-16.
For the statistical data that can be collected by each monitor type, see:
• Service Monitor Database Monitor Types, page A-2
• Operations Manager File-Based Monitor Types, page A-9
Service Monitor Database Monitor Types Service Monitor obtains data from:
• Unified Communications Manager CDRs—For more information, see Understanding Data Collection from Service Monitor, page A-3.
• Call streams from sensors—Cisco 1040 Sensors and NAMs.
Service Monitor stores the data in its database. Service Statistics Manager monitor types—call volume, call quality, and call quality by sensor—collect data from the Service Monitor database. For the attributes associated with each monitor type, see these topics:
• Call Quality Monitor Type Attributes, page A-3
• Call Quality by NAM Monitor Type Attributes, page A-4
• Call Quality by Sensor Monitor Type Attributes, page A-4
• Call Volume Monitor Type Attributes, page A-5
Cisco Unity Connection (Unity Connection) • System Utilization for Unity Connection
Voice Gateways • Gateway Utilization
• Gatekeeper Performance
• System Utilization for IOS Router
• Trunk Utilization
1. Service Monitor obtains data from Unified Communications Manager Call Detail Records (CDRs) and from sensors (Cisco 1040s and NAMs) and stores the data in the database.
2. Operations Manager obtains some data from Perfmon counters on the devices and stores the data in CSV files. Operations Manager also obtains data from SNMP MIBs and stores the data in the database.
Table A-1 Devices and Associated Monitor Types (continued)
Managed Element Associated Monitor Types
A-2User Guide for Cisco Unified Service Statistics Manager
OL-20784-01
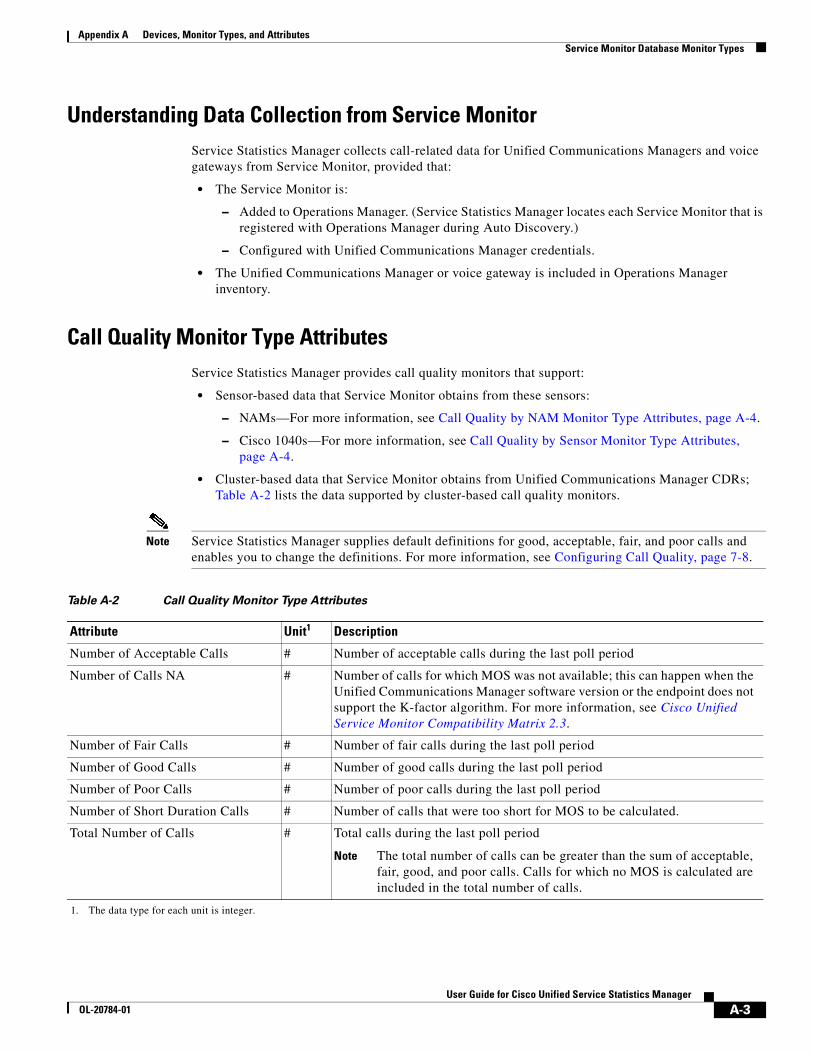
Appendix A Devices, Monitor Types, and AttributesService Monitor Database Monitor Types
Understanding Data Collection from Service MonitorService Statistics Manager collects call-related data for Unified Communications Managers and voice gateways from Service Monitor, provided that:
• The Service Monitor is:
– Added to Operations Manager. (Service Statistics Manager locates each Service Monitor that is registered with Operations Manager during Auto Discovery.)
– Configured with Unified Communications Manager credentials.
• The Unified Communications Manager or voice gateway is included in Operations Manager inventory.
Call Quality Monitor Type AttributesService Statistics Manager provides call quality monitors that support:
• Sensor-based data that Service Monitor obtains from these sensors:
– NAMs—For more information, see Call Quality by NAM Monitor Type Attributes, page A-4.
– Cisco 1040s—For more information, see Call Quality by Sensor Monitor Type Attributes, page A-4.
• Cluster-based data that Service Monitor obtains from Unified Communications Manager CDRs; Table A-2 lists the data supported by cluster-based call quality monitors.
Note Service Statistics Manager supplies default definitions for good, acceptable, fair, and poor calls and enables you to change the definitions. For more information, see Configuring Call Quality, page 7-8.
Table A-2 Call Quality Monitor Type Attributes
Attribute Unit1
1. The data type for each unit is integer.
Description
Number of Acceptable Calls # Number of acceptable calls during the last poll period
Number of Calls NA # Number of calls for which MOS was not available; this can happen when the Unified Communications Manager software version or the endpoint does not support the K-factor algorithm. For more information, see Cisco Unified Service Monitor Compatibility Matrix 2.3.
Number of Fair Calls # Number of fair calls during the last poll period
Number of Good Calls # Number of good calls during the last poll period
Number of Poor Calls # Number of poor calls during the last poll period
Number of Short Duration Calls # Number of calls that were too short for MOS to be calculated.
Total Number of Calls # Total calls during the last poll period
Note The total number of calls can be greater than the sum of acceptable, fair, good, and poor calls. Calls for which no MOS is calculated are included in the total number of calls.
A-3User Guide for Cisco Unified Service Statistics Manager
OL-20784-01

Appendix A Devices, Monitor Types, and AttributesService Monitor Database Monitor Types
Call Quality by NAM Monitor Type AttributesService Statistics Manager provides call quality monitors that support:
• Cluster-based data that Service Monitor obtains from Unified Communications Manager CDRs. For more information, see Call Quality Monitor Type Attributes, page A-3.
• Sensor-based data that Service Monitor obtains from NAMs and Cisco 1040 Sensors. Table A-3 lists the data supported by the Call Quality by NAM Monitor type. For the data supported by the Call Quality by Sensor Monitor type, see Table A-4.
Note • Sensor-based data does not reflect calls but call streams, which are 60-second RTP streams.
• Service Statistics Manager supplies default definitions for good, acceptable, fair, and poor call streams and enables you to change the definitions. For more information, see Configuring Call Quality, page 7-8.
Call Quality by Sensor Monitor Type AttributesService Statistics Manager provides call quality monitors that support:
• Cluster-based data that Service Monitor obtains from Unified Communications Manager CDRs. For more information, see Call Quality Monitor Type Attributes, page A-3.
• Sensor-based data that Service Monitor obtains from Cisco 1040 Sensors and NAMs. Table A-4 lists the data supported by Call Quality by Sensor Monitor type. For the data supported by the Call Quality by NAM Monitor type, see Table A-3.
Note • Sensor-based data does not reflect calls but call streams, which are 60-second RTP streams.
• Service Statistics Manager supplies default definitions for good, acceptable, fair, and poor call streams and enables you to change the definitions. For more information, see Configuring Call Quality, page 7-8.
Table A-3 Call Quality by NAM Monitor Type Attributes
Attribute Unit1
1. The data type for each unit is integer.
Description
Number of Acceptable Call Streams # Number of acceptable call streams during the last poll period
Number of Fair Call Streams # Number of fair call streams during the last poll period
Number of Good Call Streams # Number of good call streams during the last poll period
Number of Poor Call Streams # Number of poor call streams during the last poll period
Total Number of Call Streams # Total call streams during the last poll period
Note The total number of call streams can be greater than the sum of acceptable, fair, good, and poor call streams. Call streams for which no MOS is calculated are included in the total number of calls streams.
A-4User Guide for Cisco Unified Service Statistics Manager
OL-20784-01

Appendix A Devices, Monitor Types, and AttributesService Monitor Database Monitor Types
Call Volume Monitor Type AttributesTable A-5 lists the data supported by call volume monitors. Service Monitor obtains this data from Unified Communications Manager CDRs (cluster-based data). For call categories, these attributes are monitored:
• Number of calls
• Number of completed calls
• Number of failed calls
• Duration of calls
• Average duration per call
Note For calls to be categorized into the user-definable call categories—Emergency, International, Local, Long Distance, Service, and Toll Free—listed in Table A-5, you must configure Service Monitor call classification. For more information, see User Guide for Cisco Unified Service Monitor 2.3.
Table A-4 Call Quality by Sensor Monitor Type Attributes
Attribute Unit1
1. The data type for each unit is integer.
Description
Number of Acceptable Call Streams # Number of acceptable call streams during the last poll period
Number of Fair Call Streams # Number of fair call streams during the last poll period
Number of Good Call Streams # Number of good call streams during the last poll period
Number of Poor Call Streams # Number of poor call streams during the last poll period
Total Number of Call Streams # Total call streams during the last poll period
Note The total number of call streams can be greater than the sum of acceptable, fair, good, and poor call streams. Call streams for which no MOS is calculated are included in the total number of calls streams.
Table A-5 Call Volume Monitor Type Attributes
Attribute Unit1 Description
H323 Gateway–Inbound Calls # Number of inbound calls that passed through an H323 gateway during the last poll period
H323 Gateway–Outbound Calls # Number of outbound calls that passed through an H323 gateway during the last poll period
H323 Trunk Incoming # Number of inbound calls that passed through an H323 trunk during the last poll period
H323 Trunk Outgoing # Number of outbound calls that passed through an H323 trunk during the last poll period
MGCP Gateway–Inbound Calls # Number of inbound calls that passed through an MGCP gateway during the last poll period
A-5User Guide for Cisco Unified Service Statistics Manager
OL-20784-01

Appendix A Devices, Monitor Types, and AttributesService Monitor Database Monitor Types
MGCP Gateway–Outbound Calls # Number of outbound calls that passed through an MGCP gateway during the last poll period
SIP Trunk Incoming # Number of inbound calls that passed through a SIP trunk during the last poll period
SIP Trunk Outgoing # Number of outbound calls that passed through a SIP trunk during the last poll period
Aggregated
All Categories–Average Duration sec Total duration divided by total number of calls
All Categories–Completion Rate % Number of completed calls in all categories divided by the number of calls in all categories; expressed as percent
All Categories–Duration of Calls sec Total duration of calls during the last poll period
All Categories–Number of Calls # Total number of calls during the last poll period
All Categories–Number of Completed Calls
# Total number of completed calls during the last poll period
All Categories–Number of Failed Calls
# Total number of failed calls during the last poll period
Call Category: Conference
Conference–Average Duration # Duration of call streams connected to a conference divided by number of call streams connected to a conference
Conference–Duration of Calls sec Duration of call streams connected to a conference during the last poll period
Conference–Number of Calls # Number of call streams connected to a conference during the last poll period
Conference–Number of Completed Calls
# Number of completed call streams that had been connected to a conference during the last poll period
Conference–Number of Failed Calls # Number of call streams that failed while connecting to a conference call during the last poll period
Call Category: Emergency
Emergency–Average Duration # Duration of emergency calls divided by number of emergency calls
Emergency–Duration of Calls sec Duration of emergency calls during the last poll period
Emergency–Number of Calls # Number of emergency calls during the last poll period
Emergency–Number of Completed Calls
# Number of completed emergency calls during the last poll period
Emergency–Number of Failed Calls # Number of failed emergency calls during the last poll period
Call Category: ICT
ICT–Average Duration # Duration of intercluster trunk calls divided by number of intercluster trunk calls
ICT–Duration of Calls sec Duration of intercluster trunk calls during the last poll period
ICT–Number of Calls # Number of intercluster trunk calls during the last poll period
ICT–Number of Completed Calls # Number of completed intercluster trunk calls during the last poll period
ICT–Number of Failed Calls # Number of failed intercluster trunk calls during the last poll period
Table A-5 Call Volume Monitor Type Attributes (continued)
Attribute Unit1 Description
A-6User Guide for Cisco Unified Service Statistics Manager
OL-20784-01

Appendix A Devices, Monitor Types, and AttributesService Monitor Database Monitor Types
Call Category: Internal
Internal–Average Duration # Duration of internal calls divided by number of internal calls
Internal–Duration of Calls sec Duration of internal calls during the last poll period
Internal–Number of Calls # Number of internal calls during the last poll period
Internal–Number of Completed Calls # Number of completed internal calls during the last poll period
Internal–Number of Failed Calls # Number of failed internal calls during the last poll period
Call Category: International
International–Average Duration # Duration of international calls divided by number of international calls
International–Duration of Calls sec Duration of international calls during the last poll period
International–Number of Calls # Number of international calls during the last poll period
International–Number of Completed Calls
# Number of completed international calls during the last poll period
International–Number of Failed Calls
# Number of failed international calls during the last poll period
Call Category: Local
Local–Average Duration # Duration of locals divided by number of local calls
Local–Duration of Calls sec Duration of local calls during the last poll period
Local–Number of Calls # Number of local calls during the last poll period
Local–Number of Completed Calls # Number of completed local calls during the last poll period
Local–Number of Failed Calls # Number of failed local calls during the last poll period
Call Category: Long Distance
Long Distance–Average Duration # Duration of long distance calls divided by number of long distance calls
Long Distance–Duration of Calls sec Duration of long distance calls during the last poll period
Long Distance–Number of Calls # Number of long distance calls during the last poll period
Long Distance–Number of Completed Calls
# Number of completed long distance calls during the last poll period
Long Distance–Number of Failed Calls
# Number of failed long distance calls during the last poll period
Call Category: OnNet Trunk
OnNet Trunk–Average Duration # Duration of onNet trunk calls divided by number of onNet trunk calls
OnNet Trunk–Duration of Calls # Duration of onNet trunk calls during the last poll period
OnNet Trunk–Number of Calls # Number of onNet trunk calls during the last poll period
OnNet Trunk–Number of Completed Calls
# Number of completed onNet calls during the last poll period
OnNet Trunk–Number of Failed Calls
# Number of failed onNet calls during the last poll period
Call Category: Service
Service–Average Duration # Duration of service calls divided by number of service calls
Table A-5 Call Volume Monitor Type Attributes (continued)
Attribute Unit1 Description
A-7User Guide for Cisco Unified Service Statistics Manager
OL-20784-01
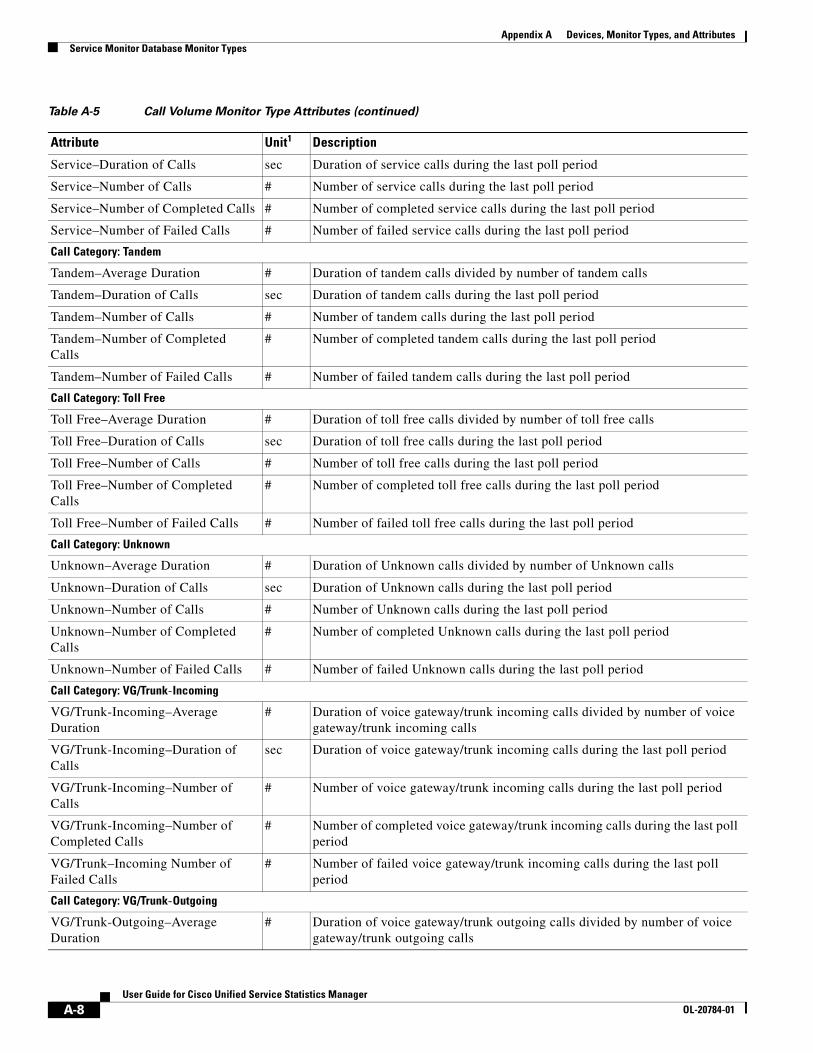
Appendix A Devices, Monitor Types, and AttributesService Monitor Database Monitor Types
Service–Duration of Calls sec Duration of service calls during the last poll period
Service–Number of Calls # Number of service calls during the last poll period
Service–Number of Completed Calls # Number of completed service calls during the last poll period
Service–Number of Failed Calls # Number of failed service calls during the last poll period
Call Category: Tandem
Tandem–Average Duration # Duration of tandem calls divided by number of tandem calls
Tandem–Duration of Calls sec Duration of tandem calls during the last poll period
Tandem–Number of Calls # Number of tandem calls during the last poll period
Tandem–Number of Completed Calls
# Number of completed tandem calls during the last poll period
Tandem–Number of Failed Calls # Number of failed tandem calls during the last poll period
Call Category: Toll Free
Toll Free–Average Duration # Duration of toll free calls divided by number of toll free calls
Toll Free–Duration of Calls sec Duration of toll free calls during the last poll period
Toll Free–Number of Calls # Number of toll free calls during the last poll period
Toll Free–Number of Completed Calls
# Number of completed toll free calls during the last poll period
Toll Free–Number of Failed Calls # Number of failed toll free calls during the last poll period
Call Category: Unknown
Unknown–Average Duration # Duration of Unknown calls divided by number of Unknown calls
Unknown–Duration of Calls sec Duration of Unknown calls during the last poll period
Unknown–Number of Calls # Number of Unknown calls during the last poll period
Unknown–Number of Completed Calls
# Number of completed Unknown calls during the last poll period
Unknown–Number of Failed Calls # Number of failed Unknown calls during the last poll period
Call Category: VG/Trunk-Incoming
VG/Trunk-Incoming–Average Duration
# Duration of voice gateway/trunk incoming calls divided by number of voice gateway/trunk incoming calls
VG/Trunk-Incoming–Duration of Calls
sec Duration of voice gateway/trunk incoming calls during the last poll period
VG/Trunk-Incoming–Number of Calls
# Number of voice gateway/trunk incoming calls during the last poll period
VG/Trunk-Incoming–Number of Completed Calls
# Number of completed voice gateway/trunk incoming calls during the last poll period
VG/Trunk–Incoming Number of Failed Calls
# Number of failed voice gateway/trunk incoming calls during the last poll period
Call Category: VG/Trunk-Outgoing
VG/Trunk-Outgoing–Average Duration
# Duration of voice gateway/trunk outgoing calls divided by number of voice gateway/trunk outgoing calls
Table A-5 Call Volume Monitor Type Attributes (continued)
Attribute Unit1 Description
A-8User Guide for Cisco Unified Service Statistics Manager
OL-20784-01

Appendix A Devices, Monitor Types, and AttributesOperations Manager File-Based Monitor Types
Operations Manager File-Based Monitor TypesFile-based monitors collect data from these Operations Manager files:
• Performance polling files—By default, Operations Manager polling intervals are set to about 4 minutes. During the Service Statistics Manager 30-minute polling interval for Operations Manager, Operations Manager can collect performance data and generate performance polling files approximately 7or 8 times.
Note Operations Manager polling intervals can vary because they are user-configurable.
For more information, see Configuring Polling and Thresholds in User Guide for Cisco Unified Operations Manager 2.3.
• Node-to-node test files—Node-to-node tests run on user-configurable schedules. During the Service Statistics Manager 30-minute polling interval, no test files or multiple test files can generated by Operations Manager, depending on the node-to-node test and its schedule.
Note By default, there are no node-to-node tests defined in Operations Manager.
For more information, see Using Node-to-Node Tests in User Guide for Cisco Unified Operations Manager.
VG/Trunk-Outgoing–Duration of Calls
sec Duration of voice gateway/trunk outgoing calls during the last poll period
VG/Trunk-Outgoing–Number of Calls
# Number of voice gateway/trunk outgoing calls during the last poll period
VG/Trunk-Outgoing–Number of Completed Calls
# Number of completed voice gateway/trunk outgoing calls during the last poll period
VG/Trunk–Outgoing Number of Failed Calls
# Number of failed voice gateway/trunk outgoing calls during the last poll period
Call Category: Voicemail
Voicemail–Average Duration # Duration of voicemail calls divided by number of voicemail calls
Voicemail–Duration of Calls sec Duration of voicemail calls during the last poll period
Voicemail–Number of Calls # Number of voicemail calls during the last poll period
Voicemail–Number of Completed Calls
# Number of completed voicemail calls during the last poll period
Voicemail–Number of Failed Calls # Number of failed voicemail calls during the last poll period
1. The data type for each unit is integer.
Table A-5 Call Volume Monitor Type Attributes (continued)
Attribute Unit1 Description
A-9User Guide for Cisco Unified Service Statistics Manager
OL-20784-01

Appendix A Devices, Monitor Types, and AttributesOperations Manager File-Based Monitor Types
For the data supported by each monitor type, see the following:
• Performance polling file-based monitors:
– CME Performance Monitor Type Attributes, page A-10
– CUE Performance Monitor Type Attributes, page A-10
– Gatekeeper Performance Monitor Type Attributes, page A-11
– Gateway Utilization Monitor Type Attributes, page A-11
– System Utilization for IOS Router Monitor Type Attributes, page A-12
– System Utilization for Unified CCE Monitor Type Attributes, page A-13
– System Utilization for Unified CM Monitor Type Attributes, page A-13
– System Utilization for Unity Monitor Type Attributes, page A-13
– System Utilization for Unity Connection Monitor Type Attributes, page A-14
– Trunk Utilization Monitor Type Attributes, page A-14
– Unified CCE Performance Monitor Type Attributes, page A-15
– Unified CM Performance Monitor Type Attributes, page A-15
• Node-to-Node Test File-Based Monitor Types and Attributes, page A-16
CME Performance Monitor Type AttributesCME Performance monitor type collects Cisco Unified Communications Manager Express data from Operations Manager.
CUE Performance Monitor Type AttributesCUE Performance monitor type collects data from Operations Manager. Operations Manager obtains the data from Perfmon counters on the Unified Communications Manager server.
Table A-6 CME Performance Monitor Type Attributes
Attribute Unit Description
% Ephones Registered % Percentage of ephones that are registered
% Key Ephones Registered % Percentage of configured key ephones that are registered
Active Call Legs # Number of active ephone call legs
Configured Key Ephones # Number of key ephones configured
Ephones Seen # Maximum number of sessions configured
Max Ephones # Maximum number of ephones that can be configured on the Cisco Unified Communications Manager Express
Registered Ephones # Number of ephones registered
Registered Key Ephones # Number of key ephones registered
A-10User Guide for Cisco Unified Service Statistics Manager
OL-20784-01

Appendix A Devices, Monitor Types, and AttributesOperations Manager File-Based Monitor Types
Gatekeeper Performance Monitor Type AttributesGatekeeper Performance monitor type collects data from Operations Manager. Operations Manager obtains the data from Perfmon counters on the Unified Communications Manager server.
Gateway Utilization Monitor Type AttributesGateway Utilization monitor type collects port usage from Operations Manager for H.323 and MGCP gateways that are registered to Unified Communications Manager. Operations Manager obtains the data from Perfmon counters on the Unified Communications Manager.
Table A-7 CUE Performance Monitor Type Attributes
Attribute Unit1
1. The data type for each unit is integer.
Description
Allocated Capacity # Cumulative number of minutes of storage allocated to mailboxes
Capacity of Voicemail # Minutes of storage permitted by license
Free Capacity # Number of minutes of storage available
Licensed Mailboxes # Maximum number of mailboxes permitted by license
Mailboxes that Are 90% full # Number of mailboxes that are at least 90% full
Orphaned Mailboxes % Percentage of licensed mailboxes that are orphaned
Orphaned Mailboxes # Number of mailboxes orphaned
Session Utilization % Percentage of maximum sessions in use
Storage Capacity Utilization % Percentage of storage in use
Table A-8 Gatekeeper Performance Monitor Type Attributes
Attribute Unit1
1. The data type for each unit is integer.
Description
Admission Confirmations for Local Zone
# Cumulative number of admission confirmations
Admission Rejections for Local Zone
# Cumulative number of admission rejections
Interzone Bandwidth Utilization % Interzone bandwidth utilization
Local Zone Bandwidth Utilization % Bandwidth utilization
A-11User Guide for Cisco Unified Service Statistics Manager
OL-20784-01

Appendix A Devices, Monitor Types, and AttributesOperations Manager File-Based Monitor Types
System Utilization for IOS Router Monitor Type AttributesSystem Utilization for IOS Router monitor type collects system utilization data from Operations Manager for these voice gateways: H.323 gateways, Cisco Unified Border Element (UBE) gatekeepers, Unified Communications Manager Express, Cisco Unity Express, and SRST-enabled routers.
Table A-9 Gateway Utilization Monitor Type Attributes
AttributeUnit1
1. The data type for each unit is integer.
Port Supported on Gateway Type
DescriptionH323 MGCP
BRI Utilization % X X Percent BRI active out of all configured on gateway
Call Count # X X • For H.323 gateways:
Total number of channels that show voice activity on each T1 CAS, E1 CAS, T1 PRI, E1 PRI, and BRI port on the gateway. Service Statistics Manager uses the most recent of the records that Operations Manager has written—one per port per gateway per polling period—during the 30 minutes before Service Statistics Manager polls.
• For MGCP gateways:
Cumulative number of calls completed on each T1 CAS, T1 PRI, E1 PRI, FXS, and FXO port on the gateway. Service Statistics Manager uses data from the records that Operations Manager has written throughout the 30 minutes before Service Statistics Manager polls.
E1 CAS Utilization % X X Percent E1 CAS active out of all configured on gateway
E1 PRI Utilization % X — Percent E1 PRI active out of all configured on gateway
E and M Utilization % X — Percent E&M active out of all configured on gateway
FXO Utilization % X X Percent FXO active out of all configured on gateway
FXS Utilization % X X Percent FXS active out of all configured on gateway
T1 CAS Utilization % X X Percent T1 CAS active out of all configured on gateway
T1 PRI Utilization % X X Percent T1 PRI active out of all configured on gateway
Table A-10 System Utilization for IOS Router Monitor Type Attributes
Attribute Unit1
1. The data type for each unit is integer.
Description
Available Memory MB Processor free memory in MB
CPU Utilization % Measured CPU percentage utilization for all CPUs
System Memory Utilization % Percentage memory in use
Total Memory MB Processor used memory plus processor free memory in MB
A-12User Guide for Cisco Unified Service Statistics Manager
OL-20784-01

Appendix A Devices, Monitor Types, and AttributesOperations Manager File-Based Monitor Types
System Utilization for Unified CCE Monitor Type AttributesSystem Utilization for Unified CCE monitor type collects system utilization data from Operations Manager for Cisco Unified Contact Center.
System Utilization for Unified CM Monitor Type AttributesSystem Utilization for Unified CM monitor type collects system utilization data from Operations Manager for Unified Communications Manager. Operations Manager obtains the data from Perfmon counters on the Unified Communications Manager server.
System Utilization for Unity Monitor Type AttributesSystem Utilization for Unity monitor type collects system utilization data from Operations Manager for Cisco Unity.
Table A-11 System Utilization for Unified CCE Monitor Type Attributes
Attribute Unit1
1. The data type for each unit is integer.
Description
Available Memory MB Available RAM in MB
CPU Utilization % Measured CPU percentage utilization for all CPUs
System Memory Utilization % Percent of RAM in use
Total Memory MB Total RAM in MB
Table A-12 System Utilization for Unified CM Monitor Type Attributes
Attribute Unit1
1. The data type for each unit is integer.
Description
Available Memory MB Available RAM in MB
CPU Utilization % Measured CPU percentage utilization for all CPUs
System Memory Utilization % Percent of RAM in use
Total Memory MB Total RAM in MB
Table A-13 System Utilization for Unity Monitor Type Attributes
Attribute Unit1
1. The data type for each unit is integer.
Description
Available Memory MB Available RAM in MB
CPU Utilization % Measured CPU percentage utilization for all CPUs
System Memory Utilization % Percent of RAM in use
Total Memory MB Total RAM in MB
A-13User Guide for Cisco Unified Service Statistics Manager
OL-20784-01

Appendix A Devices, Monitor Types, and AttributesOperations Manager File-Based Monitor Types
System Utilization for Unity Connection Monitor Type AttributesSystem Utilization for Unity Connection monitor type collects system utilization data from Operations Manager for Cisco Unity Connection.
Trunk Utilization Monitor Type AttributesTrunk Utilization monitor type collects data from Operations Manager for these types of gateways when they are registered to Unified Communications Manager:
• H.323
• MGCP (for the following port types):
– FXS
– FXO
– T1 PRI
– E1 PRI
– T1 CAS
Table A-14 System Utilization for Unity Monitor Type Attributes
Attribute Unit1
1. The data type for each unit is integer.
Description
Available Memory MB Available RAM in MB
CPU Utilization % Measured CPU percentage utilization for all CPUs
System Memory Utilization % Percent of RAM in use
Total Memory MB Total RAM in MB
Table A-15 Trunk Utilization Monitor Type Attributes
Attribute Unit1
1. The data type for each unit is integer.
Description
Call Count # Number of connected inbound and outbound calls that completed on the port.
Service Statistics Manager obtains the call count from the most recent performance polling file that Operations Manager has written for the port during the 30 minutes before Service Statistics Manager polls.
For more information, see Operations Manager File-Based Monitor Types, page A-9.
Outbound Busy Attempts # Number of outbound busy attempts on the port
Peak Usage % Highest percent usage found in the performance polling files that Operations Manager has written during the previous 30 minutes.
Utilization % Percentage busy of all ports or channels
A-14User Guide for Cisco Unified Service Statistics Manager
OL-20784-01
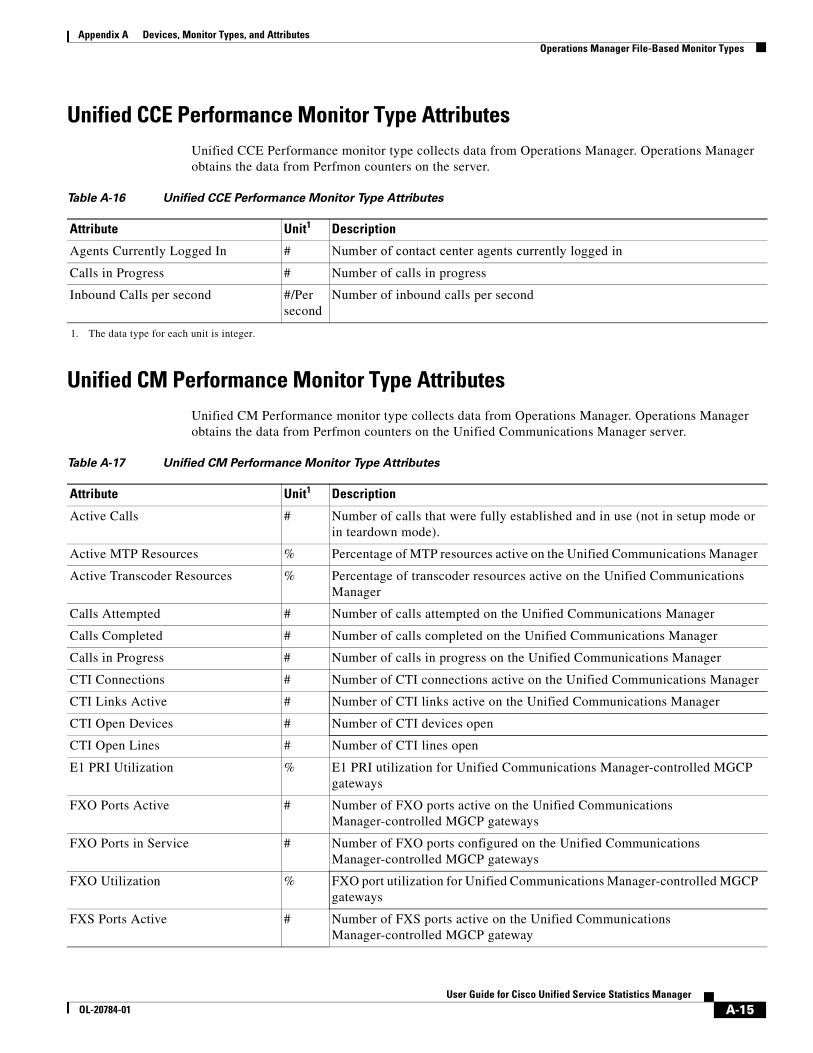
Appendix A Devices, Monitor Types, and AttributesOperations Manager File-Based Monitor Types
Unified CCE Performance Monitor Type AttributesUnified CCE Performance monitor type collects data from Operations Manager. Operations Manager obtains the data from Perfmon counters on the server.
Unified CM Performance Monitor Type Attributes Unified CM Performance monitor type collects data from Operations Manager. Operations Manager obtains the data from Perfmon counters on the Unified Communications Manager server.
Table A-16 Unified CCE Performance Monitor Type Attributes
Attribute Unit1
1. The data type for each unit is integer.
Description
Agents Currently Logged In # Number of contact center agents currently logged in
Calls in Progress # Number of calls in progress
Inbound Calls per second #/Per second
Number of inbound calls per second
Table A-17 Unified CM Performance Monitor Type Attributes
Attribute Unit1 Description
Active Calls # Number of calls that were fully established and in use (not in setup mode or in teardown mode).
Active MTP Resources % Percentage of MTP resources active on the Unified Communications Manager
Active Transcoder Resources % Percentage of transcoder resources active on the Unified Communications Manager
Calls Attempted # Number of calls attempted on the Unified Communications Manager
Calls Completed # Number of calls completed on the Unified Communications Manager
Calls in Progress # Number of calls in progress on the Unified Communications Manager
CTI Connections # Number of CTI connections active on the Unified Communications Manager
CTI Links Active # Number of CTI links active on the Unified Communications Manager
CTI Open Devices # Number of CTI devices open
CTI Open Lines # Number of CTI lines open
E1 PRI Utilization % E1 PRI utilization for Unified Communications Manager-controlled MGCP gateways
FXO Ports Active # Number of FXO ports active on the Unified Communications Manager-controlled MGCP gateways
FXO Ports in Service # Number of FXO ports configured on the Unified Communications Manager-controlled MGCP gateways
FXO Utilization % FXO port utilization for Unified Communications Manager-controlled MGCP gateways
FXS Ports Active # Number of FXS ports active on the Unified Communications Manager-controlled MGCP gateway
A-15User Guide for Cisco Unified Service Statistics Manager
OL-20784-01

Appendix A Devices, Monitor Types, and AttributesOperations Manager File-Based Monitor Types
Node-to-Node Test File-Based Monitor Types and AttributesOperations Manager collects data from user-configured node-to-node tests and stores the data in CSV files on the Operations Manager server. There is one Service Statistics Manager monitor type for each type of node-to-node test:
• IPSLA Data Jitter Monitor Type Attributes, page A-16
• IPSLA Gatekeeper Registration Delay Monitor Type Attributes, page A-17
• IPSLA Ping Echo Monitor Type Attributes, page A-17
• IPSLA Ping Path Echo Monitor Type Attributes, page A-17
• IPSLA UDP Echo Monitor Type Attributes, page A-18
IPSLA Data Jitter Monitor Type Attributes
IPSLA Data Jitter monitor type collects data from Operations Manager data jitter node-to-node tests. Operations Manager stores the data in CSV files.
FXS Ports in Service # Number of FXS ports configured on the Unified Communications Manager-controlled MGCP gateways
FXS Utilization % FXS port utilization for Unified Communications Manager-controlled MGCP gateways
H323 Calls Attempted # Number of calls attempted through the H323 gateways
H323 Calls Completed # Number of calls completed through the H323 gateways
H323 Calls In Progress # Number of calls in progress through the H323 gateways
Hardware Conference Resources Active
% Percentage of hardware conference resources active on the Unified Communications Manager
Registered Hardware Phones # Number of hardware phones registered with the Unified Communications Manager
Software Conference Resources Active
% Percentage of software conference resources active on the Unified Communications Manager
T1 CAS Utilization % T1 CAS utilization for Unified Communications Manager-controlled MGCP gateways
T1 PRI Utilization % T1 PRI utilization for Unified Communications Manager-controlled MGCP gateways
T1/E1 PRI Channels Active # Number of PRI channels (T1/E1 PRI) active on the Unified Communications Manager-controlled MGCP gateways
T1/E1 PRI Channels in Service # Number of PRI channels (T1/E1 PRI) configured on the Unified Communications Manager-controlled MGCP gateways
1. The data type for each unit is integer.
Table A-17 Unified CM Performance Monitor Type Attributes (continued)
Attribute Unit1 Description
A-16User Guide for Cisco Unified Service Statistics Manager
OL-20784-01

Appendix A Devices, Monitor Types, and AttributesOperations Manager File-Based Monitor Types
IPSLA Gatekeeper Registration Delay Monitor Type Attributes
IPSLA Gatekeeper Registration monitor type collects data from Operations Manager gateway registration daily node-to-node tests. Operations Manager stores the data in CSV files.
IPSLA Ping Echo Monitor Type Attributes
IPSLA Ping Echo monitor type collects data from Operations Manager ping echo node-to-node tests. Operations Manager stores the data in CSV files.
IPSLA Ping Path Echo Monitor Type Attributes
IPSLA Ping Patch monitor type collects data from Operations Manager ping path echo node-to-node tests. Operations Manager stores the data in CSV files.
Table A-18 IPSLA Data Jitter Monitor Type Attributes
Attribute Unit1
1. The data type for each unit is integer.
Description
Average Latency Milliseconds Average latency in milliseconds
DS Jitter Milliseconds Destination to source jitter
DS Packet Loss % Percentage destination to source packet loss
SD Jitter Milliseconds Source to destination jitter
SD Packet Loss % Percentage source to destination packet loss
Table A-19 IPSLA Gatekeeper Registration Delay Monitor Type Attributes
Attribute Unit1
1. The data type for each unit is integer.
Description
Registration Response Time Milliseconds Registration response time
Table A-20 IPSLA Ping Echo Monitor Type Attributes
Attribute Unit1
1. The data type for each unit is integer.
Description
Round-Trip Response Time Milliseconds Round trip time
Table A-21 IPSLA Ping Path Echo Monitor Type Attributes
Attribute Unit1
1. The data type for each unit is integer.
Description
Round-Trip Response Time Milliseconds Round trip time
A-17User Guide for Cisco Unified Service Statistics Manager
OL-20784-01
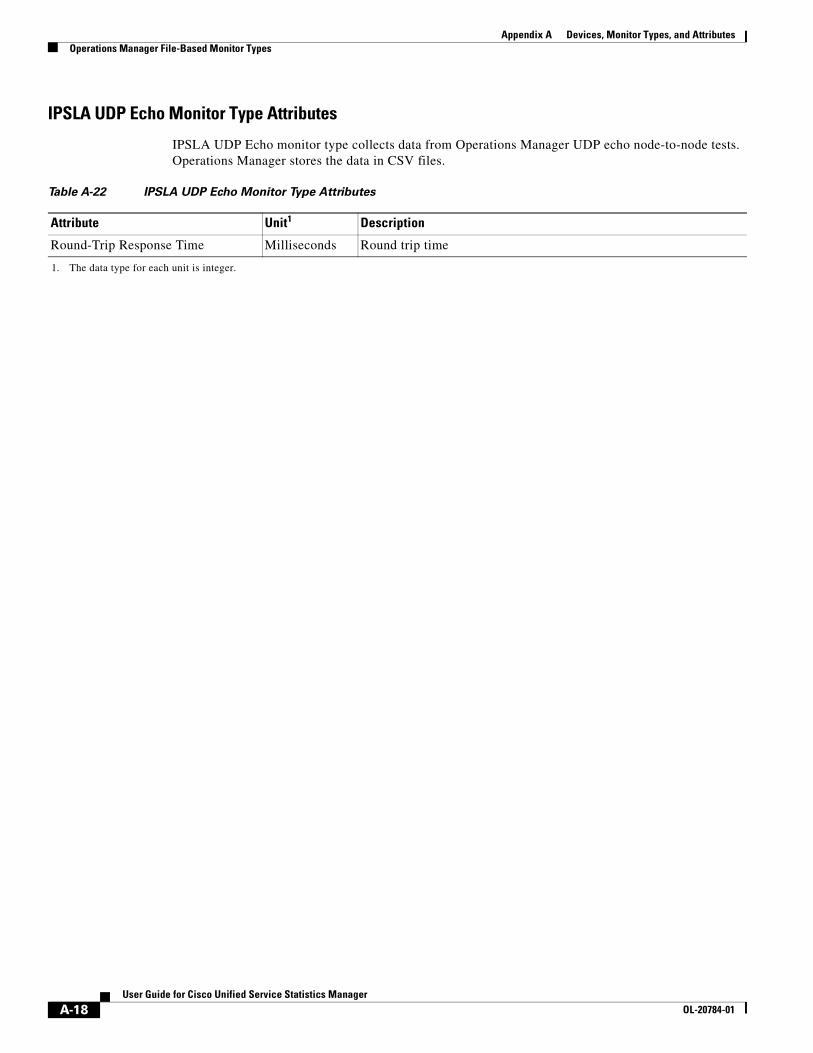
Appendix A Devices, Monitor Types, and AttributesOperations Manager File-Based Monitor Types
IPSLA UDP Echo Monitor Type Attributes
IPSLA UDP Echo monitor type collects data from Operations Manager UDP echo node-to-node tests. Operations Manager stores the data in CSV files.
Table A-22 IPSLA UDP Echo Monitor Type Attributes
Attribute Unit1
1. The data type for each unit is integer.
Description
Round-Trip Response Time Milliseconds Round trip time
A-18User Guide for Cisco Unified Service Statistics Manager
OL-20784-01

User Guide OL-20784-01
A
P P E N D I X B Default Report DefinitionsIf you deleted a default report, you can recreate it using the information provided here. Table B-1 provides most of the information that you need to complete each page of the report wizard. Here is some additional guidance for recreating default reports:
• Report Wizard—Page 1
Enter the report name and select the report type. To select the report type, hover over the Select link, hover over General, and then select the report type from the list.
• Report Wizard—Page 2
Create one or more subreports. (Subreport names are provided in Table B-1.) Among the items that you need to select for each subreport are:
– Monitor Type—If not listed in Table B-1, you will not need to select one.
– Attributes—If not listed in Table B-1, you will not need to select them.
– Show—For the most part, Table B-1 does not provide instructions for selecting among the Show Table Only, Show Graph Only, and Show Table and Graph options. Generally, default reports show both a table and a graph (select Show Table and Graph). A table only is displayed (select Show Table Only), however, for these reports:
Top N Gateways by Utilization—Monthly
Top N Service Availability Across Clusters by Time—Monthly
Top N Trunks by Utilization—Monthly
Additional options might be displayed on page 2; required input varies depending on the report type.
• Report Wizard—Page 3
Page 3 includes options for report display, e-mail, and schedule. Report display and e-mail options are a matter of preference. Among schedule options, Table B-1 provides the frequency. Schedule options for default reports should include:
– Scheduled (not On Demand)
– Schedule—No Filter
– Sharing—Share This Report with Everybody
– Report Period—Select the period that aligns with the frequency specified in Table B-1:
Daily—1 day
Weekly—Last 7 days
Monthly—Last 30 days
B-1for Cisco Unified Service Statistics Manager

Appendix B Default Report Definitions
Select the Reports tab and click the Create button to start the report wizard. Table B-1 walks you through the major settings on all three pages of the report wizard.
Table B-1 Page-by-page Report Wizard Entries and Selections for Recreating Default Reports
Page 1 Page 2 Page 3
Report Name Report Type Monitor Type AttributesSubreport Name Frequency
Average Call Duration Across Clusters - Monthly
Instance Aggregation
Call Volume • Voice Mail - Average Duration (hh:mm:ss)
• International - Average Duration (hh:mm:ss)
• Emergency - Average Duration (hh:mm:ss)
• Long Distance - Average Duration (hh:mm:ss)
• Local - Average Duration (hh:mm:ss)
Average Call Duration Across Clusters - Monthly
Monthly
Average Call Duration vs Volume Across Clusters - Monthly
Instance Aggregation
Call Volume • Voice Mail - Duration of Calls (hh:mm:ss)
• International - Duration of Calls (hh:mm:ss)
• Emergency - Duration of Calls (hh:mm:ss)
• Long Distance - Duration of Calls (hh:mm:ss)
• Local - Duration of Calls (hh:mm:ss)
Call Duration Across Clusters
Monthly
Call Volume • Voice Mail - Number of Calls (#)
• International - Number of Calls (#)
• Emergency - Number of Calls (#)
• Long Distance - Number of Calls (#)
• Local - Number of Calls (#)
Call Volume Across Clusters
Average Duration of Calls Across Clusters - Monthly
Instance Aggregation
Call Volume All Categories - Average Duration (hh:mm:ss)
Average Duration of Calls Across Clusters - Monthly
Monthly
B-2User Guide for Cisco Unified Service Statistics Manager
OL-20784-01

Appendix B Default Report Definitions
Call Completion Rate Across Clusters - Monthly
Instance Aggregation
Call Volume Select Show Only Graph and select these attributes:
• All Categories - Number of Completed Calls (#)
• All Categories - Number of Failed Calls (#)
Call Completion Rate Across Clusters
Monthly
Call Volume Select Show Only Table and select these attributes:
• All Categories - Number of Completed Calls (#)
• All Categories - Number of Failed Calls (#)
• All Categories - Number of Calls (#)
• All Categories - Completion Rate (%)
Call Completion Rate Across clusters
Monthly
Call Duration Across Clusters - Monthly
Instance Aggregation
Call Volume • Voice Mail - Duration of Calls (hh:mm:ss)
• International - Duration of Calls (hh:mm:ss)
• Emergency - Duration of Calls (hh:mm:ss)
• Long Distance - Duration of Calls (hh:mm:ss)
• Local - Duration of Calls (hh:mm:ss)
Call Duration Across Clusters - Monthly
Monthly
Call Failure Summary - Daily
Call Failure Analysis
— — Call Failure Summary - Daily
Daily
Call Service Quality Summary - Weekly
Call Quality Summary
— — Call Service Quality Summary - Weekly
Weekly
Call Traffic and Duration Across Clusters - Daily
Instance Aggregation
Call Volume • All Categories - Number of Calls (#) Call Traffic (For All Elements)
Daily
Call Volume • All Categories - Duration of Calls (hh:mm:ss)
• All Categories - Average Duration (hh:mm:ss)
Call Duration (For All Elements)
Table B-1 Page-by-page Report Wizard Entries and Selections for Recreating Default Reports (continued)
Page 1 Page 2 Page 3
Report Name Report Type Monitor Type AttributesSubreport Name Frequency
B-3User Guide for Cisco Unified Service Statistics Manager
OL-20784-01

Appendix B Default Report Definitions
Call Volume Across Clusters - Monthly
Instance Aggregation
Call Volume • Voice Mail - Number of Calls (#)
• International - Number of Calls (#)
• Emergency - Number of Calls (#)
• Long Distance - Number of Calls (#)
• Local - Number of Calls (#)
Call Volume Across Clusters - Monthly
Monthly
Call Volume Across Clusters by Location - Monthly
Group Aggregation
Call Volume • Voice Mail - Number of Calls (#)
• International - Number of Calls (#)
• Emergency - Number of Calls (#)
• Long Distance - Number of Calls (#)
• Local - Number of Calls (#)
Call Volume Across Clusters by Location - Monthly
Monthly
Call Volume Over Time Across Clusters - Weekly
Time Aggregation
Call Volume • Voice Mail - Number of Calls (#)
• International - Number of Calls (#)
• Emergency - Number of Calls (#)
• Long Distance - Number of Calls (#)
• Local - Number of Calls (#)
Call Volume Over Time Across Clusters - Weekly
Weekly
Call Volume Percentage Distribution by Call Category - Monthly
Time Aggregation
Call Volume • Voice Mail - Number of Calls (#)
• International - Number of Calls (#)
• Emergency - Number of Calls (#)
• Long Distance - Number of Calls (#)
• Local - Number of Calls (#)
Call Volume Percentage Distribution by Call Category - Monthly
Monthly
Call Volume Report on H.323 Gateways Across Clusters
Instance Aggregation
Call Volume • H.323 Gateway - Inbound Calls (#)
• H.323 Gateway - Outbound Calls (#)
• H.323 Gateway - Tandem Calls (#)
Call Volume Report on H.323 Gateways Across Clusters
Weekly
CME Performance - Daily
Time Aggregation
CME Performance
• Registered Ephones (#)
• % Ephones Registered (%)
• Registered Key Ephones (#)
• % Key Ephones Registered (%)
CME Performance - Daily
Daily
CME Performance - Monthly
Time Aggregation
CME Performance
• Registered Ephones (#)
• % Ephones Registered (%)
• Registered Key Ephones (#)
• % Key Ephones Registered (%)
CME Performance - Monthly
Monthly
Table B-1 Page-by-page Report Wizard Entries and Selections for Recreating Default Reports (continued)
Page 1 Page 2 Page 3
Report Name Report Type Monitor Type AttributesSubreport Name Frequency
B-4User Guide for Cisco Unified Service Statistics Manager
OL-20784-01
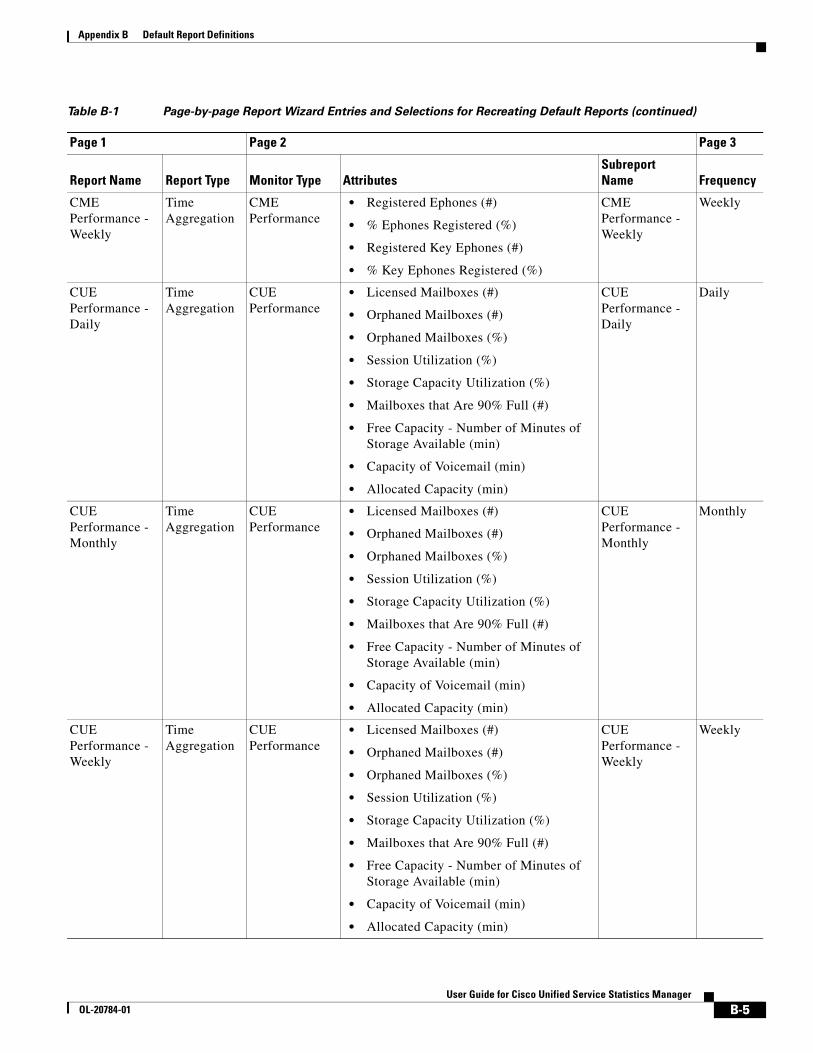
Appendix B Default Report Definitions
CME Performance - Weekly
Time Aggregation
CME Performance
• Registered Ephones (#)
• % Ephones Registered (%)
• Registered Key Ephones (#)
• % Key Ephones Registered (%)
CME Performance - Weekly
Weekly
CUE Performance - Daily
Time Aggregation
CUE Performance
• Licensed Mailboxes (#)
• Orphaned Mailboxes (#)
• Orphaned Mailboxes (%)
• Session Utilization (%)
• Storage Capacity Utilization (%)
• Mailboxes that Are 90% Full (#)
• Free Capacity - Number of Minutes of Storage Available (min)
• Capacity of Voicemail (min)
• Allocated Capacity (min)
CUE Performance - Daily
Daily
CUE Performance - Monthly
Time Aggregation
CUE Performance
• Licensed Mailboxes (#)
• Orphaned Mailboxes (#)
• Orphaned Mailboxes (%)
• Session Utilization (%)
• Storage Capacity Utilization (%)
• Mailboxes that Are 90% Full (#)
• Free Capacity - Number of Minutes of Storage Available (min)
• Capacity of Voicemail (min)
• Allocated Capacity (min)
CUE Performance - Monthly
Monthly
CUE Performance - Weekly
Time Aggregation
CUE Performance
• Licensed Mailboxes (#)
• Orphaned Mailboxes (#)
• Orphaned Mailboxes (%)
• Session Utilization (%)
• Storage Capacity Utilization (%)
• Mailboxes that Are 90% Full (#)
• Free Capacity - Number of Minutes of Storage Available (min)
• Capacity of Voicemail (min)
• Allocated Capacity (min)
CUE Performance - Weekly
Weekly
Table B-1 Page-by-page Report Wizard Entries and Selections for Recreating Default Reports (continued)
Page 1 Page 2 Page 3
Report Name Report Type Monitor Type AttributesSubreport Name Frequency
B-5User Guide for Cisco Unified Service Statistics Manager
OL-20784-01

Appendix B Default Report Definitions
Detailed Performance - Daily
Instance Aggregation
Unified CM Performance
• Hardware Conference Resources Active (%)
• Software Conference Resources Active (%)
• Active MTP Resources (%)
• Active Transcoder Resources (%)
Unified CM Performance for All Elements
Daily
Unified CM Performance
• E1 PRI Utilization (%)
• FXO Utilization (%)
• FXS Utilization (%)
• T1 CAS Utilization (%)
• T1 PRI Utilization (%)
Unified CM Utilization Performance for All Elements
Unified CM Performance
• FXO Ports Active (#)
• FXS Ports Active (#)
Unified CM Ports Active for All Elements
Unified CM Performance
T1/E1 PRI Channels Active (#) Unified CM Channels Active for All Elements
Unified CM Performance
• CTI Connections (#)
• CTI Links Active (#)
• CTI Open Devices (#)
• CTI Open Lines (#)
Unified CM CTI Performance for All Elements
Unified CM Performance
H323 Calls Attempted (#) Unified CM Calls Attempted for All Elements
Distribution of Service Quality Across Clusters by Time - Monthly
Time Aggregation
Call Quality • Number of Good Calls (%)
• Number of Poor Calls (%)
• Number of Fair Calls (%)
• Number of Acceptable Calls (%)
Distribution of Service Quality Across Clusters by Time - Monthly
Monthly
Distribution of Service Quality Across NAMs by Time - Monthly
Time Aggregation
Call Quality By NAM
• Number of Good Call Streams (#)
• Number of Poor Call Streams (#)
• Number of Fair Call Streams (#)
• Number of Acceptable Call Streams (#)
Distribution of Service Quality Across NAMs by Time - Monthly
Monthly
Table B-1 Page-by-page Report Wizard Entries and Selections for Recreating Default Reports (continued)
Page 1 Page 2 Page 3
Report Name Report Type Monitor Type AttributesSubreport Name Frequency
B-6User Guide for Cisco Unified Service Statistics Manager
OL-20784-01

Appendix B Default Report Definitions
Distribution of Service Quality Across Sensors by Time - Monthly
Time Aggregation
Call Quality By Sensor
• Number of Good Call Streams (#)
• Number of Poor Call Streams (#)
• Number of Fair Call Streams (#)
• Number of Acceptable Call Streams (#)
Distribution of Service Quality Across Sensors by Time - Monthly
Monthly
Failed Calls Across Clusters - Monthly
Instance Aggregation
Call Volume • All Categories - Number of Completed Calls (#)
• All Categories - Number of Failed Calls (#)
Failed Calls Across Clusters - Monthly
Monthly
Gatekeeper Performance - Daily
Time Aggregation
Gatekeeper Performance
• Local Zone Bandwidth Utilization (%)
• Interzone Bandwidth Utilization (%)
• Admission Rejections for Local Zone (#)
• Admission Confirmations for Local Zone (#)
Gatekeeper Performance - Daily
Daily
Gatekeeper Performance - Monthly
Time Aggregation
Gatekeeper Performance
• Local Zone Bandwidth Utilization (%)
• Interzone Bandwidth Utilization (%)
• Admission Rejections for Local Zone (#)
• Admission Confirmations for Local Zone (#)
Gatekeeper Performance - Monthly
Monthly
Gatekeeper Performance - Weekly
Time Aggregation
Gatekeeper Performance
• Local Zone Bandwidth Utilization (%)
• Interzone Bandwidth Utilization (%)
• Admission Rejections for Local Zone (#)
• Admission Confirmations for Local Zone (#)
Gatekeeper Performance - Weekly
Weekly
Gateway Utilization - Daily
Time Aggregation
Gateway Utilization
• T1 CAS Utilization (%)
• E1 CAS Utilization (%)
• T1 PRI Utilization (%)
• E1 PRI Utilization (%)
• FXO Utilization (%)
• FXS Utilization (%)
• BRI Utilization (%)
• E and M Utilization (%)
Gateway Utilization - Daily
Daily
Table B-1 Page-by-page Report Wizard Entries and Selections for Recreating Default Reports (continued)
Page 1 Page 2 Page 3
Report Name Report Type Monitor Type AttributesSubreport Name Frequency
B-7User Guide for Cisco Unified Service Statistics Manager
OL-20784-01

Appendix B Default Report Definitions
Gateway Utilization - Monthly
Time Aggregation
Gateway Utilization
• T1 CAS Utilization (%)
• E1 CAS Utilization (%)
• T1 PRI Utilization (%)
• E1 PRI Utilization (%)
• FXO Utilization (%)
• FXS Utilization (%)
• BRI Utilization (%)
• E and M Utilization (%)
Gateway Utilization - Monthly
Monthly
Gateway Utilization - Weekly
Time Aggregation
Gateway Utilization
• T1 CAS Utilization (%)
• E1 CAS Utilization (%)
• T1 PRI Utilization (%)
• E1 PRI Utilization (%)
• FXO Utilization (%)
• FXS Utilization (%)
• BRI Utilization (%)
• E and M Utilization (%)
Gateway Utilization - Weekly
Weekly
IPSLA Test Statistics
Instance Aggregation
IPSLA Data Jitter
Round Trip Response Time (ms) IPSLA Data Jitter Statistics
Monthly
IPSLA Ping Echo
Round Trip Response Time (ms) IPSLA Ping Echo Statistic
IPSLA Ping Path Echo
Round Trip Response Time (ms) IPSLA Ping Path Echo Statistics
IPSLA UDP Echo
Round Trip Response Time (ms) IPSLA UDP Echo Statistics
IPSLA Gatekeeper RD
Registration Response Time (ms) IPSLA Gatekeeper Reg Delay Statistics
Percentage Distribution of Service Quality Across Clusters by Time - Weekly
Time Aggregation
Call Quality • Number of Good Calls (%)
• Number of Poor Calls (%)
• Number of Fair Calls (%)
• Number of Acceptable Calls (%)
Percentage Distribution of Service Quality Across Clusters by Time - Weekly
Weekly
Table B-1 Page-by-page Report Wizard Entries and Selections for Recreating Default Reports (continued)
Page 1 Page 2 Page 3
Report Name Report Type Monitor Type AttributesSubreport Name Frequency
B-8User Guide for Cisco Unified Service Statistics Manager
OL-20784-01

Appendix B Default Report Definitions
Percentage Distribution of Service Quality Across NAMs by Time - Weekly
Time Aggregation
Call Quality By NAM
• Number of Good Call Streams (#)
• Number of Poor Call Streams (#)
• Number of Fair Call Streams (#)
• Number of Acceptable Call Streams (#)
Percentage Distribution of Service Quality Across NAMs by Time - Weekly
Weekly
Percentage Distribution of Service Quality Across Sensors by Time - Weekly
Time Aggregation
Call Quality By Sensor
• Number of Good Call Streams (#)
• Number of Poor Call Streams (#)
• Number of Fair Call Streams (#)
• Number of Acceptable Call Streams (#)
Percentage Distribution of Service Quality Across Sensors by Time - Weekly
Weekly
Service Availability Across Clusters - Weekly
Instance Aggregation
Call Volume All Categories - Number of Completed Calls (#)
Service Availability Across Clusters - Weekly
Weekly
Service Quality Distribution Across Clusters - Monthly
Instance Aggregation
Call Quality • Number of Good Calls (#)
• Number of Poor Calls (#)
• Number of Fair Calls (#)
• Number of Acceptable Calls (#)
Service Quality Distribution Across Clusters - Monthly
Monthly
Service Quality Distribution Across NAMs - Monthly
Instance Aggregation
Call Quality By NAM
• Number of Good Call Streams (#)
• Number of Poor Call Streams (#)
• Number of Fair Call Streams (#)
• Number of Acceptable Call Streams (#)
Service Quality Distribution Across NAMs - Monthly
Monthly
Service Quality Distribution Across Sensors - Monthly
Instance Aggregation
Call Quality By Sensor
• Number of Good Call Streams (#)
• Number of Poor Call Streams (#)
• Number of Fair Call Streams (#)
• Number of Acceptable Call Streams (#)
Service Quality Distribution Across Sensors - Monthly
Monthly
Service Quality Percentage Distribution Across Clusters - Monthly
Instance Aggregation
Call Quality • Number of Good Calls (%)
• Number of Poor Calls (%)
• Number of Fair Calls (%)
• Number of Acceptable Calls (%)
Service Quality Percentage Distribution Across Clusters - Monthly
Monthly
Service Quality Percentage Distribution Across NAMs - Monthly
Instance Aggregation
Call Quality By NAM
• Number of Good Call Streams (#)
• Number of Poor Call Streams (#)
• Number of Fair Call Streams (#)
• Number of Acceptable Call Streams (#)
Service Quality Percentage Distribution Across NAMs - Monthly
Monthly
Table B-1 Page-by-page Report Wizard Entries and Selections for Recreating Default Reports (continued)
Page 1 Page 2 Page 3
Report Name Report Type Monitor Type AttributesSubreport Name Frequency
B-9User Guide for Cisco Unified Service Statistics Manager
OL-20784-01

Appendix B Default Report Definitions
Service Quality Percentage Distribution Across Sensors - Monthly
Instance Aggregation
Call Quality By Sensor
• Number of Good Call Streams (#)
• Number of Poor Call Streams (#)
• Number of Fair Call Streams (#)
• Number of Acceptable Call Streams (#)
Service Quality Percentage Distribution Across Sensors - Monthly
Monthly
System Utilization For IOS Routers - Daily
Time Aggregation
System Utilization For IOS Routers
• CPU Utilization (%)
• Available Memory (MB)
• System Memory Utilization (%)
• Total Memory (MB)
System Utilization For IOS Routers - Daily
Daily
System Utilization For IOS Routers - Monthly
Time Aggregation
System Utilization For IOS Routers
• CPU Utilization (%)
• Available Memory (MB)
• System Memory Utilization (%)
• Total Memory (MB)
System Utilization For IOS Routers - Monthly
Monthly
System Utilization For IOS Routers - Weekly
Time Aggregation
System Utilization For IOS Routers
• CPU Utilization (%)
• Available Memory (MB)
• System Memory Utilization (%)
• Total Memory (MB)
System Utilization For IOS Routers - Weekly
Weekly
Top N Calls Based on Duration
Top N Calls — — Top N Calls Based on Duration
Weekly
Top N Dialed Numbers Based on Call Count
Top N Dialed Numbers
— — Top N Dialed Numbers Based on Call Count
Weekly
Top N Dialed Numbers Based on Call Duration
Top N Dialed Numbers
— — Top N Dialed Numbers Based on Call Duration
Weekly
Top N Gateways by Utilization - Monthly
Top N Performers
Gateway Utilization
— Top N Gateways by Utilization - Monthly
Monthly
Top N Service Availability Across Clusters by Time - Monthly
Top N Performers
Call Volume — Top N Service Availability Across Clusters by Time - Monthly
Monthly
Table B-1 Page-by-page Report Wizard Entries and Selections for Recreating Default Reports (continued)
Page 1 Page 2 Page 3
Report Name Report Type Monitor Type AttributesSubreport Name Frequency
B-10User Guide for Cisco Unified Service Statistics Manager
OL-20784-01

Appendix B Default Report Definitions
Top N Trunks by Utilization - Monthly
Top N Performers
Trunk Utilization
— Top N Trunks by Utilization - Monthly
Monthly
Top N Users Top N Users — — Top N Users Weekly
Total Duration Across Clusters - Monthly
Instance Aggregation
Call Volume All Categories - Duration of Calls (hh:mm:ss)
Total Duration Across Clusters - Monthly
Monthly
Traffic Summary - Day of Month
Traffic Summary
— — Traffic Summary - Day of Month
Monthly
Traffic Summary - Day of week
Traffic Summary
— — Traffic Summary - Day of week
Weekly
Traffic Summary - Hour of Day
Traffic Summary
— — Traffic Summary - Hour of Day
Daily
Trunk Traffic Over Time
Time Aggregation
Trunk Utilization
Call Count (#) Trunk Traffic Over Time
Monthly
Trunk Utilization - Daily
Time Aggregation
Trunk Utilization
Utilization (%) Trunk Utilization - Daily
Daily
Trunk Utilization - Monthly
Time Aggregation
Trunk Utilization
Utilization (%) Trunk Utilization - Monthly
Monthly
Trunk Utilization - Weekly
Time Aggregation
Trunk Utilization
Utilization (%) Trunk Utilization - Weekly
Weekly
Unified CCE Performance - Daily
Time Aggregation
Unified CCE Performance
• Calls in Progress (#)
• Agents Currently Logged In (#)
• Inbound Calls (per sec)
Unified CCE Performance - Daily
Daily
Unified CCE Performance - Monthly
Time Aggregation
Unified CCE Performance
• Calls in Progress (#)
• Agents Currently Logged In (#)
• Inbound Calls (per sec)
Unified CCE Performance - Monthly
Monthly
Unified CCE Performance - Weekly
Time Aggregation
Unified CCE Performance
• Calls in Progress (#)
• Agents Currently Logged In (#)
• Inbound Calls (per sec)
Unified CCE Performance - Weekly
Weekly
Table B-1 Page-by-page Report Wizard Entries and Selections for Recreating Default Reports (continued)
Page 1 Page 2 Page 3
Report Name Report Type Monitor Type AttributesSubreport Name Frequency
B-11User Guide for Cisco Unified Service Statistics Manager
OL-20784-01

Appendix B Default Report Definitions
B-12User Guide for Cisco Unified Service Statistics Manager
OL-20784-01

User OL-20784-01
G L O S S A R Y
Revised: April 16, 2010, OL-20784-01
A
attribute A statistic for a monitor type. For example, available memory—the available RAM in MB—is an attribute of the System Utilization for Unity monitor type.
attribute set One or more monitor types and the attributes to collect for each.
admin One of these: Default user in the Service Statistics Manager Administrator role; Operations Manager network administrator user role and default user in the role.
C
call quality Determined by the MOS reported for a call (see CDR) or call stream.
call stream 60-second Real-Time Transport Protocol (RTP) stream collected by a sensor; MOS is calculated on the sensor.
CDR Call Data Record from Unified Communications Manager. CDRs include data for complete calls and—in Unified Communications Manager versions that support Cisco Voice Transmission Quality (CVTQ)—MOS is calculated using the CVTQ algorithm.
cluster-based data Data obtained from Unified Communications Manager (CDR).
CME Cisco Unified Communications Manager Express
CUE Cisco Unity Express.
D
dashboard view A view to optionally display in a pane on the Reports tab. Each user can select a dashboard view or no dashboard view.
E
element A device type, such as a gateway, or a voice and IP communications system type, such as Unified Communications Manager.
GL-1Guide for Cisco Unified Service Statistics Manager

Glossary
H
home view View displayed when you select the Views tab. Each user can select a home view.
I
instance Specific occurrence of a monitor, an SLA, or an element. An instance of an element is a specific device or voice and IP communications system.
IPSLA Cisco IOS IP Service Level Agreement.
M
managed element An instance of an element for which a monitor exists.
monitor A data collector that resides on the Operations Manager or Service Monitor server and collects particular attributes for an instance of an element. Created, controlled, and coordinated by the SSM Agent on the Operations Manager or Service Monitor server.
monitor type A template for creating a monitor; specifies the device type—or voice and IP communications system type—for which data is collected and the attributes to collect.
monitored resource See managed element.
monitored element See managed element.
MOS Mean Opinion Score. A scale from zero (0) to five (5) with 0 being the worst and 5 being the best possible call quality.
N
NAM Cisco Network Analysis Module. Can capture voice network data and analyze MOS.
R
remote agent An SSM Agent that is installed on a server other than the one on which the Service Statistics Manager server is installed.
S
sensor Cisco 1040 Sensor. Can capture voice network data and analyze MOS.
GL-2User Guide for Cisco Unified Service Statistics Manager
OL-20784-01

Glossary
sensor-based data Data obtained from sensors. See also call stream.
Service Statistics
Manager server
Processes and aggregates data received from SSM agents. Enables display and configuration of reports, graphs, and views. Includes database.
SSM Administration
Console
Separately installable download (automatically installed on Service Statistics Manager server system). Accessible only to a privileged user. Used to configure groups, security, and SSM agents.
SSM Agent Separately installable download. Creates monitors and coordinates polling for and delivery of data. Must reside on an Operations Manager and on Service Monitor servers. Must connect with only one Service Statistics Manager server. Communicates with the Service Statistics Manager server over TCP.
SLA Service Level Agreement. Enables creation and monitoring of user-defined thresholds through a dashboard and reports. Available with Premium license.
U
Unified CCE Cisco Unified Contact Center Express.
Unified CM Cisco Unified Communications Manager.
V
view A group of graphs or reports organized on a single page (Views tab) or pane (dashboard view) as clickable thumbnails from which to launch associated graphs and reports.
GL-3User Guide for Cisco Unified Service Statistics Manager
OL-20784-01

Glossary
GL-4User Guide for Cisco Unified Service Statistics Manager
OL-20784-01

User OL-20784-01
I N D E X
A
about
custom graphs 4-1
reports 3-1
Service Statistics Manager 1-1
SLAs 5-1
SSM Administration Console 6-1
views 2-1
adding
attribute set 7-3
comment to a report 3-15
monitors to a graph 4-12
report to a view 3-15
schedule 5-17, 7-5
SLA 5-8
SLA type 5-12
specific graph to a view 4-13
administration
database 8-1
system 8-1
Administrator, user class 6-1
admin user, default
Operations Manager 7-12
SSM Administration Console 6-1
area graph, creating 4-3
attributes
attribute set, configuring 7-3
selecting 2-7
tab in graph display 4-10
See also attributes by monitor type
attributes by monitor type
call quality A-3
call quality by NAM A-4
call quality by sensor A-4
call volume A-5
CME performance A-10
CUE performance A-10
gatekeeper performance A-11
gateway utilization A-11
IPSLA data jitter A-16
IPSLA gatekeeper registration delay A-17
IPSLA ping echo A-17
IPSLA ping path echo A-17
IPSLA UDP echo A-18
system utilization for IOS router A-12
system utilization for Unified CCE A-13
system utilization for Unified CM A-13
system utilization for Unity A-13
system utilization for Unity Connection A-14
trunk utilization A-14
Unified CCE performance A-15
Unified CM performance A-15
Average Call Duration (default reports)
Across Clusters-Monthly 3-3
versus Volume Across Clusters-Monthly 3-3
Average Duration of Calls Across Clusters-Monthly (default report) 3-3
B
Back button, using 1-4
backing up the database
performing a backup 8-3
saving a backup file 8-5
best practices
IN-1Guide for Cisco Unified Service Statistics Manager

Index
groups, creating 6-3
C
Call Completion Rate Across Clusters-Monthly (default report) 3-3
Call Duration Across Clusters-Monthly (default report) 3-3
Call Quality
by NAM monitor type A-4
by Sensor monitor type A-4
monitor type A-3
Summary report type
configuring details of 3-34
default reports 3-18
understanding 3-18
call quality range, configuring 7-8
Call Service Quality Summary-Weekly (default report) 3-3
Calls to/from Specified Number report type
configuring details of 3-35
understanding 3-19
call stream
call quality, configuring 7-8
definition 7-8
Call Traffic and Duration Across Clusters (default report) 3-3
Call Volume
(default reports)
Across Clusters by Location-Monthly 3-3
Across Clusters-Monthly 3-3
Over Time Across Clusters-Weekly 3-3
Report on H.323 Gateways-Daily 3-3
monitor type A-5
Capacity Planner
home view 2-2
user role 2-2
Capacity Trend report type
configuring details of 3-36
understanding 3-19
IN-2User Guide for Cisco Unified Service Statistics Manager
Cause Code Analysis report type
configuring details of 3-37
default report 3-20
understanding 3-20
Cause Code Summary-Daily (default report) 3-3
caution
achive directory, overwriting 8-4
login sessions, multiple 1-2
schedule, deleting 5-18
SSMServer, deleting 6-17
user role, deleting default 6-12
Cisco 1040 Sensor, monitor type associated with A-1
CME Performance (default report) 3-3
CME performance monitor type A-10
compliance matrix. See SLA compliance matrix
connecting SSM Agent 6-18
creating a report
configuring initial details 3-30
configuring specific report type details 3-32
CUE Performance (default report) 3-3
CUE performance monitor type A-10
custom graph
attributes tab 4-10
monitor information tab 4-11
Custom Graph report type
configuring details of 3-38
understanding 3-21
custom graphs
creating 4-1
interacting with 4-8
understanding 4-8
D
dashboard view, configuring 7-1
data
collection, from Service Monitor A-3
raw 3-12
retention periods 3-12
OL-20784-01

Index
rollup 3-12
database
archiving and archive files 8-2
exception, read timed out 8-10
purging, understanding 8-2
server process, troubleshooting 8-10
data collection, troubleshooting 8-9
default reports
list of 3-3
recreating B-1
deleting
group 6-6
Service Monitor 7-15
SSM Agent 6-17
user 6-8
user role 6-12
Detailed Performance-Daily (default report) 3-3
devices, monitor types for A-1
disconnecting SSM Agent 6-18
discovery
errors, preventing 7-11
initial, prerequisites for 7-10
license invalidity error 7-11
triggering 7-10
Distribution of Service Quality (default reports)
Across Clusters by Time-Monthly 3-3
Across NAMs by Time-Monthly 3-3
Across Sensors by Time-Monthly 3-3
downloads, installing 7-15
E
editing
report 3-53
view, report-based 2-5
element. See devices, monitor types for
sending a report by 3-16
SMTP server, updating 8-12
OL-20784-01
errors
license invalidity 7-11
workarounds for 8-7
Executive
home view 2-2
user role 2-2
exporting graph 4-12
F
Failed Calls Across Clusters-Monthly (default report) 3-3
G
gatekeeper
performance (default report) 3-3
performance monitor type A-11
gateway
utilization (default report) 3-3
utilization monitor type A-11
graph, custom
exporting to Excel 4-12
limitations 4-13
multiple monitor type 4-7
restrictions 4-13
single monitor type 4-6
graph-based view
creating 2-6
deleting 2-10
editing 2-7
editing graph in 2-9
graph, deleting from a view 2-10
understanding 2-11
graph display page
attributes tab 4-10
monitor information tab 4-11
graph name, special characters in 1-5
group
IN-3User Guide for Cisco Unified Service Statistics Manager

Index
deleting 6-6
editing 6-6
hierarchical or flat, configuring 6-6
members, searching for 6-4
Group Aggregation report type
configuring details of 3-40
default reports 3-21
understanding 3-21
H
home view
configuring 7-2
definition 7-2
I
icons
on reports 3-13
on SLA compliance matrix 5-4
installing
SSM Administration Console 7-16
SSM Agent 7-16
Instance Aggregation report type
configuring details of 3-41
default reports 3-22
understanding 3-22
integration
with Operations Manager 7-9
with Service Monitor 7-9
IP address
Operations Manager 7-13
Service Monitor 7-13
IPSLA
monitor types
data jitter A-16
gatekeeper registration delay A-17
ping echo A-17
IN-4User Guide for Cisco Unified Service Statistics Manager
ping path echo A-17
UDP echo A-18
Test Statistics (default report) 3-3
J
Jserver out of memory 8-7
L
line graph, creating 4-1
login
failure, troubleshooting 8-11
initial 1-2
session inactivity 1-2
sessions, multiple 1-2
M
managed object. See devices, monitor types for
managing views
dashboard view 7-1
graph-based 2-5
home view 7-2
report-based 2-3
Mean Opinion Score (MOS) 7-8
memory, out of
agent 8-7
Jserver 8-7
monitor, definition 1-5
monitored resource. See devices, monitor types for
monitor type
definition 1-6
list of 1-6
MOS 7-8
OL-20784-01

Index
N
NAM, monitor type associated with A-1
node-to-node test. See IPSLA monitor types
O
Operations
home view 2-2
user role 2-2
Operations Manager
IP address, editing 7-13
license invalidity error 7-11
monitor types, related 1-6, A-9
password
editing 7-13
special character restriction 7-12
security certificate, obtaining 7-11
username
editing 7-13
privileges, required 7-12
P
password, updating
Operations Manager 7-13
Service Statistics Manager 7-1
Percentage Distribution of Service Quality (default reports)
Across Clusters by Time 3-3
Across Clusters by Time-Weekly 3-3
Across NAMs by Time-Weekly 3-3
Across Sensors by Time-Weekly 3-3
performance parameters, fine-tuning Service Statistics Manager 8-7
phone-based groups, configuring 7-7
polling period, changing 8-9
privilege, assigning 6-8
process
OL-20784-01
dbsrv, starting 8-7
list, running 8-7
SSM Agent 6-15
product license, viewing 1-3
R
raw data 3-12
report
default reports 3-3
deleting 3-54
editing 3-53
header, understanding 3-13
icons shown on 3-13
name, special characters in 1-5
report-based view
creating 2-4
deleting 2-5
resource. See devices, monitor types for
restoring database 8-5
retriggering discovery 7-12
role, user
adding 6-10
assigning 6-8
deleting 6-12
editing 6-12
router, Cisco IOS monitor type A-12
S
schedule
configuring 5-16, 7-5
deleting 5-18, 7-7
editing 5-17, 7-6
sensor-based reports 3-3
Service Availability Across Clusters-Weekly (default report) 3-3
Service Monitor
IP address, editing 7-13
IN-5User Guide for Cisco Unified Service Statistics Manager

Index
monitor types, related 1-6, A-2
Service Quality Distribution (default reports)
Across Clusters-Monthly 3-3
Across NAMs-Monthly 3-3
Across Sensors-Monthly 3-3
Service Quality Percentage Distribution (default reports)
Across Clusters-Monthly 3-3
Across NAMs-Monthly 3-3
Across Sensors-Monthly 3-3
SLA 5-16
compliance, monitoring 5-1
editing 5-13
name, special characters in 1-5
type
adding 5-12
editing 5-13
SLA Capacity Trend report type
configuring details of 3-48
understanding 3-26
SLA Compliance History report type
configuring details of 3-48
launching 5-7
understanding 3-27
SLA Compliance Matrix
icons 5-4
report type
configuring details of 3-49
understanding 3-27
user interface 5-2
SLA Executive Summary report type
configuring details of 3-50
understanding 3-28
SLA Health Summary report type
configuring details of 3-50
understanding 3-29
SMTP server, updating 8-12
software version
Service Statistics Manager 1-3
SSM Administration Console 7-17
IN-6User Guide for Cisco Unified Service Statistics Manager
SSM agent 7-17
special character
usage, in names 1-5
usage, in Operations Manager password 7-12
SSM Administration Console
folders 6-2
launching 6-2
overview 6-1
SSM Agent
deleting 6-17
disconnecting 6-18
local 6-12
polling period 8-9
remote
adding 6-13
connecting 6-18
editing 6-16
restarting 6-18
troubleshooting 6-14
system utilization for IOS routers (default report) 3-3
system utilization monitor types
gateway A-12
IOS router A-12
Unified CCE A-13
Unified CM A-13
Unity A-13
Unity Connection A-14
T
threshold
defining for
Capacity Trend report type 3-36
SLA 5-8, 5-13
violation, illustrated 3-19
Time Aggregation report type
configuring details of 3-42
default reports 3-22
understanding 3-22
OL-20784-01
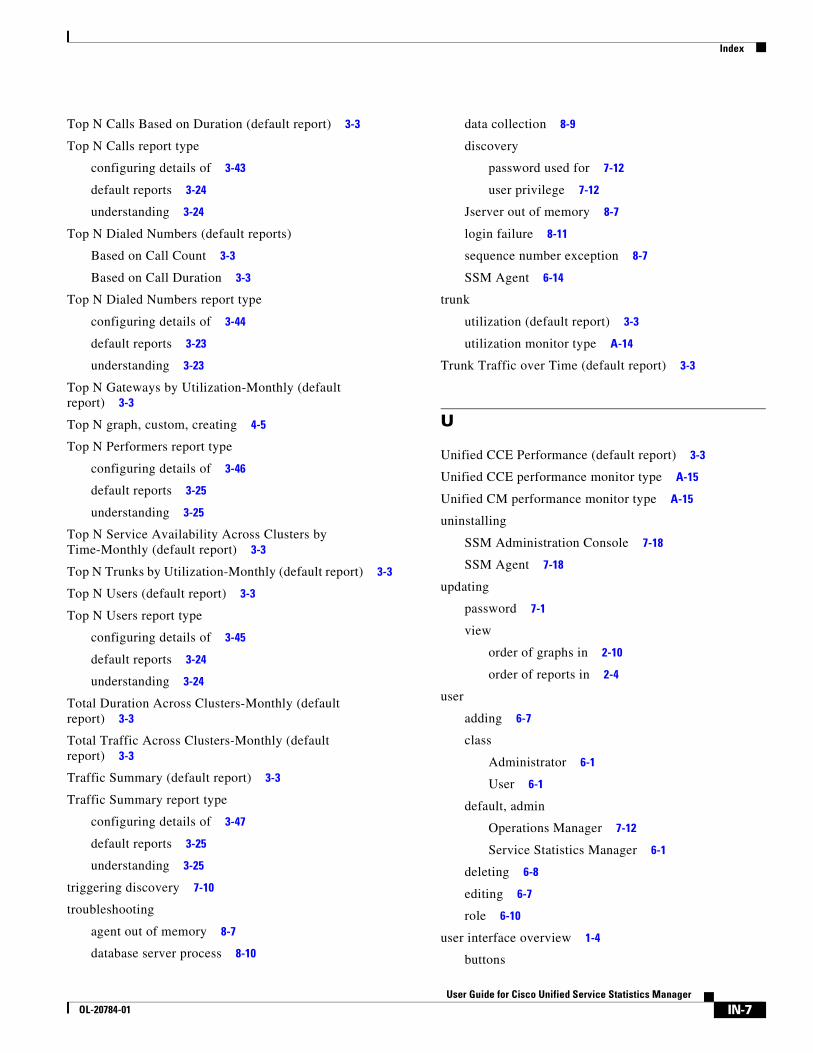
Index
Top N Calls Based on Duration (default report) 3-3
Top N Calls report type
configuring details of 3-43
default reports 3-24
understanding 3-24
Top N Dialed Numbers (default reports)
Based on Call Count 3-3
Based on Call Duration 3-3
Top N Dialed Numbers report type
configuring details of 3-44
default reports 3-23
understanding 3-23
Top N Gateways by Utilization-Monthly (default report) 3-3
Top N graph, custom, creating 4-5
Top N Performers report type
configuring details of 3-46
default reports 3-25
understanding 3-25
Top N Service Availability Across Clusters by Time-Monthly (default report) 3-3
Top N Trunks by Utilization-Monthly (default report) 3-3
Top N Users (default report) 3-3
Top N Users report type
configuring details of 3-45
default reports 3-24
understanding 3-24
Total Duration Across Clusters-Monthly (default report) 3-3
Total Traffic Across Clusters-Monthly (default report) 3-3
Traffic Summary (default report) 3-3
Traffic Summary report type
configuring details of 3-47
default reports 3-25
understanding 3-25
triggering discovery 7-10
troubleshooting
agent out of memory 8-7
database server process 8-10
OL-20784-01
data collection 8-9
discovery
password used for 7-12
user privilege 7-12
Jserver out of memory 8-7
login failure 8-11
sequence number exception 8-7
SSM Agent 6-14
trunk
utilization (default report) 3-3
utilization monitor type A-14
Trunk Traffic over Time (default report) 3-3
U
Unified CCE Performance (default report) 3-3
Unified CCE performance monitor type A-15
Unified CM performance monitor type A-15
uninstalling
SSM Administration Console 7-18
SSM Agent 7-18
updating
password 7-1
view
order of graphs in 2-10
order of reports in 2-4
user
adding 6-7
class
Administrator 6-1
User 6-1
default, admin
Operations Manager 7-12
Service Statistics Manager 6-1
deleting 6-8
editing 6-7
role 6-10
user interface overview 1-4
buttons
IN-7User Guide for Cisco Unified Service Statistics Manager

Index
Back 1-4
Cancel 1-4
Help, context-sensitive 1-4
Logout 1-4
Next 1-4
links
Help 1-4
Logout 1-4
using
administration 7-1
custom graphs 4-1
reports 3-1
SLA administration 5-8
views 2-1
V
view
about 2-11
default views 2-2
graph-based, understanding 2-11
home, configuring 7-2
name, special characters in 1-5
viewing
comments 3-14
monitored element details 4-11
product license and version 1-3
SLA details 5-5
SLA violation details 5-6
subreports 3-14
X
X-Y graph, creating 4-4
Z
zoom graph 4-11
IN-8User Guide for Cisco Unified Service Statistics Manager
OL-20784-01