Embed Size (px)
Citation preview

Manifest Investing: CanInvesting Really Be This Easy?by Lynn Ostrem, SubscriberMinneapolis, Minnesota
The purpose of turning our attention to MANIFEST is to improve our results while at the same time simplifying our investing processes. We think we can learn faster and maintain our portfolios (club and/or per-sonal) better. We think we’ll discover investment opportunities to study with easy and powerful screening resources. And most of all, we’ll fo-cus on a successful journey and have more fun as long-term investors.
Whether we invest in stocks or mutual funds, it’s important to know what we own and why we own it. If we make decisions to hold invest-ments based on sound knowledge, we’ll be less affected by the ev-eryday chaos and noise of the stock market. The MANIFEST analysis methods develop and display concise lists of important characteristics upon which to make stock and fund decisions.
The answer lies in understanding just two things about any potential investment: (1) Its quality and (2) The returns that we might reason-ably expect to achieve over the long term.
Why MANIFEST? Because the biggest challenge confronting the aver-age individual investor is the challenge and fear that most people feel when faced with selecting and managing a portfolio of investments. The choice of MANIFEST lies in its very defi nition: to show or demonstrate plainly; a list (or dashboard.) People like lists for getting things done.
We’ll discover the power of dashboards as we build reasonable expecta-tions for the investments we select and own. The fi rst thing we need to understand (and have) is an objective, a target total return. We need to build portfolios with enough expected return to achieve our objective. We also need to understand the differences between weeds and desired plants. This is the role understanding quality plays in our efforts.
Using the methods discussed here, the expected returns and quality (includ-ing fi nancial strength) are built from three characteristics: projected sales growth, profi tability and value. This is the core of the MANIFEST method.
Editor: Mark Robertson, Manifest Investing LLC Special Feature Results, Remarks and References Regarding Investment Initiatives June 2006
User Guide - www.manifestinvesting.comWelcome to this special feature intended to help you to understand the basics of long-term investing using the principles and guidelines developed by Manifest Investing. This is a compi-lation of writings by Mark Robertson and several members of the MANIFEST Community. De-veloped by Lynn Ostrem for the members of her Crow River Investment Club, Lynn wanted to share the summary with other friends at MANIFEST who are interested in a “...less mysterious, less stressful and more successful” method of investing. Suggestions and recommendations for improvement are most welcome.
“…Subscribing here is like paying my dues to belong to a country club of like-minded souls.” -- Diane Graese
Table of Contents
Some History ............... 2About the Analysts ........... 3Quality ........................ 5Growth .......................... 6PAR: Proj. Ann. Return .. 7Tools: Newsletter .......... 8Tools: Tin Cup ................ 9Tools: Dashboards ........ 10Fundamental Forecasts.. 12Tools: Screening ............ 13For NAIC Investors ........ 14Fund Analysis ................ 15Forum Resources .......... 16Portfolio Design ............ 17

2 - User Guide - June 2006
Some History
Mark Robertson is an engineer and an avid student of investing. But it wasn’t until he discovered the teachings of NAIC founder George Nicholson that he uncovered what he thought was the key approach to simple and successful investing.
Mark joined the NAIC staff and served as the senior contributing editor for Better Investing for 7 years. His intellect and whimsical musings became his trademark and his articles and presentations remain favor-ites among NAIC investors.
Nicholson was heavily infl uenced by David L. Babson, who in turn, was infl uenced by the works of Benjamin Graham. Babson is considered by many to be “the father of growth investing.” The Babson Letter has been, and still is, published in Better Investing, long after Mr. Babson’s death. Articles from 30 years ago seem as though they were writ-ten today. Graham’s efforts were directed at fundamental analysis to avoid paying too much for stocks -- a mistake commonly cited as a leading cause of frustration and failure for individual investors.
What Mark discovered was that Nicholson had laid a very simple foun-dation for NAIC investors. It was deceptively simple. But over the years, the concept was made more and more diffi cult with the addi-tion of new tools and modern-day infl uences.
Collaborations with groups of investors led Mark Robertson to the development of dashboards -- to dramatically simplify portfolio design and management and the development of a quality rating for stocks based on fi nancial strength, relative forecasted sales growth, relative profi tability and earnings predictability.
During January 2005, Mark Robertson joined with Kurt Kowitz, a coworker and IT specialist at NAIC, to found Manifest Investing. A case study of a model portfolio (dubbed “Tin Cup”) had suggested the potential for powerful returns using a simple but effective approach to investing based on projected returns and quality. What was the premise behind the study? Simple. Can ordinary people identify buy-ing (and selling) opportunities with widely available information? The returns speak for themselves.
This is not just another investment philosophy.
NAIC Founder George Nicholson. The National Association of Investment Clubs was formed in 1951 as part of a vision, an “experiment” in learning. Nicholson invented the NAIC Stock Se-lection Guide, or SSG, as a study outline for fundamental analysis of common stocks.
David L. Babson laid much of the foundation for George Nicholson’s efforts and the heritage of the NAIC.
June 2006 - User Guide - 3
A Few Moments... with Analysts
MANIFEST relies fairly extensively on published estimates, either from the consensus of groups of analysts and in some cases, exclusively upon the forecasts made by analysts for the Value Line Investment Survey (VL). Do we dare rely solely on these analysts or Value Line for our MANIFEST fundamentals? According to Mark, the answer is “Exclusively? No, but they’re generally a pretty good starting point for our studies. My experience has been that adjustments are more rare than we might think they’d be. I think the advantages of continuous updates and the power that is delivered to the overall portfolio man-agement through the dashboards is enough justifi cation for the ap-proach. With respect to Value Line itself as a reference:
1. Value Line is good enough for Warren Buffett, who wrote about the achievements of Walter Schloss with admiration in his work, The SuperInvestors of GrahamandDoddsville. Schloss relied extensively on Value Line.
2. In One Up On Wall Street, Peter Lynch wrote, “Value Line is the next best thing to having your own private securities fi rm.”
3. Look at the 11-year return of Tin Cup! It was built exclusively on Value Line Reports. (Tin Cup has never “peeked” at a Stock Selection Guide or conditioned a Value Line estimate or forecast!)
4. Value Line has a proven, long-term record.
Robertson has written extensively on the uselessness of brokerage recommendations for long-term investors. MANIFEST does not rely on analyst buy/hold/sell recommendations because we know that in the vast majority of cases -- the time horizon for the analyst is different than ours. What we can rely on is their statistical reports and indus-try analyses. This delivers a powerful, virtually real-time feed, for the fundamental characteristics that shape our projected returns and qual-ity ratings for the stocks (and funds) we select or follow. We do not use Timeliness Ratings or momentum-driven short term forecasts.
Why MANIFEST Works for Investors and Clubs
Let’s face it. There isn’t an investment club in existence today in which all the members share the same level of experience or analyti-cal prowess. This causes a wide variance in the quality of informa-tion provided from research for stock presentations, to monthly stock reports, even to the information conveyed from conference calls. New members or those who don’t care to do supporting research are left feeling inadequate. The experienced among us are worried that we are not receiving appropriate or relevant information on which to base our investing decisions. These concerns are as old as investment clubs, themselves.
MANIFEST works because we have a universe of intelligent and well-informed analysts watching our back. (In the case of Value Line, one analyst monitors and reports on each stock, but a team reviews and presents the fi nal numbers.) So even if a club member relies solely on the information provided in the MANIFEST tools, in many cases, it would be a HUGE enhancement from current methods. At the very least, stock studies would include the essential elements of a growth, profi tability and valuation (P/E ratio) forecast.
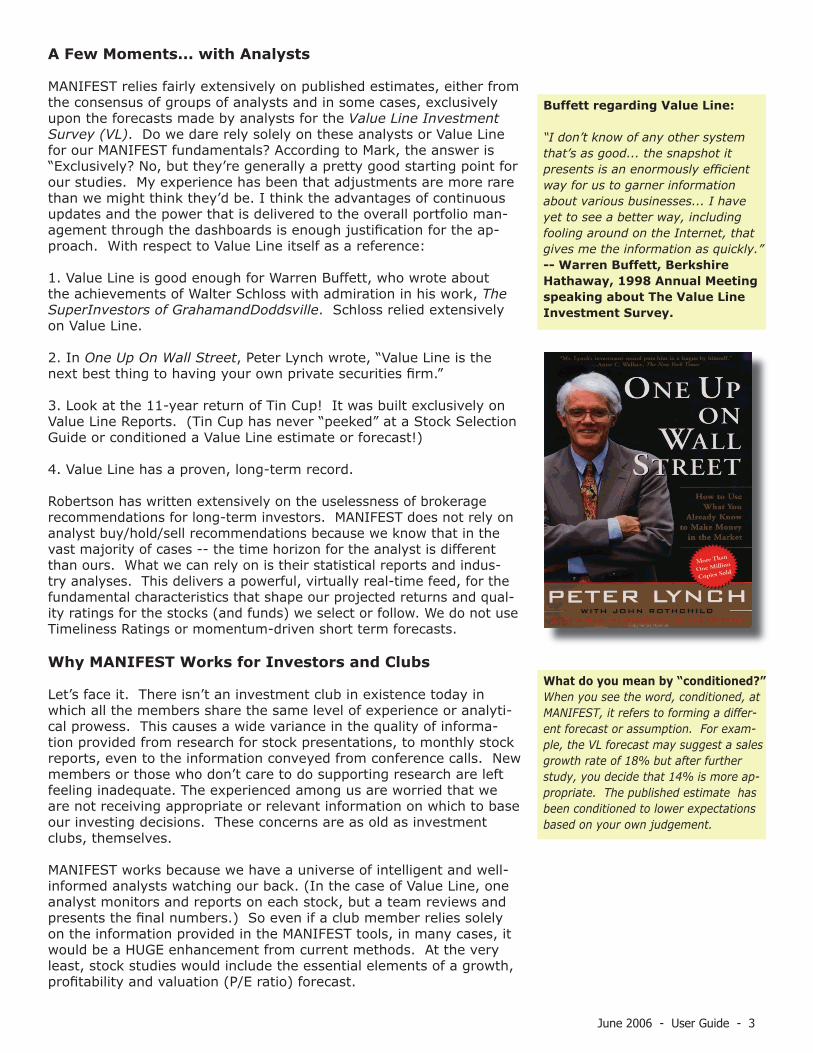
Buffett regarding Value Line:
“I don’t know of any other system that’s as good... the snapshot it presents is an enormously effi cient way for us to garner information about various businesses... I have yet to see a better way, including fooling around on the Internet, that gives me the information as quickly.” -- Warren Buffett, Berkshire Hathaway, 1998 Annual Meeting speaking about The Value Line Investment Survey.
What do you mean by “conditioned?”When you see the word, conditioned, at MANIFEST, it refers to forming a differ-ent forecast or assumption. For exam-ple, the VL forecast may suggest a sales growth rate of 18% but after further study, you decide that 14% is more ap-propriate. The published estimate has been conditioned to lower expectations based on your own judgement.

4 - User Guide - June 2006
Cy Lynch, a nationally known educator for NAIC, and a charter mem-ber of Manifest Investing, explained the differences in investing styles in his February 2006 MANIFEST Forum class on Walgreen. The rest of this section pertains to his comments.
Investors can use different degrees of analysis in our stock studies depending on our interest and time available. We can be successful investors, no matter the degree of analysis we choose, so long as we do some minimum level of study. That’s the beauty of MANIFEST: the elegant simplicity fits us all.
The Do-It-For-Me Investor: This investor takes mostly a “hands-off” approach to stock studies. He could use the company summary and ratings at MANIFEST without altering the default judgements; then use a disciplined approach to construct and manage a portfolio watching the key design characteristics [already provided in the pro-gram]. The record of the Tin Cup portfolio shows clearly that you can be a very successful investor following this approach.
The Tell-Me-Everything, Then-Handle-It Investor: This inves-tor has the time and inclination to dig a little deeper and may change the default judgements. She still relies primarily on management to deal with the nitty-gritty issues, and professional analysts to do the in-depth analysis. She wants to be involved in the process, but still doesn’t find it necessary to look under the hood. I think most of us fall in this category most of the time, at least I usually do. Test man-agement first by looking at history. Does the record show that they have been successful in recognizing and seizing opportunity? Then continue the background investigation by looking at the company website, briefly skimming their financial reports and reading what analysts you like and trust have to say. After that, check quarterly re-sults and follow the updated Fundamental Forecasts.
The Do-Some-Myself Investor: This investor is the “hobbyist” who has the time and inclination to dig deeper and massage their projec-tions a bit more than the Tell-Me-Everything, Then-Handle-It Investor.
The Peer-over-Management’s-Shoulder Investor: This inves-tor tries to second-guess the mechanic as she rebuilds the engine. He delves into inventories, receivables, payables and the like. Not only does that take a lot of time, it requires an in depth knowledge of the company’s business that most of us don’t have. Even if you know that business in and out, trying to micro-analyze these factors, and to do it right, takes more data than we have access to. Yes, good management follows those things. That’s what we pay them for. But they also have a great deal more detailed information than is available to the public.
So find your own comfort level and be happy with it. You can and will be successful as any one of the first three types of investor. Most impor-tantly, take it slow, be patient. In time you will develop your own style, and looking close at what matters to you will become second nature.
Cy Lynch is an Atlanta Braves fanatic, a respected and experi-enced long-term investor and contributor to educational efforts for the National Association of Investors Corp. (NAIC.) Cy serves on a national advisory board for NAIC. He is a registered invest-ment advisor and can be reached at: [email protected]
Sample poll from Walgreen Continuous Classroom. Cy Lynch asked the participants in the session to vote for their own net margin forecast for projected net margin for Walgreen. The resulting display of collective judg-ment suggested the average participant (3.9%) was reluctant to agree with the forecast of the Value Line analyst (4.4%.) This poll is an example of features and discussions held at the Forum and how participants will learn from each other when given the opportunity.
Fundamental Forecasts?This is a reference to the company data summaries found under “Stocks.” For more information, see page 12.

Quality: Excellence Measured
In Quality: A Measure of Excellence, Mark writes: Simply put, quality is a measure of excellence. Excellent companies are those who have earned our respect and recognition. These companies deliver consis-tent operating results.
When it comes to strategic long-term investing, quality matters. It’s important that we understand and respect quality as we study and select our investments.
Bottom line: The highest rating is 100. Those in the top 20% of the database achieve an “excellent” quality rating of 65 or greater. These are coded in “bold blue” on the MANIFEST tools. The next 20% of all companies achieve a “good” quality rating between 55 and 65. These are coded in “green”. The weakest, or lowest, quality ratings (less than 35) are coded in red and should generally be avoided.
Investors should keep track of the quality rating for each company they own or study. Of course, each company’s quality rating contrib-utes to the overall portfolio quality. Maintaining the overall quality of the portfolio is among the most important objectives.
Components of the Quality Rating
Every company in the Solomon database has a Quality Rating that ranges from 0 to 100. The rating is based on 4 components—financial strength, earnings predictability, projected sales growth relative to its industry, and projected net margin relative to its industry. Each com-ponent receives a maximum of 25 points. This is intended to empha-size each component equally.
1. Financial Strength: Value Line looks at credit reporting agencies, debt level, and cash flow and gives an alphabetical grade on the bot-tom right corner of the Value Line page. This grade is converted to a percentage (fraction), which is then multiplied by 25. So for example, if the Value Line financial strength grade is A, it’s converted to 80% or .80. The formula is then (.80 x 25 = 20).
2. EPS Predictability: Value Line already gives us a number (from 5 to 100) for the consistency or straightness of the earnings trend. This is a sign of stability which lends to the quality of management. If Value Line rated a company’s earnings predictability at 90, then our formula would be (.90 x 25 = 22.5) By the way, if the grade is 100, the formula would be (1.00 x 25 = 25).
3. Relative Forecasted Sales Growth: Value Line provides us with its projected sales growth rate for each company and its industry. Re-member that we only get a total of 25 points. A score of 12.5 means it’s in line with the industry. Over or under means just that. So, if the company’s growth rate was 18% and the industry was 12%, the formula would be [(18 div. by 12) x 12.5 = 18.7].
4. Relative Forecasted Profitability: Value Line provides us with the projected net margin for a company and its industry. We use these metrics to compare expected profitability, much like above. So, if the company’s margin is 15% and the industry margin is 11%, the formula would be [(15 div. by 11) x 12.5 = 17].
5 - User Guide - June 2006
More details are available in an article Mark wrote on July 27, 2005. Find it at: http://www.Manifestinvesting.com/web/ar-ticles/features/0705feature2/
Solomon Database: MANIFEST refers to the database of over 2500 stocks as the Solomon database. (Yes, it’s named after King Solomon.)
Fundamental Forecast summary for Walgreen (WAG) as of 4/18/2006. Note the industry comparison and quality rat-ing display of the components.

6 - User Guide - June 2006
Growth: The Bottom Line is that the Top Line Matters
Among MANIFEST subscribers, growth refers to projected sales growth. Growth considerations are a third factor in portfolio design and management, but first in assessing individual stocks. How the sales growth is changing tells us much about the life cycle position of the company. We also regard the forecasted growth rate for any com-pany as the best measure of its “size.”
For any stock, we need to have some understanding of the (1) com-pany/product life cycle, (2) market opportunities, and (3) achievable growth rate.
A study of the Solomon database revealed the “median” sales growth for all companies was 9%. The “average” sales growth was 6%. The low end of the top quintile (top 20%) of all companies was 15%. The lowest among the top two quintiles (top 40% of all companies) was 11%. The rule of thumb that we’ve targeted for overall portfolio sales growth has been 10-12%, which is pretty consistent with the results. Since we would never be interested in the lower half of the database (which lowers the average to 6%), our target range for projected sales growth for each company would then be 9% to 15%, averaging 12%. For an overall portfolio, a rate of 10-14% seems to be a logical target range.
Our approach to fundamental analysis starts with the top line, or the revenue or sales growth expectations. We believe that understanding the sales growth drivers is essential to our evaluation of any company. We combine the growth analysis with profitability expectations to generate our EPS estimates. EPS growth rates are de-emphasized at MANIFEST as we focus on business models (sales growth and profit-ability) to build our projections for future income statements.
Excerpt from Equity Analysis Guide (EAGLE) for Wrigley. The Equity Analysis Guide examines the sales growth forecast actu-ally used by the Value Line analyst and makes some comparisons with historical trends. The highlighted fields are user-entry. The other fields are calculated or retrieved from other sources. Row 20: Calculated historical sales growth from regression analysis. 21: Projected sales for current year per VL. 22: Long-term (4-yr) sales forecast by VL. 23: Calculated Sales Growth forecast to achieve the VL sales forecast. 24: Based on study, the sales growth forecast decision made by the user. 26: Current 4Q of sales. 27: Calcu-lated estimate of total sales five years from the date of the study. The graph provides a view of the trailing five years (20 quarters.) In this case, the growth trend dictated by the historical data suggests that sales could reach between $8-9 billion in five years. This provides substantiation for the forecast made in rows 24 and 27. The study (current) date is always the midpoint of this chart.
Analyst Exuberance. If the median sales growth for the companies in the Solomon database is 9%, how do we reconcile this with the fact the median EPS growth forecast for all companies (finance.yahoo.com) is 12.3%? We see the same tendency when limiting the scope to the S&P 500 (sales growth forecast of 7.4% versus an EPS growth estimate of 10.5%.) We de-empha-size EPS growth rates at MANIFEST but can use this relationship to estimate sales growth forecasts from published analyst forecasts. As a general rule, multiply any analyst EPS growth esti-mate by 70% to derive a starting point for a sales growth forecast.
Sales Growth as a Measure of Company Size? We’re in the minority at 3% (None of the above) and we’re OK, lonely but comfortably correct, with that. (Poll Source: www.forbes.com)
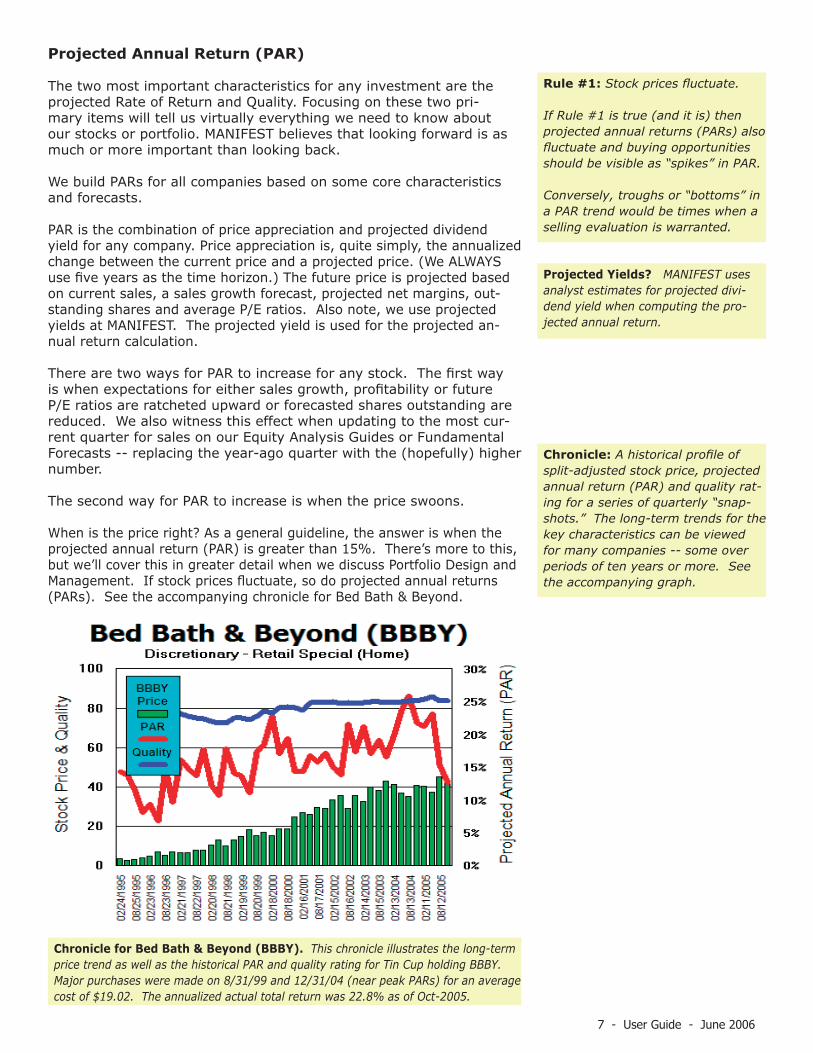
Projected Annual Return (PAR)
The two most important characteristics for any investment are the projected Rate of Return and Quality. Focusing on these two pri-mary items will tell us virtually everything we need to know about our stocks or portfolio. MANIFEST believes that looking forward is as much or more important than looking back.
We build PARs for all companies based on some core characteristics and forecasts.
PAR is the combination of price appreciation and projected dividend yield for any company. Price appreciation is, quite simply, the annualized change between the current price and a projected price. (We ALWAYS use five years as the time horizon.) The future price is projected based on current sales, a sales growth forecast, projected net margins, out-standing shares and average P/E ratios. Also note, we use projected yields at MANIFEST. The projected yield is used for the projected an-nual return calculation.
There are two ways for PAR to increase for any stock. The first way is when expectations for either sales growth, profitability or future P/E ratios are ratcheted upward or forecasted shares outstanding are reduced. We also witness this effect when updating to the most cur-rent quarter for sales on our Equity Analysis Guides or Fundamental Forecasts -- replacing the year-ago quarter with the (hopefully) higher number.
The second way for PAR to increase is when the price swoons.
When is the price right? As a general guideline, the answer is when the projected annual return (PAR) is greater than 15%. There’s more to this, but we’ll cover this in greater detail when we discuss Portfolio Design and Management. If stock prices fluctuate, so do projected annual returns (PARs). See the accompanying chronicle for Bed Bath & Beyond.
7 - User Guide - June 2006
Chronicle for Bed Bath & Beyond (BBBY). This chronicle illustrates the long-term price trend as well as the historical PAR and quality rating for Tin Cup holding BBBY. Major purchases were made on 8/31/99 and 12/31/04 (near peak PARs) for an average cost of $19.02. The annualized actual total return was 22.8% as of Oct-2005.
Chronicle: A historical profile of split-adjusted stock price, projected annual return (PAR) and quality rat-ing for a series of quarterly “snap-shots.” The long-term trends for the key characteristics can be viewed for many companies -- some over periods of ten years or more. See the accompanying graph.
Rule #1: Stock prices fluctuate.
If Rule #1 is true (and it is) then projected annual returns (PARs) also fluctuate and buying opportunities should be visible as “spikes” in PAR.
Conversely, troughs or “bottoms” in a PAR trend would be times when a selling evaluation is warranted.
Projected Yields? MANIFEST uses analyst estimates for projected divi-dend yield when computing the pro-jected annual return.

8 - User Guide - June 2006
The Tools of Manifest Investing
MANIFEST provides us with ample tools to not only gauge the invest-ment potential and quality of companies and mutual funds, but the tools to discover new opportunities and to design and manage our port-folios. This section will review each one, and explain how to use it.
Our E-Newsletter: Expected Returns
Expected Returns is the name of the monthly MANIFEST e-newsletter. It’s posted online on the 1st or 2nd business day of every month. It usually begins and ends with whimsical, yet educational, articles from Mark Robertson and various contributors from within the MANIFEST Community. In between, it covers the following features:
• Solomon’s Select: Each month, a promising company from the Solo-mon database is reviewed. A brief overview is provided, followed by a review of Quality, Growth, Profi tability, Valuation, and Expected Returns. A Chronicle (historical profi le) is generally provided. Every month, sub-scribers may consider Solomon’s Select as a candidate for further study.
• Featured Funds: This is another monthly feature that highlights the characteristics of a mutual fund and the stock it owns.
The MANIFEST methodology is unique because of its forward-looking emphasis. The PARs of the individual holdings of the mutual fund are analyzed and used to compile an overall fund PAR. Our study of mutual funds includes an awareness of track record, but places much more em-phasis on expectations.
• Fund Manifest: This is a listing of mutual funds, ranked by the fund over-all PAR is monthly listing of projected return leaders.
• Sweet Sixteen: This is a current listing of screening results provid-ing a monthly listing of high quality companies with reasonably high return expectations. It’s a great place to fi nd ideas for stock studies.
The basis of this screen is that stocks have a “Sweet Spot”. A sweet spot is that point or range within which a particular object functions at its maximum level of effi ciency and output. In the case of stock selec-tion, it’s a range of projected annual returns 5-10% greater than the projected returns for the “general stock market.”
If the PAR on a particular company is too high (more than 10% over median PAR for all companies) then the story may be too good to be true. If the PAR is well below the sweet spot, it is more than likely that the stock price is relatively high or overvalued.
The criteria for the Sweet Sixteen is: Projected Annual Return (PAR) between 5% and 10% greater than the median of all companies in the Solomon database; (generally) Financial Strength of “A” (80%) or better; Quality higher than 65.0 (Excellent); and Sales Growth greater than 8%.
Monthly Newsletter: Subscribers can also print the issue using the PDF version each month.
Past Issues: All issues of Expected Returns are available online and can be accessed by clicking on the [Is-sues] selection on the tool bar.
How do we characterize a qual-ity company?
The company recognizes opportuni-ties and delivers growth. Its growth and profi tability expectations are su-perior to its competitors. Quite of-ten, leading companies will not only capture large portions of market share -- but do so with leadership profi t margins. A quality company will have a high fi nancial strength rating and a solid track record.

• Tin Cup Portfolio Review: Every month subscribers have the oppor-tunity to witness (or look over the shoulder) of this model portfolio. All decisions are detailed and explored. Each issue benchmarks the performance versus a variety of indices and over a variety of time frames. Most often the performance comparisons are either 10-year or since inception.
Tin Cup is a model portfolio that started on December 31, 1994, intending to demonstrate the MANIFEST portfolio design and manage-ment approach. No judgement was allowed as this had to be a strict-ly-followed mechanical selection.
Portfolio Design: The total number of holdings shall be 12-20. The primary emphasis is on maintaining the overall portfolio PAR in a range 5-10% greater than the “general stock market.” The overall portfolio quality is to be maintained in the Excellent (greater than 65) range. (The Tin Cup rules mandate that all selected stocks have a minimum quality rating of 65.) The overall forecasted sales growth shall be maintained at a minimum of 10%. No individual holding should constitute less than 3% nor more than 12% of total assets. Sector and industry diversifi ca-tion shall disqualify purchase candidates. The monthly cash infusion will equal the maximum deduction allowable for a 401(k) retirement plan.
Purchase Discipline: Stocks are selected on the basis of a combina-tion of PAR and quality. The combination rating (specifi cally PARx200 plus QR/2) is used to rank and select purchase candidates. (This is the same process for selection of the Sweet 16 screening results.) The mature portfolio (number of holdings, %-of-total assets for each, rela-tive size of monthly contribution) means that accumulation of existing holdings is necessary until a challenge study suggests a replacement. Only then are candidates considered outside the existing holdings.
In a case where two companies have a very similar impact on the overall design characteristics of the portfolio, the tiebreaker will often be the smaller position.
Dividends are added to the portfolio quarterly and the cash is added to the monthly contribution.
Selling Discipline: Any holding is sold if its PAR drops lower than the yield for 5-year T-Bills (currently 4.8%). If the overall portfolio were to drop to a PAR less than 5% above MIPAR after the current month’s updates for the individual holdings (which generally raises PAR expec-tations) the stock with the lowest PAR is evaluated for replacement. This process would continue until the overall portfolio PAR is restored to suitable target levels.
History teaches us that, time and time again, the potential for un-realized loss from an overvalued (low PAR) situation usually outweighs the cost of the taxes and any transactional costs.
It’s well worth following this monthly feature! In the last few months (as of the writing of this report) this article has been a real page turner!
9 - User Guide - June 2006
“If the stock market were truly effi cient, I’d be a bum on the street corner with a tin cup.” -- Warren Buffett.
“The process of building the Tin Cup model portfolio ranks as one of the most exciting and intriguing things I’ve seen in my years of investing research. It’s intriguing because it’s a fairly simple implementation of the things we know are important in investing. It’s exciting because the results are staggering, at least so far.” -- Mark Robertson.
As of 3/31/2006, $124,650 had been invested and the portfolio value had grown to $652,044 -- an annualized rate-of-return of 28.6% since inception.
5-Year T-Bill Yield: A favorite place to check the 5-year yield is www.bigcharts.com. Enter FVX as the ticker. A quote of 50.13 means that the annual yield is 5.01%.

10 - User Guide - June 2006
The Tools of Manifest Investing (Continued)
Portfolio Design & Management: The Power of Dashboards
Dashboard: A display of a portfolio that focuses attention on a few key design attributes that are important for portfolio management. These are accessible on the home page by clicking on [My Dash-boards] as shown here. Subscribers can create up to ten personal dashboards. The mutual funds available at MANIFEST can be included for 401(k) and other retirement plans. The process is as simple as naming your portfolio and entering the tickers and shares held. Port-folios can be “shared” by making them public. The public URL (link) is displayed on the dashboard page -- a useful feature for investment clubs and family members.
Based on our forecasts for sales growth and profi tability, we use the relationship between price and earnings to build a projected average price fi ve years from now. The annualized price appreciation (the gain from the current price to the projected average price) is combined with the projected yield to deliver the projected annual return for the stock.
As the accompanying fi gure illustrates, projected returns fl uctuate -- some more than others. These fl uctuations providea perpetual guide to decision-making.
We encourage the use of dashboards to monitor the key elements of (1) overall portfolio projected return, (2) overall quality and (3) overall forecasted sales growth. Portfolio-centered decision-making becomes a reality as we simply observe what our portfolios need. “Listen” to your dashboards. Are the projected returns suffi cient and consistent with your time horizon and risk tolerance? How’s the overall quality?
The Challenge Club was started in 1997 and has used a purpose-driven approach, guided by its dashboard, for several years. The portfolio characteristics which we know are
Making a Difference: Dashboards
“Wow. It’s as if a lifelong fog of confusion and fear was lifted in less than 60 seconds after viewing my portfolio dashboard. Within the next fi ve minutes, I understood more about investing than I had in the last 30 years.”
“Creating a dashboard with my own portfolio was a real eye-opener.” -- T.K., Subscriber
Stock Prices Fluctuate. So do Projected Annual Returns (PARs) Some more than others. This 10-year profi le of PAR forecasts for Johnson & Johnson, Walgreen and Home Depot demonstrate that some forecasts are more stable than others. Note the tight forecast range for Johnson & Johnson. Wal-green is also fairly steady but presented a selling opportunity (relative over valu-ation) during 1999 and a buying opportunity during early 2003. Home Depot provides an illustration of a potentially “too-good-to-be-true” PAR during late 2002 and early 2003 and slight over valuation (low PAR) during early 2000.

11 - User Guide - June 2006
important to success in long-term investing (projected returns, quality, growth) are maintained within target ranges. See the accompanying Challenge Club dashboard.
We believe that portfolio dash-boards have a purpose and our dashboards stand willing to “whis-per suggestions” about prudent decisions -- if we’ll only listen along the way. The challenge of investing decisions has long been confused as something that is a one-stock decision. The analysis of a single stock can not -- by definition -- provide a buy/sell/hold answer.
Why? Because the inter-relation-ship with other portfolio holdings matters. The impact and influ-ence on the total portfolio mat-ters. The selection and accumu-lation of our stocks necessarily should be purpose-driven and portfolio-centered.
In the accompanying individual investor dashboard, the overall portfolio PAR was 13.4% with a cash position (11.7%) that was dragging down the overall PAR. Investing the cash proceeds and challenging/switching Tellabs (TLAB) offered the potential of bolstering the overall portfolio PAR while enhancing the overall quality.
The 2/28/2006 snapshot of the Tin Cup dashboard displays a portfolio that is within range of two of the key characteristics: PAR and quality but forecasted sales growth was slightly low. At the time, Wendy’s was ap-proaching PAR levels which would trig-ger a selling evaluation. Wendy’s has since been sold from the portfolio.
In the final analysis, it is suc-cess that matters most in long-term investing. Implementing portfolio-centered decisions with an emphasis on forward-looking expectations probably provides the best opportunity for success in long-term investing. Since the underlying fundamentals are continuously updated, the dashboards deliver a powerful resource for staying on track.
Challenge Club Dashboard (4/19/2006) PAR, Quality, Growth -- All OK.
Individual Retirement Portfolio. A glance at a dashboard can be quite telling. This risk-tolerant investor with a time horizon much greater than five years needs to replace holdings to bolster the overall PAR. The portfolio has too much cash (11.7%) and not enough technology stocks. Quality is strong (71.9) and would be enhanced by replacing TLAB with a higher PAR stock.
Tin Cup Dashboard (2/28/2006) PAR, Quality: OK. Growth: Slightly low.

Fundamental Forecasts are the continuously updated version of an EAGLE using published analyst estimates for the key factors.
The fundamental data is updatedfor most companies once perquarter. The date of the mostrecent update is displayed at thebottom of the summary. The stock price is updated every nightand will always refl ect the mostrecent closing price.
For our studies, these published estimates represent the default or nominal condition that we use for our dashboards. For users who wish to study and condition forecasts, the estimates are starting points.
We use the Fundamental Forecast results to monitor changes in ourdashboard holdings. As theaccompanying display illustrates,all of the core characteristics thatwe identify as essential on ourEquity Analysis Guides are shown.
By clicking on the Industry fi eld, for example: Food Processing(Confections), we can access an“instant industry study.”
As the accompanying imageshows, we can make quickcomparisons between Wrigley andsome sub-industry companies.
The columns can be sorted todisplay the highest PARs and quality ratings among the group.
Many MANIFEST subscribers fi ndthe instant industry profi les to beamong the more powerful anduseful features as they seekcandidates for further study.
12 - User Guide - June 2006
Fundamental Forecasts
This is an abbreviated report card on the current outlook of any stock. It can accessed by clicking on any company’s ticker symbol in many of the various tools on MANIFEST. From the home page, click on [Stocks] (as shown here) and enter the ticker symbol.

13 - User Guide - June 2006
Powerful Screening
We have the capability of screen-ing for stocks and funds using the MANIFEST criteria. On the home page, click on StockSearch.
Here we can choose to screen by sector or industry. MANIFEST even gives us some guidelines by which to screen. For example, we can use forecast sales growth to screen for diversifi cation by company size. A higher EPS Pre-dictability screen can yield more conservative stocks.
The example shown here has limited the sectors to Discretion-ary, Healthcare and Staples. Only stocks with fi nancial strength rat-ings of A++ (100), A+ (90) or A (80) will be displayed. The search has been limited to companies with PARs between 15% and 20% and quality ratings greater than 65 (Excellent.) The results will also be limited to those companies with growth rates greater than 10%.
The results displayed here are a group of high-quality with PARs that suggest further study would probably be worthwhile.
Individual stocks can be reviewed by clicking on the ticker symbol displayed among the screening results. This brings up a Funda-mental Forecast where we can view the basic characteristics.
MANIFEST Median PAR (MIPAR)
MANIFEST tracks, on a daily basis, the median PAR for all stocks currently covered in the Solomon data-base. Although company fundamentals only change every three months, 1/3rd of Solomon changes every month. With all other characteristics constant, when stock prices fl uctuate, PARs fl uctuate. This “collective projection” matters too. Going forward, we’ll routinely display the median PAR for all MANIFEST stocks, dub-bing it MIPAR.

MANIFEST Comparisons With NAIC Methods
A number of MANIFEST subscribers are also NAIC investors. This section is intended to explore some NAIC guidelines and discuss how MANIFEST handles or interprets the conditions or outcomes. I’d com-pare this section to how a long-time Lotus 1-2-3 user was guided with some embedded features within Excel to help with their orientation a few years ago.
First and foremost, the two approaches are similar and certainly very consistent with respect to the core philosophies.
An emphasis on understanding the nature of (and expectations for) sales growth is encouraged. The NAIC Stock Selection Guide (SSG) is literally a guided tour through the important fundamentals (sales growth, profitability and forecasted P/E ratios.)
An “ugly SSG” refers to erratic fundamentals. NAIC encourages a very conservative approach, and variances in the historical picture make it harder to estimate going forward. But one person’s ugly SSG could be another’s ugly duckling (an unrecognized swan).
At MANIFEST, we de-emphasize EPS growth forecasts -- choosing instead to focus on business models and building forecasts for future income statements. The EPS growth rate becomes a result of our assumptions and forecasts, not the driver. We see this with the EAGLE, as the EPS growth rate is provided as a calculation for comparison purposes.
A bigger difference probably lies in the P/E. The forecasted high price in Section 4A of the SSG is built on generally optimistic conditions (influenced by the average high P/E observed during the trailing five years.) We use average conditions for our P/E forecasts. It is more informative to use aver-age expectations for the purposes of portfolio design and management.
Mark Robertson has, for years, used the Value Line forecasted aver-age P/E as a default starting point. For a company with a projected average P/E of 24x, divide 24x by 3. Add the result (8) to the aver-age to form the 4A High P/E (32x) and subtract (8) to form the 4B(a) Low P/E (16x).
14 - User Guide - June 2006
An Ugly SSG. NAIC investors use Stock Selection Guides (SSG) and its visual analysis to map the histori-cal trends for sales, profits and stock price. Companies with erratic track records are deemed “ugly” and are generally avoided. Companies with consistent trends (straight lines) are referred to as “railroad tracks.”
Margins -- Pre-Tax or After Tax?NAIC investors use pre-tax profit margins as part of their manage-ment report card. The thinking is that taxes are outside the control of management and that judgments regarding management effective-ness should be pre-tax.
At MANIFEST, we observe that effective tax rates are essentially constant, so it’s easier (and equally effective) to monitor trends in net (after taxes) profit margins.
Replicating NAIC’s Preferred Procedure:
1. Use forecasted sales from the MANIFEST Fundamental Forecasts.2. Use forecast net margin as a PTP proxy.3. Use 0% for the effective tax rate (because taxes are already counted.)4. Use forecasted fully diluted shares from Fundamental Forecasts.
Your EPS forecast should match the Fundamental Forecast.
When does a MANIFEST PAR match the PAR on an SSG? When dealing with identical EPS forecasts, they’ll be identical if and when the average of the 4A and 4B(a) P/Es match the projected average P/E used at MANIFEST.
Example of 5-Year Actual P/E Trend for Wrigley. We know that P/Es (including our forecasts) reflect investor sentiment. We believe an aware-ness of P/E trends is important to our analysis. Trending the trailing 60-month profile of actual P/E ratios provides another guide to judgment.

15 - User Guide - June 2006
Vanguard Growth “Viper” (VUG). At MANIFEST, the emphasis on fund analysis means that projections for the individual holdings form the portfolio characteristics for the portfolio. As this example shows, coverage of ETFs is available. The MANIFEST methodology is unique because of its forward-looking emphasis.
The Analysis of Funds
All you need to know about fund analysis at MANIFEST can be boiled down into a few key facts or opinions:
(1) We believe that fund analysis should concentrate on the collec-tive projections for the actual hold-ings.
(2) Why? Because it’s more important to focus on where the fund “seems to be going” versus where it’s been.
(3) We believe that performance expectations for a particular fund can be characterized by “sam-pling” the actual holdings. For most funds, we use weighted averages to build a projected an-nual return, quality rating, fore-casted sales growth, projected yield, projected P/E ratio, fi nan-cial strength rating and EPS pre-dictability. Our “samples” often include most of the 100 largest holdings (by %-of-total-assets) for the portfolio.
(4) Fund analysis, whether it be for an open-end (mutual) fund, closed-end fund, exchange-trad-ed fund (ETF) or any other group of holdings can be effectively achieved with the dashboard ap-proach -- allowing us to charac-terize expectations.
(5) A successful fund manager can serve as a source of stock study candidates by monitoring changes (buys/sells) in holdings.
(6) High portfolio turnover rates elevate costs, are generally a bad idea and are inconsistent with our investing philosophy in the fi rst place. We seek lower expense ra-tios for our mutual fund portfolios.
Example of 401(k) Alternatives. The dashboard for this investor displays a series of Fidelity mutual funds as part of a “cafeteria menu” for a 401(k) plan. Based on the investor’s time horizon, risk tolerance and objectives, (and giving consideration to other investing assets) current contributions are being made in the Dividend Growth fund because of the high PAR and rela-tively high quality rating.

Our Community Forum
MANIFEST is all about long-terminvesting. The Forum provides aplace to share ideas, explore methods and have some fun. Have a question? Lean on scores of like-minded investors at the Forum and see what they think. The Forum is a place for asking questions and sharing information. You’ll discover that the “residents” share a common purpose: To be support-ive as we all strive to achieve better long-term results.
The Forum provides an opportunity to share ideas or update information regarding features in the monthly e-newsletter (Expected Returns). Subscribers are welcome to debate and explore anything that makes us all more successful and better informed.
Some key features...
Continuous Classroom: A series of discussions, including stock studies, that are regularly presented on topics selected or suggested by MANIFEST subscribers.
Learning Center: A collection of guides, orientation materials, tutorials and seminar presentations.
Discussion Topics: General Discussion, Stocks, Funds, Portfolio Design & Management, Decisions Manifest, Suggestion Box & Support.
Portfolio reviews are performed in an on-going series entitled Extreme Makeover: Dashboard Edition.
16 - User Guide - June 2006
Rhino [Investing]: A reference to the land speed capabilities of rhinos and their limited fi eld of vision. Generally applies to the Wall Street “investing herds.”
Chronicles: A Rhino Investing Antidote? In a popular discussion thread during February 2006, Bill Bickley posed and explored the concept that MAN-IFEST Chronicles may be worth well more than 1,000 words. Using the PAR trend and seeking examples of a spiking PAR as shown here for Home Depot (late 2002) Bill speculated that we might search for “spikes in progress.”
Learning from Successful Long-Term Investors. During the Continuous Classroom session on Walgreens, Cy Lynch explored the importance of new store growth during deliberations on growth expectations.

17 - User Guide - June 2006
Portfolio Design & Management
“The challenge of portfolio management is the single largest in-hibitor to investors assuming responsibility and participating in the design and success of their long-term investing program.” -- Mary Rowland, MSN Money.
Mark Robertson often writes and speaks of successful long-term in-vesting as a journey. Our portfolios are described as “engines.” Our journey has a purpose, or destination, and our engines have certain requirements for a successful voyage. We encourage the discovery and ownership of high-quality companies. But it doesn’t end there. We monitor a number of characteristics while maintaining projected returns at suffi cient levels. Our dashboards guide our porfolio-cen-tered decisions.
The two most important characteristics for any investment are (1) rate-of-return and (2) quality. Focusing on these two primary char-acteristics will tell us all we need to know about any investment or portfolio. The task of designing and managing a portfolio becomes dramatically easy when decisions are made with these two character-istics in mind.
Based on our forecast for sales growth and profi tability, we use the relationship between price and earnings to build a projected price (and hence -- a projected price appreciation) fi ve years from now. The annualized price appreciation is combined with the projected yield to produce a projected annual return (PAR) for the stock. PARs fl uctuate -- and these fl uctuations deliver a perpetual guide to deci-sion-making.
How do we characterize a quality company? The company recognizes opportunities and delivers growth. The growth and profi tability fore-casts compare favorably to its competitors. A quality company will have a high fi nancial strength rating and a solid track record.
Our objective is to collect (buy) quality companies when their pro-jected returns suggest good value (high returns) and by maintaining (accumulating, holding and selling) the overall portfolio PAR within our target range.
Putting the Principles to Work: Portfolio Building
Projected Annual Return (PAR): We’re here for returns, so PAR defi nitely comes fi rst. Search for relatively-high PAR stocks with suit-ably high quality. The long-term rate of return for common stocks is 10-12% since 1941. If we want to outperform the general stock mar-ket by 5%, we need to select stocks and maintain an overall portfolio PAR greater than 15%.
Our PAR target is based on the projected return of the market as a whole (MIPAR) plus the advantage threshold appropriate for each of us. For some (long time horizon, high risk tolerance) the advantage threshold could be as high as 5-10%. For others (less risk tolerance, seeking to preserve capital) the threshold could be lower, 2% or per-haps even negative.
Quality: Quality comes next. Aim for an overall portfolio quality of 65-75. Select stocks that raise and maintain it at higher levels (closer to 75) when MIPAR is relatively low (less than 12%.) The quality level
Advantage Threshold: The differ-ence between your target PAR and MIPAR at any time. A conservative investor will have a lower advan-tage threshold than a risk-tolerant investor with a long time horizon. If investing causes loss of sleep, inves-tors should lower the threshold, perhaps to 1-2 percentage points. For many investors, a 5 percentage point design threshold is appropriate (targeting a 15% minimum overall portfolio PAR when MIPAR is 10%.)

selection process of choosing higher-quality stocks withsufficiently high PARs will generally lead to natural sector diversification over time. The accompanying figure shows thesector distribution of the S&P 500. Most growth investors willdiscover some concentration in Technology, Healthcare, Staples,Financials, Discretionary and Industrials.
What About Overall Financial Strength and EPS Pred?
Although not “primary” design considerations, higher overall averages for these characteristics would deliver less volatilityand may be advisable for investors with lower risk tolerance.Higher EPS Predictability ratings will mean less variationbetween forecast and actual (more forecast confidence) and thismay prove comforting to some investors.
18 - User Guide - June 2006
How does the role of quality dovetail with overall market expectations? When the median projected returns (MIPAR) are historically low, investors should emphasize higher-quality stocks and raise the overall quality rat-ing of their portfolios. NAIC founder George Nicholson was emphatic that “when replacing stocks during the later stages of a bull market (historically low PARs) it is CRITICAL that investors should select the replacements with equal or higher quality.”
How urgent? We took a look at the 1-year changes in stock prices for two groups of stocks. The first group above had an average quality rating of 86.3 back in March 2000. Lacking quality ratings for the weaker group, we used financial strength as a proxy. The average financial strength rating for the second group was between C++ and B. The first group proceeded to gain 19% during a market decline of -28%. The second group declined 18% with one of the companies going bankrupt.
can be relaxed and more speculative (faster growing) stocks can be select-ed when MIPAR is greater than 12%. Stocks with good quality ratings (55-65) may be selected. Remember that the overall portfolio quality matters the most. Seek balance. That said, lower-quality and lower financial strength stocks should be avoided when MIPAR is less than 10%. This quality warning is imperative. During corrections, lower-quality stocks get hammered while high-quality stocks decline less and recover faster.
Forecast Sales Growth: While pouring over stacks of portfolios at NAIC, Mark discovered that portfolios with low projected sales growth had a tendency to under perform. They were also subject to slumps when large caps were out of favor. The overall sales growth for the portfolio should be maintained between 10-14%.
The bottom line is that the overall portfolio characteristics should be taken care of in the following priority: PAR, quality and forecasted sales growth.
How Many Stocks Are Enough?
Unless the portfolio includes amutual fund, stocks should be accumulated until the total number of stocks reaches 12-20.
The stocks should be selectedfrom a variety of industries and sectors. A regular, disciplined

Portfolio-Centered Decisions
As stocks are accumulated, thetotal will grow and at some point, the amount of attention lavishedon discovering new stocks needsto be diverted to making decisionsabout current holdings.
Use the dashboard to sort by PARand focus attention on the stockwith the lowest PAR. In theaccompanying dashboard, Wendy’shas the lowest PAR (4.6%).
Outlook on Selling
There are really relatively fewreasons to sell a stock:
1. Because you need the money.In most cases, sell the stock with the lowest PAR.
2. Because the PAR is less than the yield available from 5-year T-bills.Make the portfolio better by replacing with a stock that will maintain or raise overall quality while boosting the overall PAR. In some cases, a stock will be challenged and switched with a stock that will restore the overall portfolio PAR to suitable levels.
3. Because you can make the portfolio better (higher quality.) This can be triggered by degradation in fundamentals (a declining quality rating) or by disruptions such as management shakeups. What does the quality trend look like on the Chronicle? Keep the overall charac-teristics in mind while making the selections. Can the sales growth be boosted while also improving quality? A duplicate dashboard can be created to explore the impact of potential decisions. Think BEFORE and AFTER. This will guide your decisions.
MANIFEST provides us with a much clearer view of portfolio design and management via the dashboards. Once a stock is in our portfolio, future decisions become based on the impact on the total portfolio. Updates are made every weekend. Our strength is reserved for ex-ploring any changes in assumptions or seeking effective replacement candidates. If all of the major portfolio characteristics (PAR, quality and sales growth) remain within range, you’re done! Any changes or new trends should be explored in greater detail.
“…as a MANIFEST user I think I can likely just rely on the analysts who adjust their earnings expectations (and fundamentals) quarterly. Any serious declines or shortfalls would somehow show up in declining quality ratings or in lower PARs.”
It’s equally compelling that rising quality ratings and PARs deliver oppor-tunities for success. In other words, let MANIFEST do most of the grunt work. Reserve your time and energy for discovering and exploring a vista of investing opportunities.
19 - User Guide - June 2006
Overall Portfolio Characteristics: Weighted averages (based on % of total assets) for the key characteristics of PAR, quality, and forecasted sales growth are found in the “Totals & Averages” on the dashboards.
Portfolio PAR: Fixed Targets?MANIFEST investors question the wisdom of fi xed targets (i.e. 15%) for portfolio design. If MIPAR is 20%, targeting 15% as a selection criteria is -- by defi nition -- compro-mising returns. At times, like when MIPAR is 8%, seeking 15% PARs from our stocks can be a path to frustration or calamity.
Acknowledgments
The easiest way for me to learn something new is to gather the information, organize it into like-sections, and develop a method by which I can use that information. I did just that with the
MANIFEST website. This user’s guide is the result! My role was very small compared to the many participants who selfl essly share their time and their invest-ing experiences in order to help the rest of us become better investors. These pages are a compilation of the wisdom shared by the likes of Mark Robertson, Dan Hess, Cy Lynch, Laura Berkowitz, Brian Lewis, Nancy Isaacs, Diane Graese and many others who have contributed to the forum and newsletters. Thanks to all of them, and the people who helped to edit this stuff! I hope this will become a work-in-progress that others will continue to update and improve. Lynn Ostrem [email protected]