Embed Size (px)
Citation preview
Treball final de grau
GRAU D’ENGINYERIA INFORMÀTICA
Facultat de MatemàtiquesUniversitat de Barcelona
USER BEHAVIOUR ANALYSISON REDDIT
Author: Huang Chen
Supervisor: Dr. Lluís Garrido OstrermannAffiliation: Departament de Matemàtica Aplicada i Anàlisi. UBBarcelona, 30 de juny de 2016

Contents
Acknowledgement iii
1 Introduction 11.1 Motivation . . . . . . . . . . . . . . . . . . . . . . . . . . . . . . . . . . . . . . . 11.2 Context . . . . . . . . . . . . . . . . . . . . . . . . . . . . . . . . . . . . . . . . . 21.3 Aim of Degree Final Project(TFG) . . . . . . . . . . . . . . . . . . . . . . . . . 21.4 Report overview . . . . . . . . . . . . . . . . . . . . . . . . . . . . . . . . . . . . 3
2 Technologies 52.1 R vs Python . . . . . . . . . . . . . . . . . . . . . . . . . . . . . . . . . . . . . . 6
2.1.1 History about R and Python . . . . . . . . . . . . . . . . . . . . . . . . 62.1.2 Why Python? . . . . . . . . . . . . . . . . . . . . . . . . . . . . . . . . . 7
2.2 Ipython Notebook and Parallelism . . . . . . . . . . . . . . . . . . . . . . . . . 92.2.1 IPython Notebook . . . . . . . . . . . . . . . . . . . . . . . . . . . . . . 92.2.2 IPython Parallelism . . . . . . . . . . . . . . . . . . . . . . . . . . . . . 92.2.3 Multicore parallel computing . . . . . . . . . . . . . . . . . . . . . . . . 102.2.4 Connecting to the cluster . . . . . . . . . . . . . . . . . . . . . . . . . . 122.2.5 Multicore programming with Direct View interface . . . . . . . . . . . 12
2.3 Python and SQLite . . . . . . . . . . . . . . . . . . . . . . . . . . . . . . . . . . 13
3 Design and implementation 153.1 Extracting information from database . . . . . . . . . . . . . . . . . . . . . . . 15
3.1.1 Description of database . . . . . . . . . . . . . . . . . . . . . . . . . . . 153.1.2 Extracting data . . . . . . . . . . . . . . . . . . . . . . . . . . . . . . . . 20
3.2 Behaviour analysis . . . . . . . . . . . . . . . . . . . . . . . . . . . . . . . . . . 203.2.1 Bad rate BR_P . . . . . . . . . . . . . . . . . . . . . . . . . . . . . . . . . 213.2.2 Bad rate BR_F . . . . . . . . . . . . . . . . . . . . . . . . . . . . . . . . . 233.2.3 Algorithm with flowchart . . . . . . . . . . . . . . . . . . . . . . . . . . 25
3.3 Building histogram . . . . . . . . . . . . . . . . . . . . . . . . . . . . . . . . . . 273.4 Scheme . . . . . . . . . . . . . . . . . . . . . . . . . . . . . . . . . . . . . . . . . 293.5 Adding Parallelism . . . . . . . . . . . . . . . . . . . . . . . . . . . . . . . . . . 30
3.5.1 Algorithm of behaviour analysis with parallel computing . . . . . . . 31
i

4 Result 354.1 Behaviour analysis . . . . . . . . . . . . . . . . . . . . . . . . . . . . . . . . . . 354.2 Comparison of Parallelism and Non-Parallelism computing . . . . . . . . . . 37
5 Conclusion 395.1 Degree Final Project conclusion . . . . . . . . . . . . . . . . . . . . . . . . . . . 395.2 Feedback relevance . . . . . . . . . . . . . . . . . . . . . . . . . . . . . . . . . . 40
A Prerequisite for program execution 43
Bibliography 45

Acknowledgement
First and foremost, I would like to express my sincere gratitude to my advisor Dr.Lluís Garrido Ostrermann, for his immense knowledge, the valuable support he has givenme during the entire project, as well as he patiently offered me skype meetings when Iwas studying abroad. I am really thankful to him.
Secondly, I would also like to thank my parents for the continuous supports they havebeen giving me.
Finally, I would also like to extend my thanks to my friends and double degree class-mates for the motivation they have given me during all the degree.
iii

Chapter 1
Introduction
1.1 Motivation
Nowadays, Big Data and Data Science seem to be the most useful technologies for dataprocessing used in a variety of areas, such as business, sports, social media, investigations,etc.
But, what is Big Data? And, what about Data Science? Also, what is the differencebetween them?
Big data is the challenge for data sets that are huge or complex which traditional dataprocessing applications are inadequate to manage them in a reasonable time[1]. Hence,we can conclude Big data as a concept that refers to the storage of large amounts of dataand the used procedures to find repetitive patterns within the data.
Data Science is an interdisciplinary field about processes and systems to extract knowl-edge or insights from data in various forms, either structured or unstructured, which iscontinuation of some of the data analysis fields such as statistic, data mining, and predic-tive analytics, similar to Knowledge Discovery in Database(KDD).
We compare them. Data Science looks to create models that capture the underly-ing patterns of complex systems, and codify those models into working application. BigData looks to collect and manage large amounts of varied data to serve large-scale webapplications and vast sensor networks. But, these terms are often used interchangeablydespite having fundamentally different roles to play in bringing the potential of data tothe doorstep of an organization[7].
As social media is now the fastest way to spread out information and it has grownup quickly in these recent years. So, it is interesting to know how is the database behindsocial media being processed. That is the reason I have been led to this topic and chose itfor my Degree Final Project (TFG).
Now, how are Big Data and Data Science applied in social media?Social media is the collective of online communications channels dedicated to com-
1
munity based input, interaction, content-sharing and collaboration. In other words, it iscomputer-mediated tool that allow people exchange information in virtual communities.Hence, it must have an enormous and complex database, because that information can becreated and stored by multi formats files. For example, pictures, videos, texts, etc. Then,in pictures category, it has various extensions like PNG, JPEG, GIF, etc. Therefore, weneed apply Big Data and Data Science concepts to manage and process them intelligently.
However, in this project we are going to talk about just the small particular piece ofsocial media, which is Reddit.
1.2 Context
Reddit is an entertainment, social news website founded by Steve Huffman and AlexisOhanian in June 23rd, 2005. Registered users on Reddit are called redditors, they cansubmit content as text posts or direct links, then other redditors can post comments aboutit or reply other comments, and vote submission with "like" or "unlike" options. That is,the submissions with the highest amount of "like" appear on the main page or the top ofcategory. Likewise, redditors can vote negatively to against the topic, that can probablymake it disappear from the hottest posts. Contents entries are categorised by dividinginto different areas of interest called "subreddits"[4].
Reddit has around 50 default subreddit topics like news, gaming, movies, music, andmany others which are visible in front of page. More than that, redditors can also createtheir own subreddit topic.
Moreover, Reddit is one of the most popular social media website in the world. Thereare 36 million redditors and 231 million monthly uniques in Reddit counted until February19, 2016. Therefore, we can conclude that Reddit has a huge database which needs somespecial technology such as Big data to process them easily.
1.3 Aim of Degree Final Project(TFG)
As we mentioned in the above section, Reddit has a large amount of visitors, eventhough there is a piece of them are non-login users. But it still has huge number of red-ditors. However, no all of them behaviour well and keep Reddit as a clean virtual socialcommunity. In other words, some of Reddit visitors post text which contains lots insultsor they rudely comment posts. Therefore, we aim to analyse the redditors posts and findout the worst behaviour user on Reddit during whole month in May of 2015.
However, we do not have any stored information about non-login users except theircomments. So, we are going to point out just the worst behaviour redditors. That is, anal-yse Reddit database of May, 2015, then process them by using an appropriate methodologyto calculate the "bad" rate of each user. Such "bad" rate is an integer number between 0to 100, which higher "bad" rate gets, worse behaviour that redditor has. Then, we sort
the result by using "bad" rate list to get the highest "bad" rate users. Those redditors aresupposed to be the worst behaviour users in Reddit.
1.4 Report overview
In order to achieve the above goal, we organize this project as follows:
Chapter 2 explains the used methodology and the chosen programing languages.
Chapter 3 discusses the implementation of program, which includes: how we extractinformation from the database; what methodology we used to analyse redditors’ be-haviour; how we added parallelism concept to make program accelerate execution speedfor such huge database.
Chapter 4 shows experimental results with some histogram, DataFrame tabular. Also,it details the improvement of execution speed by using Parallelism.
Chapter 5 ends the project with conclusion and propose other possible future works.

Chapter 2
Technologies
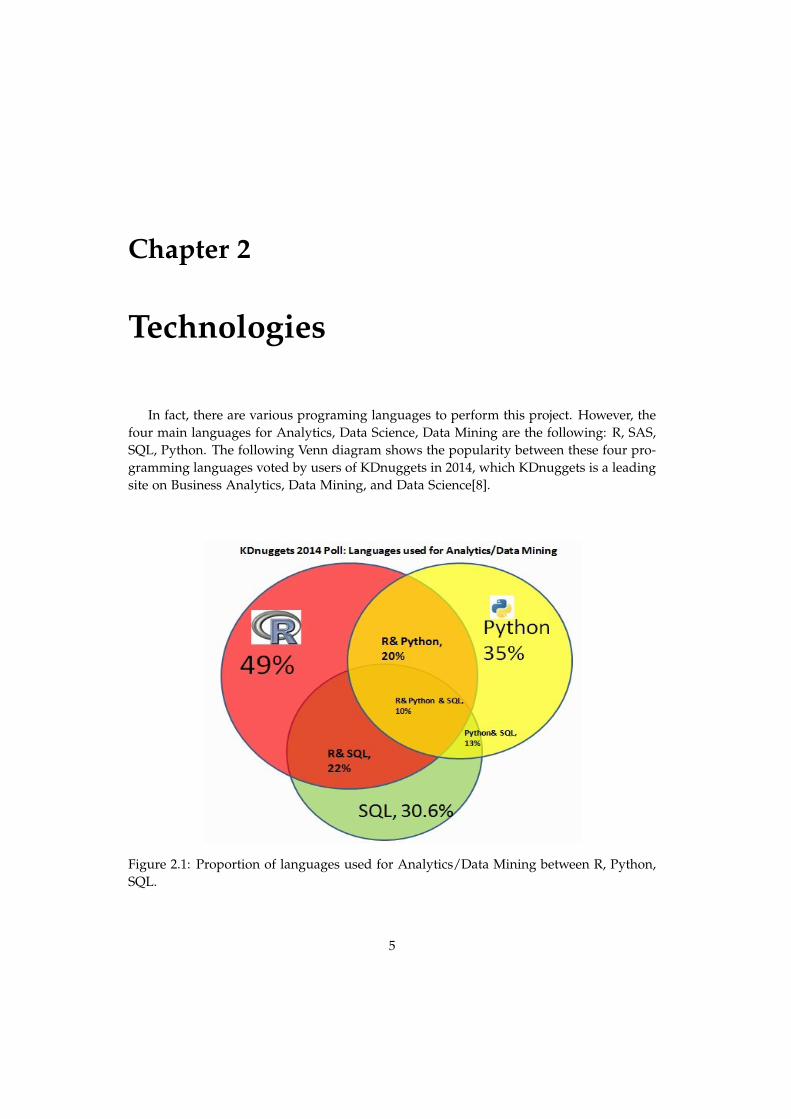
In fact, there are various programing languages to perform this project. However, thefour main languages for Analytics, Data Science, Data Mining are the following: R, SAS,SQL, Python. The following Venn diagram shows the popularity between these four pro-gramming languages voted by users of KDnuggets in 2014, which KDnuggets is a leadingsite on Business Analytics, Data Mining, and Data Science[8].
Figure 2.1: Proportion of languages used for Analytics/Data Mining between R, Python,SQL.
5
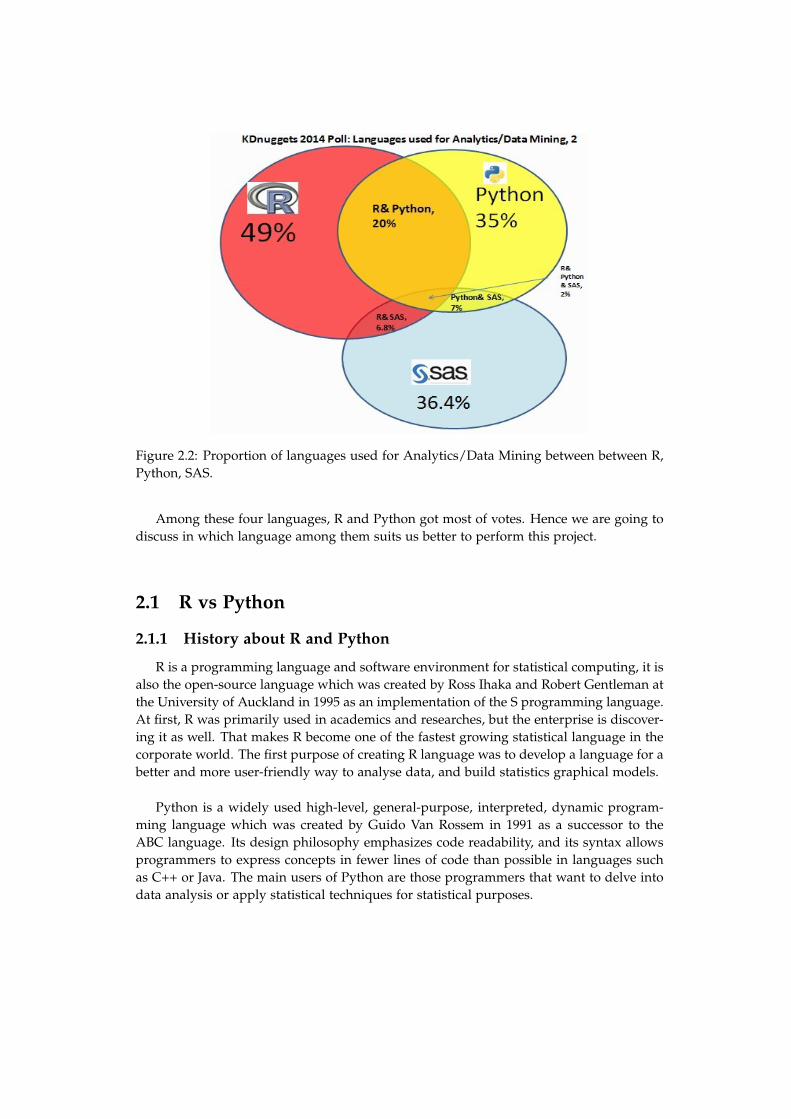
Figure 2.2: Proportion of languages used for Analytics/Data Mining between between R,Python, SAS.
Among these four languages, R and Python got most of votes. Hence we are going todiscuss in which language among them suits us better to perform this project.
2.1 R vs Python
2.1.1 History about R and Python
R is a programming language and software environment for statistical computing, it isalso the open-source language which was created by Ross Ihaka and Robert Gentleman atthe University of Auckland in 1995 as an implementation of the S programming language.At first, R was primarily used in academics and researches, but the enterprise is discover-ing it as well. That makes R become one of the fastest growing statistical language in thecorporate world. The first purpose of creating R language was to develop a language for abetter and more user-friendly way to analyse data, and build statistics graphical models.
Python is a widely used high-level, general-purpose, interpreted, dynamic program-ming language which was created by Guido Van Rossem in 1991 as a successor to theABC language. Its design philosophy emphasizes code readability, and its syntax allowsprogrammers to express concepts in fewer lines of code than possible in languages suchas C++ or Java. The main users of Python are those programmers that want to delve intodata analysis or apply statistical techniques for statistical purposes.

2.1.2 Why Python?
On the web, we can find easily many numbers comparing the adoption and popularityof R and Python. Whilst these give a good indication on how these two languages areevolving in the overall ecosystem of Computer Science, it is hard to compare them side-by-side. The main reason for this is that R seems to be just in a Data Science environment;However, Python as a general purpose language, it is widely used in many field, such asweb development. This often biases the ranking results in favour of Python.
Moreover, R is mainly used when the data analysis task requires standalone computingor analysis on individual servers. It is handy for almost any type of data analysis becauseof the huge number of package and readily usable tests that often provide us with thenecessary tools to get up and running quickly. R can even be part of a Big Data solution.
Contrast to R, we can use Python when data analysis tasks need to be integrated withweb applications or if statistics code needs to be incorporated into a production database.Being a fully-fledged programming language, it is a great tool to implement algorithmsfor production use. While the infancy of Python packages for data analysis was an issuein the past, this has improved significantly over the year.
The comparison between R and Python can obtained by list the pros and cons ofboth[9].
The advantages of R are the following:
• R can effectively visualize data. It contains a powerful visualization packages suchas ggplot2, ggvis, googleVis and rCharts.
• R has a rich ecosystem of cutting-edge packages and active community. Packagesare available at CRAN, BioConductor and Github. We can search through all Rpackages at Rdocumentation.
• R is developed by statisticians. They can communicate ideas and concepts throughR code and packages, hence you do not necessarily need a computer science back-ground to get started.
Despite the above such useful advantages for analytics of data, but we have also takeinto account some disadvantages of it.
• R is slow. That is because R was developed to make the life of statisticians easier,hence R can be experienced as slow due to poorly written code.
• Learning R is difficult, especially if you come from a GUI for your statistical analysis.Even finding package can be time consuming if you are not familiar with it.
Now, Python has the following advantages in data analysis:
• Python is a general purpose language that is easy and intuitive. Hence its learningcurve is relatively low, and it increases the speed at which we can write a program.

In short, we need less time to code. Furthermore, the Python testing framework is abuilt-in, low-barrier-to-entry testing framework that encourages good test coverage.This guarantees the programming code is reusable and dependable.
• Python is a multi-purpose language. It brings people with different backgroundstogether. As a common, easy to understand language that is known by programmersand that can easily be learnt by statisticians, we can build a single tool that integrateswith every part of our workflow.
• One of the strengths of Python is the IPython Notebook. It makes us easier to workwith Python and data. We can easily share notebooks with other people, withouthaving them to install anything. This drastically reduces the overhead of organizingcode, output and notes files. It will allow us to spend more time doing real work.
Comparing the disadvantages of Python to R:
• Although Python has some nice visualization libraries, such as Seaborn, Bokeh andPygal, there are maybe too many options to choose from. However, compared toR, visualizations are usually more convoluted, and the results are not always sopleasing to the eye.
• Python is a challenger to R. It does not offer an alternative to the hundreds of essen-tial R packages. Although it is catching up, it is still unclear if this will make peoplegive up R.
Regarding to the above comparison, it seems the cons of Python are more bearablethan R. That is the reason we chose Python as the programming language for this project.
Moreover, Python has been evolved from Python 1.x version to Python 3.5.1 up to thepresent day. But the mostly Python 1.x versions have been deprecated. Hence, the de-scription of some features about Python 2.x and Python 3.x are below.
Python 2.0 was released on 16 October 2000 and had many major new features, in-cluding a cycle-detecting garbage collector and support for Unicode. With this release thedevelopment process was changed and became more transparent and community-backed.
Python 3.0 was released on 3 December 2008 after a long period of testing. Many of itsmajor features have been backported to the backwards-compatible Python 2.6.x and 2.7.xthat is now the earliest still supported version.
In fact, Python 3.0 version was firstly used, but it has some incompatible code in theParallelism part which we are going to talk on the next section. Therefore, after tryingPython 3.0, it is replaced by Python 2.7.
2.2 Ipython Notebook and Parallelism
IPython is a command shell for interactive computing in multiple programming lan-guages, originally developed for the Python programming language, that offers introspec-tion, rich media, shell syntax, tab completion, and history. IPython provides features asfollows: Interactive shells; Support for interactive data visualization and use of GUI toolk-its; Flexible, embeddable interpreters to load into one’s own projects; A browser-basednotebook with support for various media; Tools for parallel computing[2]. Regarding toall these features, we just focus on IPython Notebook and IPython Parallelism.
2.2.1 IPython Notebook
As we mentioned Ipython Notebook at the previous section. It is a web-based inter-active computational environment for creating IPython notebooks. An IPython notebookis a JSON document containing an ordered list of input/output cells which can containcode, text, mathematics, plots and rich media.
In addition, IPython notebooks can be converted to a number of open standard outputformats through its web interface and shell. These output formats can be HTML, HTMLpresentation slides, LaTex, Markdown, Python, etc.
Thus, we can conclude an IPython notebook as a tool which lets us write and executePython code in our web browser. Also, IPython notebooks make it very easy to tinkerwith code and execute it in bits and pieces; for this reason, IPython notebooks are widelyused in scientific computing.
2.2.2 IPython Parallelism
Parallelism has been employed for many years, mainly in high-performance comput-ing. Parallel computing is a type of computation in which many calculations are carriedout simultaneously, in order to increase the execution speed and reduce execution time.Operating on the principle that large problems can often be divided into smaller ones,which are then solved at the same time.
IPython has a powerful architecture for parallel and distributed computing. This archi-tecture abstracts out parallelism in a very general way, which enables IPython to supportmany different styles of parallelism including: Single program, multiple data parallelism;Multiple program, multiple data parallelism; Message passing using MPI; Task farming;Data parallel; Combinations of these approaches; Custom user defined approaches. Mostimportantly, IPython enables all types of parallel applications to be developed, executed,debugged and monitored interactively.
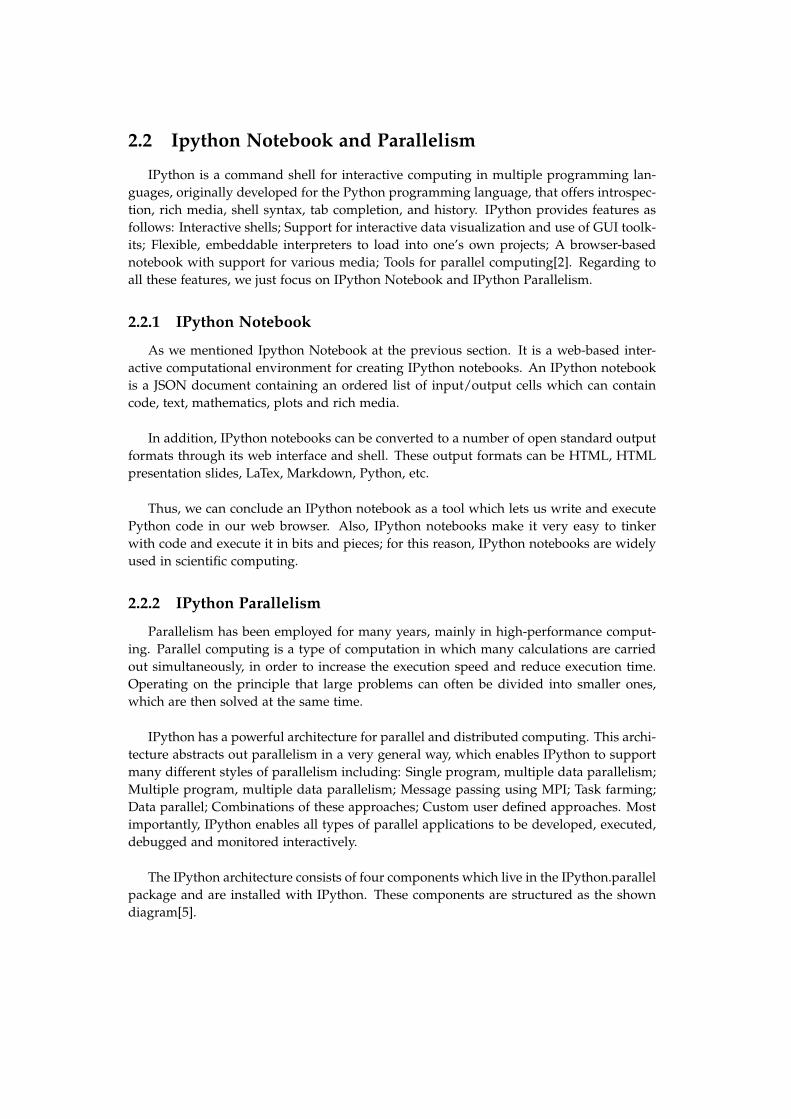
The IPython architecture consists of four components which live in the IPython.parallelpackage and are installed with IPython. These components are structured as the showndiagram[5].
Figure 2.3: IPython’s architecture for parallel computing
Each of the blocks explained below:
• The IPython engine is a Python instance, usually a IPython interpreter, that takesPython commands over a network connection. When multiple engines are started,parallel computing becomes possible.
• A HUB and a collection of schedulers form a IPython controller. The controller is acollection of processes to which IPython engines and clients can connect, it providesan interface for working with a set of engines.
• HUB is the centre of an IPython cluster. It is also the process that keeps track ofengine connection, schedulers, clients, as well as all task requests and results. Ithas to facilitate queries of the cluster state, and minimize the necessary informationrequired to establish the many connections involved in connecting new clients andengines.
• The scheduler is an application that distributes the commands to the engines. Whilethe IPython engines themselves block when user code is run, the schedulers hidethat from the user to provide a fully asynchronous interface to a set of engines.
• The client is a IPython object created at an IPython interpreter. This object will allowus to send commands to the IPython engines.
2.2.3 Multicore parallel computing
In this project, we use the multicore parallel computing of IPython parallelism. A sim-ple concept to understand it is, to split the computation work in multiple tasks so that
each one is executed in different cores.
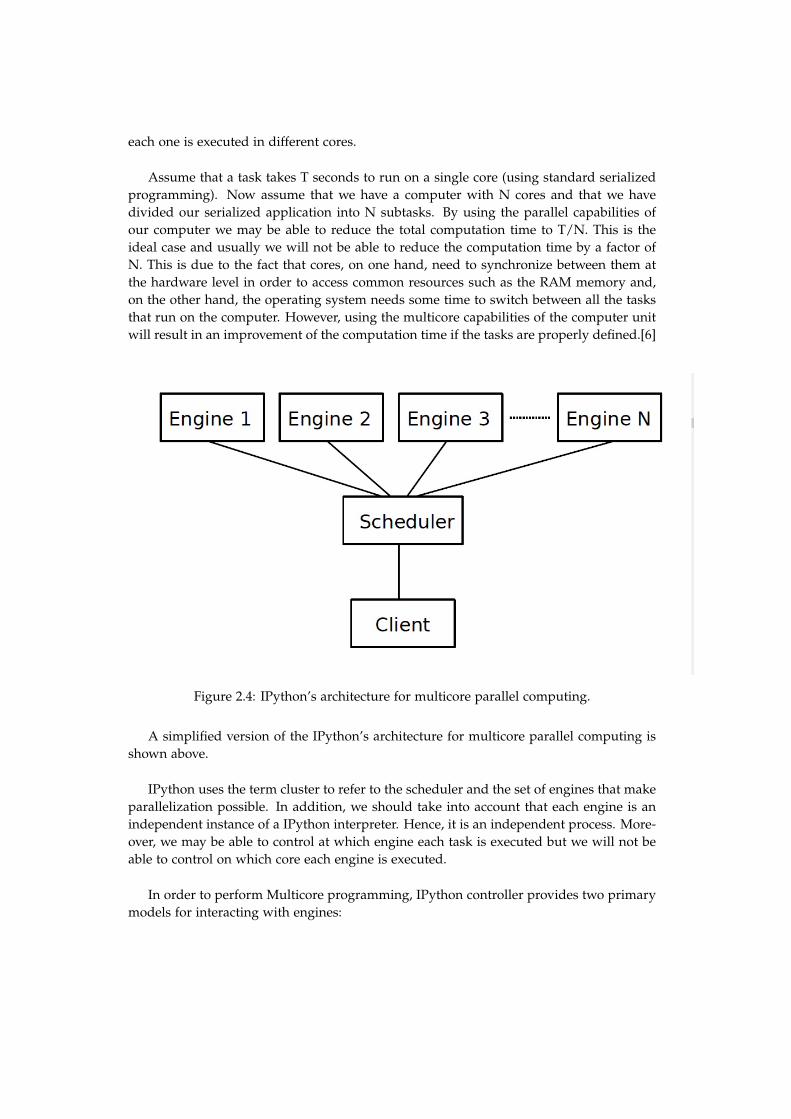
Assume that a task takes T seconds to run on a single core (using standard serializedprogramming). Now assume that we have a computer with N cores and that we havedivided our serialized application into N subtasks. By using the parallel capabilities ofour computer we may be able to reduce the total computation time to T/N. This is theideal case and usually we will not be able to reduce the computation time by a factor ofN. This is due to the fact that cores, on one hand, need to synchronize between them atthe hardware level in order to access common resources such as the RAM memory and,on the other hand, the operating system needs some time to switch between all the tasksthat run on the computer. However, using the multicore capabilities of the computer unitwill result in an improvement of the computation time if the tasks are properly defined.[6]
Figure 2.4: IPython’s architecture for multicore parallel computing.
A simplified version of the IPython’s architecture for multicore parallel computing isshown above.
IPython uses the term cluster to refer to the scheduler and the set of engines that makeparallelization possible. In addition, we should take into account that each engine is anindependent instance of a IPython interpreter. Hence, it is an independent process. More-over, we may be able to control at which engine each task is executed but we will not beable to control on which core each engine is executed.
In order to perform Multicore programming, IPython controller provides two primarymodels for interacting with engines:

1. A Direct View interface, where engines are addressed explicitly.
2. A Load Balanced interface, where the scheduler is trusted with assigning work toappropriate engines.
During this project, we use Direct View on account of its simplicity. It allows the user todirectly control which tasks are sent to which engines.
2.2.4 Connecting to the cluster
To use IPython’s parallel capabilities the first thing to do is to start the cluster. Thereare two ways for doing it. We just detail the simplest way which is started from thenotebook interface. Within the IPython notebook, we can use the "Clusters" tab of thedashboard, and press "Start". This will automatically run the necessary commands tostart the IPython cluster creating N engines, where N equals the N number of cores. Inthis case the notebook will be used as interface to the cluster, that is, we will be able tosend diverse tasks to the engines using the web interface.
We have seen how to initialize the cluster with N engines. Now, we use the followingcommand to connect it.
Figure 2.5: Connecting to the IPython cluster.
2.2.5 Multicore programming with Direct View interface
In order to send command to the cluster, we need first create a Direct View interfaceto interact with all engines. Within the direct view, engines[0] represents the first engine,engines[1] the second engine, and so on.
Figure 2.6: Creating a direct view to all engines.
The command in figure 2.6 creates a Direct View interface to all engines. We give anexample in figure 2.7 , this command is executed on the client and sends the command"a=2" to the first engine:

Figure 2.7: Sending command to engines.
We may retrieve the result by executing the following command on the client:
Figure 2.8: Retrieving result of execution.
With this, we end introducing the basic parallel computing commands.
2.3 Python and SQLite
Regarding the database. We have a database as the figure 2.9 shows. It is a file withfile extension ".sqlite" and its size is almost 30GB. Therefore, we are going to introduceSQLite, which is the tool we use in order to manage our database.
Figure 2.9: database file details.
SQLite is a C library that provides a lightweight disk-based database that does notrequire a separate server process and allows accessing the database using a nonstandardvariant of the SQL query language. Some applications can use SQLite for internal datastorage. It is also possible to prototype an application using SQLite and then port the codeto a larger database such as PostgreSQL or Oracle.
In addition, the SQLite can be integrated with Python using sqlite3. The sqliste3 mod-ule provides a SQL interface compliant with the DB-API 2.0 which can suffice our require-ment to work with SQLite database from our Python program.
To use the module, we must first create a Connection object that represents the database.Then, we can use the powerful Python data analysis toolkit Pandas to read it and convertit as a DataFrame tabular.
Pandas is a Python package providing fast, flexible, and expressive data structuresdesigned to make working with "relational" or "labelled" data both easy and intuitive. Itaims to be the fundamental high-level building block for doing practical, real world dataanalysis in Python.
DataFrame is a class inside the package Pandas. It is the primary Pandas data struc-ture that has properties such as two-dimensional size-mutable; potentially heterogeneoustabular data structure with labelled axes (rows and columns); arithmetic operations alignon both row and column labels; It can be thought of as a dictionary-like container forSeries objects, see figure 2.10.
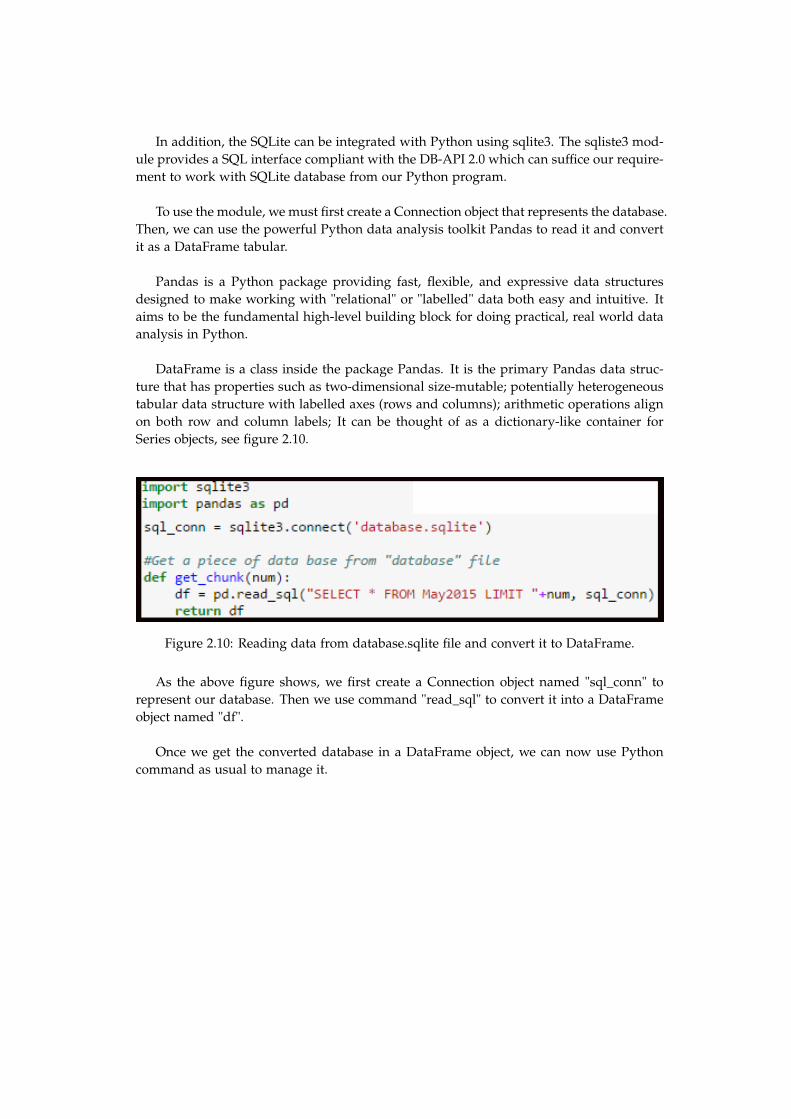
Figure 2.10: Reading data from database.sqlite file and convert it to DataFrame.
As the above figure shows, we first create a Connection object named "sql_conn" torepresent our database. Then we use command "read_sql" to convert it into a DataFrameobject named "df".
Once we get the converted database in a DataFrame object, we can now use Pythoncommand as usual to manage it.

Chapter 3
Design and implementation
The aim of this chapter is to explain the process followed in order to construct the tablewhich contains the worst behaviour users in Reddit at May of 2015. It is divided into 5sections: Extracting information from database, Behaviour analysis, Building histogram,Scheme, Adding Parallelism. The first section describes how we read information fromdatabase and what does those data mean. Behaviour analysis summarizes how we clas-sify a Reddit user as a "bad" user. Building histogram presents the process to create thehistogram by counting the occurrence of Reddit user. Scheme describes how we sortedlist of "bad" users and how we got the worst users. Finally, Adding Parallelism sectiondetails how we added parallel computing in order to get the same result as the processwe did at the previous sections.
3.1 Extracting information from database
3.1.1 Description of database
In order to extract data from database and get information of them. Firstly, we need apowerful and very useful tool to read data from a such big database which its size is 30GB.There are many other options, but we chose SqliteBrowser which is the most suggestedone.
15
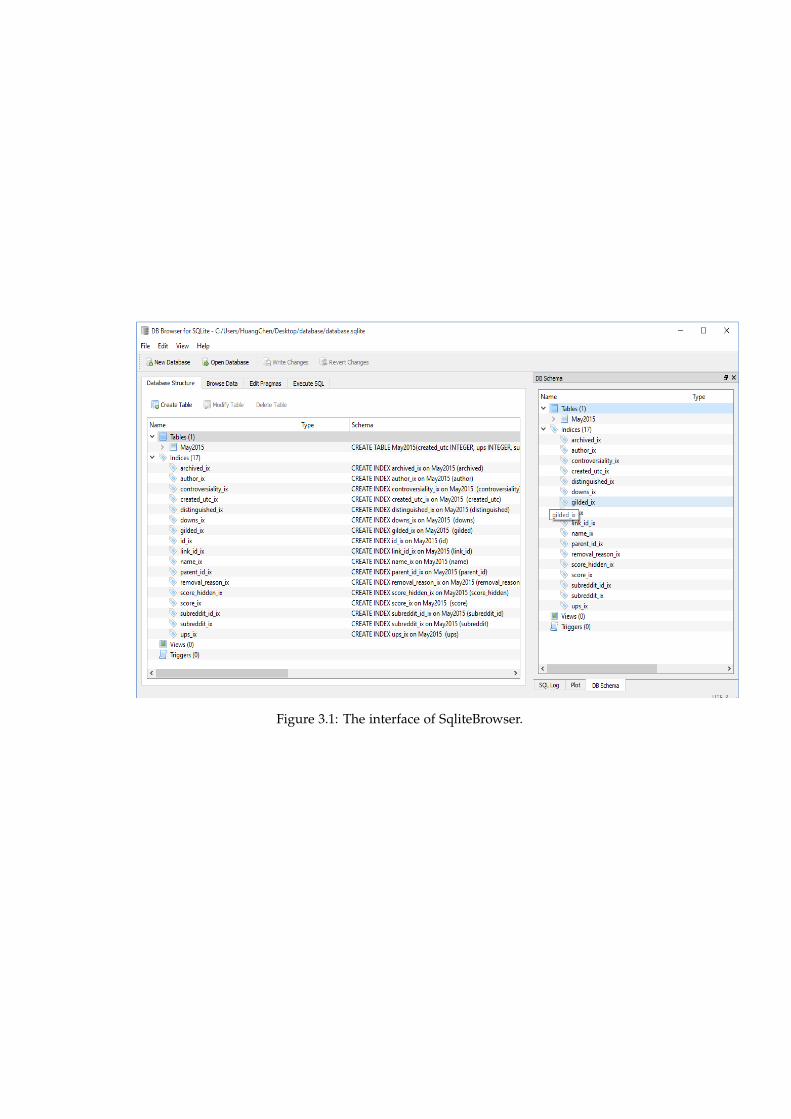
Figure 3.1: The interface of SqliteBrowser.
As the above interface (figure 3.1) shown, our database structure a table named May2015,which contains all the information about Reddit on May of 2015. Also, it has 17 indicesthat correspond 17 entities inside the table May, 2015. We detail it in the below figure.
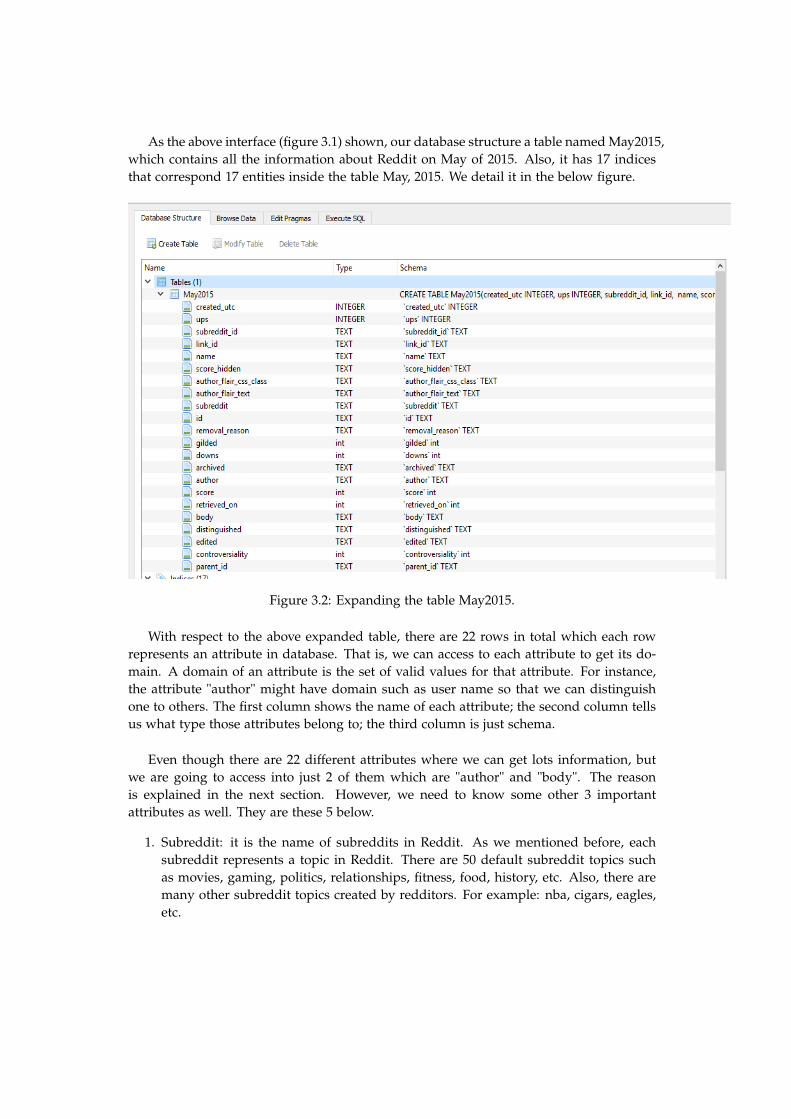
Figure 3.2: Expanding the table May2015.
With respect to the above expanded table, there are 22 rows in total which each rowrepresents an attribute in database. That is, we can access to each attribute to get its do-main. A domain of an attribute is the set of valid values for that attribute. For instance,the attribute "author" might have domain such as user name so that we can distinguishone to others. The first column shows the name of each attribute; the second column tellsus what type those attributes belong to; the third column is just schema.
Even though there are 22 different attributes where we can get lots information, butwe are going to access into just 2 of them which are "author" and "body". The reasonis explained in the next section. However, we need to know some other 3 importantattributes as well. They are these 5 below.
1. Subreddit: it is the name of subreddits in Reddit. As we mentioned before, eachsubreddit represents a topic in Reddit. There are 50 default subreddit topics suchas movies, gaming, politics, relationships, fitness, food, history, etc. Also, there aremany other subreddit topics created by redditors. For example: nba, cigars, eagles,etc.

2. Subreddit_id: each subreddit has its own identity number which is a combinationof a series characters and integer numbers.
3. Id: every comment or post made by a redditor has its own identity number. Theyare not repeated.
4. Author: it is the user name of redditors. Each redditor has they own user name.Also, the user name cannot be changed once it is registered in Reddit database.
5. Body: the content of post or comment written by redditors form a "body" in Redditdatabase. Its type is text.
An entity is a set of objects of the same types that share the same properties or at-tributes, so it is characterized by an ordered list of attributes. In our case, an entity is apost or comment that has all the above 22 attributes. We can also use SqliteBrowser tobrowse data and see what are the real entities in Reddit database. The browsed data isshown on below two figures.
Figure 3.3: Browsed data
As the figures 3.3 and 3.4 show, each row represents one entity, that is one post or com-ment. Each column represents the domain of the correspond attribute. In the bottom left

Figure 3.4: Browsed data
corner, it tells us that we have in total 54.504.410 entities which are posts and commentsmade by redditors during the whole month of May in 2015.
After we browsed the data, we have to extract them and use them to analyse users’behaviour so that we could get our goal.
3.1.2 Extracting data
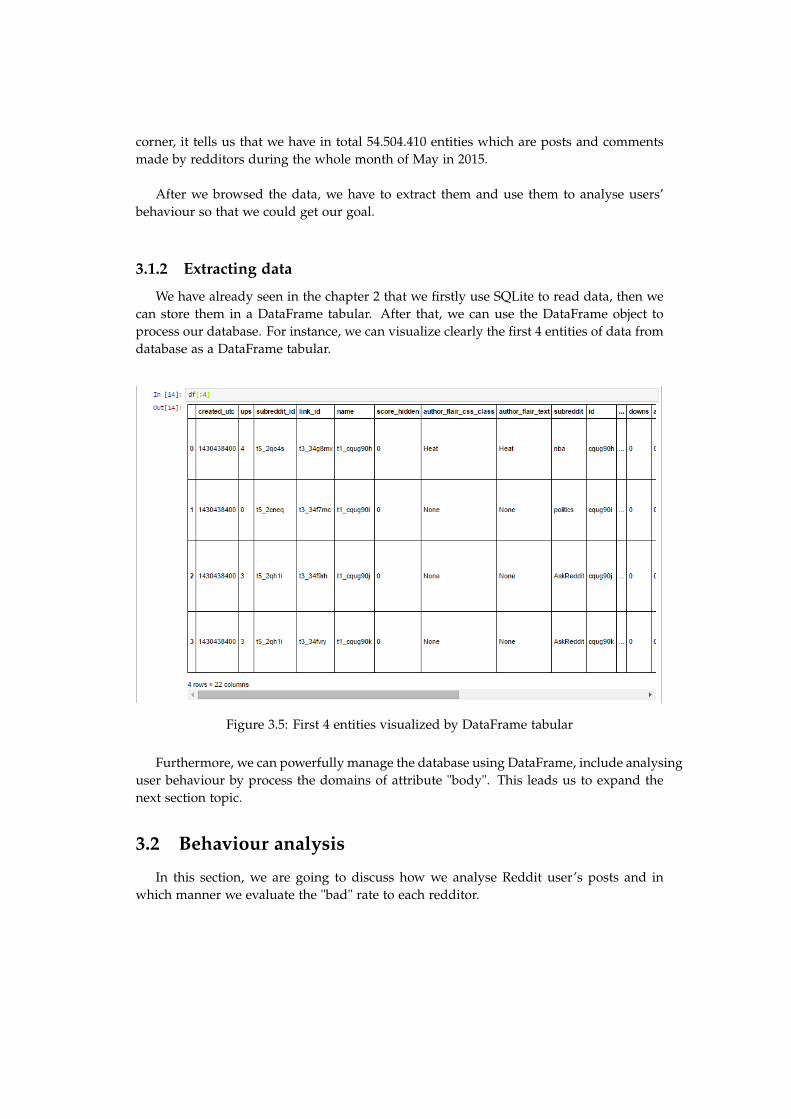
We have already seen in the chapter 2 that we firstly use SQLite to read data, then wecan store them in a DataFrame tabular. After that, we can use the DataFrame object toprocess our database. For instance, we can visualize clearly the first 4 entities of data fromdatabase as a DataFrame tabular.
Figure 3.5: First 4 entities visualized by DataFrame tabular
Furthermore, we can powerfully manage the database using DataFrame, include analysinguser behaviour by process the domains of attribute "body". This leads us to expand thenext section topic.
3.2 Behaviour analysis
In this section, we are going to discuss how we analyse Reddit user’s posts and inwhich manner we evaluate the "bad" rate to each redditor.
Firstly, as we mentioned at the previous section, even though we have 22 differentattributes, we just need to use the attributes "author" and "body". That is because eachredditor has his own user name. Although, in very few cases does Reddit exist somerepeated account. But, the repeated account’s amount is negligible so that we can con-sider that all the user name of redditors are unique. In addition, due to the huge size ofdatabase, we should firstly just process the 1.000.000 first entities in order to save runtime.
Thus, we aim to analyse the posts and comments made by redditor and to find out theone who behaviours worse in Reddit. Therefore, we need a list of insult words so that wecan check if the comments contain insult words in that list. That is, to create a list of badwords, the more insult words it contains more accurate for analysis result. Hence, we havea text file named "badlist.txt"1 (based on [3]) which contains in total 496 insult words. Thewords in that file are also considered network language problem. For example, in orderto control network language violence, some social network sites do not allow people postinsult content. Thus, people insult the word "shit" as "sh*t" so that we could not find iteasily. That is the reason we have such lots words in the file. Because we add the hottestinsult words with some of its possible network language manner such as the word "fuck",its possible network language could be "f u c k", "f u * k", etc.
After get the file, we need to read line by line in order to store all these insult wordsinto a Python variable named "badwords". The type of "badwords" is Python list.
Before we detail more, I need to explain first the criterion we are going to use in orderto calculate the "bad" rate for each redditor.
3.2.1 Bad rate BR_P
We mentioned the "bad" rate before. It is an integer number we need to calculate foreach redditor by analysing all the comments they posted in Reddit during May of 2015.
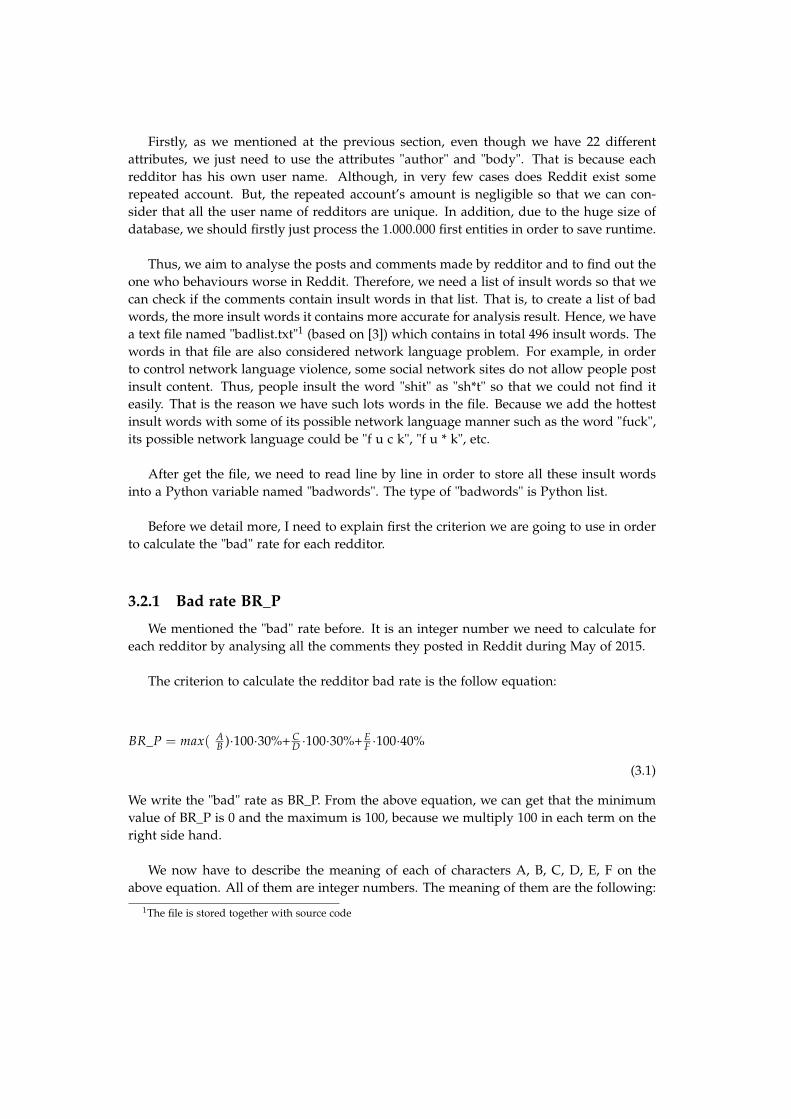
The criterion to calculate the redditor bad rate is the follow equation:
BR_P = max( AB )·100·30%+ C
D ·100·30%+ EF ·100·40%
(3.1)
We write the "bad" rate as BR_P. From the above equation, we can get that the minimumvalue of BR_P is 0 and the maximum is 100, because we multiply 100 in each term on theright side hand.
We now have to describe the meaning of each of characters A, B, C, D, E, F on theabove equation. All of them are integer numbers. The meaning of them are the following:
1The file is stored together with source code

• A: In one comment, A is the number of total insult words in that comment.
• B: It is the total comment words that contains A insult words.
So, AB · 100 is the proportion of insult word in one comment. But, we multiply max( A
B ) · 100instead of A
B · 100. Because, in this first term we evaluate the worst comment that redditorhave ever written.
• C: The total number of insult words written by one redditor.
• D: The total number of comment words written by one redditor.
Hence, CD · 100 is the proportion of insult word written by one redditor.
• E: The total amount of insult comments written by one redditor. An insult commentis the comment which contains at least one insult word.
• F: The total amount of comments posted by one redditor.
Therefore, EF · 100 is the proportion of insult comment posted by one redditor.
We can see the following example to make the reader clearly understand all the signif-icance of the above characters and equation.Assume that a redditor with user name "hey_reddit" posted in total 4 comments in Mayof 2015. These 4 comments are below:
1. I just wonder how the fuck do you write so fast, fuck .
2. King is very technically talented but hi throws a lot of shit at the wall and not all ofit sticks.
3. I’ve personally never been able to stick with a King book for long because I can’tstand his writing, but Martin’s not much better for a lot of the same reasons.
4. I always thought he was horribly overrated and that his stories generally make bettermovies than written media.
From the above 4 comments, we can find easily that the first 2 comments have badwords that are contained inside the file "badlist.txt"2. So, the comment 1 has two insultword which are fuck, fuck. The comment 2 has also one bad word which is shit. The rest2 comments have zero bad word.
• Hence, in comment 1, it has the value of A equals 2. It has in total 12 words so thatB equals 12. Then A
B =0.182
• In case of comment 2, it has A=1, B=21. So, AB =0.048
• In case of comment 3, A=0, B=31, AB =0.
• In case of Comment 4, A=0, B=18, AB =0.
2The file is stored together with source code
So, the maximum value of AB is 0.182.
Now, by definition of the character C, the redditor "hey_reddit" has in total 2 insults.So C=3, D=12+21+31+18=82 and C
D =0.037 Also, E=2 because there are just 2 commentsthat contain bad words, and F=4 because he posted in total 4 comments during wholemonth of May. Then, E
F =0.5
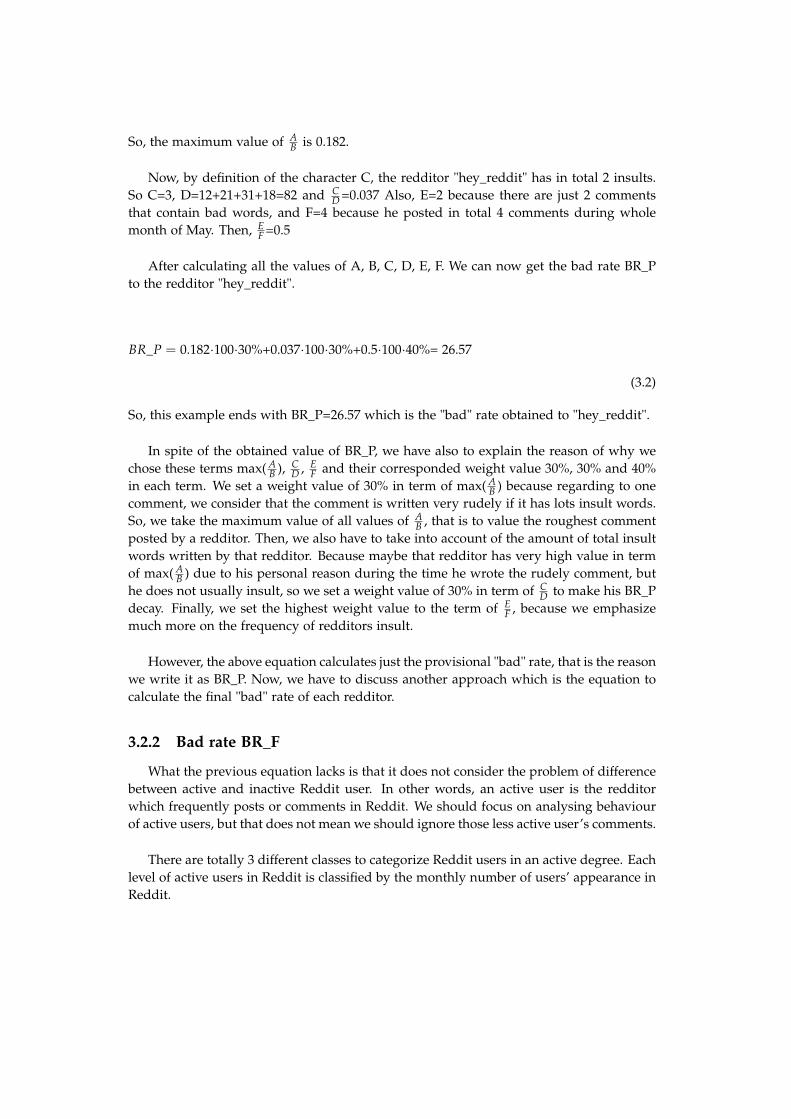
After calculating all the values of A, B, C, D, E, F. We can now get the bad rate BR_Pto the redditor "hey_reddit".
BR_P = 0.182·100·30%+0.037·100·30%+0.5·100·40%= 26.57
(3.2)
So, this example ends with BR_P=26.57 which is the "bad" rate obtained to "hey_reddit".
In spite of the obtained value of BR_P, we have also to explain the reason of why wechose these terms max( A
B ), CD , E
F and their corresponded weight value 30%, 30% and 40%in each term. We set a weight value of 30% in term of max( A
B ) because regarding to onecomment, we consider that the comment is written very rudely if it has lots insult words.So, we take the maximum value of all values of A
B , that is to value the roughest commentposted by a redditor. Then, we also have to take into account of the amount of total insultwords written by that redditor. Because maybe that redditor has very high value in termof max( A
B ) due to his personal reason during the time he wrote the rudely comment, buthe does not usually insult, so we set a weight value of 30% in term of C
D to make his BR_Pdecay. Finally, we set the highest weight value to the term of E
F , because we emphasizemuch more on the frequency of redditors insult.
However, the above equation calculates just the provisional "bad" rate, that is the reasonwe write it as BR_P. Now, we have to discuss another approach which is the equation tocalculate the final "bad" rate of each redditor.
3.2.2 Bad rate BR_F
What the previous equation lacks is that it does not consider the problem of differencebetween active and inactive Reddit user. In other words, an active user is the redditorwhich frequently posts or comments in Reddit. We should focus on analysing behaviourof active users, but that does not mean we should ignore those less active user’s comments.
There are totally 3 different classes to categorize Reddit users in an active degree. Eachlevel of active users in Reddit is classified by the monthly number of users’ appearance inReddit.

1. Low active users: the redditor whose appearance is less than 3 in the first 1000000Reddit posts.
2. Normal active users: the redditor who has appearance between 3 to 6.
3. High active users: the redditor whose appearance is more than 6.
The reason of why is the classification made by these number (3, 6) will be explainedin the next section 3.3.
The above classification we made by processing just the first 1.000.000 entities dueto computational restriction. But, the number of total monthly comments in Reddit is54.504.410. Hence, we calculate the proportion 3 : 1.000.000 to 54.504.410 . Then, we getthe following correspondent users’ appearance to all 54.504.410 comments in the database.
1. Low active users: The Reddit user who appears less than 30 times per month, thatis the redditor who posts less than 30 comments in May of 2015.
2. Medium active users: The Reddit user who has between 30 to 60 posts per month inReddit.
3. High active users: The Reddit user who has more than 60 posts per month in Reddit.
Now, we need to give a weight value to each class of active users. The weight value isa real number between 0 to 1 which represents the level we attach importance to the classusers’ posts.
We claim that high active users in Reddit are the targets we are going to analyse on.Hence, we give a weight value of 100% to them. Then, the medium active users have theweight value equals 70%. Finally, we consider that the comments posted by low activeusers are less important than the others. The reason is, if a redditor just posted once inMay of 2015, and that comment just contains one word which is a bad word. Then, thatredditor must have BR_P=100 so that it would be considered the worst behaviour user.Although, that person is theoretically the worst behaviour user, but it is not what we areinterested on. Therefore, we set a weight value of 30% to less active user in order to decaytheir "bad" rate value and avoid the above case.
The new equation to calculate the final "bad" rate is below:
• In case of low active user, then BR_F = BR_P · 0.35
• In case of medium active user, then BR_F = BR_P · 0.70
• In case of high active user, then BR_F = BR_P · 1.00
3.2.3 Algorithm with flowchart
After we clarify how we calculate the "bad" rate for each redditor, we need to detailmore about how to analyse user behaviour by using "bad" rate, what the workflow is.
Thus, in figure 3.6 the diagram shows each step of the whole process using top-downand left-right approaches.
As the flowchart (figure 3.6) shows, we divide the program into various steps.
1. The first step we have to do is to import the database file and convert it into aDataFrame tabular. We have already seen this step in the section of Extracting data.Once we obtained the data stored in the DataFrame tabular named "df", we needfirstly reform the DataFrame tabular. That is, removing the rest contents of entitiesexcept "author" and "body".
2. Then, we have to create an empty Python dictionary named "dic" in order to storethe process result.
3. The next step is to read the first entity in "df". Then, we get the domain of attributebody which is the content of comment. We split the comment text into a list of wordsby spaces between words. Then we check each word in the list whether that word isalso contained in the python list "badwords" (We mentioned it in the initial of thissection). If there is no word match to "badwords" list, it means that comment doesnot contain any insult word and we are not going to do anything with it, then weback to the previous step in order to read the next entity’s content. Otherwise, thecomment has at least one insult word so that we need to do the next step.
4. In this step, we firstly count how many insult words the comment have, then wecalculate the value of A, B, C, D, E, F which are the characters we need to calculateBR_P. Then, verify if the "author" that the insult comment belongs to is already existin the dictionary "dic". If not, we have to create a new item such as
{author: {"C":0,"D":0,"E":0,"F":0, "A/B":0,"body": df.body[i] }}.
(a) The key is the redditor’s user name.
(b) The value is again a Python dictionary with 6 items. The first 4 items areobvious. In the fifth item, the key is a string "A/B", its value is the maximumvalue of A
B comparing all the rest insult comment written by this redditor. Thelast item is actually the content of comment which its A
B value is max.
In another case, we just need to refresh the value of "C", "D", "E", "F", "A/B" and"body", then we update the dictionary "dic".No matter in which of the above 2 cases, we finish process one comment in this step.Therefore, in both case follow the same below step.
5. As we have finished processing one entity, we now need to check if it is the lastentity in "df". If not, we back to the step 3 in order to process the next commentuntil all the entities are processed. Otherwise, we go toward to the next step.

Figure 3.6: The flowchart of whole program.
6. After run all the above steps, we get the Python dictionary "dic" which containsall the redditors that insult in Reddit and many other information. Now, we adda new item to the dictionary which classify the active degree of each redditors in"dic". The key of this new item is "Weight" which is a string value. Its value is aPython float number, it could be 0.35, 0.70 or 1.00. Thus, an example of the updateddictionary "dic" is below: {author: {"C":0,"D":0,"E":0,"F":0, "A/B":0,"body": df.body[i],
"Weight":0.70}}.
7. We calculate the BR_F value in this step. Then, we create a new dictionary item tostore the value in order to add it to the dictionary "dic". The new item structure as{"BR_F": float_number}. The value of this item is BR_F value. So, it is a float typenumber between 0 to 100.
8. Finally, we sort the result dictionary "dic" by "BR_F" in descending order. Thenvisualize the highest value users in a DataFrame tabular.
The section ends with the above diagram and the algorithm details.
3.3 Building histogram
In this section, we discuss what implementation we did in order to categorize the de-gree of active users, which we mentioned at the previous section and use it to calculateBR_F. Moreover, we also show some histograms to explain the implementation result.
In order to do classification, we need to create a Python program to count the appear-ance of each redittor and build the histograms to set the classification value (the weightvalue). First of all, for the same reason we talked before, we just process the first 1.000.000entities in the database.
1. The first step is, extracting data (the first 1.000.000 entities) from the database andstore it as a DataFrame tabular. Then, we create a list of redditors named "au-thor_list" which appear in those entities. In this list, there is no repeated redditorsand the total number of redditors is 322.216.
2. In "author_list", we count each redditor’s appearance in the first 1.000.000 commentsin our database.
3. Convert it as a Python dictionary so that each key is a Reddit user name, and thevalue is the correspond redditor’s appearance.
4. Finally, we build histograms of the result dictionary to visualize them and storethem as picture files. In addition, we also show the result in a DataFrame tabularwith numbers, whilst histogram describes result data with diagram. The result inthe DataFrame tabular is stored in an Excel file as well. The name of the Excel filesis "Appearance_and_active_author(1000000_comments).xlsx"3.
The detail of programming code is attached in the IPython notebook file named "His-togram_about_1rst_1000000_comments.ipynb"4.
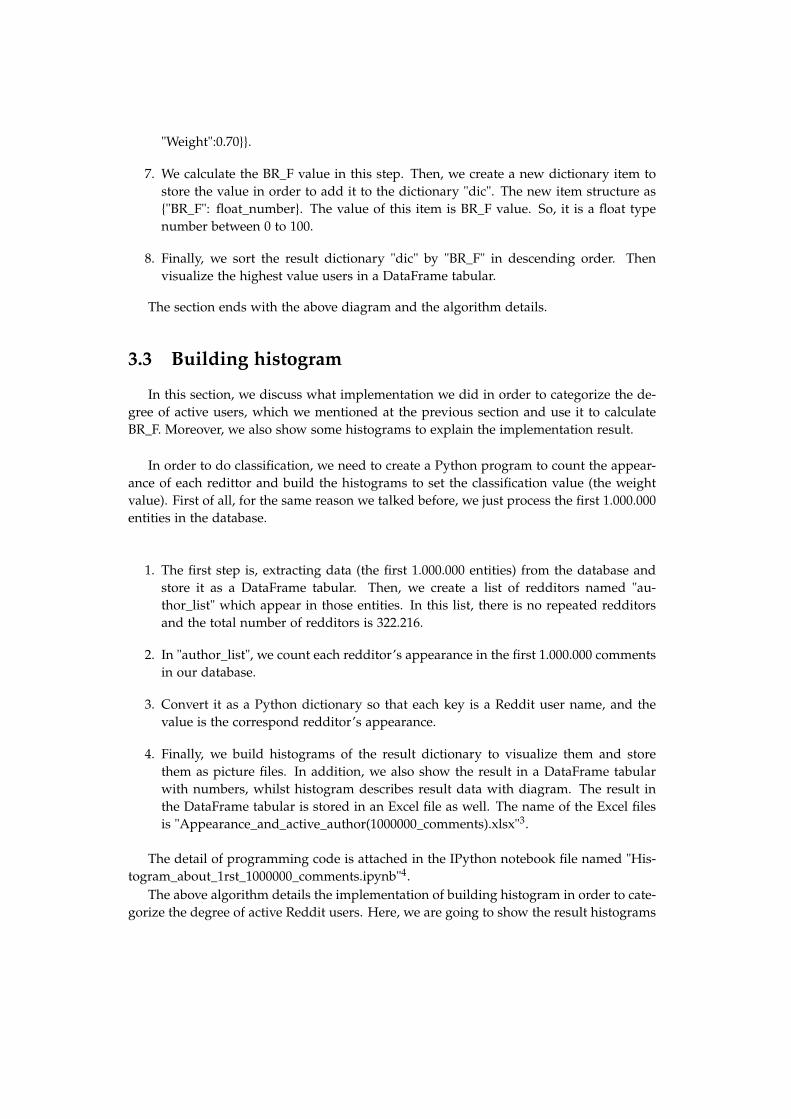
The above algorithm details the implementation of building histogram in order to cate-gorize the degree of active Reddit users. Here, we are going to show the result histograms
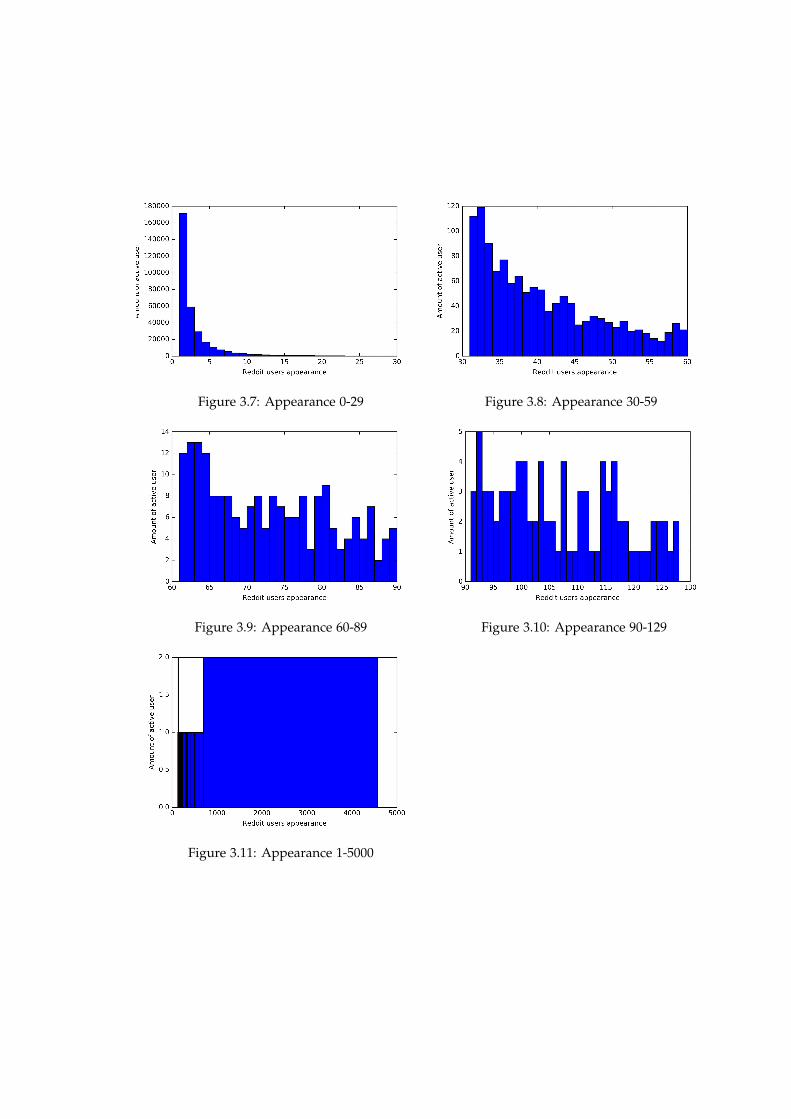
Figure 3.7: Appearance 0-29 Figure 3.8: Appearance 30-59
Figure 3.9: Appearance 60-89 Figure 3.10: Appearance 90-129
Figure 3.11: Appearance 1-5000
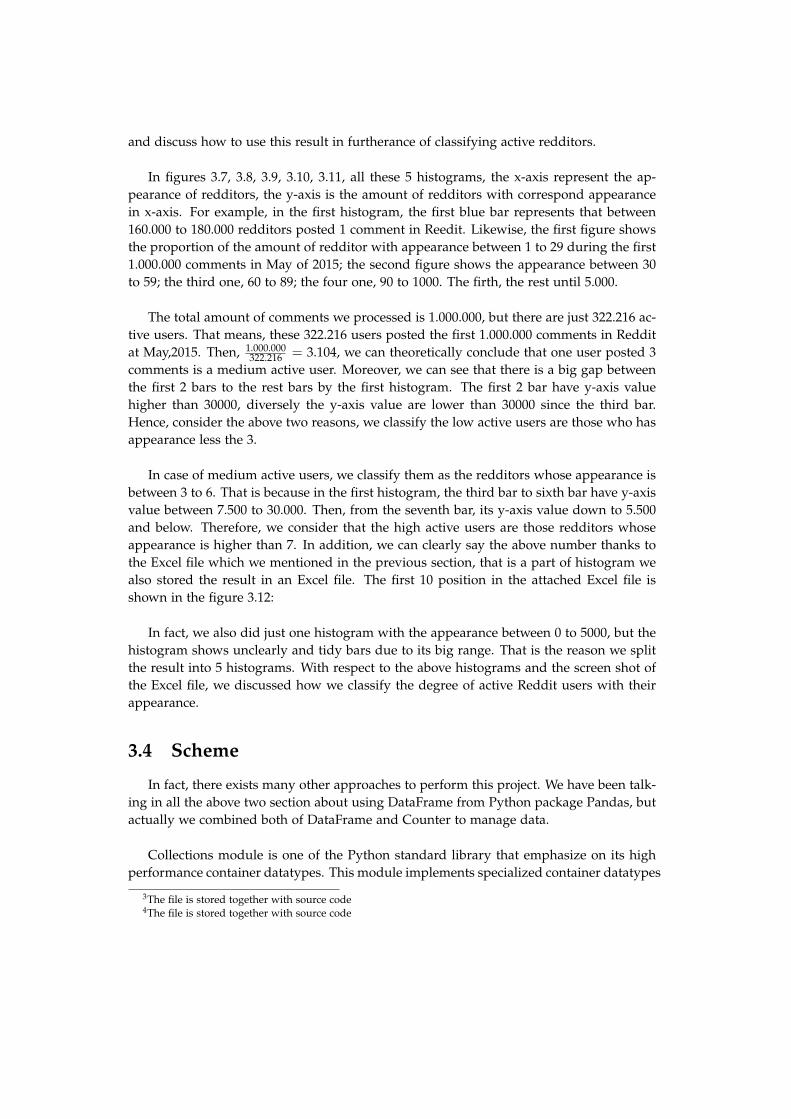
and discuss how to use this result in furtherance of classifying active redditors.
In figures 3.7, 3.8, 3.9, 3.10, 3.11, all these 5 histograms, the x-axis represent the ap-pearance of redditors, the y-axis is the amount of redditors with correspond appearancein x-axis. For example, in the first histogram, the first blue bar represents that between160.000 to 180.000 redditors posted 1 comment in Reedit. Likewise, the first figure showsthe proportion of the amount of redditor with appearance between 1 to 29 during the first1.000.000 comments in May of 2015; the second figure shows the appearance between 30to 59; the third one, 60 to 89; the four one, 90 to 1000. The firth, the rest until 5.000.
The total amount of comments we processed is 1.000.000, but there are just 322.216 ac-tive users. That means, these 322.216 users posted the first 1.000.000 comments in Redditat May,2015. Then, 1.000.000
322.216 = 3.104, we can theoretically conclude that one user posted 3comments is a medium active user. Moreover, we can see that there is a big gap betweenthe first 2 bars to the rest bars by the first histogram. The first 2 bar have y-axis valuehigher than 30000, diversely the y-axis value are lower than 30000 since the third bar.Hence, consider the above two reasons, we classify the low active users are those who hasappearance less the 3.
In case of medium active users, we classify them as the redditors whose appearance isbetween 3 to 6. That is because in the first histogram, the third bar to sixth bar have y-axisvalue between 7.500 to 30.000. Then, from the seventh bar, its y-axis value down to 5.500and below. Therefore, we consider that the high active users are those redditors whoseappearance is higher than 7. In addition, we can clearly say the above number thanks tothe Excel file which we mentioned in the previous section, that is a part of histogram wealso stored the result in an Excel file. The first 10 position in the attached Excel file isshown in the figure 3.12:
In fact, we also did just one histogram with the appearance between 0 to 5000, but thehistogram shows unclearly and tidy bars due to its big range. That is the reason we splitthe result into 5 histograms. With respect to the above histograms and the screen shot ofthe Excel file, we discussed how we classify the degree of active Reddit users with theirappearance.
3.4 Scheme
In fact, there exists many other approaches to perform this project. We have been talk-ing in all the above two section about using DataFrame from Python package Pandas, butactually we combined both of DataFrame and Counter to manage data.
Collections module is one of the Python standard library that emphasize on its highperformance container datatypes. This module implements specialized container datatypes
3The file is stored together with source code4The file is stored together with source code
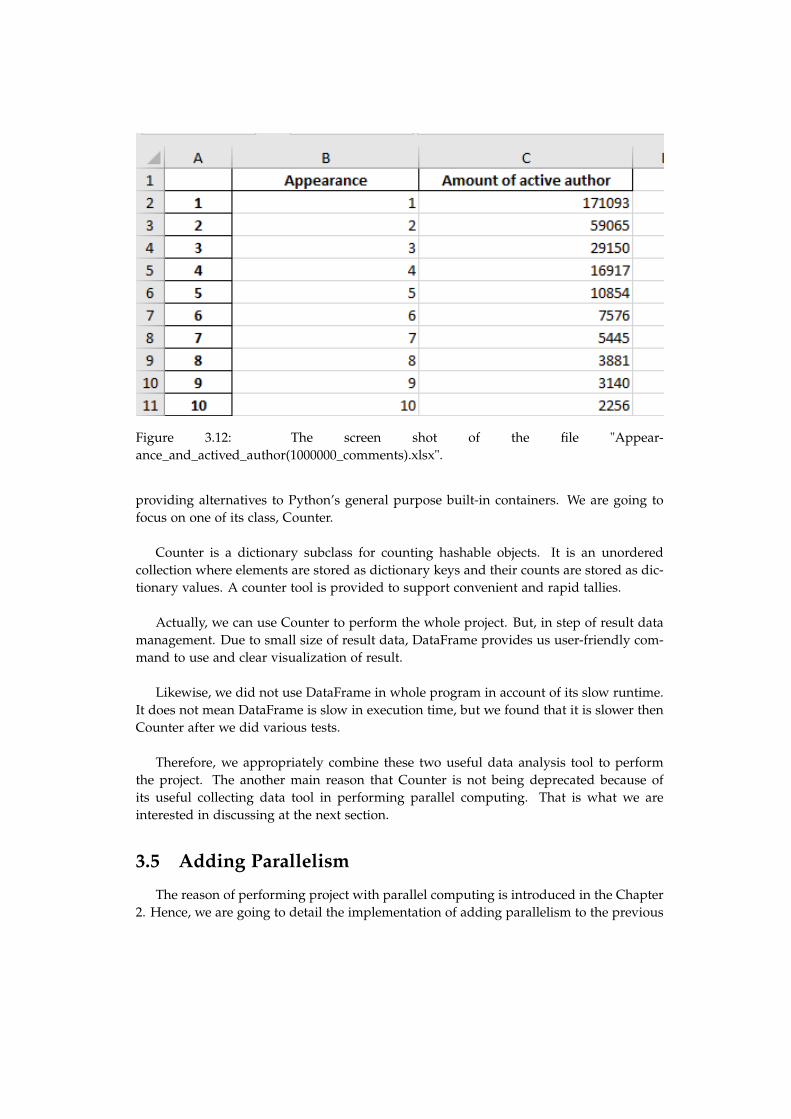
Figure 3.12: The screen shot of the file "Appear-ance_and_actived_author(1000000_comments).xlsx".
providing alternatives to Python’s general purpose built-in containers. We are going tofocus on one of its class, Counter.
Counter is a dictionary subclass for counting hashable objects. It is an unorderedcollection where elements are stored as dictionary keys and their counts are stored as dic-tionary values. A counter tool is provided to support convenient and rapid tallies.
Actually, we can use Counter to perform the whole project. But, in step of result datamanagement. Due to small size of result data, DataFrame provides us user-friendly com-mand to use and clear visualization of result.
Likewise, we did not use DataFrame in whole program in account of its slow runtime.It does not mean DataFrame is slow in execution time, but we found that it is slower thenCounter after we did various tests.
Therefore, we appropriately combine these two useful data analysis tool to performthe project. The another main reason that Counter is not being deprecated because ofits useful collecting data tool in performing parallel computing. That is what we areinterested in discussing at the next section.
3.5 Adding Parallelism
The reason of performing project with parallel computing is introduced in the Chapter2. Hence, we are going to detail the implementation of adding parallelism to the previous
programs.
3.5.1 Algorithm of behaviour analysis with parallel computing
Assume that the database file does not fit into memory. Therefore, the client (i.e. theprocedure) split the input data into uniform chunks of appropriate size. In this case,we set the size of each chunks as 20 entities, so 20 Reddit comments (The reason of 20is based on the section Results in the [6]). The whole implementation is available as aIPython notebook. We discuss here only those issues related to parallelization issues.
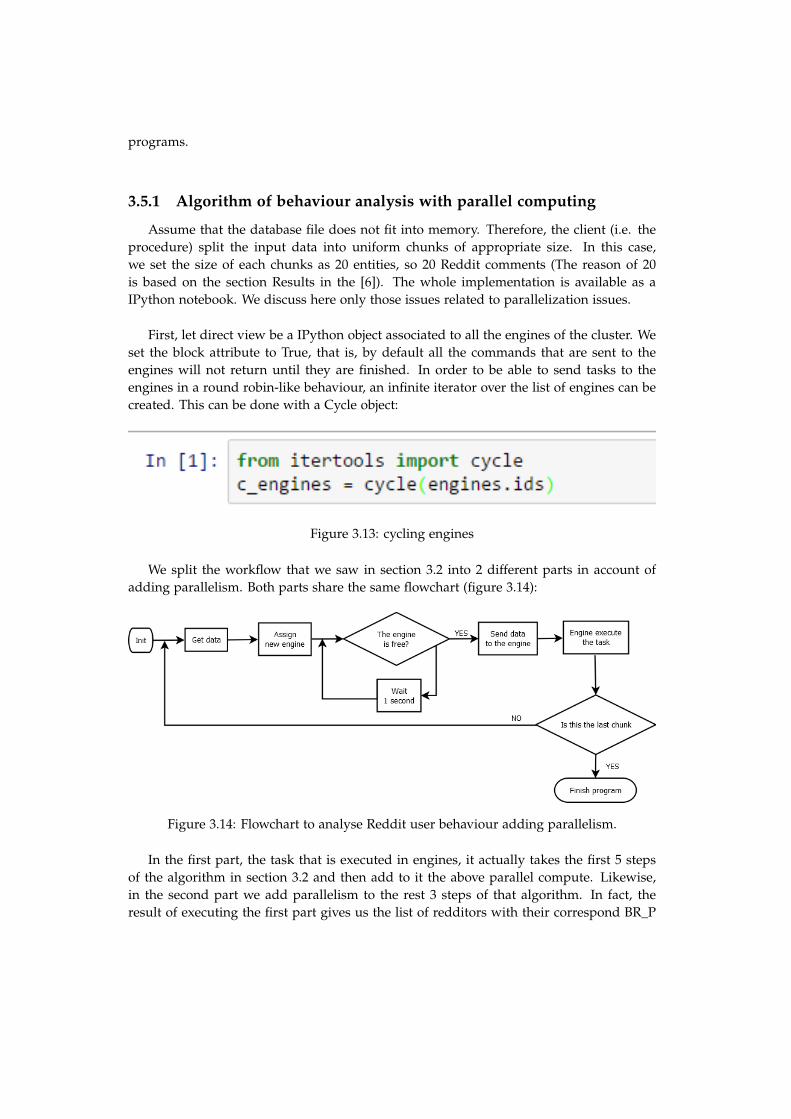
First, let direct view be a IPython object associated to all the engines of the cluster. Weset the block attribute to True, that is, by default all the commands that are sent to theengines will not return until they are finished. In order to be able to send tasks to theengines in a round robin-like behaviour, an infinite iterator over the list of engines can becreated. This can be done with a Cycle object:
Figure 3.13: cycling engines
We split the workflow that we saw in section 3.2 into 2 different parts in account ofadding parallelism. Both parts share the same flowchart (figure 3.14):
Figure 3.14: Flowchart to analyse Reddit user behaviour adding parallelism.
In the first part, the task that is executed in engines, it actually takes the first 5 stepsof the algorithm in section 3.2 and then add to it the above parallel compute. Likewise,in the second part we add parallelism to the rest 3 steps of that algorithm. In fact, theresult of executing the first part gives us the list of redditors with their correspond BR_P

value. The second part gives us the final result, that is the sorted list of redditors withtheir correspond BR_F. In the following, we explain each step of the above diagram.
1. We begin by sending to each engine all the necessary functions that are needed toprocess the data. Among these functions we just may mention 2 funtions. The firstone is the initialization function, which resets local engine’s variables. The secondone is the main function, which applies process a chunk of lines and groups resultsin a variable, which is local to each engine. After sending the necessary functions tothe engines we execute in each engine the initialization function, in order to initializethe local variables in each engine.The execution is performed in non-blocking mode. That is, the initialization functionis executed on each engine without waiting for the engine to finish. Thus, the loopcan be executed for each engine in parallel.
2. The client reads a chunk of the file and selects to which engine the chunk will besent. Each read chunk will have the same number of lines with the exception of thelast chunk read from the file, and thus the runtime in each engine we expect eachchunk to be processed is the same.
3. Once the chunk has been read and the engine that will process the chunk has beenselected we need to wait for the engine to finish its previous task. While the enginehas not finished, we wait for 1 second then check the state again. If still not, we waitfor 1 second, check and so on. We do it until the engine is free.
4. At this point we are sure that the current running engine is free. Thus, we may sendthe data to the engine and ask it to process it.
5. In this first part, the task we ask the engine to process is executing the main functionto calculate BR_P of each redditor. Then the main function locally aggregates theresult of analysing each chunk in that local variable. At the end the client willcollect the local results of all engines.
6. We now check if the chunk that the engine has just processed is the last chunk. Ifnot, the algorithm then jumps again to step 2. Otherwise, we go to the next stepwhich is the last step.
7. Once the loop (steps 2 to 5) has processed all the chunks in the file, the client getsthe results from each engine and aggregates them into a new variable which is thePython dictionary type. After reading all the results from the engines, the final resultis stored in the dictionary that we have just mentioned.
With the above algorithm, we get a dictionary of the execution results which its keysare list of redditors, the value of each key is again a dictionary. The item in the valuedictionary store the correspond BR_P and the information to calculate BR_P.
Now we need use again the above algorithm with some changes in the step 1 and 5in order to perform the second part of project which is to calculate BR_F value. That is,in step 1 instead of sending whole database to engine, we send the above dictionary of

results. Then, in step 5, we execute the function to assign the correspond weight to eachredditor by counting its appearance. Also we calculate the BR_F value in step 5 whilst thefirst part it calculates BR_P.
Once run twice the above algorithm, we get the result store in a dictionary whichcontain the redditors that insult in Reddit and its correspond "bad" rate BR_F. The laststep is to convert it into a DataFrame tabular and show the result. Moreover, we store itas an Excel file named "final_result_top_20.xlsx"5.
5The file is stored together with source code


Chapter 4
Result
The purpose of this chapter is to present the results of this project. It is divided in twosections: Behaviour analysis, Comparison of Parallelism and Non-Parallelism computing.Both of them detail the result of what we did in the previous chapter showing the graphiceither run chart, mutable file or Excel files.
4.1 Behaviour analysis
The result of our goal in this project is presented in this section. We show the resultin a DataFram tabular inside the IPython notebook, also we store it in an Excel file "Fi-nal_result_top_20.xlsx"1. This file stores the final result of behaviour analysis with parallelcomputing (see section 3.5), which is the 20 worst behaviour users in May of 2015. As it isthe result of our aim in this project, hence we show it in figure 4.1.
The first column of the result table (figure 4.1) shows the user name of these "bad"behaviour users.
The second column with the column name body represents the worst comment thatredditor posted in May of 2015. In other words, the comments which has higher value ofAB .
The column 3, 4, 5 contain the value of max( AB · 100), C
D · 100, EF · 100 respectively.
The column "Weight" describes the appearance or the active level of the correspondrow’s redditor. Remember that the high active users have the weight value 1. The normalactive users have the weight value 0.70 and the low active users 0.35.
The last column "BR_F" shows the BR_F value (the bad rate) of the redditor in the samerow level. The higher is the BR_F value, the worse is that redditor commented in May of2015.
Now, we focus on the first row, which contains the information of a comment writtenby the redditor with Reddit user name "i_blue_my_self". That comment is the worst com-ment "i_blue_my_self" has ever had, and it just has one word which is "Cock". Then, in the
1The file is stored together with source code
35

Figure 4.1: the 20 worst behaviour users.
column "(A/B)%", its value of max( AB · 100) equals 1, this means the worst comment that
redditor wrote has the whole comment of insult words. In fact, that is obvious becausethe worst comment is shown in the column "body". Then, in the column "(C/D)%", it hasvalue 1, hence all the words commented by that redditor are insult words. Now, it alsohas value 1 in the column "(E/F)%", this shows that every comment this redditor wrotein Reddit was insult comment. Looking at "Weight" column, its value is 0.70 so that thisauthor is a medium active Reddit user. Finally, this redditor gets 70 points for his BR_Fvalue which is the highest one comparing to other redditors. That is, this redditor is theworst behaviour user in Reddit evaluated by the BR_F value.
Moreover, we look at the second row which is the second highest BR_F value user. Thisuser has max( A
B · 100) equal to 1 which we can easily see in the column "body" . Then, itsCD · 100 has value 0.066116 so that he wrote few insult words in his comment. However,70% of his comments contain insult word, this is shown in the column "(E/F)%". Theweight value equals 1, it tells us this redditor is a high active redditor. Lastly, its BR_Fvalue is 60.1 which is calculated by the equation we saw in the chapter 3. Likewise, wecan intuitively explain all the information contained in the figure 4.1.
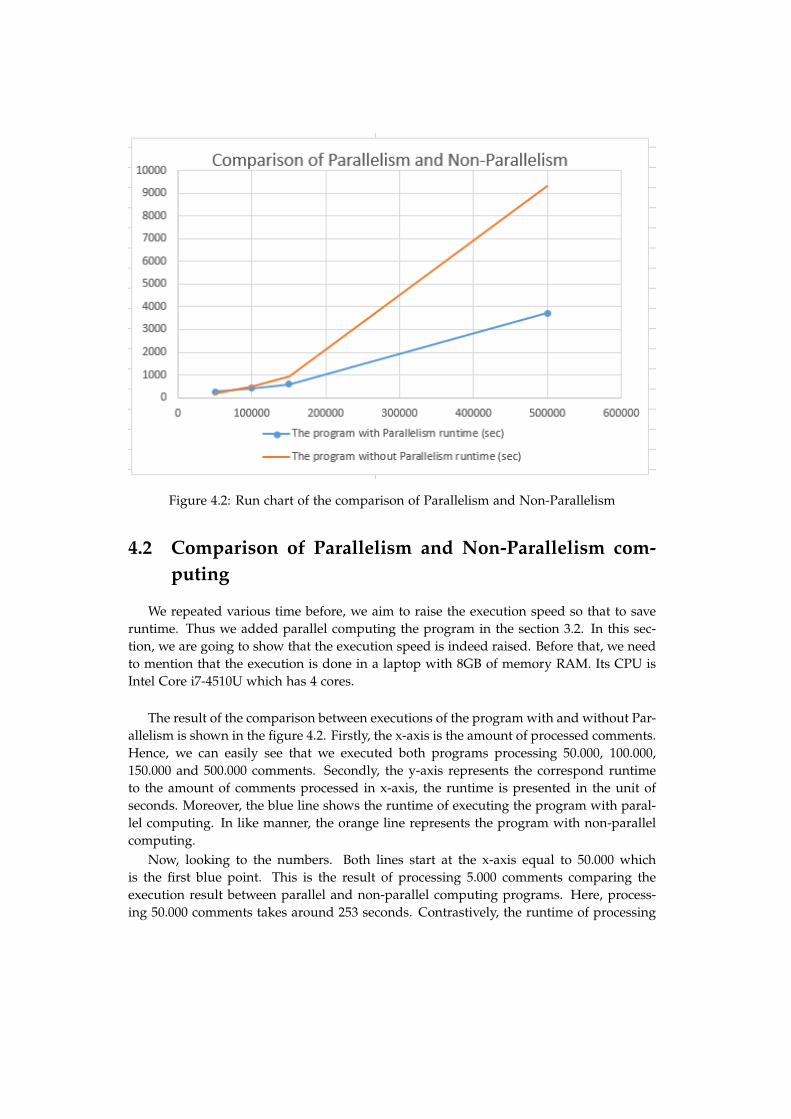
Figure 4.2: Run chart of the comparison of Parallelism and Non-Parallelism
4.2 Comparison of Parallelism and Non-Parallelism com-puting
We repeated various time before, we aim to raise the execution speed so that to saveruntime. Thus we added parallel computing the program in the section 3.2. In this sec-tion, we are going to show that the execution speed is indeed raised. Before that, we needto mention that the execution is done in a laptop with 8GB of memory RAM. Its CPU isIntel Core i7-4510U which has 4 cores.
The result of the comparison between executions of the program with and without Par-allelism is shown in the figure 4.2. Firstly, the x-axis is the amount of processed comments.Hence, we can easily see that we executed both programs processing 50.000, 100.000,150.000 and 500.000 comments. Secondly, the y-axis represents the correspond runtimeto the amount of comments processed in x-axis, the runtime is presented in the unit ofseconds. Moreover, the blue line shows the runtime of executing the program with paral-lel computing. In like manner, the orange line represents the program with non-parallelcomputing.
Now, looking to the numbers. Both lines start at the x-axis equal to 50.000 whichis the first blue point. This is the result of processing 5.000 comments comparing theexecution result between parallel and non-parallel computing programs. Here, process-ing 50.000 comments takes around 253 seconds. Contrastively, the runtime of processing
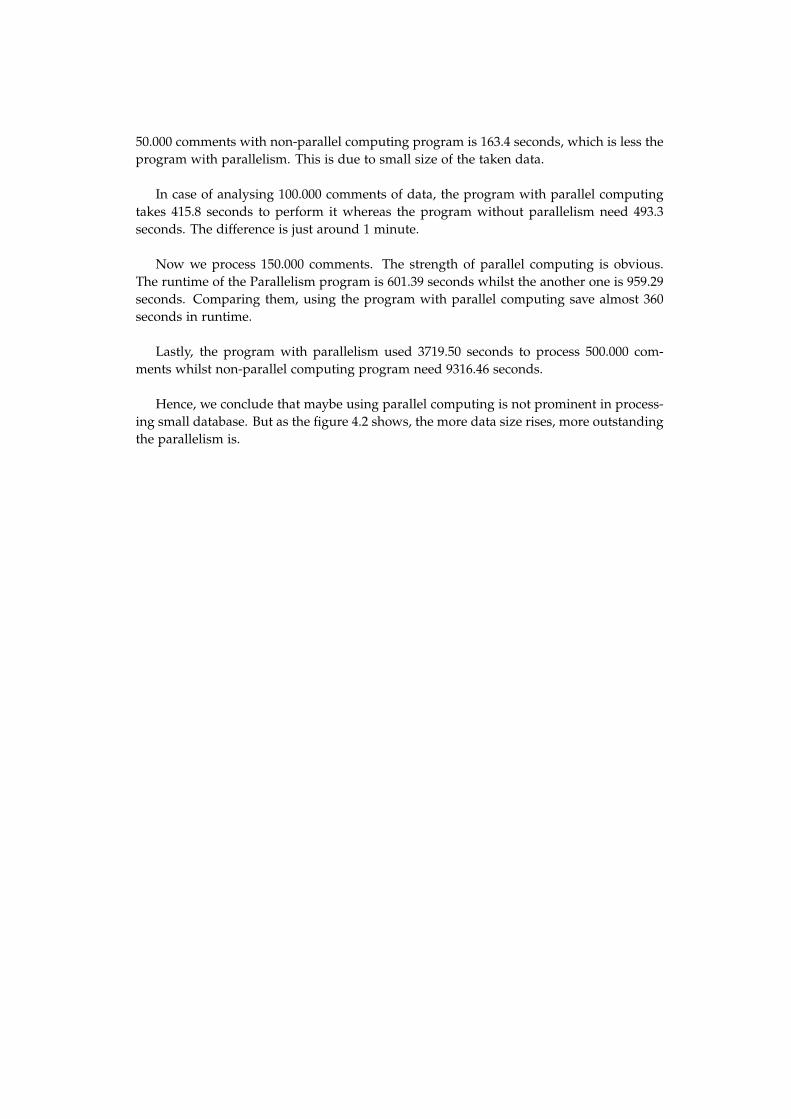
50.000 comments with non-parallel computing program is 163.4 seconds, which is less theprogram with parallelism. This is due to small size of the taken data.
In case of analysing 100.000 comments of data, the program with parallel computingtakes 415.8 seconds to perform it whereas the program without parallelism need 493.3seconds. The difference is just around 1 minute.
Now we process 150.000 comments. The strength of parallel computing is obvious.The runtime of the Parallelism program is 601.39 seconds whilst the another one is 959.29seconds. Comparing them, using the program with parallel computing save almost 360seconds in runtime.
Lastly, the program with parallelism used 3719.50 seconds to process 500.000 com-ments whilst non-parallel computing program need 9316.46 seconds.
Hence, we conclude that maybe using parallel computing is not prominent in process-ing small database. But as the figure 4.2 shows, the more data size rises, more outstandingthe parallelism is.
Chapter 5
Conclusion
This last chapter details the conclusions of this project and what further work we canpropose to do it.
5.1 Degree Final Project conclusion
Based on the results at the previous chapter, wo can conclude the project as the follow-ing aspects.
We recall the main goal of this project is to analyse a database and find out the worstbehaviour Reddit users. However, we did extract data from database; use the algorithmto analyse users’ behaviour; calculate the BR_F value to every user who at least has in-sulted once in Reddit. With all of these mentioned steps we did, we get a list of redditorswith high value of BR_F. Thus, these redditors are supposed to be bad behaviour users.Nonetheless, that does not mean the rest of redditor are good users. Because, this projectworks to calclute BR_F which is to combine some factors in order to evaluate users’ be-haviour as bad user. These factors are the user’s worst comment, the amount of insultwords commented, the user’s appeareance. Therefore, we did not take in account of anal-yse other factors to differentiate a redditor as a "good" Reddit user or "bad" Reddit user.
Regarding to multicore parallel computing, comparing to the whole Reddit databaseor other business database, our database is small. But they usually use a supercomputerto manage the database, we use a laptop with just quad-core processor so that it is stillbig database. Many problems we have encountered during this project came from paral-lelism part. One of these problems was, the program worked well until we add multicoreparallel computing. That was actually we did not send data to engine well, or during theprocessing of data we did not collect data well. But, even finding all these problems wasso hard due to the interacting of the scheduler and engines is hide from users. Hence,solving problems was also hard, but performing project with parallel computing is stillfascinated part. In addition, the previous chapter shows the improvement of runtime by
39

using parallel computing will be huge as we increase the database’s size.
Lastly, we processed just the first 1.000.000 entities whilst the number of total entities is54.504.410 in the database. Despite the working laptop has a quad-core processor and weprocess data with parallel computing, but it still takes almost 5 hours and half to processjust 1.000.000 entities, which is less the 1
5 of the total amount of entities. Regarding to theabove reason, we tested the functionality of the algorithm with just a piece of database.Nevertheless, the algorithm we discussed in the previous section is not going to be affectedby increasing database’s size. The only difference is that to process whole database takeslonger time to archive the goal. However, the final result would be changed if we processwhole database. Thus, we consider that the main goal of project is fulfilled.
5.2 Feedback relevance
In order to perform this project, there are many other approaches. The algorithm wehave seen in the section (3.2) is just one of the possible approaches. For example, the cri-terion we used to calculate BR_P and BR_F. If we modify a little bit of the weight values,the result is totally going to be changed. Actually, these weight values really depend onwhat users think. Remember the original equation for BR_P calculation is below:
BR_P = max( AB )·100·30%+ C
D ·100·30%+ EF ·100·40%
(5.1)
If we change the weight value as follows:
BR_P = max( AB )·100·45%+ C
D ·100·30%+ EF ·100·25%
(5.2)
Then, this second equation tells us that the user emphasizes more the worst commentthe redditor posted. In the meantime, the degree of active of each user is going to be lessemphasized. In other words, we mind less how the redditor usually comments, we aregoing to evaluate the worst comment he has ever done in order to give that redditor veryhigh bad rate value.
Likewise, in case of calculating BR_F. If we do no mind the degree of active user, thatis we do not classify redditors into different class. Then, the weight value is always equalto 1. Thus, BR_F= BR_P. Also, the BR_F value is going to change if we modify the weightvalue of each class of redditors.

Thus, with respect to the above point, it leads us to propose a possible future work,which is adding feedback relevance to the project.
Relevance feedback is a feature of some information retrieval systems. The idea behindrelevance feedback is to take the results that are initially returned from a given query andto use information about whether or not those results are relevant to perform a new query.
We can apply feedback relevance concept as follows. After we show the result to theuser which is a list of 20 worst behaviour redditors with the correspond "bad" comment.We could ask user to compare the comment of these 20 redittors and reorder the list. Aswe mentioned in the previous section, if the result changed that means the weight valuesis modified. Hence, we can use the new list to calculate what the current weight valuesare. Thus, we could intuitively know that whether the user emphasize more on the reddi-tor’s worst comment or the overall of its comments.
In fact, feedback relevance, this such charming feature was considered to be performedin this work. But due to various circumstance, I was not able to use it. However, it couldbe an appropriate future work to improve the project.

Appendix A
Prerequisite for program execution
Before executing the program, we need to do the following necessaries procedures.
We need firstly to describe the files contained in the src folder. Inside this folder, it hastwo Excel files, two IPython notebook files with the extension ".ipynb", one text file(".txt")and one Python file(".py"). Here, we focus on one of these IPython notebook files whichcontains the program code that we are going to execute. It is "TFG_Detecting_insults_words.ipynb".
The first step we need to do is to start the cluster which we have already seen the detailsin the section 2.2.4. Then, from the notebook interface we open the file "TFG_Detecting_insults_words.ipynb".The opened file will have various cells. We need to execute each cell with top-down ap-proach by press "ctrl" and "enter" keys.
Before we execute the next cell, we need to wait the current cell finishes its execution.
After we execute all the cells in the notebook, the result will be shown as a DataFrametabular inside the notebook. Also, it will be stored in one of the two Excel files we men-tioned before which is "Final_result_top_20.xlsx".
43

Bibliography
[1] Big data. Documentation retrieved from Wikipedia https://en.wikipedia.org/
wiki/Big_data [Online;].
[2] Ipython. Documentation retrieved from Wikipedia https://en.wikipedia.org/
wiki/IPython#Parallel_computing [Online;].
[3] kaggle insults. The modified file which the original file is retrieved from GitHubhttps://github.com/amueller/kaggle_insults/ [Online;].
[4] Reddit. Documentation retrieved from Wikipedia https://en.wikipedia.org/wiki/
Reddit [Online;].
[5] Using ipython for parallel computing. Documentation retrieved from IPython Doc-umentaion https://ipython.org/ipython-doc/3/parallel/parallel_intro.html
[Online;].
[6] L. Garrido F. Danti. "parallel computing" book chapter. Department of Mathematicsand Computer Science. 2016.
[7] Sean McClure. Data science and big data:two very different beasts. http://www.
kdnuggets.com/2015/07/data-science-big-data-different-beasts.html. [On-line;].
[8] Gregory Piatetsky. Four main languages for analytics, data mining, data sci-ence. 2014. Documentation retrieved from http://www.kdnuggets.com/2014/08/
four-main-languages-analytics-data-mining-data-science.html [Online;].
[9] Martijn Theuwissen. R vs python for data science: The winner is... Documentationretrieved from http://www.kdnuggets.com/2015/05/r-vs-python-data-science.
html [Online;].
45