Embed Size (px)
Citation preview

Research ArticleUseful Piezoelectric Sensor to Detect False Liquor in Samples withDifferent Degrees of Adulteration
Luis Armando Carvajal Ahumada ,1,2 Andrés Felipe Sandoval Cruz ,1
Mario Alejandro García Fox,1 and Oscar Leonardo Herrera Sandoval1
1Facultad de Ingeniería y Ciencias Básicas, Universidad Central, Bogotá 110311, Colombia2Servicio Nacional de Aprendizaje (SENA), TecnoParque nodo Bogotá, Bogotá, Colombia
Correspondence should be addressed to Luis Armando Carvajal Ahumada; [email protected]
Received 12 March 2018; Revised 10 May 2018; Accepted 15 May 2018; Published 9 July 2018
Academic Editor: Alfonso Salinas-Castillo
Copyright © 2018 Luis Armando Carvajal Ahumada et al. This is an open access article distributed under the Creative CommonsAttribution License, which permits unrestricted use, distribution, and reproduction in any medium, provided the original work isproperly cited.
The main objective of this article is to demonstrate by experimental measurements the capability of the quartz crystal resonator(QCR) to characterize samples of liquor at different concentrations of adulteration with methanol, classify them according totheir viscosity, and identify how to use this capability as a potential detection of fake liquor. According to the literature, the fakeliquor is a common problem detected in several countries across the globe. The current strategy to detect the fake liquor is basedon a piezoelectric biosensor that permits the classification of the samples according to its viscosity. The viscosity is a usefulvariable to determinate the degree of adulteration in the liquor samples because the viscosity value between ethanol (straightliquor) and methanol (most common fake liquor) is very different.
1. Introduction
The adulterated alcohol or “fake alcohol” is a commonproblem detected in some countries. For instance, in theUK, the illegal alcohol is distilled and sent without alicense, and its sale costs the UK around £1.2 billion peryear [1]. In Greece, the improvised production of beveragesnamed “meth” exists, done in illegal laboratories in anempirical way. The production commonly includes illegalalcohol with high concentration of methyl alcohol [2]. InIndia, there is a similar situation related to the illicit liquor.In these cases, one dangerous adulterant is industrial meth-ylated spirit, which causes mass poisoning of consumers[3]. Moreover, in Czech Republic, the Czech food safetyauthority informed the public of persons suffering frommethanol poisoning after having consumed “on tap” spirits.The product was unlabeled and supplied “in bulk” in plasticbarrels [4].
In particular, the Colombian case is not an exception.Studies performed by Colombian entities such as ExternadoUniversity and the National Association of Industrialists
(ANDI) reveal that the adulteration and falsification oflocals have reached at 21% of the total offer. JaverianaUniversity in another study concluded that one of eachfour bottles of liquors sold in Colombia has been falsifiedor adulterated. Moreover, Antioquia University fromColombia performed a study in which they observed thatclose to 50% of the liqueurs which are marketed in theDepartment of Antioquia, Colombia, are illegal, adulterated,or contraband [5].
In most cases, the commercial liquor is adulterated usingmethanol [1, 3–5], due to its low cost, and some physicalcharacteristics are similar to those of the ethanol. Methanol(CH3OH) is an alcohol that is aliphatic, liquid, colorless,and volatile to room temperature. By itself, it is harmless,but its metabolites are extremely toxic. The methanol inindustrial products, laboratories, and household products iscommonly used. However, there is also a clandestine use likesubstituting of ethanol in alcoholic drinks. Although theintoxication may occur through the respiratory system ortransdermally, in most cases, the exposition to methanol isthrough the oral way [6].
HindawiJournal of SensorsVolume 2018, Article ID 6924094, 7 pageshttps://doi.org/10.1155/2018/6924094
According to the “Report of the event notification foracute poisoning by chemical substances up to the epide-miological period XI” in 2010, out of a total of 23,844reported intoxications, there were a total of 282 cases ofmethanol intoxication and 10 deaths, with a percentageof 1.18% and an incidence of 0.62 per one hundredthousand inhabitants. During 2011, 351 cases of methanolintoxication and 7 deaths were reported. Moreover, thereis a high notification of consumption in the age rangingbetween 10 and 24 years [7]. A report of FND (NationalFederation of Departments) reveals that, of the percentageof illegal liquor (24%), the 70% correspond to adulterateddrinks [4].
Although some cases of intoxication by methanol are dueto suicide attempts, many times, the intoxication is caused byadulterated alcohol, which generally is distributed in bottleswith labels very similar to those of the original drink butwith methanol mixed to the original liquor. Therefore, theadulterated drink is not detectable to naked eye [2].
The symptoms, depending on the affected system, wheningesting adulterated alcohol are [8]
(i) nausea, vomiting, abdominal pain, and later-caseaffections in the pancreas (gastrointestinal system),
(ii) associated manifestations of neurologic type, whichin cases of lack of treatment or late detection endin a coma state (central nervous system),
(iii) decreased visual acuity until irreversible blindnessdue to atrophy of the optic nerve, indicating ocularinvolvement and representing an advanced develop-ment of the intoxication.
According to the descriptive study of methanol intoxica-tions reported in SIVIGILA 2010-2011 in Colombia [9],when the methanol is absorbed, it undergoes oxidation pro-cesses in the organ receptor which is the liver. The enzymeresponsible for this transformation is the alcohol dehydroge-nase, which oxidizes it to formaldehyde, and this in turn isoxidized to formic acid (responsible for blindness) by thealdehyde dehydrogenase. The treatment generally used totreat adulterated alcohol intoxication is based on the use ofethyl alcohol to prevent the formation of toxic methanolmetabolites [9].
In accordance with the problematic presentation, severaltechniques have been developed with the aim of detecting theadulterated liquor. The more typical laboratory techniquesare the nuclear magnetic resonance spectroscopy with multi-variate analysis [4] and near-infrared spectrometry (NIR)[10]. However, these techniques do not have possibilities tobe used outside of the laboratory.
In Colombia, different strategies have been generated todetect the illegal liquor, divided into contraband and fakeliquor cases; several years ago, for the detection of adulteratedliquor, the monitoring and control program of alcoholicbeverages was implemented, led by the ANDI (NationalAssociation of Industrialists) and the Ministry of Healthand Social Protection with the participation of the nationalpolice, making presence in factories, warehouses, and liquor
stores. For factories and warehouses, there are four visitsper year, and for liquor stores, there are three visits. In thesevisits, the authorities make sure for sanitary conditions of theplaces and take random samples of a suspect batch of liquor,where these samples cannot be less than 1 liter or a bottlegenerally 750 cc. The first step in this process is to checkthe security seals and the label, the second step is to lookfor suspended solids inside the bottle, and the last step is tocarry the sample to the corresponding authority lab andmake physiochemical tests [5].
In this work, the use of a sensor based on a quartz crystalresonator in order to identify adulterated liquor in a simpleand low cost-way is proposed. This sensor is capable ofoperating as a microviscometer knowing the density of theliquid to be analyzed [11–15]. Samples at different “levels ofadulteration” have been used to get results that confirmthe difference between an original alcoholic drink andadulterated one with methanol in different concentrations.
2. Theory
The piezoelectric sensors are considered highly efficientsensing systems not only because of their low manufacturingcost but also because of their high accuracy, biofunctionaliza-tion capacity, sensitivity, and reliability in measuring thedeposited sample, either gaseous or liquid media [11].
In particular, the quartz crystal resonator (QCR) is apiezoelectric transducer sensitive to the deposition of rigidmass or liquids in contact with its surface (active electrode).The QCR is composed of two electrodes that are stimulatedwith AC voltage, and in consequence, the crystal vibrates.The crystal has a natural frequency of resonance thatdepends on its geometry and thickness; as a result, whenthe crystal is stimulated with a signal whose frequency is closeto its natural resonance, the vibration increases. Thisphenomenon is visible by analyzing the behavior of theadmittance or impedance of the crystal in the frequencydomain [11, 16, 17].
When the mass or liquid sample is deposited on the crys-tal surface, its resonance frequency changes in accordancewith two equations: Sauerbrey for mass deposition (1) andKanazawa for fluid deposition (2).
Δf = −2f02
A ρqGqΔm, 1
Δf = − nf03/2 ρLηL
πρqGq, 2
where ρq and Gq are the specific density and the shearmodulus of quartz, respectively; f0 is the fundamental res-onance frequency of the quartz, related to its thickness,and Δm is the thin film of mass deposited; A is the piezo-electrically active crystal area; ρL and ηL are the densityand viscosity of the fluid, respectively; and n is the over-tone number [11].
2 Journal of Sensors

In addition to Sauerbrey and Kanazawa equations, thequartz crystal behavior can be modeled as an electricalresonator circuit [11, 16, 17].
The electric model (BVD), shown in Figure 1, explainsthis phenomenon as an addition of impedance dependingon the type of sample. For liquids in contact with the crystal,the equivalent impedance is an inductance and a resistancewhich are in series.
The value of this impedance is related to the characteris-tics of the samples according to the following equations:
Cq =8e262A
Nπ 2C66hq,
Lq =1
ωs2Cq
,
Rq =ηq
C66Cq,
Lw =ωsLqNπ
2ρLηLωsC66ρq
,
Rw =ωsLqNπ
2ωsρLηLC66 ρq
,
C0 =ε22 Ae
hq,
3
where C66 is the piezoelectrically stiffened elastic constant forloss-less quartz (2947× 1010N/m2), e26 is the piezoelectricstress constant for quartz (953× 103A·s/m2), ε22 is the quartzpermittivity (3.982× 10⁻¹¹A2·s4/kg·m−3), A is the active elec-trode area (m2), hq is the quartz crystal thickness (m), ηqis the effective viscosity of quartz (3.5× 10⁻⁴ kg/m·s), andωs is the series resonance frequency (2πFs). For theliquid, ρL and ηL are the density of the liquid sample(kg/m3) and the viscosity of the liquid sample (kg/m·s),respectively [17].
Figure 2 shows the conductance behavior (Geq) for theunperturbed crystal (kept in air) and the crystal in contactwith liquid. The maximum value of conductance takes placein the frequency of resonance.
According to theoretical models, when the crystal elec-trode is in contact with liquid samples, the conductancecurve changes, moving to the left in the axis of frequency,increasing its bandwidth and decreasing its conductancemagnitude (Figure 2).
The values of ΔF and ΔΓ represent the changes in thebehavior of the crystal due to the properties of the sample,and these are obtained using
ΔF = Fs′ − Fs,
ΔΓ = Γ′ − Γ,
ΔRs =Rs′Rs
4
3. Materials and Methods
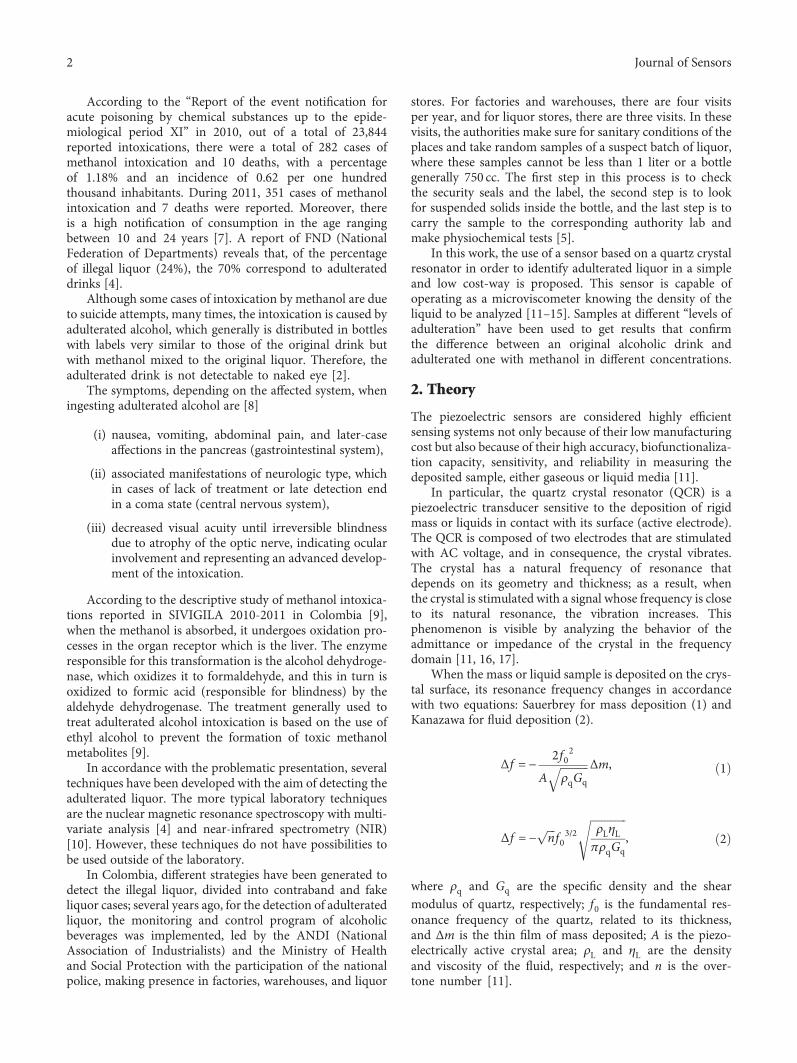
3.1. Samples. The experiments were done with seven adulter-ated samples and three references; the commercial liquor(Ron) was purchased in a local market. It has 35% v/v ofalcohol concentration and was used as one of the threereferences for the quartz crystal resonator (QCR) system.The other two references were ethanol (99.8% w/w, Merck)and methanol (99.8% w/w, Merck). The commercial liquorwas adulterated in the Central University laboratory, but itsalcohol concentration was kept, by addition of deionizedwater and methanol in levels of 10%, 25%, 35%, 50%, 55%,65%, and 75% v/v to the pure commercial liquor (Figure 3).
Only 50μL of volume of the sample was deposited in auniform layer on the surface of the electrode of quartz crystal
Lq RqCq
C0
Lw Rw
Mechanical
Electrical
Figure 1: Basic electrical model (BVD) for QCM with liquid sample deposited.
89.683.276.870.4
6457.651.244.838.4
3225.619.212.8
6.40
9.9799
Unperturbed crystalLoaded crystal
9.982Frequency (Hz)
Con
duct
ance
(mS)
9.984Fs
Rs
Rs′
Fs′ ×106
Γ + ΔΓ
𝛤
Figure 2: Conductance behavior for a QCM with and without thesample [12].
3Journal of Sensors
to be analyzed. The deposition has been achieved using amicrofluidic system.
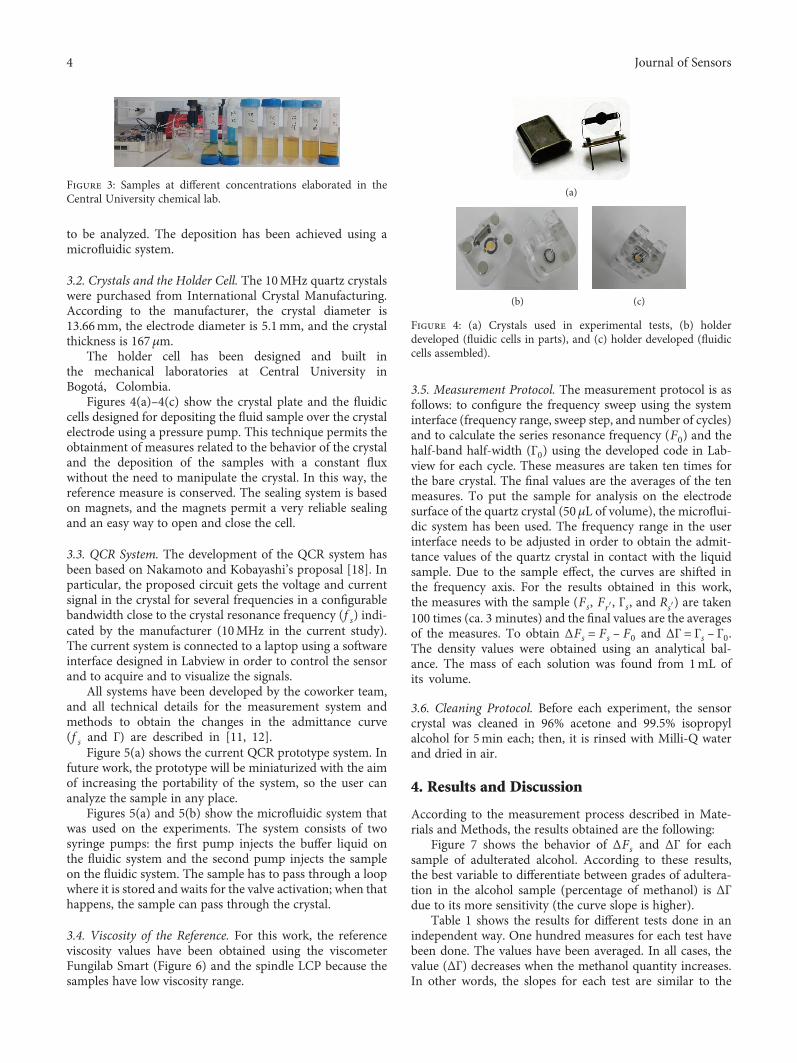
3.2. Crystals and the Holder Cell. The 10MHz quartz crystalswere purchased from International Crystal Manufacturing.According to the manufacturer, the crystal diameter is13.66mm, the electrode diameter is 5.1mm, and the crystalthickness is 167μm.
The holder cell has been designed and built inthe mechanical laboratories at Central University inBogotá, Colombia.
Figures 4(a)–4(c) show the crystal plate and the fluidiccells designed for depositing the fluid sample over the crystalelectrode using a pressure pump. This technique permits theobtainment of measures related to the behavior of the crystaland the deposition of the samples with a constant fluxwithout the need to manipulate the crystal. In this way, thereference measure is conserved. The sealing system is basedon magnets, and the magnets permit a very reliable sealingand an easy way to open and close the cell.
3.3. QCR System. The development of the QCR system hasbeen based on Nakamoto and Kobayashi’s proposal [18]. Inparticular, the proposed circuit gets the voltage and currentsignal in the crystal for several frequencies in a configurablebandwidth close to the crystal resonance frequency (f s) indi-cated by the manufacturer (10MHz in the current study).The current system is connected to a laptop using a softwareinterface designed in Labview in order to control the sensorand to acquire and to visualize the signals.
All systems have been developed by the coworker team,and all technical details for the measurement system andmethods to obtain the changes in the admittance curve(f s and Γ) are described in [11, 12].
Figure 5(a) shows the current QCR prototype system. Infuture work, the prototype will be miniaturized with the aimof increasing the portability of the system, so the user cananalyze the sample in any place.
Figures 5(a) and 5(b) show the microfluidic system thatwas used on the experiments. The system consists of twosyringe pumps: the first pump injects the buffer liquid onthe fluidic system and the second pump injects the sampleon the fluidic system. The sample has to pass through a loopwhere it is stored and waits for the valve activation; when thathappens, the sample can pass through the crystal.
3.4. Viscosity of the Reference. For this work, the referenceviscosity values have been obtained using the viscometerFungilab Smart (Figure 6) and the spindle LCP because thesamples have low viscosity range.
3.5. Measurement Protocol. The measurement protocol is asfollows: to configure the frequency sweep using the systeminterface (frequency range, sweep step, and number of cycles)and to calculate the series resonance frequency (F0) and thehalf-band half-width (Γ0) using the developed code in Lab-view for each cycle. These measures are taken ten times forthe bare crystal. The final values are the averages of the tenmeasures. To put the sample for analysis on the electrodesurface of the quartz crystal (50μL of volume), the microflui-dic system has been used. The frequency range in the userinterface needs to be adjusted in order to obtain the admit-tance values of the quartz crystal in contact with the liquidsample. Due to the sample effect, the curves are shifted inthe frequency axis. For the results obtained in this work,the measures with the sample (Fs, Fr′, Γs, and Rs′) are taken100 times (ca. 3 minutes) and the final values are the averagesof the measures. To obtain ΔFs = Fs – F0 and ΔΓ = Γs – Γ0.The density values were obtained using an analytical bal-ance. The mass of each solution was found from 1mL ofits volume.
3.6. Cleaning Protocol. Before each experiment, the sensorcrystal was cleaned in 96% acetone and 99.5% isopropylalcohol for 5min each; then, it is rinsed with Milli-Q waterand dried in air.
4. Results and Discussion
According to the measurement process described in Mate-rials and Methods, the results obtained are the following:
Figure 7 shows the behavior of ΔFs and ΔΓ for eachsample of adulterated alcohol. According to these results,the best variable to differentiate between grades of adultera-tion in the alcohol sample (percentage of methanol) is ΔΓdue to its more sensitivity (the curve slope is higher).
Table 1 shows the results for different tests done in anindependent way. One hundred measures for each test havebeen done. The values have been averaged. In all cases, thevalue (ΔΓ) decreases when the methanol quantity increases.In other words, the slopes for each test are similar to the
Figure 3: Samples at different concentrations elaborated in theCentral University chemical lab.
(a)
(b) (c)
Figure 4: (a) Crystals used in experimental tests, (b) holderdeveloped (fluidic cells in parts), and (c) holder developed (fluidiccells assembled).
4 Journal of Sensors

trend (negative slope), which indicates that the results arecoherent and reproducible and they have a good level ofprecision. According to these results, SD is less than 10%in all cases.
Figure 8 shows the resultant curve based on the averageof the tests. Error bars are calculated using the standarddeviation of data tests for each mixture. According to thisfigure, the prototype proposed can be used to determinatethe degree of adulteration of each sample in a wide range.The reason for this capability is that the piezoelectric sensors(QCR) have high sensibility for viscosity changes. In particu-lar, the adulteration process adds methanol to the liquormixture generating a decrease in the viscosity of the liquorin relation to a legal liquor (negative slope in Figure 9). Thisdecrease in the viscosity value (Figure 9, gray line) is relatedto the resonance of the quartz crystal; in this way, reading
the frequency of resonance of the quartz crystal is possible,associating the change of this frequency with the change ofthe viscosity of the mixture.
According to Figure 9, the values obtained for all samplesusing the QCR sensor have been compared with those usingthe commercial equipment “viscometer Fungilab Smart”available in the material laboratory at Central University.Figure 9 permits the observation of the similar behaviorbetween the results obtained with a commercial viscometerand the values obtained in the tests using the QCR sensor.The viscosity values have been found using (2) with the datashown in Figure 9. The density values were obtained using ananalytical balance. The mass of each solution was determinedfrom 1mL of its volume.
In Figure 10, the red circle zone indicates that the QCRresponse is better than that of the viscometer because theFungilab measures are very close in this range (25%–50% ofadulterated mixture).
In accordance with the previous results, the prototypegenerates a very close response in comparison with the com-mercial equipment. In consequence, the data obtained arereliable. As an additional attribute, the quantity of the sample
(a)
Pump 1 NE-1000
Pump 2 NE-1000
Loop of sample
Valve
Crystal holder
(b)
Figure 5: (a) QCR measurement system with the microfluidic system and holder cell and (b) schematic of the microfluidic system.
Figure 6: Viscometer for the reference (Fungilab Smart).
y = 468.51x − 972.13
y = −1015.8x + 1374.6
−1500
−1000
−500
0
500
1000
1500
2000
0% 20% 40% 60% 80%Freq
uenc
y (H
z)
Percentage of methanol
ΔF (Hz)ΔΓ (Hz)
Lineal (ΔF (Hz))Lineal (ΔΓ (Hz))
Figure 7: Changes in frequency for Fs and Γ variables foreach sample.
5Journal of Sensors

used in the comparison between the prototype QCR and thecommercial equipment is tens of microliters and tens of mil-liliters, respectively. In consequence, the prototype proposedis more efficient about the quantities of the samples used.
5. Conclusions
In the present work, the effectiveness of a low-cost piezoelec-tric sensor to detect fake liquor has been demonstratedthrough simple experiments. The capability of the quartzresonator to identify changes in the viscosity of liquid sam-ples through an electronic transduction and characterization
of its admittance response allows us to carry out the pres-ent study to detect in a clear way the changes in concen-tration of methanol in a common alcoholic drink like Ron.In consequence, this device could allow the identificationof adulterated alcohol with a small amount of sample (tensof microliters).
In a future phase, the device will be optimized in size, itsportability will be improved, and it will be connected to asmartphone. In addition, more tests with real adulteratedliquor should be conducted with the aim of verifying thepresence of minimum concentrations of methanol. The realadulterated liquor samples could be obtained through anagreement with the Colombian police.
Table 1: Results of ΔΓ for four independent tests (average± SD). Each test contains one hundred measures.
Methanol (%)Test 1 ΔΓ (Hz) Test 2 ΔΓ (Hz) Test 3 ΔΓ (Hz) Test 4 ΔΓ (Hz)
Average SD Average SD Average SD Average SD
0% 1374.6 27.87 1462.3 31.71 1364.6 29.51 1260.9 26.56
10% 1273.0 30.60 1368.7 33.95 1284.8 20.82 1187.3 18.06
25% 1120.7 15.72 1228.3 32.55 1165.1 104.91 1076.9 15.96
35% 1019.1 33.00 1134.8 24.98 1085.3 54.89 1003.3 34.06
50% 866.7 69.61 994.4 40.35 965.7 19.91 892.9 21.23
55% 815.9 12.94 947.6 21.22 925.8 15.86 856.1 19.26
65% 714.3 20.50 854.0 18.65 846.0 46.25 782.4 16.47
75% 612.8 10.10 760.4 14.45 766.2 21.06 708.8 41.42
0.00
200.00
400.00
600.00
800.00
1000.00
1200.00
1400.00
1600.00
0% 20% 40% 60% 80%
Freq
uenc
y (H
z)
Percentage of methanol
Figure 8: Average values of bandwidth shift for different independent tests.
1.92.12.32.52.72.93.1
0% 10% 20% 30% 40% 50% 60% 70% 80%
Visc
osity
(mPa
. s)
Percentage of methanol
(Fungilab Smart) 100 RPM(Fungilab Smart) 60 RPMQCM
Figure 9: Comparison between the sensor QCR and FungilabSmart.
(Cell range)(Cell range)
(Cell range)(Cell range)(Cell range)
(Cell range)(Cell range)
(Cell range)
2.002.102.202.302.402.502.602.702.80
2 2.2 2.4 2.6 2.8 3
QCR
(mPa
.s)
Fungilab 60 RPM (mPa.s)
QCR
Adulterationincreases
Figure 10: Comparison between the sensor QCR and FungilabSmart.
6 Journal of Sensors

Data Availability
Data used to support the findings of this study were suppliedby Luis Carvajal under license and so cannot be made freelyavailable. Requests for access to these data should be madeto Luis Carvajal ([email protected]).
Conflicts of Interest
The authors declare that there is no conflict of interestregarding the publication of this paper.
Acknowledgments
The current investigation work has been supported byCOLCIENCIAS through Grant no. 0375–2013 with pro-ject number 6570577636375 and by Universidad Central(Bogotá, Colombia) through the Research Cluster onConverging Sciences and Technologies (NBIC).
References
[1] T. Robert, Combatting Fake, Counterfeit, and ContrabandAlcohol Challenges in the United Kingdom through the AlcoholWholesaler Registration Scheme (AWRS), Federal Regulatoryand Compliance Consultant Falls Church, Virginia, 2017.
[2] A. Tsiboukli, “Greek crisis: impact on drug treatment services,research and population,” Nordic Studies on Alcohol andDrugs, vol. 32, no. 3, pp. 333–337, 2015.
[3] L. Riley, M. Marshall, World Health Organization, andDept. of Substance Abuse, Alcohol and Public Health in 8Developing Countries, World Health Organization, Geneva,Switzerland, 1999.
[4] D. W. Lachenmeier, Advances in the Detection of theAdulteration of Alcoholic Beverages Including UnrecordedAlcohol, Elsevier Ltd, 2016.
[5] J. Zapata, A. Sabogal, A. C. Montes, G. Rodriguez, andJ. Castillo, Una Estimación de la Adulteración y la Falsifica-ción de Bebidas Alcohólicas en Colombia, Fedesarrollo, 2012.
[6] J. L. Castellanos, A. B. Limón, A. R. Hernández, and D. E. F.Rojas, “Intoxicación por metanol, reporte de un Caso,” Archi-vos de Medicina de Urgencia de México, vol. 1, pp. 67–73, 2009.
[7] Departamento Nacional de Planeación - DNP, “Estrategiapara la Implementación del Sistema Unico Nacional de Infor-mación y Rastreo -SUNIR (Documento Conpes),” ConsejoNacional de Política Económica y Social República de Colom-bia, p. 33, 2009.
[8] Methanol Institute, “Methanol FACTS: adulterated alco-hol poisoning: issue summary,” 2016, http://www.methanol.org/wp-content/uploads/2016/06/Adulterated-Alcohol-Issue-Summary-20160322-EN-vfinal.pdf.
[9] D. Niño and J. Velandia, Estudio Descriptivo De Las Intoxica-ciones Por Metanol Reportadas En Sivigila 2010-2011 EnColombia, Universidad de Ciencias Aplicadas y Ambientales(UDCA), 2014.
[10] M. J. C. Pontes, S. R. B. Santos, M. C. U. Araújo et al., “Classi-fication of distilled alcoholic beverages and verification ofadulteration by near infrared spectrometry,” Food ResearchInternational, vol. 39, no. 2, pp. 182–189, 2006.
[11] L. A. Carvajal Ahumada, N. Peña Pérez, O. L. HerreraSandoval, F. del Pozo Guerrero, and J. J. Serrano Olmedo, “A
new way to find dielectric properties of liquid sample usingthe quartz crystal resonator (QCR),” Sensors and ActuatorsA: Physical, vol. 239, pp. 153–160, 2016.
[12] L. Ahumada, M. González, O. Sandoval, and J. Olmedo,“Evaluation of hyaluronic acid dilutions at different concentra-tions using a quartz crystal resonator (QCR) for the potentialdiagnosis of arthritic diseases,” Sensors, vol. 16, no. 11,p. 1959, 2016.
[13] L. A. Carvajal Ahumada, J. E. Pazos Alonso, J. J. SerranoOlmedo, and O. L. Herrera Sandoval, “Diseño y Evaluaciónde un micro viscosímetro de bajo costo utilizando un reso-nador de cristal de cuarzo y Arduino,” in Congreso Interna-cional de Ciencias Básicas e Ingeniería de Universidad de losLlanos, p. 11, Asociación Mexicana de Medicina de Urgen-cia, 2016.
[14] E. J. Calvo, R. Etchenique, P. N. Bartlett, K. Singhal, andC. Santamaria, “Quartz crystal impedance studies at 10MHz of viscoelastic liquids and films,” Faraday Discussions,vol. 107, pp. 141–157, 1997.
[15] M. Pax, J. Rieger, R. H. Eibl, C. Thielemann, andD. Johannsmann, “Measurements of fast fluctuations ofviscoelastic properties with the quartz crystal microbalance,”Analyst, vol. 130, no. 11, pp. 1474–1477, 2005.
[16] M. Cassiède, J. H. Paillol, J. Pauly, and J.-L. Daridon, “Electri-cal behaviour of AT-cut quartz crystal resonators as a functionof overtone number,” Sensors and Actuators A: Physical,vol. 159, no. 2, pp. 174–183, 2010.
[17] V. E. Granstaff and S. J. Martin, “Characterization of athickness-shear mode quartz resonator with multiple nonpie-zoelectric layers,” Journal of Applied Physics, vol. 75, no. 3,pp. 1319–1329, 1994.
[18] T. Nakamoto and T. Kobayashi, “Development of circuit formeasuring both Q variation and resonant frequency shift ofquartz crystal microbalance,” IEEE Transactions on Ultra-sonics, Ferroelectrics and Frequency Control, vol. 41, no. 6,pp. 806–811, 1994.
7Journal of Sensors

International Journal of
AerospaceEngineeringHindawiwww.hindawi.com Volume 2018
RoboticsJournal of
Hindawiwww.hindawi.com Volume 2018
Hindawiwww.hindawi.com Volume 2018
Active and Passive Electronic Components
VLSI Design
Hindawiwww.hindawi.com Volume 2018
Hindawiwww.hindawi.com Volume 2018
Shock and Vibration
Hindawiwww.hindawi.com Volume 2018
Civil EngineeringAdvances in
Acoustics and VibrationAdvances in
Hindawiwww.hindawi.com Volume 2018
Hindawiwww.hindawi.com Volume 2018
Electrical and Computer Engineering
Journal of
Advances inOptoElectronics
Hindawiwww.hindawi.com
Volume 2018
Hindawi Publishing Corporation http://www.hindawi.com Volume 2013Hindawiwww.hindawi.com
The Scientific World Journal
Volume 2018
Control Scienceand Engineering
Journal of
Hindawiwww.hindawi.com Volume 2018
Hindawiwww.hindawi.com
Journal ofEngineeringVolume 2018
SensorsJournal of
Hindawiwww.hindawi.com Volume 2018
International Journal of
RotatingMachinery
Hindawiwww.hindawi.com Volume 2018
Modelling &Simulationin EngineeringHindawiwww.hindawi.com Volume 2018
Hindawiwww.hindawi.com Volume 2018
Chemical EngineeringInternational Journal of Antennas and
Propagation
International Journal of
Hindawiwww.hindawi.com Volume 2018
Hindawiwww.hindawi.com Volume 2018
Navigation and Observation
International Journal of
Hindawi
www.hindawi.com Volume 2018
Advances in
Multimedia
Submit your manuscripts atwww.hindawi.com


![0000065394 · Intelltx Destqner [weather.kdm] Tot* SOUL Example Set Editor Rea 93 64 72 81 FALSE TRUE FALSE FALSE TRUE TRUE FALSE FALSE FALSE TRUE TRUE FALSE TRUE overcast](https://img.pdfslide.us/doc/110x75/5cbf6e0688c993c04b8b9447/0000065394-intelltx-destqner-weatherkdm-tot-soul-example-set-editor-rea.jpg)