Embed Size (px)
Citation preview

Use ofUse of Ex SituEx Situ Detectors to Simulate NF/RODetectors to Simulate NF/ROUse of Use of Ex Situ Ex Situ Detectors to Simulate NF/RO Detectors to Simulate NF/RO Membrane Performance in a FullMembrane Performance in a Full--Scale SystemScale System
Dian TanuwidjajaDian Tanuwidjaja1,21,2, Eric M.V. Hoek, Eric M.V. Hoek11, , Robert C. ChengRobert C. Cheng22, Tai Tseng, Tai Tseng22, and Kevin Wattier, and Kevin Wattier22
AWWA AWWA MemtechMemtech, March 30, 2011, March 30, 20111Civil & Environmental Engineering, University of California, Los Angeles
2Long Beach Water Department

Outline of PresentationOutline of PresentationIntroductionIntroduction
Obj tiObj tiObjectiveObjectiveLong Beach Water DepartmentLong Beach Water DepartmentFouling PhenomenaFouling Phenomena
Design and Construction of Fouling DetectorsDesign and Construction of Fouling DetectorsPretreatment StudyPretreatment StudyNutrient StudyNutrient StudyNutrient StudyNutrient StudyConclusionsConclusions

OverviewOverviewProduction of potable water by seawater Production of potable water by seawater desalination is technologically feasible but thedesalination is technologically feasible but thedesalination is technologically feasible, but the desalination is technologically feasible, but the efficiency is often limited by foulingefficiency is often limited by fouling
Research objectives: Research objectives: Identify the mechanisms of fouling on the membrane Identify the mechanisms of fouling on the membrane surface for (1) detectors and (2) full scale plantsurface for (1) detectors and (2) full scale plantsurface for (1) detectors and (2) full scale plantsurface for (1) detectors and (2) full scale plantIdentify the causes and consequences of seawater Identify the causes and consequences of seawater NF/RO membrane fouling during (a) normal operating NF/RO membrane fouling during (a) normal operating g g ( ) p gg g ( ) p gconditions and (b) during algae bloomsconditions and (b) during algae bloomsProvide the tool for plant operators to detect fouling Provide the tool for plant operators to detect fouling using the fouling detectorsusing the fouling detectorsusing the fouling detectorsusing the fouling detectors
Long Beach Desalination PrototypeLong Beach Desalination Prototype
CoCo--location with location with Haynes Power PlantHaynes Power PlantHaynes Power PlantHaynes Power PlantSize: 300,000 GPDSize: 300,000 GPDPretreatment: 0.1 Pretreatment: 0.1 μμmmmicrofiltration, microfiltration,
South Train North Trainchlorination, and dechlorination, and de--chlorinationchlorination
MF Unit
44

Long Beach Desalination PrototypeLong Beach Desalination Prototype
N OCl
NaHSO3 Energy Recovery
ER Pump
CombinedEffluent
ProductWater
ER on vs. off
NaOCl(optional)
NaOCl(primary)
Backwashwater ClO2
(optional)
VFD
South Train Pass 1 South Train Pass 2
VFD
2 Pass NF (NF2)5 elements in series
Backwashwater
NaHSO3
MF
CartridgeFilter Energy Recovery
ER Pump
VFD
NaOH
UV(optional)
T diti l RO
ER on vs. off
Strainer
CartridgeFilter
VFD
ER Pump
North Train Pass 1 North Train Pass 2
ProductWater
NaOH
VFD
VFDTraditional RO
Operating Conditions:Varied flux, recovery, and
b f ER d i d
7 elements in series
XLE (ULPRO), NF 90 (SW NF) NE 90 (SW NF)
* Image source: Dr. Robert C. Cheng, Long Beach Water Department
ClO2(optional)
NaOHnumber of ER devices used(SW NF), NE 90 (SW NF)
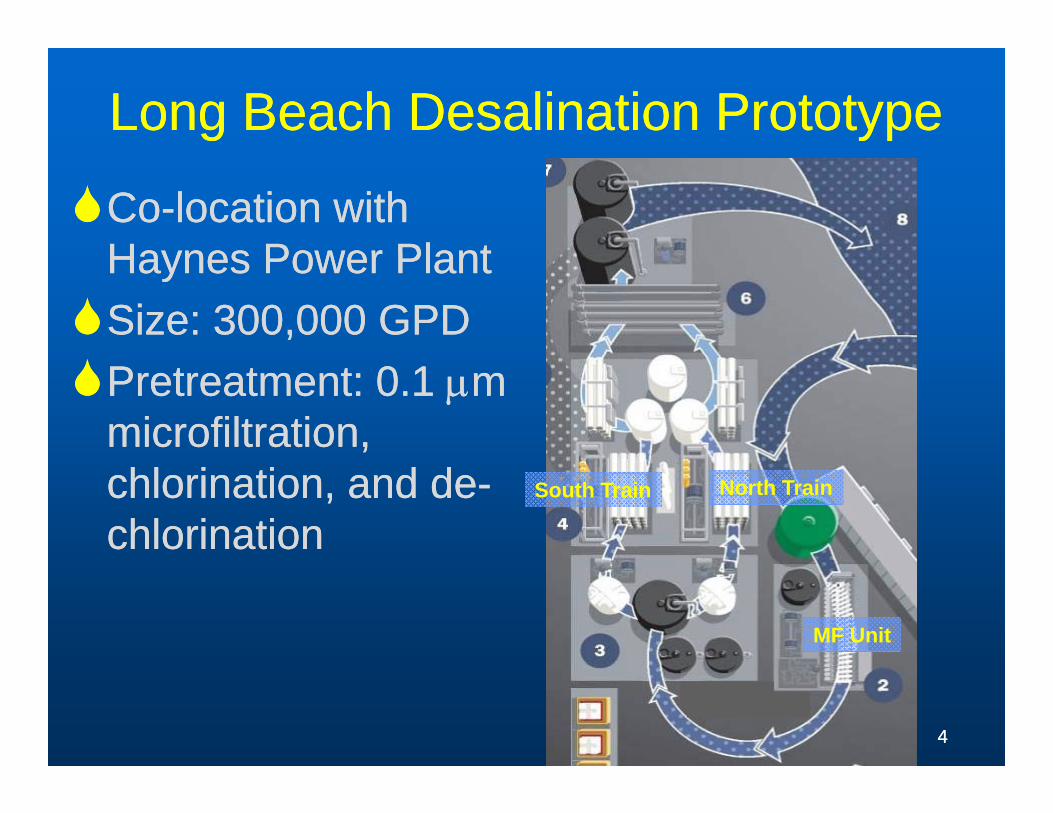
Fouling PhenomenaFouling PhenomenaDirect consequencesDirect consequences
TransTrans--membrane pressure dropmembrane pressure dropTransTrans--membrane pressure dropmembrane pressure drop•• Decreased permeate fluxDecreased permeate flux
TransTrans--module pressure dropmodule pressure drop
need higher appliedpressure for sameflux higher SEC
•• Increased differential pressureIncreased differential pressure
Indirect consequences = countermeasuresIndirect consequences = countermeasuresE iE iExtensive preExtensive pre--treatmenttreatment•• Higher capital investmentHigher capital investment•• Higher operating expensesHigher operating expensesHigher operating expensesHigher operating expenses
Higher cleaning frequencyHigher cleaning frequency•• Increase process downtimeIncrease process downtime
( f )( f )•• Accelerate membrane degradation (shorter life)Accelerate membrane degradation (shorter life)
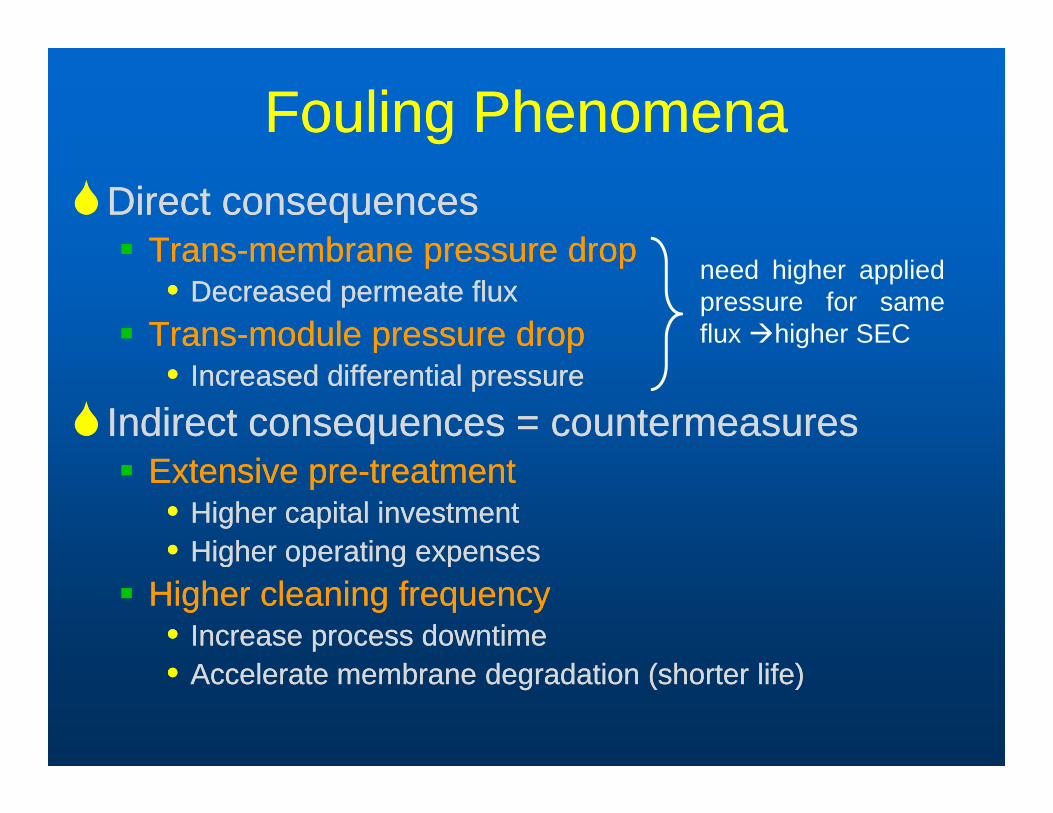
How to Detect Fouling?How to Detect Fouling?Plant PerformancePlant Performance
TT b db dTransTrans--membrane pressure dropmembrane pressure dropTransTrans--module pressure dropmodule pressure drop Too late
Membrane AutopsyMembrane AutopsyDestructiveDestructiveExpensive ($500Expensive ($500--$700 per element)$700 per element)Plant shutdown (process Plant shutdown (process downtime)downtime)

Fouling DetectorsFouling Detectors
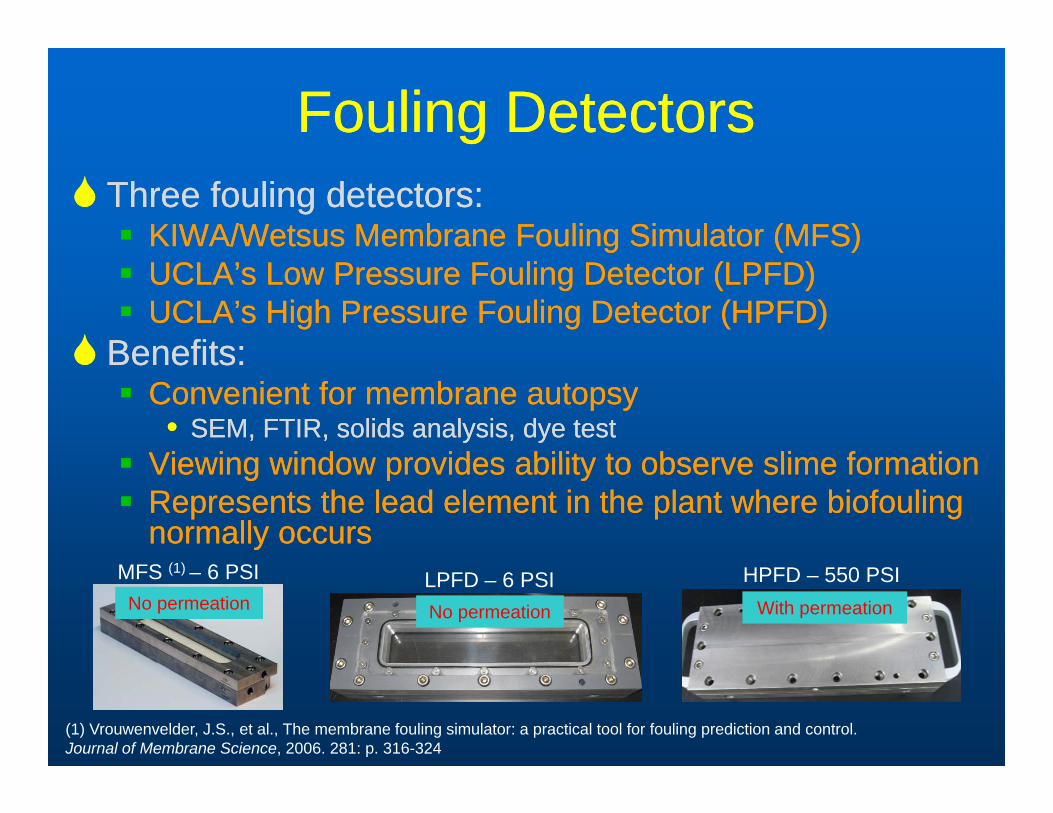
Fouling DetectorsFouling DetectorsThree fouling detectors:Three fouling detectors:
KIWA/Wetsus Membrane Fouling Simulator (MFS)KIWA/Wetsus Membrane Fouling Simulator (MFS)UCLA’s Low Pressure Fouling Detector (LPFD)UCLA’s Low Pressure Fouling Detector (LPFD)UCLA’s High Pressure Fouling Detector (HPFD)UCLA’s High Pressure Fouling Detector (HPFD)
Benefits:Benefits:Benefits:Benefits:Convenient for membrane autopsyConvenient for membrane autopsy
•• SEM, FTIR, solids analysis, dye testSEM, FTIR, solids analysis, dye testViewing window provides ability to observe slime formationViewing window provides ability to observe slime formationViewing window provides ability to observe slime formationViewing window provides ability to observe slime formationRepresents the lead element in the plant where biofouling Represents the lead element in the plant where biofouling normally occursnormally occurs
LPFD – 6 PSI HPFD – 550 PSIMFS (1) – 6 PSINo permeation No permeation With permeation
(1) Vrouwenvelder, J.S., et al., The membrane fouling simulator: a practical tool for fouling prediction and control. Journal of Membrane Science, 2006. 281: p. 316-324

Permeation vs. Non permeationPermeation vs. Non permeationNo permeation (MFS No permeation (MFS and LPFD)and LPFD)
Pressure transducer
and LPFD)and LPFD)Fouling occurs in feed Fouling occurs in feed spacerspacerppFouling is dominated by Fouling is dominated by growth and accumulationgrowth and accumulation Inlet (Feed) Outlet (Brine)
With permeation With permeation (HPFD)(HPFD)
Outlet (Brine)
Fouling occurs on Fouling occurs on membrane surfacemembrane surfaceF li i d i t d bF li i d i t d b
Inlet (Feed)
Fouling is dominated by Fouling is dominated by convective depositionconvective deposition Permeate

Fouling Detectors Fouling Detectors –– Location (MF+CF)Location (MF+CF)
South Train – MF+CF LPFD
MFSSouth Train MF+CF LPFD
HPFD
NaHSO Energy RecoveryCombined ProductNaHSO3
Backwashwater
Energy Recovery
ER Pump
CombinedEffluent Water
VFD
Backwashwater
NaOCl(primary)
NaHSO3Cartridge
Filter
VFD
South Train Pass 1 South Train Pass 2
VFD
NaOHwater
Strainer
MF
Filter Energy Recovery
VFD
ER Pump
VFD
VFD
NaOH
CartridgeFilter
VFD
North Train Pass 1 North Train Pass 2
ProductWater
NaOH
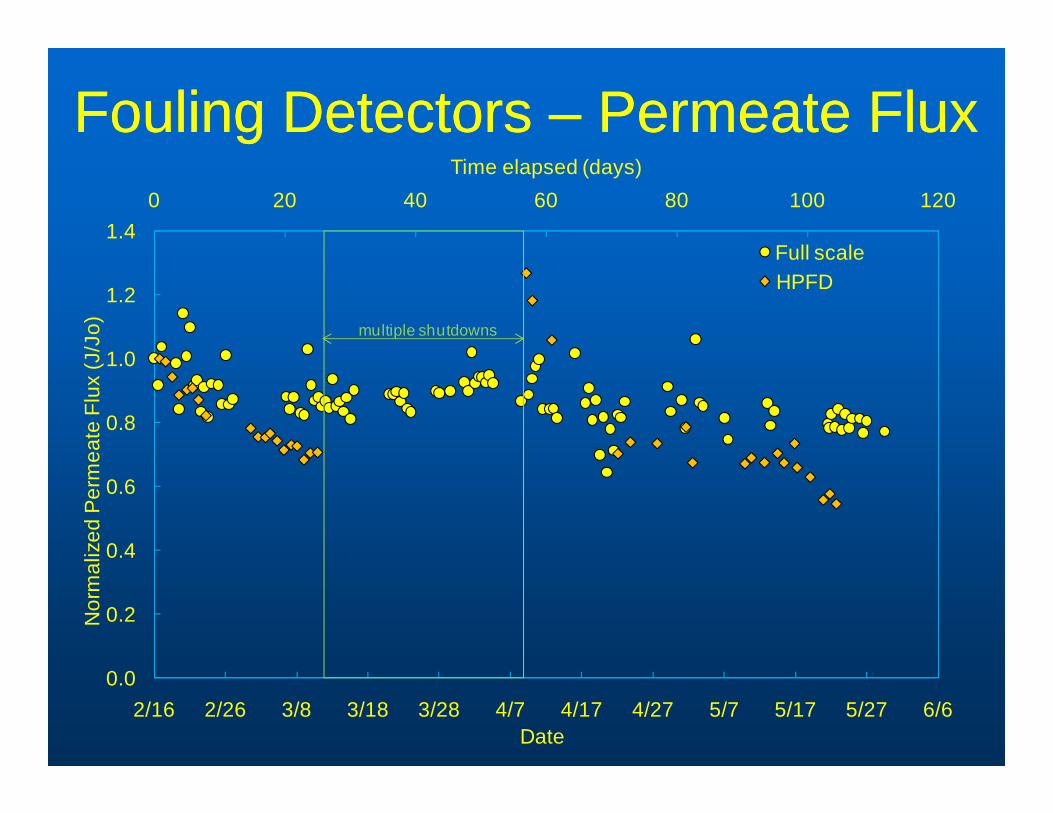
Fouling Detectors Fouling Detectors –– Permeate FluxPermeate Flux0 20 40 60 80 100 120
1.4
Time elapsed (days)
Full scale
1 0
1.2
J/Jo
)
Full scaleHPFD
multiple shutdowns
0.8
1.0
eate
Flu
x (J
0.4
0.6
lized
Per
me
0.2Nor
mal
0.02/16 2/26 3/8 3/18 3/28 4/7 4/17 4/27 5/7 5/17 5/27 6/6
Date
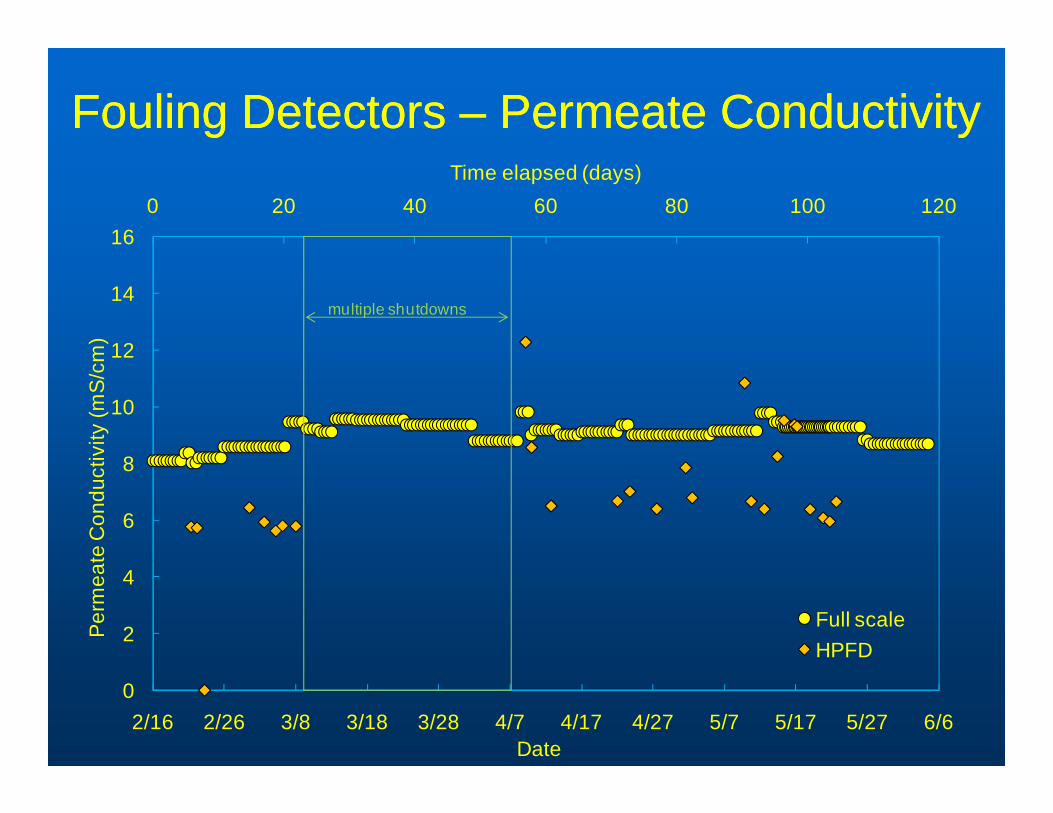
Fouling Detectors Fouling Detectors –– Permeate ConductivityPermeate Conductivity
0 20 40 60 80 100 12016
Time elapsed (days)
12
14
m)
multiple shutdowns
8
10
12
ivity
(mS
/cm
6
8
te C
ondu
cti
2
4
Per
mea
t
Full scaleHPFD
02/16 2/26 3/8 3/18 3/28 4/7 4/17 4/27 5/7 5/17 5/27 6/6
Date

Fouling Detectors Fouling Detectors –– Differential Pressure Differential Pressure ResponseResponseResponseResponse
0 20 40 60 80 100 12010
Time elapsed (days)
8
9
psi)
Full scaleHPFDLPFDMFSsystem shutdown
y = 0.0339x + 4.4y = 0.0004x + 5.26
7
Pre
ssur
e (p MFSsystem shutdown
y = 0 0141x + 3 2 y = 0.0338x3
4
5
Diff
ernt
ial
y = 0.0141x + 3.2
y = 0 0092x + 0 2
y 0.0338x
1
2
3
y = 0.0092x + 0.202/16 2/26 3/8 3/18 3/28 4/7 4/17 4/27 5/7 5/17 5/27 6/6
Date

Fouling Detector Fouling Detector –– SummarySummaryHPFD mimicked the full scale plant better HPFD mimicked the full scale plant better
LPFD d MFS d t h th bilit t d t tLPFD d MFS d t h th bilit t d t tLPFD and MFS do not have the ability to detect LPFD and MFS do not have the ability to detect flux and salt rejectionflux and salt rejection
LPFD d MFS k ll lLPFD d MFS k ll lLPFD and MFS can work well as early LPFD and MFS can work well as early warning detectors warning detectors
LPFD and MFS were more sensitive than HPFD LPFD and MFS were more sensitive than HPFD and full scaleand full scaleLPFD d MFS h i i i d t bLPFD d MFS h i i i d t bLPFD and MFS has viewing window to observe LPFD and MFS has viewing window to observe slime formationslime formation

Pretreatment StudiesPretreatment Studies

Pretreatment ApproachesPretreatment ApproachesParticulate removalParticulate removal
Media filtration (GAC)Media filtration (GAC)Microfiltration or Microfiltration or ultrafiltrationultrafiltration
NanofiltrationNanofiltration (removes organics and minerals)(removes organics and minerals)Scaling inhibitionScaling inhibitiongg
pH adjustment (pH 5.5 to 6) pH adjustment (pH 5.5 to 6) –– sulfuric or hydrochloric acidssulfuric or hydrochloric acidsAntiAnti--scalantscalant –– sodium sodium hexametaphosphatehexametaphosphate (SHMP)(SHMP)Chemical precipitationChemical precipitation –– lime and caustic sodalime and caustic sodaChemical precipitation Chemical precipitation lime and caustic sodalime and caustic soda
BioBio--growth inhibitiongrowth inhibitionFree chlorine followed by Free chlorine followed by dechlorinationdechlorinationCombined chlorine (chloramines)Combined chlorine (chloramines)Combined chlorine (chloramines)Combined chlorine (chloramines)OzoneOzonePhotolytic inactivation (UV)Photolytic inactivation (UV)Chlorine dioxide (ClOChlorine dioxide (ClO ))Chlorine dioxide (ClOChlorine dioxide (ClO22))

Pretreatment Pretreatment –– LocationsLocationsNorth Train – MF+CF+ClO2
GAC LPFDMF+GACHPFD
LPFD
HPFD
Energy RecoveryCombined Product
LPFD
HPFDSouth Train – MF+CF+UV
Backwashwater
Energy Recovery
ER Pump
CombinedEffluent Water
VFDUV
(optional)
Backwashwater
NaOCl(primary)
CartridgeFilter
VFD
South Train Pass 1 South Train Pass 2
VFD
NaOH
(optional)
water
Strainer
MF
Filter Energy Recovery
VFD
ER Pump
VFD
VFD
NaOH
CartridgeFilter
VFD
North Train Pass 1 North Train Pass 2
ProductWater
NaOHClO2(optional)
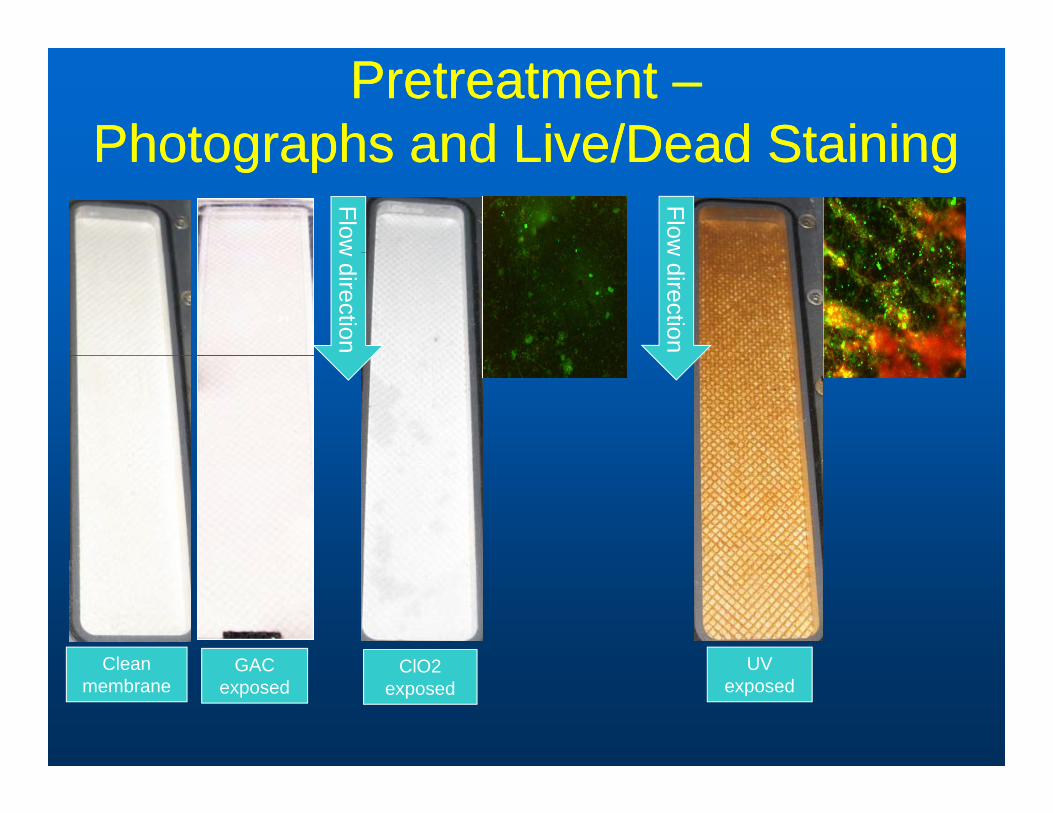
Pretreatment Pretreatment ––Photographs and Live/Dead StainingPhotographs and Live/Dead StainingPhotographs and Live/Dead StainingPhotographs and Live/Dead Staining
Flow
Floww direction
w direction
Clean ClO2 UVGACClean membrane
ClO2 exposed
UV exposed
GAC exposed
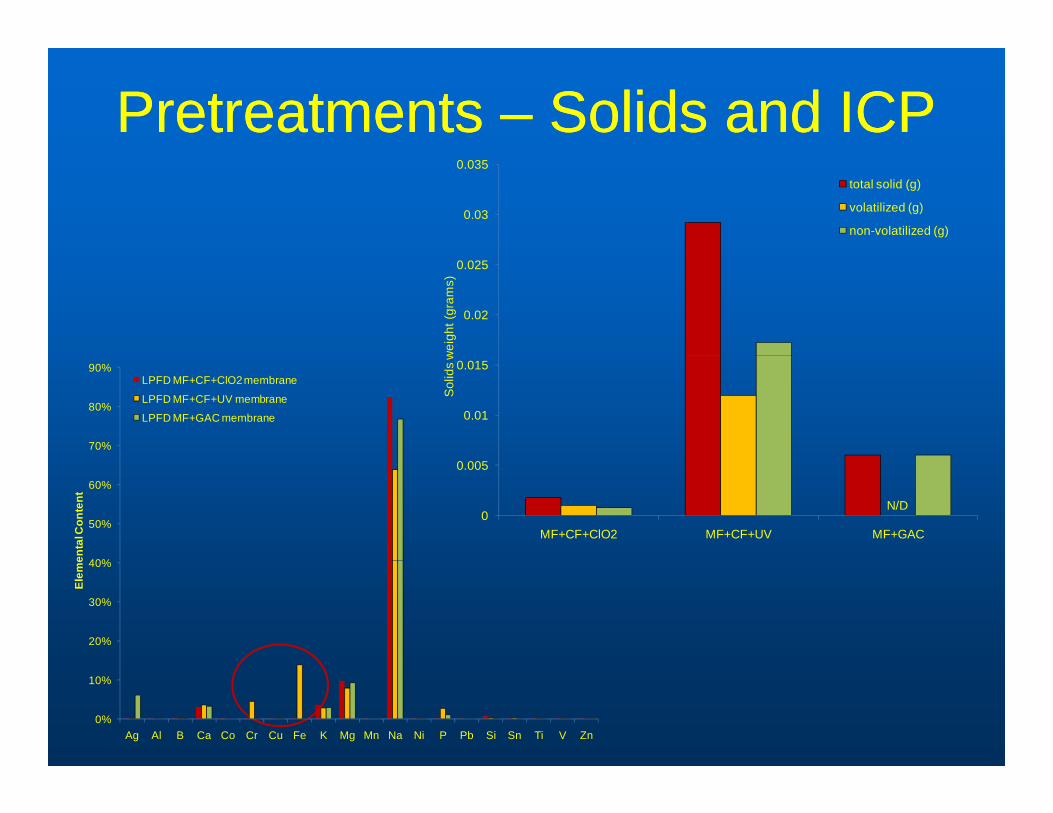
Pretreatments Pretreatments –– Solids and ICPSolids and ICP0.03
0.035total solid (g)
volatilized (g)
non-volatilized (g)
0.02
0.025
wei
ght (
gram
s)
0.01
0.015
Sol
ids
w70%
80%
90%LPFD MF+CF+ClO2 membrane
LPFD MF+CF+UV membrane
LPFD MF+GAC membrane
0
0.005
MF+CF+ClO2 MF+CF+UV MF+GAC
N/D
40%
50%
60%
enta
l Con
tent
20%
30%
40%
Elem
e
0%
10%
Ag Al B Ca Co Cr Cu Fe K Mg Mn Na Ni P Pb Si Sn Ti V Zn
Pretreatment Pretreatment –– SummarySummaryUV irradiation was ineffective at UV irradiation was ineffective at biofoulingbiofoulingpreventionpreventionprevention.prevention.
May cause additional problem in seawater May cause additional problem in seawater desalinationdesalinationdesalinationdesalination
GAC can work as well as ClOGAC can work as well as ClO22 as as t t t f th fi t 60 d f tit t t f th fi t 60 d f tipretreatment for the first 60 days of operationpretreatment for the first 60 days of operation
ClOClO22 works well for works well for biofoulingbiofouling preventionprevention
Nutrient Perturbation StudiesNutrient Perturbation StudiesNutrient Perturbation StudiesNutrient Perturbation Studies(“Simulated Algae Blooms”)(“Simulated Algae Blooms”)
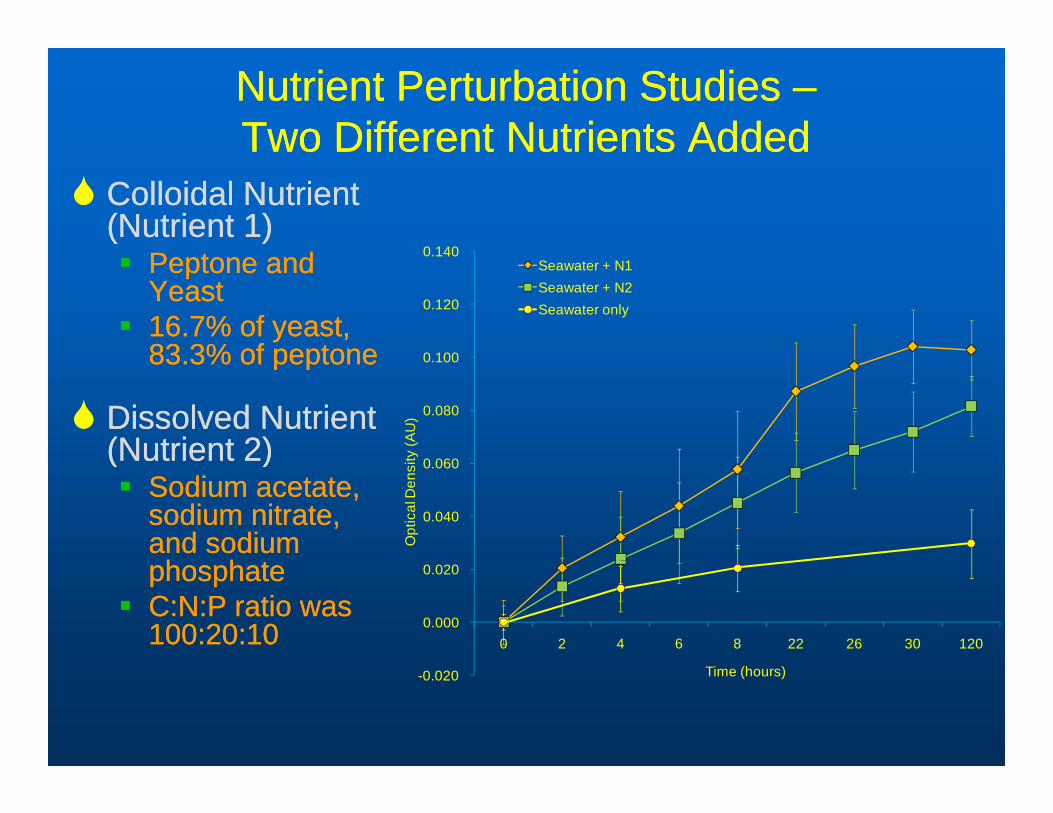
Nutrient Perturbation Studies Nutrient Perturbation Studies ––Two Different Nutrients AddedTwo Different Nutrients AddedTwo Different Nutrients AddedTwo Different Nutrients Added
Colloidal Nutrient Colloidal Nutrient (Nutrient 1)(Nutrient 1)
P t dP t d 0 140Peptone and Peptone and YeastYeast16.7% of yeast, 16.7% of yeast, 83 3% of peptone83 3% of peptone 0 100
0.120
0.140 Seawater + N1Seawater + N2Seawater only
83.3% of peptone83.3% of peptone
Dissolved Nutrient Dissolved Nutrient (Nutrient 2)(Nutrient 2)
0.080
0.100
ty (A
U)
(Nutrient 2)(Nutrient 2)Sodium acetate, Sodium acetate, sodium nitrate, sodium nitrate, and sodium and sodium h h th h t
0.040
0.060
Opt
ical
Den
sit
phosphatephosphateC:N:P ratio was C:N:P ratio was 100:20:10100:20:10 0.000
0.020
0 2 4 6 8 22 26 30 120
-0.020 Time (hours)
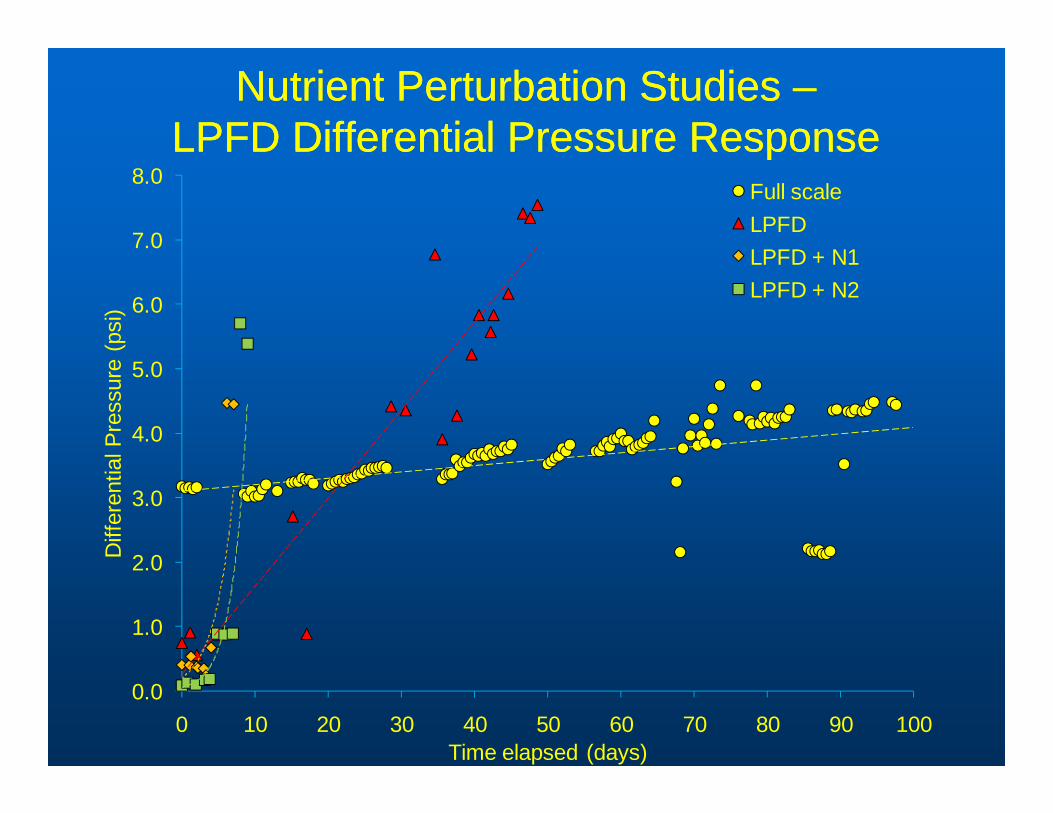
Nutrient Perturbation Studies Nutrient Perturbation Studies ––LPFD Differential Pressure ResponseLPFD Differential Pressure ResponseLPFD Differential Pressure ResponseLPFD Differential Pressure Response
7.0
8.0Full scaleLPFDLPFD + N1
6.0
(psi
)
LPFD + N1LPFD + N2
4.0
5.0
l Pre
ssur
e
2 0
3.0
Diff
eren
tia
1.0
2.0
0.00 10 20 30 40 50 60 70 80 90 100
Time elapsed (days)

Nutrient Perturbation Studies Nutrient Perturbation Studies ––HPFD Permeate Flux ResponseHPFD Permeate Flux ResponseHPFD Permeate Flux ResponseHPFD Permeate Flux Response
D iti
1.0
Deposition
0 7
0.8
0.9
(J/J
0)
0 5
0.6
0.7
rmea
te F
lux
Deposition
0 3
0.4
0.5
rmal
ized
Per
D iti Bi th (N1)
Deposition + Biogrowth (N2)
0.1
0.2
0.3
Nor No Fouling
Full scaleHPFDHPFD + N1
Deposition + Biogrowth (N1)0.0
0 10 20 30 40 50 60 70 80 90 100Time elapsed (days)
HPFD + N2

Nutrient Perturbation Studies Nutrient Perturbation Studies ––Solid AnalysisSolid AnalysisSolid AnalysisSolid Analysis
LPFD N1 vs. N2HPFD vs. LPFD (N1)0.06total solid (g)volatilized (g)
0 04
0.05
(g)non-volatilized (g)
0.03
0.04
ght (
gram
s)
0.02Solid
s w
ei
0.01
0membrane spacer membrane spacer membrane spacer
N/D N/DN/D
HPFD + N1 LPFD + N2LPFD + N1
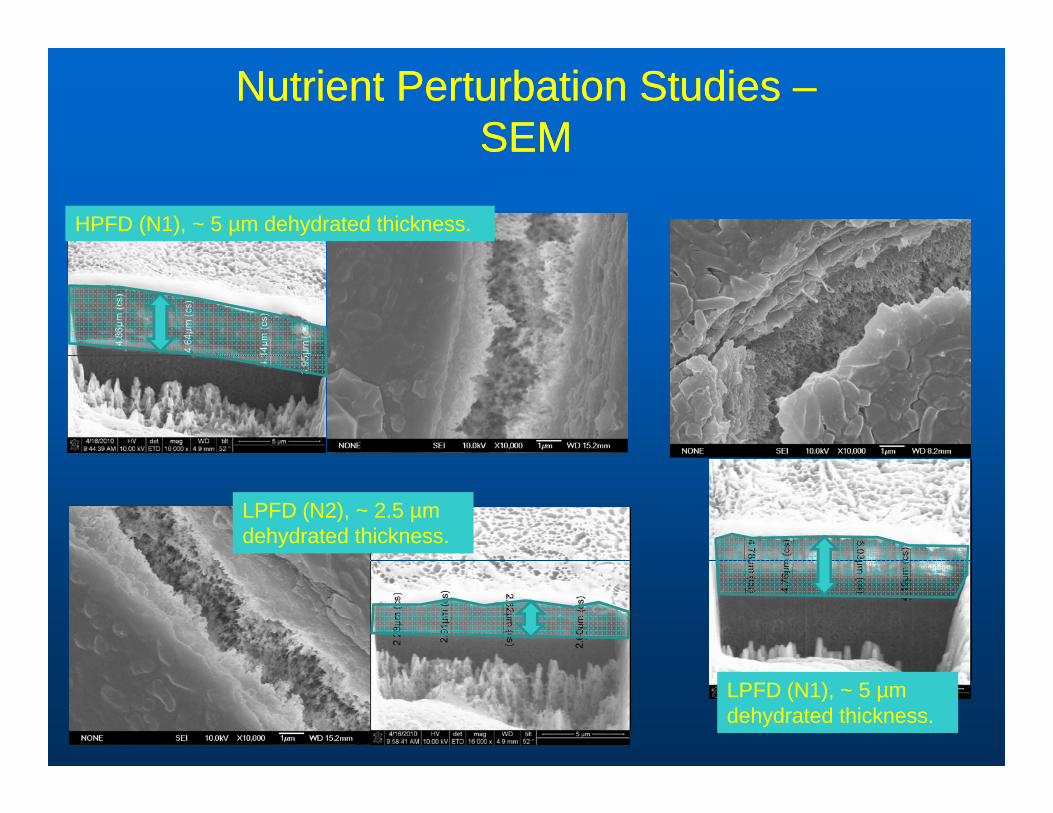
Nutrient Perturbation Studies Nutrient Perturbation Studies ––SEMSEMSEMSEM
HPFD (N1), ~ 5 µm dehydrated thickness.
LPFD (N2), ~ 2.5 µm dehydrated thickness.
LPFD (N1), ~ 5 µm dehydrated thickness.
Nutrient Perturbation Nutrient Perturbation –– SummarySummaryDifferential pressure data performance for LPFD Differential pressure data performance for LPFD for both types of nutrients addition behavedfor both types of nutrients addition behavedfor both types of nutrients addition behaved for both types of nutrients addition behaved similarlysimilarlyThe HPFD for particulate nutrient (N1) showed a The HPFD for particulate nutrient (N1) showed a p ( )p ( )more drastic flux decline than for dissolved more drastic flux decline than for dissolved nutrient (N2)nutrient (N2)More solids were found on the feed spacer than More solids were found on the feed spacer than on the membrane surface for LPFD, but not on on the membrane surface for LPFD, but not on the HPFDthe HPFDthe HPFDthe HPFDThicker mass was found on membrane exposed Thicker mass was found on membrane exposed to particulate nutrient (N1) than on membraneto particulate nutrient (N1) than on membraneto particulate nutrient (N1) than on membrane to particulate nutrient (N1) than on membrane exposed to dissolved nutrient (N2)exposed to dissolved nutrient (N2)

Research OutcomesResearch OutcomesIdentify the mechanisms of fouling on the membrane Identify the mechanisms of fouling on the membrane surface for (1) detectors and (2) full scale plantsurface for (1) detectors and (2) full scale plant
HPFD and full scale plant: mostly convective depositionHPFD and full scale plant: mostly convective depositionMFS and LPFD: accumulation and MFS and LPFD: accumulation and biogrowthbiogrowth
Identify the causes and consequences of seawaterIdentify the causes and consequences of seawaterIdentify the causes and consequences of seawater Identify the causes and consequences of seawater NF/RO membrane fouling during (a) normal operating NF/RO membrane fouling during (a) normal operating conditions and (b) during algae bloomsconditions and (b) during algae blooms
Normal condition:Normal condition:Normal condition:Normal condition:•• Cause: Mostly organic, some Cause: Mostly organic, some biogrowthbiogrowth, rust from piping system or , rust from piping system or
even UV reactor may be the source of inorganic foulingeven UV reactor may be the source of inorganic fouling•• Consequences: Slight flux decline and DP increaseConsequences: Slight flux decline and DP increaseq gq g
Simulated algae blooms:Simulated algae blooms:•• Cause: Organic and biologicalCause: Organic and biological•• Consequences: Severe flux decline, and DP increaseConsequences: Severe flux decline, and DP increaseq ,q ,

Research Outcomes, cont.Research Outcomes, cont.Which pretreatment works best to mitigate Which pretreatment works best to mitigate fouling?fouling?fouling?fouling?
ClOClO22 is very effective in is very effective in biofoulingbiofouling preventionpreventionGAC can be as effective as ClOGAC can be as effective as ClO22GAC can be as effective as ClOGAC can be as effective as ClO22UV is the least effective pretreatment in this studyUV is the least effective pretreatment in this study
Provide the tool for plant operators to detectProvide the tool for plant operators to detectProvide the tool for plant operators to detect Provide the tool for plant operators to detect fouling using the fouling detectorsfouling using the fouling detectors
HPFD: Mimics the full scale plant very wellHPFD: Mimics the full scale plant very wellHPFD: Mimics the full scale plant very wellHPFD: Mimics the full scale plant very wellLPFD and MFS: Anticipate high nutrient LPFD and MFS: Anticipate high nutrient concentrationconcentration

AcknowledgementsAcknowledgementsFinancial Support was provided by:Financial Support was provided by:
L B h W t D t t f P itiL B h W t D t t f P itiLong Beach Water Department from Proposition Long Beach Water Department from Proposition 50 Grant50 Grant
D H V ldD H V ld W tW tDr. Hans Vrouwenvelder, Dr. Hans Vrouwenvelder, WetsusWetsusLong Beach Water Department (LBWD) staffLong Beach Water Department (LBWD) staffAdvisor: Professor Eric M.V. HoekAdvisor: Professor Eric M.V. Hoek
Thank YouThank You


Extra Slides Beyond This PointExtra Slides Beyond This Point

Chemical AdditionChemical AdditionMF cleaning: Sodium HypochloriteMF cleaning: Sodium HypochloriteMF backwash: Sodium Hypochlorite MF backwash: Sodium Hypochlorite MF CIP: Sodium HydroxideMF CIP: Sodium HydroxideMF CIP: Sodium HydroxideMF CIP: Sodium HydroxideDechlorinationDechlorination: Sodium : Sodium bisulfitebisulfite to the MF filtrateto the MF filtrateScaling inhibitionScaling inhibition
Sulfuric acid to Train 1 and 2 feedSulfuric acid to Train 1 and 2 feedSulfuric acid to Train 1 and 2 feed Sulfuric acid to Train 1 and 2 feed Scale inhibitor to Train 1 and 2 feedScale inhibitor to Train 1 and 2 feed
NF/RO CIP: Sodium hydroxide or citric acid to trains 1 and 2NF/RO CIP: Sodium hydroxide or citric acid to trains 1 and 2NF/RO NF/RO biofoulingbiofouling: : NaOHNaOHNF/RO scaling: citric acidNF/RO scaling: citric acidBoron removal: Sodium hydroxide to train 1 and 2 pass 2 feed to Boron removal: Sodium hydroxide to train 1 and 2 pass 2 feed to Post treatmentPost treatment
S di h d id f H dj t tS di h d id f H dj t tSodium hydroxide for pH adjustmentSodium hydroxide for pH adjustmentCarbon dioxide for distribution system Carbon dioxide for distribution system recarbonationrecarbonation
Before dischargeBefore dischargeSodiumSodium bisulfitebisulfite to combined effluent to remove free chlorineto combined effluent to remove free chlorineSodium Sodium bisulfitebisulfite to combined effluent to remove free chlorine to combined effluent to remove free chlorine Sodium hydroxide to combined effluent for pH adjustmentSodium hydroxide to combined effluent for pH adjustment

Chlorine Dioxide ReactionsChlorine Dioxide ReactionsProductions(1): Productions(1):
Acid (hydrochloric acid) Acid (hydrochloric acid) –– chlorite (direct acid system): chlorite (direct acid system): •• 5NaClO2 + 4HCl 5NaClO2 + 4HCl 4ClO4ClO22(g) + 5NaCl + 2H2O(g) + 5NaCl + 2H2O
Aqueous chlorine (Aqueous chlorine (hypochloroushypochlorous acid) acid) –– chlorite: chlorite: •• Cl2 + H2O Cl2 + H2O HOClHOCl + + HClHCl•• 2NaClO2 +2NaClO2 + HOClHOCl 2ClO2(g) +2ClO2(g) + NaClNaCl ++ NaOHNaOH•• 2NaClO2 + 2NaClO2 + HOClHOCl 2ClO2(g) + 2ClO2(g) + NaClNaCl + + NaOHNaOH
Recycled aqueous chlorine Recycled aqueous chlorine –– chlorite: chlorite: •• 2NaClO2 + 2HOCl 2NaClO2 + 2HOCl 2ClO2 + Cl2 + 2NaOH2ClO2 + Cl2 + 2NaOH
Gaseous chlorineGaseous chlorine chlorite:chlorite:Gaseous chlorine Gaseous chlorine –– chlorite: chlorite: •• 2NaClO2 + Cl2(g) 2NaClO2 + Cl2(g) 2ClO2(g)2ClO2(g) + 2NaCl + 2NaCl
Byproducts(2):Byproducts(2):Chlorite:Chlorite: incomplete reaction of the sodium chlorite and chlorineincomplete reaction of the sodium chlorite and chlorineChlorite: Chlorite: incomplete reaction of the sodium chlorite and chlorine incomplete reaction of the sodium chlorite and chlorine reactantsreactantsChlorate: Chlorate: the reaction of residual chlorite and free chlorine the reaction of residual chlorite and free chlorine during secondary disinfectionduring secondary disinfectionduring secondary disinfectionduring secondary disinfection
(1) Ferrero, E., et al., Chlorite and chlorate effect on the reverse osmosis membranes performance, in IDA World Congress-Maspalomas. 2007: Gran Canaria, Spain.
(2) EPA guideline manual, Chapter 4: Chlorine Dioxide (1999)
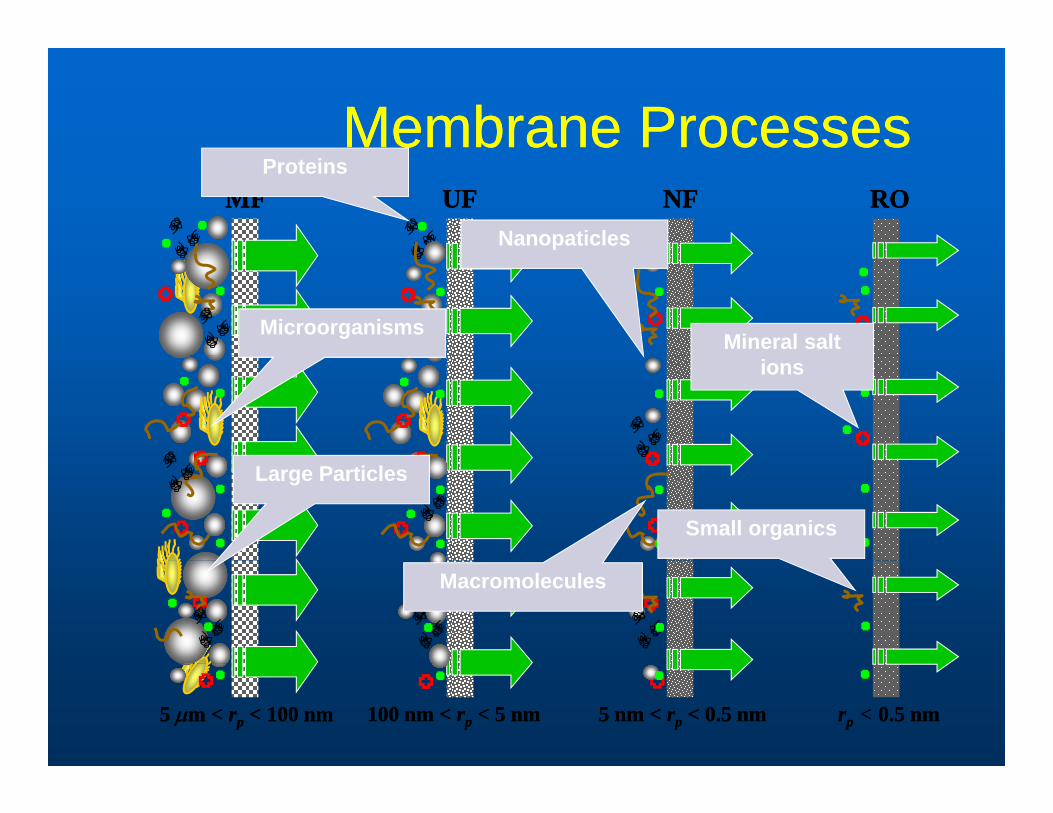
Membrane Processes Membrane Processes MFMF UFUF NFNF RORO
Nanopaticles
Proteins
Microorganisms Mineral salt ions
Large Particles
Small organics
Macromolecules
5 5 μμm < m < rrpp < 100 nm< 100 nm 100 nm < 100 nm < rrpp < 5 nm< 5 nm 5 nm < 5 nm < rrpp < 0.5 nm< 0.5 nm rrpp << 0.5 nm0.5 nm