Embed Size (px)
Citation preview
209
1 The geographic scope of this report is Europe, with a particular focus on Denmark, Iceland, Norway, Spain, Russian Federation, United Kingdom, Faeroe Islands, Sweden, France, Germany, Greenland,Ireland, Italy, Netherlands, Poland, Portugal and Ukraine.
Use of wild fish and other aquatic organisms as feed in aquaculture – a review of practices and implications in Europe1
Tim HuntingtonPoseidon Aquatic Resource Management Ltd.Windrush, Warborne LanePortmore, Nr. LymingtonHampshire SO41 5RJUnited Kingdom
Huntington, T. 2009. Use of wild fish and other aquatic organisms as feed in aquaculture – a review of practices and implications in Europe. In M.R. Hasan and M. Halwart (eds.). Fish as feed inputs for aquaculture: practices, sustainability and implications. FAO Fisheries and Aquaculture Technical Paper. No. 518. Rome, FAO. pp. 209–268.
Summary 2101. Introduction 2122. Overview of aquaculture systems and practices in Europe 2123. Use of fish and other aquatic species as feed for aquaculture
and animal feeds in Europe 2204. Sustainability issues of reduction fisheries and feedfish as
inputs for aquaculture and animal feed 2345. Environmental impact of aquaculture based on feedfish as inputs 2486. Current and potential alternative uses of feedfish and other
aquatic species and the related macro-level impact on food security and poverty alleviation 251
7. Regional issues on the use of fish and/or other aquatic species as feed for aquaculture 257
8. Conclusions and recommendations 260References 263

Fish as feed inputs for aquaculture – Practices, sustainability and implications210
SUMMARYThe intensive production of mainly carnivorous species in Europe uses fish feeds with a high content of fishmeal and fish oil, currently consuming around 615 000 tonnes of fishmeal and 317 000 tonnes of fish oils per year, thus requiring around 1.9 million tonnes of feedfish. While the capture and processing of feedfish provides only a small contribution to European fisheries-related employment (0.5 percent) and value added (2.8 percent), they help support an important aquaculture industry that has been dependent upon regional fishmeal and fish oil production to sustain its growth. With a conservatively estimated rise of European aquaculture production of 2 percent per year, fishmeal and fish oil use are likely to rise to 629 000 tonnes and 343 000 tonnes, respectively, by 2015, despite the greater use of vegetable-based substitutes and the greater efficiencies in feeding and nutrition.
The main sources of these feedfish are the small pelagic stocks of northern Europe, the Peruvian anchovy and jack mackerel of South America, and the fishmeal produced from trimmings and the bycatch of food fisheries. Due to the small size and low age of these feedfish, the stocks are difficult to manage on a multi-annual basis like many stocks in Europe. While their high fecundity allows stocks to recover from depletion fairly rapidly, there is concern over the impact of fishing pressure on predator-prey relationships in already stressed ecosystems.
Although quality and price are the main determinants for fishmeal purchasers in the aquafeeds industry, the sustainability of feed-fish sources is beginning to become more important. As yet there is no fully independent comprehensive analytical framework that integrates target stock assessment with the wider ecosystem linkages. To a degree this exists with the development of ecosystem models and approaches such as the Marine Stewardship Council (MSC) criteria for “responsible fishing”. Once such a framework has been created and is accepted as a suitable benchmark by the aquafeed industry and its detractors, then it will be easier for purchasers to purchase only from sustainable feed-fish stocks. This process will inevitably have consequences, such as greater pressure on those stocks deemed as sustainable, as well as possible effects on market economics.
The various feed fisheries targeted for fishmeal in Europe have little alternative uses. However some fisheries such as blue whiting, capelin, anchovy, herring and sprat, can be used for direct human consumption. The portion that goes for human consumption is not determined by technical limitations but depends largely on economic and cultural factors, which are more difficult for the industry to address directly. Despite the relatively low cost of products originating from small pelagic fisheries, they are not considered to contribute significantly to ensuring the food security of any part of Europe, due to the ready availability of other nutritional options.
This report concludes with a number of issues that are considered to be of particular regional significance. These, together with the recommendations, are summarized briefly below:
• Improved management of European feed fisheries is needed through a combination of greater political will and the gradual adoption of the ecosystem approach as implementation mechanisms evolve.
• Technical and other assistance to feed fisheries outside European waters, in particular to South American and Antarctic resources, should be provided through greater cooperation and the strengthening of relevant regional fisheries management organizations.
• Barriers to the sourcing and use of sustainable fishmeal and fish oils should be addressed by (i) adopting well-structured feed-fish fisheries sustainability criteria to guide buyers; (ii) improving traceability of materials, especially if blended during manufacture or distribution; (iii) encouraging sustainable purchasing
Wild fish and other aquatic organisms as feed in aquaculture in Europe 211
strategies through the use of formal environmental management systems; and (iv) premium branding of aquafeeds and aquaculture products produced using sustainable raw materials.
• Markets for European feedfish and their by-products in Eastern Europe and the Far East should be investigated. These markets currently absorb between 60 000–100 000 tonnes of Icelandic capelin per year (60–85 percent of the total), which might be increased.
• Food products for direct human consumption should be developed from species that are currently reduced to fishmeal and fish oil. These products should be economically competitive, appeal to European and export markets and be resistant to the cyclical nature of fishmeal and fish oil commodity pricing.
• Further development of plant-based substitutes for fishmeal and fish oil inclusion in aquafeeds is needed. These substitutes must be able to provide cost-effective alternatives to fish-based products, be acceptable to consumers and not raise sustainability issues in their own right. Much of the required research has already been completed to effect significant levels of substitution, but various commercial and consumer issues also need to be addressed.

Fish as feed inputs for aquaculture – Practices, sustainability and implications212
2 This review, which covers the period from 1995 to 2005, is essentially a desk study based on secondary sources of information and data derived from published literature and unpublished reports. Where possible, primary source data/information has also been collected through consultations with those associated with reduction fisheries and aquaculture practices in the region.
3 FAO Glossary of aquaculture (accessed on 31 July 2009) (http://www.fao.org/fi/glossary/aquaculture/ default.asp)
1.INTRODUCTION2
1.1 BackgroundThe fishmeal and fish oil industry started in northern Europe at the beginning of the twentieth century. Initially based mainly on surplus catches of herring from seasonal coastal fisheries, this was essentially an oil production activity, with fish oil finding industrial uses in the lubrication of machinery, leather tanning, and in the production of soap, glycerol and other non-food products. The residue was originally used as fertilizer, but since the turn of the twentieth century it has been dried and ground into fishmeal for animal feed. The fishmeal and fish oil sector has now developed into a major supplier of raw material for animal and fish feeds.
The demand for aquafeeds continues to increase, yet the overall global supply of fishmeal and fish oil is relatively fixed (SEAFeeds, 2003). This implies that there will be increased pressure on the fisheries that supply these commodities unless alternatives become both available and acceptable. While there is no real reason why feed fisheries should not continue to supply the aquaculture industry in the future, adequate sustainability assurances need to be in place.
2. OVERVIEW OF AQUACULTURE SYSTEMS AND PRACTICES IN EUROPEThis section looks at the nature of aquaculture in Europe, examines the past trends in production and then attempts to forecast where the industry will be in the next decade.
2.1 Current status and trendsAquaculture is the farming of aquatic organisms in inland and coastal areas, involving intervention in the rearing process to enhance production and the individual or corporate ownership of the stock being cultivated (FAO, 2009)3. Although freshwater aquaculture has been practiced in Europe for many centuries, full-cycle aquaculture in brackishwaters and marine waters is a more recent phenomenon. Large-scale mariculture first started in the 1970s with the Atlantic salmon (Salmo salar), whose large eggs and simple juvenile nutrition permitted the straightforward production of fingerlings for on-growing. Over the same period, research was being conducted into the breeding and feeding of other marine species with smaller, pelagic eggs. This has now led to the widespread production of seabass and seabream in the Mediterranean Sea and increasing volumes of more temperate species such as Atlantic cod (Gadus morhua), haddock (Melanogrammus aeglefinus), Atlantic halibut (Hippoglossus hippoglossus) and turbot (Psetta maxima), which are being produced as technological constraints are gradually overcome and their farming becomes economically viable.
An examination of salmonid (salmon and trout) production in Europe (Figure 1) shows that the production of Atlantic salmon still dominates European mariculture in terms of volume, although growth is slowing as a result of softening prices and competition from Chile. European salmon production is largely based around the deepwater bays (lochs and fjords) of western Scotland, Ireland, Faeroe Islands and Norway. Salmon farming is almost exclusively conducted in sea cages with good tidal flushing, with a trend for larger cage systems with deeper moorings increasingly offshore.

Wild fish and other aquatic organisms as feed in aquaculture in Europe 213
Seabass and seabream aquaculture has developed more recently and the production of both species groups has tripled over the last decade, reaching around 80 000 tonnes and 97 000 tonnes, respectively, in 2005 (Figures 2 and 4, Table 1). Based mainly in Greece, Turkey and Italy, seabass farming expanded rapidly in the late 1990s but has steadied since 2000. Seabream farming, principally of the gilthead seabream (Sparus aurata), also showed a brief plateau in the early 2000s but continues to increase, largely due to the rapid growth of Turkish production. Both species groups are mainly farmed in sea cages in sheltered areas, although land-based units are also used in France and Spain. Italy traditionally used the “vallicoltura”4 system but has also moved towards intensive production in land-based operations and marine cage farms. Without tidal flushing, cage-farm units in the Mediterranean Sea tend to be smaller than salmon cage farms in the Atlantic.
The production of other marine fish such as turbot, halibut and cod is increasing steadily as technical constraints are overcome (Figures 2 and 4, Table 1). Turbot and Dover sole (Solea solea) are mostly produced in land-based farms on the Atlantic coasts of Spain and France, while cod, halibut and
4 Traditional extensive lagoon-based fish culture
FIGURE 1Atlantic salmon and trout production in Europe, 1999–2005
Source: www.feap.info/feap/aquaculturedata/default_en.asp
300 000
350 000
400 000
450 000
500 000
550 000
600 000
650 000
700 000
750 000
800 000
1999 2000 2001 2002 2003 2004 2005 2006
Prod
ucti
on (t
onne
s)
Y e ar
Atlantic salmon Trout (all species)
FIGURE 2Marine finfish production in Europe, 1996–2005
0
20 000
40 000
60 000
80 000
100 000
120 000
140 000
160 000
1996 1997 1998 1999 2000 2001 2002 2003 2004 2005
Prod
ucti
on (t
onne
s)
Y e ar
Seabass Seabream
0
2 000
4 000
6 000
8 000
10 000
12 000
1996 1997 1998 1999 2000 2001 2002 2003 2004 2005
Prod
ucti
on (t
onne
s)
Y e ar
Halibut Turbot Cod Eels
Source: www.feap.info/feap/aquaculturedata/default_en.asp

Fish as feed inputs for aquaculture – Practices, sustainability and implications214
haddock are farmed in cages in the colder waters of Norway, Iceland and the United Kingdom. Halibut juveniles are reared in land-based tanks until they are 30–40 g before they are stocked into sea cages. Unlike salmon, they prefer sheltered areas with little current movement.
In Europe, eel farms can be found in countries such as Sweden, the United Kingdom, the Netherlands, France, Spain, Denmark, Italy and Greece. Due to the complexity of their life cycle, no one has yet managed to successfully breed European eels (Anguilla anguilla). Instead, eel farms rely on using young eels returning from the Sargasso Sea to grow. Eel culture or farming involves catching juvenile (glass) eels when they enter freshwater and growing them to a marketable size. While 95 percent of eels are grown in freshwater, Italy, the United Kingdom, France and Germany culture eels in brackishwater (4.5 percent of production) and full seawater (0.5 percent). The three main techniques for culturing eels include the use of ponds, accelerated temperature facilities and recirculation systems.
The fattening of bluefin tuna (Thunnus thynnus) has expanded rapidly in the Mediterranean Sea over the last five years. The Mediterranean Sea farmed tuna production in 2004 was approximately 23 000 tonnes (FAO, 2005b), of which around 95 percent was exported to Japan, although the International Commission on Conservation of Atlantic Tuna (ICCAT) reports that there is currently cage capacity of around 41 000 tonnes (for a six-month growing period). This is mostly in Spain (29 percent),
Turkey (23 percent), Croatia (16 percent), Malta (15 percent) and Italy (11 percent), with lower levels of production in Greece and Portugal.
In freshwaters, two species groups predominate, trout and cyprinids (Figures 3 and 4, Table 2). Trout farming is carried out commercially in 23 European states, with annual production exceeding 60 000 tonnes in Norway and 35 000 tonnes in Denmark, Italy, France and Spain, while Finland, Germany, Poland and the United Kingdom each produce
TABLE 1
Marine finfish production in Europe, 1996–2005 (tonnes)
Species 1996 1997 1998 1999 2000 2001 2002 2003 2004 2005
Seabass 22 334 28 433 37 939 46 157 57 811 56 162 61 093 62 060 68 679 80 161
Seabream 31 132 36 843 48 450 60 831 75 232 79 003 79 767 88 340 88 922 97 060
Salmon 403 284 452 702 502 361 591 068 610 947 640 777 671 655 756 744 717 831 712 271
Sea-grown trout 87 941 78 025 94 250 98 219 99 282 119 431 144 270 122 987 108 198 101 680
Halibut – 138 20 503 135 389 350 845 855 905
Turbot – 3 118 3 035 3 466 3 873 4 640 5 320 5 107 6 086 6 865
Cod – – – – 16 41 50 2 550 2 600 n/a
Eels 7 594 8 293 10 738 11 109 11 033 10 284 9 033 8 715 8 340 7 800
Total 552 285 607 552 696 793 811 353 858 329 910 727 971 538 1 047 348 1 001 511 1 006 742
n/a: Data not availableSource: www.feap.info/feap/aquaculturedata/default_en.asp
FIGURE 3Freshwater finfish production in Europe, 1996–2005
0
50 000
100 000
150 000
200 000
250 000
300 000
350 000
400 000
1996 1997 1998 1999 2000 2001 2002 2003 2004 2005
Prod
ucti
on (t
onne
s)
Y e ar
Carps Catfish Trout

Wild fish and other aquatic organisms as feed in aquaculture in Europe 215
TABLE 2Freshwater finfish production in Europe 1996–2005 (tonnes)
Species 1996 1997 1998 1999 2000 2001 2002 2003 2004 2005
Trout 288 483 307 316 332 616 333 473 344 969 360 035 375 346 348 137 338 258 328 816
Carps 67 494 70 343 67 300 75 329 79 300 77 664 72 743 73 265 73 039 72 090
Bighead carp n/a n/a 450 – – – – – – –
Silver carp n/a n/a 2 062 3 648 3 379 3 195 2 580 2 777 3 747 3 950
Common carp n/a n/a 62 550 70 144 73 121 71 669 67 616 68 282 67 936 66 740
Grass carp n/a n/a 2 238 1 587 2 800 2 800 2 547 2 206 1 356 1 400
Catfish 2 067 2 208 2 565 3 359 4 490 4 071 3 756 5 458 5 510 5 470
Tilapias 250 300 300 200 150 150 150 450 450 550
Other freshwater fish 453 568 546 619 595 420 496 528 481 495
Sturgeon 642 572 463 544 265 196 200 230 275 332
Total 359 389 381 307 403 790 413 524 429 769 442 536 452 691 428 068 418 013 407 753
n/a: Data not available.Source: www.feap.info/feap/aquaculturedata/default_en.asp
between 10 000 and 25 000 tonnes. The main species is rainbow trout (Oncorhynchus mykiss), although there is limited production of brook trout (Salvelinus fontinalis) and brown trout (Salmo trutta), and growing interest for arctic char (Salvelinus alpinus). European trout production has been in decline over the last three years, from a high of 375 000 tonnes in 2002 to 329 000 tonnes in 2005. During the same period, the value to trout farmers slipped from €2.26/kg to €2.03/kg for portion-size trout, while large trout rose in value from €2.40/kg to €2.50/kg. The overall first sale value fell from €805.2 million to around €700 million. With a few exceptions, trout production in Europe is poorly organized and is operated by a large number of small, independent farmers. This has led to a production-led rather than a market-led industry, with fragmented sales and decreasing returns to farmers.
Five cyprinid species share the European scene, being the common carp (Cyprinus carpio), the silver carp (Hypophthalmichthys molitrix), the bighead carp (Aristichthys nobilis), the grass carp (Ctenopharyngodon idellus) and the tench (Tinca tinca). Carp farming is mainly in extensive or semi-intensive pond-based systems, the latter being predominantly typical in Central and Eastern Europe. There is a big difference in the production characteristics of Western Europe and Central/Eastern Europe, the latter contributing 76 percent of European cyprinid production in 2005. The total European production dropped from 158 000 tonnes in 1988 to 72 000 tonnes in 2005, the biggest
FIGURE 4Finfish aquaculture production in Europe, 1996–2005
Source: www.feap.info/feap/aquaculture/default_en.asp
2 0 0 0 0 0
4 0 0 0 0 0
6 0 0 0 0 0
8 0 0 0 0 0
1 0 0 0 0 0 0
1 2 0 0 0 0 0
1 4 0 0 0 0 0
1 6 0 0 0 0 0
1 9 9 6 1 9 9 7 1 9 9 8 1 9 9 9 2 0 0 0 2 0 0 1 2 0 0 2 2 0 0 3 2 0 0 4 2 0 0 5
SalmonSeabassFla�ishTilapias
TroutCarpsEelsOther freshwater fish
SeabreamOther marine fishCa�ishSturgeon

Fish as feed inputs for aquaculture – Practices, sustainability and implications216
TABLE 3European per capita seafood consumption (historical and predicted)
Area/Year Historical per capita fish consumption
(kg/person/year)
Forecast Increase
1995–2030
1965 1970 1975 1980 1985 1990 1995 2015 2030 % kg
Western Europe 18.2 18.4 17.4 17.4 19.9 22.2 22.1 26.7 30.1 +36.2 +8
Nordic countries 27.9 30.8 31.7 32.4 32.5 34.0 35.6 38.8 41.7 +17.1 +6.1
Eastern Europe 16.1 20.2 24.3 22.3 25.1 20.6 10.7 25.4 30.8 +187.9 +20.1
Europe average 17.4 19.6 21.1 20.1 22.7 21.7 16.8 26.3 30.8 +83.3 +14.0
Source: Ye (1999)
reductions being seen in the early 1990s and in the major production countries. Part of the reason for these circumstances was the social and economic change occurring in Central and Eastern Europe. However, there are only limited market opportunities available, particularly given the rising availability of other inexpensive food products.
2.2 Future outlook Despite ongoing supply problems and rising prices, the consumption of fish and seafood is forecast to increase in all the major European markets. This is attributed to a number of factors, including the well-documented move towards healthy eating and lifestyles, the recent scares over meat safety, and the increased added-value opportunities for fish and fish products due to demographic and societal changes. Before looking at the outlook for aquaculture production, it is important to understand how demand for seafood might change due to changes in the European population, per capita demand for seafood, and the supply from capture fisheries.
2.2.1 Population growth in Europe The population of the European Union (EU) is likely to fall significantly by 2050, even allowing for inward migration. Deaths will begin to outnumber births across the EU in the next five years, and a collapse in childbirth rates and increased emigration has already caused populations to start shrinking in several of the former communist countries of Eastern and Central Europe that joined the EU in 2004. Eurostat models suggest that by 2013 the population of Italy will start to fall, joined a year later by Germany and Slovenia and, in 2018, by Portugal. The population of Britain will continue to grow, peaking in 2040, followed by 10 years of gentle decline. Overall, the total population of the EU is expected to rise by more than 13 million between now and 2025, although after 2010 that increase will be entirely the result of immigration. By 2025, net migration will not be able to counteract the falling birth rates of the continent, and by 2050 the population of the EU will be 450 million, a decrease of more than 20 million people from the peak. The share of the population over the age of 65 will increase considerably in the EU – the old age dependency ratio (persons aged 65 years and over compared with persons 15–64 years-old) is expected to approximately double by 2050 from the initial 25 percent in 2004. There are rare exceptions: the populations of Ireland, Cyprus, Luxembourg, Malta and Sweden will continue to grow even after 2050.
2.2.2 Per capita food consumptionThe per capita consumption of seafood in Western Europe has increased steadily over the last few decades and is set to rise further by 2030 (Ye, 1999), reaching around 36 kg/person/year (Table 3). Consumption in the Nordic countries, which is higher than elsewhere in Europe, is also likely to increase, but not as much as in Western Europe. In the ex-centrally planned economies (CPEs) of Eastern Europe,

Wild fish and other aquatic organisms as feed in aquaculture in Europe 217
TABLE 4Predicted production from capture fisheries and aquaculture (million tonnes)
Year 2000 2004 2010 2015 2020 2030
Information source FAO statistics* FAOstatistics** SOFIA 2004*** FAO study**** SOFIA 2004*** SOFIA 2004***
Capture fisheries 95 96 93 105 93 93
Marine capture 86 87 87 87 87
Inland capture 9 9 6 6 6
Aquaculture 36 45 53 74 70 83
Total production 131 141 146 179 163 176
Food fish production 96 (73%) 120 (82%) 138 (85%) 150 (85%)
Non-food use 35 (27%) 26 (18%) 26 (15%) 26 (15%)
Source: *FAO (2002); **FAO (2006a); ***FAO (2005c); ****Failler (2005)
consumption dropped dramatically over the 1990s but is expected to increase quickly to nearly 31 kg/person/year.
Per capita fish supply figures from the Food and Agriculture Organization (FAO) of the United Nations (Delgado et al., 2002) for the period 1999–2001 indicate that the 15 EU countries have a per capita supply of 24.2 kg/year; the new EU states, 10.7 kg/year; other countries of Western Europe (The Faroe Islands, Iceland, Norway and Switzerland), 29.9 kg/year; and the countries of Eastern Europe, 3.1 kg/year. The areas of the former Union of the Soviet Socialist Republics (USSR) have a per capita supply of 16.9 kg/year.
2.2.3 Supply from capture fisheries and aquacultureAccording to FAO, total global fish production (capture fisheries plus aquaculture) might increase from 131 million tonnes in 1999/2001 to 146 million tonnes in 2010 and then to 179 million tonnes by the year 2015 (Table 4). This means that growth in global fish production is projected to decline from the annual rate of 2.7 percent of the last decade to 2.1 percent per year between 1999/2001 and 2010 and to 1.6 percent per year between 2010 and 2015. Global capture production is projected to stagnate, while global aquaculture production is projected to increase substantially, albeit at a slower rate than in the past. Out of the expected increase of 48 million tonnes in total global fish production from 1999/2001 to 2015, 73 percent would come from aquaculture, which is projected to account for 39 percent of global fish production in 2015 (up from 27.5 percent in 1999/2001).
TABLE 5Regional share of total food-fish production %, 1973–1997 (actual) and 2020 (projected)
Region Actual annual production (%) Projected (%)
1973 1985 1997 2020
Europe (subtotal) 30 23 11 9
EU-15 13 9 6 5
Eastern Europe and former USSR 17 14 5 4
China 10 13 36 41
Other Asia 17 19 21 21
Latin America 5 6 7 7
West Asia and northern Africa 1 2 2 2
Sub-Saharan Africa 4 4 4 5
United States of America 4 6 5 4
Japan 17 14 6 4
Other 12 13 8 7
Total 100 100 100 100
Source: Delgado et al. (2002)

Fish as feed inputs for aquaculture – Practices, sustainability and implications218
TABLE 6
Historical and forecasted aquaculture output in Europe
Country Historical output (tonnes)
Actual annual growth rates (%)
Forecast 2000–2020
2000 2004 1980–1990 1990–2000 Output 2020 (tonnes)
Annual growth (%) 2000–2020
Spain 315 321 363 181 0.4 3.8 361 017 0.7
France 261 216 243 907 2.0 0.8 307 497 0.8
Italy 213 054 117 786 7.1 3.5 279 363 1.0
United Kingdom 159 267 207 203 30.0 11.5 168 241 0.3
Europe-15 1 314 017 – 4.0 3.5 1 539 664 0.8
Norway 493 111 637 993 31.1 13.2 1 620 000 6.3
Europe 2 067 068 2 205 649 6.9 3.2 3 557 000* 4.8*
*author’s estimateSource: Brugère and Ridler (2004)
Within these global figures, the proportion of fisheries production from Europe is of particular interest. The International Food Policy Research Institute (IFPRI) has projected that the total European share of food-fish production will drop from 30 percent in 1973 to 9 percent in 2020 (Delgado et al., 2002). Of this, the relative importance of capture fisheries production in the EU-15 Member States is projected to drop from 79 percent in 1997 to 71 percent in 2020 (Table 5).
2.2.4 Outlook for European aquaculture Aquaculture is now a maturing industry in Europe, especially for the established species such as salmon and trout. Past sectoral growth has been driven by the development of breeding and grow-out technologies for new species and their adoption by the commercial sector. A brief look at Figure 4 shows the steady climb in production up until 2003 and the apparent plateau in production to date. This flattening in production reflects (i) a decline of around 45 000 tonnes of United Kingdom and Faroese salmon production and (ii) a similar decline in trout production since 2002. Other species, especially seabass and seabream, continue to expand as more eastern Mediterranean countries adopt the technology, and prices recover from a slump in 2002–2003.
Delgado et al. (2002) forecast that the pre-2004 accession EU Member States would see a growth rate approximating that of global output but this appears optimistic. Brugère and Ridler (2004) forecast that growth from 2000 to 2020 would be less than 1 percent for most of Western Europe, with the exception of Norway, which is committed to its aquaculture sector as a means of maintaining isolated communities (Table 6). While these figures must be used with some caution, they do emphasize that aquaculture expansion in Europe will not continue at historical rates.
Based on a regression analysis of trends of growth in European aquaculture, this study has projected European aquaculture production in 2015 (Table 7 and Figure 5). Two scenarios are given, one (S1) based on trends over 1996–2005 and the second (S2) on trends over 2001–2005.
Both scenarios broadly agree on the species that show a constant trend since 1996 but differ where there has been a sharp up or down trend in production over the last five years. In particular, salmon and trout have both shown a slowdown over the last five years, and this is reflected in scenario 2 (S2). Based on this latter scenario, which is considered to be the most realistic, European aquaculture is likely to reach production of 1.57 million tonnes by 2015, an overall increase of 2 percent per year. This seems reasonably realistic, although it may be an underestimate if Norwegian production increases at a greater rate than the rest of Europe. Other studies are more optimistic than this study – an estimate based on Brugère and Ridler (2004) indicates an increase of 4.8 percent, mainly driven by an increase in Norwegian production.

Wild fish and other aquatic organisms as feed in aquaculture in Europe 219
Sustaining growth is a challenge, as there are a number of key constraints that may limit expansion of aquaculture. These are briefly reviewed below:
• Environmental: The major constraint to the expansion of aquaculture is the lack of suitable sites for new development and the need to ensure that existing sites are used in a sustainable manner. In many northern European countries, such as the United Kingdom and Denmark, gaining planning permission for both coastal and freshwater sites is increasingly difficult in a highly regulated environment. This has led to investigation into new cage technologies for deeper, more exposed sites, larger production units and improved diets with greater digestibility and less waste. There is also a trend towards less intensive farming techniques that are compatible with maintaining wetlands important for nature conservation at a favourable conservation status. Another emerging restraint is the need to use genetically benign species that will not impact on local fish populations if they escape.
• Market: Achievable ex-farm prices are critical to determining the economic viability of farming ventures and thus the uptake of evolving and often increasingly expensive aquaculture technology. It is important to understand the extrinsic factors that affect European aquaculture economics, such as competition from Chilean salmonid production. The
TABLE 7
Past, current and predicted European aquaculture production (tonnes)
Species 2000
Tonnes
2005
Tonnes
2015
S1 S2
Tonnes Increase** Tonnes Increase**
Seabass 57 811 80 161 136 968 171% 132 332 165%
Seabream 75 232 97 060 175 589 181% 140 941 145%
Salmon 610 947 712 271 1 149 081 161% 926 852 130%
Trout 444 251 430 496 567 256 132% 264 112 61%
Halibut 135 905 1 970 218% 2 513 278%
Turbot 3 873 6 865 11 349 165% 11 863 173%
Cod 16 2 600* 11 031 424% 14 032 540%
Eels 11 033 7 800 7 984 102% 2 041 26%
Carps 79 300 72 090 79 929 111% 60 738 84%
Catfish 4 490 5 470 9 957 182% 10 315 189%
Tilapias 150 550 677 123% 1 670 304%
Other freshwater fish 595 495 444 90% 646 131%
Sturgeon 265 332 -255 -77% 663 200%
Total 1 288 098 1 417 095 2 151 979 152% 1 568 718 111%
*2004 data ** Increase /decrease from 2005.Source: Delgado et al. (2002)
FIGURE 5Past, current and predicted European
aquaculture production (tonnes)
Source: Delgado et al. (2002)
200 000
400 000
600 000
800 000
1 000 000
1 200 000
2000 2015(S1)
Prod
ucti
on (t
onne
s)
Y e ar (s c e n ario )
Seabass SeabreamSalmon TroutHalibut TurbotCod EelsCarps CatfishTilapias Other freshwater fish
Sturgeon
2005 2015(S2)

Fish as feed inputs for aquaculture – Practices, sustainability and implications220
markets for farmed fish have also been affected by persistent negative publicity over the safety of farmed fish, e.g. the possible health risks associated with high levels of persistent organic pollutants (POPs) in salmon cultivated in Europe (Hites et al., 2004).
• Raw material: Allied to the last point above, variability in raw material costs and availability are increasingly important in dictating aquaculture viability. The main input is fish feed, especially for the high-protein diets that are required for over 95 percent of European finfish production. The demand for fishmeal and fish oils from developing economies such as China has a profound impact on feed prices as they operate within a commodity market. A shortage of fishmeal imports into the United Kingdom during 2003 and 2004 was one of the primary reasons for the dip in salmonid production over those years.
• Implications for food security and poverty alleviation: As discussed above, the demand for seafood products from Europe will remain strong, and with most capture fisheries reaching or exceeding their sustainable yield, aquaculture is expected to provide an increasing proportion of raw material for human consumption. However, when compared with developing regions, aquaculture in Europe does not make a strong contribution to food security or poverty alleviation. In terms of food security, the vast majority of aquaculture products (e.g. salmon, trout, seabass, seabream) are relatively high-value species that reflect the high cost of their high-protein dietary requirements and, therefore, cannot be considered as a “basic” food commodity5. Essentially, they are luxury items that compete with other similarly placed products in the market. It is possible that as aquaculture contributes a greater proportion of seafood products in Europe, the cost of production might fall to allow greater economic access to aquaculture products, but this is unlikely to contribute to improved food security on an individual basis. However, it might mean a reduced need to source fish products from outside of Europe and thus contribute to food security on a world level.
Regarding poverty alleviation, the intensive nature of European aquaculture means that there is only a minor contribution to improving the economic well-being of poor communities. Despite this, there is no doubt that aquaculture does have an important role to play in rural communities, both for remotely located intensive aquaculture (e.g. the highlands and islands of Scotland) and for the low yield, semi-extensive aquaculture practiced in places such as the Po River delta6 in Italy. There are also upstream and downstream employment dependencies in feed fisheries and processing, respectively, with the latter providing opportunities to replace those lost as white fish processing contracts.
3. USE OF FISH AND OTHER AQUATIC SPECIES AS FEED FOR AQUACULTURE AND ANIMAL FEEDS IN EUROPEIn Europe, there are three main sources of marine-based raw material for aquaculture and animal feeds:
• feedfish caught in European waters for reduction into fishmeal; • feedfish caught outside European waters for reduction into fishmeal; and• trimmings, fish off-cuts, offal and landed bycatch for reduction into fishmeal.The only direct use of whole, unprocessed fish for aquaculture (i.e. “trash fish”) is
5 “All people at all times have both physical and economic access to the basic food they need.” (FAO Committee on World Food Security).
6 Valliculture (vallicoltura) was developed by the upper Adriatic populations to exploit the seasonal migrations of some fish species from the sea into the lagoon and delta areas, which were more suitable for their growth. Large brackish areas were enclosed to prevent the fish returning to the sea and complex permanent capture systems (fish barriers) were developed to catch the adults. Many such systems are now supported by artificial hatcheries.

Wild fish and other aquatic organisms as feed in aquaculture in Europe 221
in tuna fattening in the Mediterranean Sea. This section examines the nature and source of the raw materials used as well as the subsequent utilization of fishmeal and fish oils in Europe.
3.1 Landing of fish and other aquatic species destined for reductionFish destined for reduction into fishmeal and fish oil for use by the European aquaculture industry originate from either (i) the feed fisheries within European waters themselves or (ii) external fisheries, such as the anchovy and chub mackerel fisheries of South America or to a lesser extent, the Antarctic krill fisheries. The choice of where aquafeed compounders purchase their fishmeal depends largely upon the following:
• Price: Fishmeal is a global commodity whose price is interlinked with that of its main competitor, soybean meal. The level of substitution within fish feeds is limited, however, and varies between different dietary formulations (i.e. for starter, grower and finisher diets). Therefore, feed manufacturers can increase or decrease fishmeal incorporation levels within predefined limits.
• Quality: Quality is an important factor that also has an influence on price. The quality of fishmeal depends upon its freshness (measured by its volatile nitrogen content at conversion), the process used (e.g. processing temperature) and the stabilization techniques used.
• Specification: Fishmeal from North Atlantic stocks tends to be higher in protein content (68–71 percent) than southern hemisphere fishmeal (65–68 percent), reflecting the species used. Northern hemisphere fishmeal tends to have higher levels of digestibility – for instance, an Icelandic 71 percent protein meal from capelin/herring with a digestibility of 92 percent gives 65.2 percent digestible protein (DP) as against only 58.8 percent DP from the best Chilean sardine meal. Certain fishmeals (e.g. high performance feeds for some species/growth stages) might be selected to achieve a particular amino acid profile.
• Contamination levels: POPs accumulate in oily fish and have become a major food safety issue in Europe. Fishmeal sources from oceanic pelagic stocks in South America tend to have less POPs that those from the continental shelf stocks in the northeastern Atlantic. Although the resultant meals have to be within legal limits – and the technology exists to reduce them further through filtration – this may have an influence on purchasing.
• Usability: Individual feed producers’ machinery characteristics can rule out the use of fishmeal from some origins.
There are no published figures on the proportion of fishmeal used for European aquaculture that is sourced from South America rather than from Europe’s own feed-fish stocks. A recent report on the sustainability of feeds for the Scottish fish-farming industry (Huntington, 2004) suggests that around 54 percent of feed fish-derived fishmeal is currently derived from northern hemisphere sources, 28 percent from southern hemisphere sources and the balance from whitefish trimmings and pelagic offal (Table 8).
Table 8 examines the recent (2003) and predicted (2010) use of fishmeal and fish oil by Scottish aquaculture. These figures, which have been produced by the industry, indicate a number of interesting trends:
• A small (5 percent) increase is predicted in the southern hemisphere proportion of fishmeal by 2010.
• The relative contribution of trimmings and offal to fishmeal and fish oil production will remain around the same.
• Oilseed and legume-derived meals will increase from 17 percent to 24 percent of the total fishmeal protein source contribution, mostly at the expense of northern hemisphere fishmeal.

Fish as feed inputs for aquaculture – Practices, sustainability and implications222
TABLE 8Current and predicted fishmeal and fish oil utilization by Scottish aquaculture (tonnes)
A. Fishmeal and protein
YearWhole fishmeal Protein derivatives
Northern hemisphere
Southern hemisphere
Trimmings and offal
Oilseeds and legumes Gluten
2003 53 140 38% 27 600 20% 16 900 12% 24 400 17% 19 250 14%
2010 44 500 29% 30 100 19% 16 000 10% 38 000 24% 27 200 17%
B. Oils
YearFish oil
Vegetable oilsNorthern hemisphere
Southern hemisphere
Trimmings and offal
2003 41 200 65% 10 600 17% 11 000 17% 300 0.5%
2010 31 300 41% 13 000 17% 12 000 16% 20 000 26%
Source: J Nelson, Agricultural Industries Confederation (AIC), personal communication, 2004
• The relative contribution of southern hemisphere oil supplies will remain unchanged.
• Vegetable oils will become an important source of oils in Scottish aquafeeds, accounting for nearly a quarter of the total by 2010, again at the expense of northern hemisphere feed-fish supplies.
The main species used are primarily small pelagic species that are characterized by early maturation and high fecundity. Their populations respond quickly and strongly to changes in environmental conditions, which increases the uncertainty of stock forecasts, especially in eastern Pacific waters that are vulnerable to the “El Niño” effect.
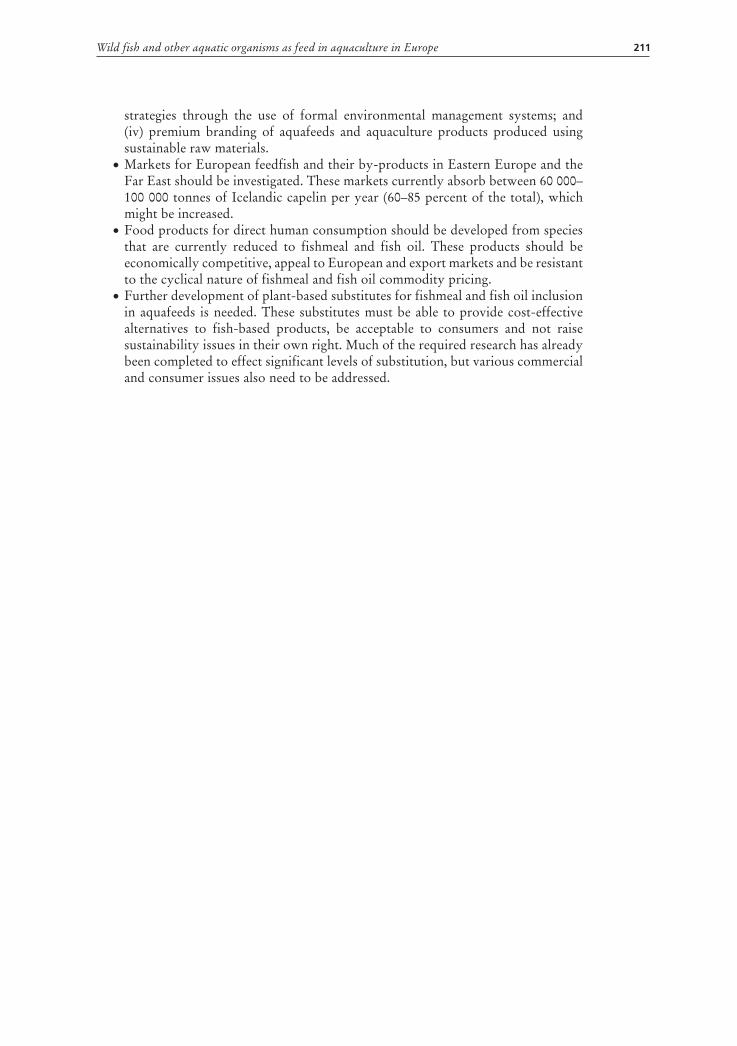
The main species used for fishmeal reduction from European stocks are capelin, blue whiting and sand eel and lesser volumes of Norwegian pout (Figure 6). Landings of these species by the different European countries are shown in Table 9. In addition, the table shows data for a number of other species that are used for both feedfish and for direct human consumption. Peruvian anchovy and Chilean jack mackerel are both imported from South American sources for use in European fish feed, and Poland and Ukraine both use Antarctic krill as a fishmeal source.
3.1.1 European fish species reduced for fishmeal and fish oilsBlue whiting (Micromesistius poutassou): The blue whiting is a pelagic gadoid (i.e. of the cod family), which is widely distributed in the eastern North Atlantic. Its biology is reasonably well known, and a management plan has been formulated and accepted, with annual quotas set in December 2005. However, fishing mortality remains unacceptably high, far above sustainable rates; populations have only been sustained by recent good year classes, and the International Council for the Exploration of the Sea (ICES) currently considers this fishery to be harvested unsustainably. The dispute over catch allocation has led to the last quota of 650 000 tonnes set by the North East Atlantic Fisheries Commission being exceeded four-fold; fishers caught 2.3 millon tonnes in 2003. It should be argued that until the management plan is implemented and total allowable catches (TACs) fall within the agreed level, this species cannot be recommended as a component stock of fishmeal or fish oil. This issue with blue whiting is recognized by the fishmeal industry, which fully supports implementation of the proposed management plan, yet has relatively little influence in the progression of its adoption (A. Chamberlain, FIN, personal communication, 2006).
Capelin (Mallotus villosus): The capelin is a small pelagic species whose biology is reasonably well known. There are two main stocks in the Barents Sea and Iceland.
Wild fish and other aquatic organisms as feed in aquaculture in Europe 223
TAB
LE 9
Lan
din
gs
of
Euro
pea
n f
eed
-fis
h s
pec
ies
in 2
004
(to
nn
es)
Co
un
try
Prim
arily
(>
70%
) fe
ed f
ish
erie
sM
ixed
fee
d a
nd
fo
od
fis
her
ies
Tota
l
Blu
e w
hit
ing
Cap
elin
San
d e
elN
orw
egia
n
po
ut
An
tarc
tic
krill
Sub
tota
lA
tlan
tic
her
rin
gSp
rat
Euro
pea
n
pilc
har
dA
tlan
tic
ho
rse
mac
kere
l
Euro
pea
n
anch
ovy
Sub
tota
l
Ap
pro
xim
ate
pro
po
rtio
n u
sed
fo
r fi
shm
eal
Ap
pro
xim
ate
pro
po
rtio
n u
sed
fo
r fi
shm
eal
>95
%c.
95%
100%
100%
c. 7
0%<
30%
<50
%c.
50%
<20
%n
/a
Bu
lgar
ia–
2 88
9 88
2
977
2 97
7
Cro
atia
–16
357
5
044
21 4
01
21 4
01
Den
mar
k 8
9 50
0 29
9 60
6 13
646
40
2 75
2 13
6 80
9 27
4 12
9 23
955
6
936
441
829
844
581
Esto
nia
– 27
358
37
306
64
664
64
664
Faer
oe
Isla
nd
s32
2 32
2 33
078
3
476
1 15
9 36
0 03
5 50
106
3
867
53 9
73
414
008
Fin
lan
d–
71 2
14
16 5
88
87 8
02
87 8
02
Fran
ce 1
9 47
6 16
2 19
638
36
558
19
5 31
450
12
828
16
215
97
246
11
6 88
4
Ger
man
y 1
5 29
3 2
658
107
18 0
58
70 5
86
26 3
53
1 39
8 22
938
12
1 27
5 13
9 33
3
Gre
ece
– 13
8 9
217
609
13 4
04
23 3
68
23 3
68
Icel
and
422
079
524
516
946
595
224
580
224
580
1 17
1 17
5
Irel
and
75
393
75 3
93
26 2
34
4 09
6 13
000
26
432
69
762
1 4
5 15
5
Ital
y–
58 2
61
58 2
61
58 2
61
Latv
ia–
23 5
59
52 3
99
75 9
58
75 9
58
Lith
uan
ia–
1 84
5 6
185
13 7
74
21 8
04
21 8
04
Net
her
lan
ds
95
311
95 3
11
129
643
118
46 7
70
66 6
78
3 24
3 21
2 33
8 52
3
No
rway
957
684
49 0
09
48 6
67
7 49
8 1
062
858
616
221
1 52
6 10
747
62
8 49
4 1
691
352
Pola
nd
345
1
8 96
7 9
313
27 9
14
95 7
98
123
712
133
025
Port
ug
al 3
973
3
973
75 9
28
20 7
61
664
97 3
53
101
326
Ro
man
ia–
1 35
0 13
5 1
485
1 4 8
5
Ru
ssia
n
Fed
erat
ion
346
762
1 75
7 77
5 34
9 29
4 12
3 24
2 39
433
7
851
14 8
73
185
399
534
693
Spai
n 2
9 02
1 10
24
2
9 05
5 1
64
353
20
615
84
969
11
4 02
4
Swed
en 1
9 08
3 34
607
88
53
778
89
032
90
724
56
80
0 18
0 61
2 23
4 39
0
Un
ited
K
ing
do
m57
028
59
5 13
57
636
96
298
3
883
2 68
2 12
244
11
5 10
7 17
2 7 4
3
Ukr
ain
e12
261
12
261
30
894
28
053
9
383
68 3
30
80 5
91
Tota
l2
4 53
270
608
370
389
796
22 5
11
22 0
03
3 49
5 95
0 1
751
199
684
005
297
115
201
859
159
395
3 09
3 57
3 6
589
523
Sou
rce:
Der
ived
fro
m F
AO
cap
ture
fis
her
ies
dat
a (F
AO
, 200
6a)

Fish as feed inputs for aquaculture – Practices, sustainability and implications224
The fishery is based upon maturing capelin of ages 3 and 4, and the abundance of the immature component is difficult to assess before recruitment to the adult stock at ages 2 and 3. Given that recruitment is highly dependent upon environmental variables, its high spawning mortality and its importance as a forage fish, a precautionary approach to capelin management is required. Given that immature capelin were absent in autumn 2004 and winter 2005 surveys, the Icelandic quota for the 2005/2006 season was 194 000 tonnes, compared with 803 000 tonnes for the previous year of 2004/2005. The Norwegians closed the capelin fishery entirely for 2006.
Sand eel (Ammodytes spp.): The main elements of sand eel ecology and population structure in the North Sea have been well researched, although the nature of local subpopulations may be less well described. The high natural mortality of sand eel populations and the few year classes make stock size and catching opportunities largely dependant upon incoming year classes, which complicates forward-looking management. The linkages between feed fisheries and non-target species have been investigated, but the complex nature of marine ecosystems means that there is still only a partial understanding of the relationships and interactions, thus indicating a need to be precautionary in the management of this stock. The fisheries are implemented under strictly controlled conditions with high compliance levels. The fishery has a high number of participants that constrains the level of reinvestment but does assist in the redistribution of wealth within the sector and restricts efforts into other fisheries. Most of the vessels and fishmeal plants are operated within a share system. At present, the North Sea sand-eel stocks are considered by ICES to have reduced reproductive capacity and the EU Fisheries Council has set an effort limit of 20 percent of the 2004 effort.
Norwegian pout (Trisopterus esmarki): Fishing the stocks in the North Sea and Skagerrak-Kattegat Seas directed fishery was banned over 2005 (extended into 2006) except for when caught as unavoidable bycatch, as the stock biomass is below the sustainable limit reference point (Blim). Catches in ICES Area Via (West Scotland) of small-meshed Danish vessels are highly variable and the state of the stock is unknown. The directed fishery has a history of bycatch of blue whiting, haddock, whiting and herring (ICES, 2005), and Norwegian pout is itself vulnerable as a bycatch to the blue whiting fishery.
Atlantic horse mackerel (Trachurus trachurus): The Atlantic horse mackerel has three main stocks – North Sea, western and southern. Most of the catch destined for
FIGURE 6Landings of European feed-fish species, 2004
Source: FAO (2006a)
1 751 199
684 005
297 115201 859 159 395
2 453 270
608 370389 796
22 511 22 003
500 000
1 000 000
1 500 000
2 000 000
2 500 000
3 000 000
Ann
ual l
andi
ngs (
tonn
es)
Atlantic horse mackerel
Antartic krill
Atlantic herring
Blue whitin
g
Norwegian pout
European pilchard
European anchovy
Sand eel

Wild fish and other aquatic organisms as feed in aquaculture in Europe 225
fishmeal is bycatch from other pelagic fisheries, although there is a directed fishery in western waters. The stock is dependent upon infrequent and very high recruitment pulses, the last major one being in 1982. The current TAC is considered to be too high to sustain the fishery, especially in combination with high levels of juvenile mortality from fishing. Information on the Atlantic horse mackerel’s interactions with other species is limited, but it is known to be an important predator of juvenile herring.
3.1.2 Non-European fish species reduced for fishmeal and fish oils for use in EuropeGiven that South American fishmeal represents an important component of European aquafeed, it is appropriate that the two main feed-fish species, Peruvian anchovy and Chilean jack mackerel, are included in the species listed for consideration, as is Antarctic krill.
Peruvian anchovy (Engraulis ringens): There is considerable research into the stock ecology and biology and the impacts of fishing, but much of the resulting information is contained in grey literature, difficult to compile and subject to quality assessment. There are also apparent gaps in the information on the effects of fishing on the different stocks’ reproductive capacity. Funding limitations have also severely restricted the ability of resident researchers to examine the wider ecosystem implications for stock removal and the impacts on non-target species. In addition, compared with the Danish sand-eel fishery, it is difficult to assess the success of Peruvian monitoring efforts, and compliance levels are less well documented. In the absence of this information, it is difficult to conclude whether the fishery is currently sustainable or not. The recently introduced Individual Tradable Quota (ITQ) system, together with 100 percent sampling of landings by an independent certification company, has induced rationalization into the previously unconstrained fleet structure, and further reductions in capacity are expected. A recent international conference (Lankester, 2005) concluded that the efforts by the Peruvian authorities to control the fishery have been under-reported, although further work was needed to integrate the socio-economic effects of the fishery, as well as ecosystem components, into stock management.
Chilean jack mackerel (Trachurus murphyi): Recruitment into this stock is highly subject to environmental and climatic conditions (in particular the El Niño event) and is thus difficult to assess. However, this stock it is generally considered to be overfished, with an increasing proportion of smaller fish being caught. It is recovering from previous overfishing and has still to recover to previous (1996) levels, despite tight controls on effort.
Antarctic krill (Euphausia superba): In the Antarctic, both Ukrainian and Polish vessels fish Antarctic krill (often as third-parties to Japanese ventures), of which 70 percent is destined for reduction into fishmeal. Krill is central to the Antarctic marine food web, as most organisms are either direct predators of krill or are just one trophic level removed. Traditional, single-species fisheries management principles are not applicable to the Antarctic krill fishery due to the key role of this species in the southern ocean food web. A multi-species management approach is necessary to take into account potential impacts on krill-dependent predators and the Antarctic marine environment as a whole, in case of an expansion of the krill fishery. Although krill catches in the southern ocean are currently well below Commission for the Conservation of Antarctic Marine Living Resources (CCAMLR) catch limits, there is potential for a rapid expansion of the fishery in future years, as krill processing technology develops and demand for krill products increases (CCAMLR, 2004). There is also concern over the impact of global warming, as this could affect krill recruitment and krill stock size in the long term.

Fish as feed inputs for aquaculture – Practices, sustainability and implications226
3.1.3 Trash fish and other fishery by-productsUse in production of fishmeal and fish oils: In Europe, trimmings from other fisheries represent around 33 percent of the total supply of raw material to the fishmeal and fish-body oil industry (IFFO, 2002). It is estimated that 80 percent of the trimmings from fish processing enter the fishmeal and fish-body oil industry in Denmark, although the figure is only 10 percent in Spain. In the United Kingdom, Germany and France, between 33 and 50 percent of fish trimmings enter the fishmeal and fish body oil industry (Table 10).
The United Kingdom and German dependence on whitefish trimmings has fallen. This is in response to a decline in whitefish supplies and a reduction in “black fish”. In contrast, a greater proportion of supplies are now derived from pelagic trimmings, where the state of raw material supply is healthy. Salmon also increasingly provides an added source of supply to United Kingdom fishmeal plants, but this fish can no longer be allowed to re-enter the food chain for aquaculture. The introduction of a number of animal by-products regulations7 by the European Commission (EC), together with the feed industry’s own initiatives, have constrained the use of fishmeal and fish-derived waste in both aquaculture and agriculture feeds as a result of concerns over the cross-species transmission of pathogens.
Direct use in tuna farming: In most Mediterranean countries, the tuna farming season extends for about six to seven months, starting typically in June. ICCAT routinely uses a default 25 percent factor for the back calculation of farm inputs from tuna farm production figures – on the assumption that 25 000 tonnes of bluefin tuna were put in cages during 2004, for a feeding period of 180 days and a daily ration of 5 percent, it is estimated that 225 000 tonnes of feedfish were used on tuna fattening farms in the Mediterranean Sea over 2004. A large percentage of the fish feed utilized in the Mediterranean tuna farming industry is imported frozen from outside the region (over 95 percent of total baitfish in the case of Turkey; Lovatelli, 2003). The precise specific composition of feedfish is not known in most cases, but Lovatelli (2003) lists the small pelagic species used as including sardine (Sardina pilchardus), round sardinella (Sardinella aurita), herring (Clupea spp.), mackerel (Scomber scomber) and horse mackerel (Trachurus spp.). These fish originate mostly from the North Sea/Baltic region and the West African upwelling system.
7 EC Disposal, Processing and Placing on the Market of Animal By-products Regulations (SI 257, 1994); EC Regulation No. 1774/2002 of the European Parliament and of the Council of 3 October 2002 laying down health rules concerning animal by-products not intended for human consumption (recently amended by Commission Regulation (EC) No. 808/2003 of 12 May 2003); and the Commission Regulation (EC) No. 811/2003 on the intra-species recycling ban for fish.
TABLE 10
Raw material sources for fishmeal and fish body oil in the EU-15, 2002
Country Feedfish (tonnes)
Trimmings (tonnes)
Total raw material supply (tonnes)
Utilization of trimmings (%)
Denmark 332 000 33 200 365 200 10
United Kingdom 7 800 42 500 50 300 84
Spain 42 000 42 000 100
Sweden 18 750 6 250 25 000 25
France 25 000 25 000 100
Ireland 8 800 13 200 22 000 60
Germany 17 000 17 000 100
Italy 3 000 3 000 100
Total 367 350 182 150 549 500 33
Source: Adapted from IFFO (2002)

Wild fish and other aquatic organisms as feed in aquaculture in Europe 227
3.2 Fishmeal and fish oil production and trade3.2.1 ProductionIn Europe, fishmeal and fish body oils are derived from directed fisheries for feedfish (providing 67 percent of raw material) and trimmings produced as by-products of processing fish for human consumption (providing 33 percent of raw material). Fishmeal is produced by cooking the fish, before pressing them to remove water and body oil, and finally drying them at temperatures of between 70 to 100 ºC depending upon the meal type manufactured. After extraction from the fishmeal, fish body oils are purified through centrifugation. Fish oil represents around 5–6 percent of the total raw material body weight.
In Europe, around 1.1 million tonnes of fishmeal are produced per year (Table 11). Denmark is the largest producer (30 percent), followed by Iceland (23 percent) and Norway (10 percent). Denmark also produces more than half of Europe’s fish oil (51 percent), with Norway being the only other significant producer (27 percent).
3.2.2 ImportsEurope is a net importer of fishmeal (~1.6 million tonnes) and fish oil (~240 000 tonnes), although this is a rather simplistic interpretation, as there are significant international product flows based on product specification and price (Figure 7). Norway imports almost half of total European exports (Table 11) and 52 percent of its own net usage. The United Kingdom is the largest importer of fishmeal, of which Iceland (22 percent), Norway (16 percent) and Denmark (12 percent) are the main European sources, and imports represent around three-quarters of all fishmeal usage. South American fishmeal currently accounts for around 19 percent of the United Kingdom’s imports, but the amount can vary from year to year and may occasionally increase to around 30 percent. Likewise, Germany only produces a small fraction (7 percent) of its own usage. Norway and Denmark are major European fishmeal producers but also import 64 percent and 41 percent, respectively, of their fishmeal needs. In total, fishmeal imports and consumption are known to have fallen markedly in 2003 and 2004 and are down 18 percent against the preceding years. This is as a result of the ban on the use of fishmeal in ruminant feed.
3.2.3 ExportsDenmark exports around 30 percent of its product to the southern countries within the EU (Greece and Italy) and a further 15 percent to Norway. The remaining 55 percent is exported to a number of Far Eastern countries where there is a high demand for high-quality meal and oils. Denmark exported an average of 269 886 tonnes of fishmeal over 2001–2003 and 92 536 tonnes of fish oil (Table 11). The main European exporters of liver oils in 2003 were Norway (1 820 tonnes), Spain (1 940 tonnes) and Portugal (311 tonnes). Most of these oils are cod liver oils. Spain also exports between 900 and 2 500 tonnes of high grade “industrial” shark oils, which are exported to Japan. This is equivalent to 4 500 to 14 000 tonnes of shark (live weight).
0
200
400
600
800
1 000
1 200
1 400
1 600
1996 1997 1998 1999 2000 2001 2002 2003 2004
Year
F is hm eals F is h o ils
Imp
ort
s (t
ho
usa
nd
ton
nes
)
FIGURE 7European imports (net) of fishmeal and
fish oil, 1996–2004
Source: FIN (2004)

Fish as feed inputs for aquaculture – Practices, sustainability and implications228
TAB
LE 1
1Im
po
rt, p
rod
uct
ion
an
d e
xpo
rt o
f fi
shm
eal,
fish
oil
and
fish
was
te b
y Eu
rop
ean
co
un
trie
s (2
001–
2003
ave
rag
e)
Co
un
try
Imp
ort
sPr
od
uct
ion
Exp
ort
s (i
ncl
ud
ing
re-
exp
ort
s)
Fish
mea
lFi
sh o
ilFi
sh w
aste
Fish
mea
lFi
sh o
ilFi
shm
eal
Fish
oil
Fish
was
te
ton
nes
%to
nn
es%
ton
nes
%to
nn
es%
ton
nes
%to
nn
es%
ton
nes
%to
nn
es%
Bu
lgar
ia4
445
03
016
0
0
0
0
– 0
0
Cro
atia
11 3
98
15
013
0
510
018
0
0
14
0
0
Den
mar
k14
2 03
6 11
30 0
46
753
1 57
4 53
350
356
3011
4 60
5 51
269
886
3492
536
60
52 6
58
9
Esto
nia
2 97
3 0
5 0
34
03
600
0
03
791
023
0
4 27
1 1
Faro
e Is
lan
ds
151
02
710
179
838
8
40 9
50
499
4 0
40 9
36
599
4 1
137
917
24
Fin
lan
d20
358
2
3 15
8 1
25 1
74
3
0
023
0
4 0
141
0
Fran
ce54
621
4
36 3
40
810
061
1
32 3
50
34
433
219
560
2
18 5
39
127
191
1
Ger
man
y19
5 34
7 15
11 8
43
355
095
5
14 1
48
15
857
319
9 89
0 25
6 60
0 4
3 96
1 1
Gre
ece
85 4
74
79
235
22
028
02
635
0
02
635
014
6 0
18
0
Icel
and
37
017
7 0
138
561
1426
7 75
0 23
1 54
0 1
51 8
92
77
200
576
524
13
Irel
and
8 71
1 1
51
012
999
1
17 8
67
24
167
217
805
2
1 0
6 73
1 1
Ital
y73
161
6
18 5
95
41
681
03
361
0
05
253
197
0
1 33
0 0
Latv
ia3
319
01
03
402
05
432
021
0
5 38
9 1
677
063
0
Lith
uan
ia16
027
1
622
01
892
010
169
1
0
10 1
69
151
4 0
13
0
Mal
ta1
519
09
017
0
0
0
0
0
8 0
Net
her
lan
ds
78 5
76
644
737
10
3 18
4 0
0
0
15 4
74
212
790
8
9 26
7 2
No
rway
140
411
1120
9 61
5 48
100
271
1022
0 96
7 19
59
100
2793
900
12
2 24
4 1
221
956
39
Pola
nd
16 3
69
11
082
068
9 0
1 23
1 0
0
15 9
61
21
02
379
0
Port
ug
al12
437
1
553
041
2 0
2 91
8 0
95
097
8 0
902
111
5 0
Ro
man
ia20
306
2
16
03
027
7 0
0
11
0
0
0
Ru
ssia
n
Fed
erat
ion
114
673
995
8 0
3 05
2 0
37 4
71
31
940
15
507
132
1 0
18 4
53
3
Spai
n95
573
7
21 1
01
55
095
110
1 82
2 9
14 6
14
720
373
3
3 35
1 2
6 15
0 1
Swed
en1
642
037
7 0
7 81
9 1
0
4 57
1 2
3 33
6 0
5 07
6 3
19 1
11
3
Ukr
ain
e6
365
034
0
21
0
0
01
625
011
0
114
0
Un
ited
Kin
gd
om
203
375
1643
718
10
19 7
68
248
800
4
10 6
00
510
096
1
1 32
7 1
6 26
1 1
Tota
l 1
309
303
100
434
991
100
1 00
2 69
8 10
01
162
614
100
222
555
100
794
491
100
153
366
100
574
631
100
Sou
rce:
FA
O (
2005
a)
Wild fish and other aquatic organisms as feed in aquaculture in Europe 229
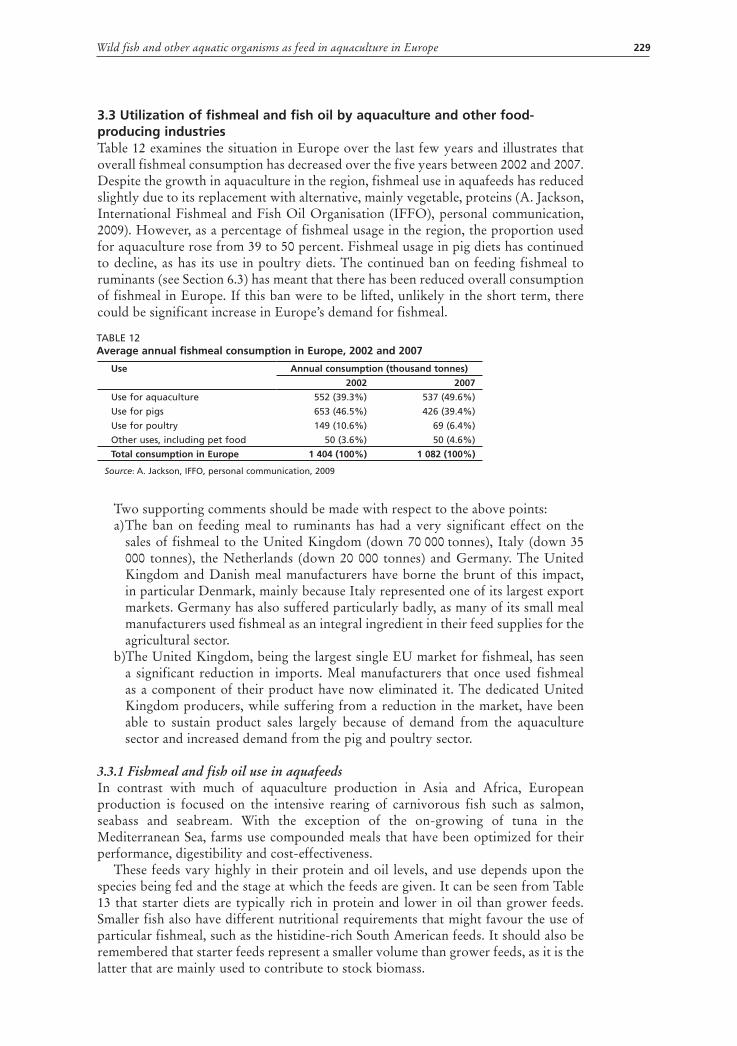
3.3 Utilization of fishmeal and fish oil by aquaculture and other food-producing industriesTable 12 examines the situation in Europe over the last few years and illustrates that overall fishmeal consumption has decreased over the five years between 2002 and 2007. Despite the growth in aquaculture in the region, fishmeal use in aquafeeds has reduced slightly due to its replacement with alternative, mainly vegetable, proteins (A. Jackson, International Fishmeal and Fish Oil Organisation (IFFO), personal communication, 2009). However, as a percentage of fishmeal usage in the region, the proportion used for aquaculture rose from 39 to 50 percent. Fishmeal usage in pig diets has continued to decline, as has its use in poultry diets. The continued ban on feeding fishmeal to ruminants (see Section 6.3) has meant that there has been reduced overall consumption of fishmeal in Europe. If this ban were to be lifted, unlikely in the short term, there could be significant increase in Europe’s demand for fishmeal.
Two supporting comments should be made with respect to the above points: a) The ban on feeding meal to ruminants has had a very significant effect on the
sales of fishmeal to the United Kingdom (down 70 000 tonnes), Italy (down 35 000 tonnes), the Netherlands (down 20 000 tonnes) and Germany. The United Kingdom and Danish meal manufacturers have borne the brunt of this impact, in particular Denmark, mainly because Italy represented one of its largest export markets. Germany has also suffered particularly badly, as many of its small meal manufacturers used fishmeal as an integral ingredient in their feed supplies for the agricultural sector.
b)The United Kingdom, being the largest single EU market for fishmeal, has seen a significant reduction in imports. Meal manufacturers that once used fishmeal as a component of their product have now eliminated it. The dedicated United Kingdom producers, while suffering from a reduction in the market, have been able to sustain product sales largely because of demand from the aquaculture sector and increased demand from the pig and poultry sector.
3.3.1 Fishmeal and fish oil use in aquafeedsIn contrast with much of aquaculture production in Asia and Africa, European production is focused on the intensive rearing of carnivorous fish such as salmon, seabass and seabream. With the exception of the on-growing of tuna in the Mediterranean Sea, farms use compounded meals that have been optimized for their performance, digestibility and cost-effectiveness.
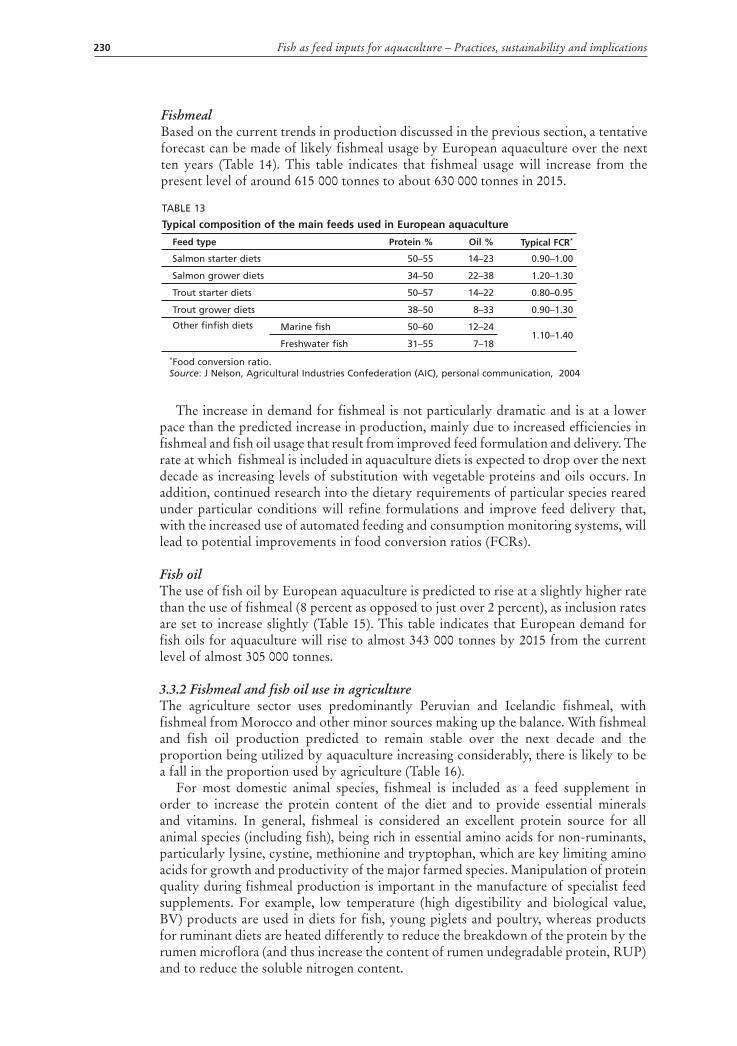
These feeds vary highly in their protein and oil levels, and use depends upon the species being fed and the stage at which the feeds are given. It can be seen from Table 13 that starter diets are typically rich in protein and lower in oil than grower feeds. Smaller fish also have different nutritional requirements that might favour the use of particular fishmeal, such as the histidine-rich South American feeds. It should also be remembered that starter feeds represent a smaller volume than grower feeds, as it is the latter that are mainly used to contribute to stock biomass.
Use Annual consumption (thousand tonnes)
2002 2007
Use for aquaculture 552 (39.3%) 537 (49.6%)
Use for pigs 653 (46.5%) 426 (39.4%)
Use for poultry 149 (10.6%) 69 (6.4%)
Other uses, including pet food 50 (3.6%) 50 (4.6%)
Total consumption in Europe 1 404 (100%) 1 082 (100%)
Source: A. Jackson, IFFO, personal communication, 2009
TABLE 12Average annual fishmeal consumption in Europe, 2002 and 2007
Fish as feed inputs for aquaculture – Practices, sustainability and implications230
TABLE 13
Typical composition of the main feeds used in European aquaculture
Feed type Protein % Oil % Typical FCR*
Salmon starter diets 50–55 14–23 0.90–1.00
Salmon grower diets 34–50 22–38 1.20–1.30
Trout starter diets 50–57 14–22 0.80–0.95
Trout grower diets 38–50 8–33 0.90–1.30
Other finfish diets Marine fish 50–60 12–24 1.10–1.40
Freshwater fish 31–55 7–18
*Food conversion ratio.Source: J Nelson, Agricultural Industries Confederation (AIC), personal communication, 2004
FishmealBased on the current trends in production discussed in the previous section, a tentative forecast can be made of likely fishmeal usage by European aquaculture over the next ten years (Table 14). This table indicates that fishmeal usage will increase from the present level of around 615 000 tonnes to about 630 000 tonnes in 2015.
The increase in demand for fishmeal is not particularly dramatic and is at a lower pace than the predicted increase in production, mainly due to increased efficiencies in fishmeal and fish oil usage that result from improved feed formulation and delivery. The rate at which fishmeal is included in aquaculture diets is expected to drop over the next decade as increasing levels of substitution with vegetable proteins and oils occurs. In addition, continued research into the dietary requirements of particular species reared under particular conditions will refine formulations and improve feed delivery that, with the increased use of automated feeding and consumption monitoring systems, will lead to potential improvements in food conversion ratios (FCRs).
Fish oilThe use of fish oil by European aquaculture is predicted to rise at a slightly higher rate than the use of fishmeal (8 percent as opposed to just over 2 percent), as inclusion rates are set to increase slightly (Table 15). This table indicates that European demand for fish oils for aquaculture will rise to almost 343 000 tonnes by 2015 from the current level of almost 305 000 tonnes.
3.3.2 Fishmeal and fish oil use in agriculture The agriculture sector uses predominantly Peruvian and Icelandic fishmeal, with fishmeal from Morocco and other minor sources making up the balance. With fishmeal and fish oil production predicted to remain stable over the next decade and the proportion being utilized by aquaculture increasing considerably, there is likely to be a fall in the proportion used by agriculture (Table 16).
For most domestic animal species, fishmeal is included as a feed supplement in order to increase the protein content of the diet and to provide essential minerals and vitamins. In general, fishmeal is considered an excellent protein source for all animal species (including fish), being rich in essential amino acids for non-ruminants, particularly lysine, cystine, methionine and tryptophan, which are key limiting amino acids for growth and productivity of the major farmed species. Manipulation of protein quality during fishmeal production is important in the manufacture of specialist feed supplements. For example, low temperature (high digestibility and biological value, BV) products are used in diets for fish, young piglets and poultry, whereas products for ruminant diets are heated differently to reduce the breakdown of the protein by the rumen microflora (and thus increase the content of rumen undegradable protein, RUP) and to reduce the soluble nitrogen content.

Wild fish and other aquatic organisms as feed in aquaculture in Europe 231
TAB
LE 1
4
Past
, cu
rren
t an
d p
red
icte
d fi
shm
eal u
se b
y Eu
rop
ean
aq
uac
ult
ure
, 200
0–20
15
Spec
ies
FCR
*
2000
2005
2015
Pro
du
ctio
n
(to
nn
es)
Fish
mea
l (%
)Fi
shm
eal u
se
(to
nn
es)
Pro
du
ctio
n
(to
nn
es)
Fish
mea
l (%
)Fi
shm
eal u
se
(to
nn
es)
Pro
du
ctio
n
(to
nn
es)
Fish
mea
l (%
)Fi
shm
eal u
se
(to
nn
es)
Seab
ass
1.3
57 8
11
5541
335
80
161
50
52 1
05
132
332
4577
414
Seab
ream
1.3
75 2
32
5553
791
97
060
50
63 0
89
140
941
4582
451
Salm
on
1.3
610
947
4031
7 69
2 71
2 27
1 35
324
083
926
852
3036
1 47
2
Tro
ut
1.3
444
251
3017
3 25
8 43
0 49
6 28
156
701
264
112
2585
836
Hal
ibu
t1.
413
5 45
85
905
4253
2 2
513
401
407
Turb
ot
1.4
3 87
3 45
2 44
0 6
865
424
037
11 8
63
406
643
Co
d1.
416
45
10
2 60
0 42
1 52
9 14
032
40
7 85
8
Eels
2.0
11 0
33
5011
033
7
800
457
020
2 04
1 42
1 71
5
Car
ps
2.0
79 3
00
57
930
72 0
90
45
767
60 7
38
33
644
Cat
fish
1.5
4 49
0 3
202
5 47
0 2
164
10 3
15
230
9
Tila
pia
s1.
715
0 7
18
550
547
1
670
411
4
Oth
er f
resh
wat
er f
ish
1.7
595
1010
1 49
5 7
59
646
555
Stu
rgeo
n1.
526
5 25
99
332
2010
0 66
3 18
179
Tota
l
1 28
8 09
8
607
995
1 41
7 0
95
61
5 23
2 1
568
718
62
9 09
7 * F
oo
d c
on
vers
ion
rat
ioSo
urc
e: F
eder
atio
n o
f Eu
rop
ean
Aq
uac
ult
ure
Pro
du
cers
(FE
AP)
(w
ww
.fea
p.in
fo/f
eap
/aq
uac
ult
ure
dat
a/d
efau
lt_e
n.a
sp)

Fish as feed inputs for aquaculture – Practices, sustainability and implications232
TAB
LE 1
5
Past
, cu
rren
t an
d p
red
icte
d f
ish
oil
use
by
Euro
pea
n a
qu
acu
ltu
re, 2
000–
2015
Spec
ies
FCR
*
2000
2005
2015
Pro
du
ctio
n
(to
nn
es)
Fish
oil
(%)
Fish
oil
use
(t
on
nes
)Pr
od
uct
ion
(t
on
nes
)Fi
sh o
il (%
)Fi
sh o
il u
se
(to
nn
es)
Pro
du
ctio
n
(to
nn
es)
Fish
oil
(%)
Fish
oil
use
(t
on
nes
)
Seab
ass
1.3
57 8
11
107
515
80 1
61
1111
463
13
2 33
2 12
20 6
44
Seab
ream
1.3
75 2
32
109
780
97 0
60
1113
880
14
0 94
1 12
21 9
87
Salm
on
1.3
610
947
2519
8 55
8 71
2 27
1 22
203
710
926
852
2024
0 98
2 Tr
ou
t1.
344
4 25
1 15
86 6
29
430
496
1583
947
26
4 11
2 15
51 5
02
Hal
ibu
t1.
413
5 20
38
905
1822
2 2
513
1552
8 Tu
rbo
t1.
43
873
201
084
6 86
5 18
1 68
2 11
863
15
2 49
1 C
od
1.4
16
204
2 60
0 18
637
14 0
32
152
947
Eels
2.0
11 0
33
51
103
7 80
0 8
1 17
0 2
041
1040
8 C
arp
s2.
079
300
0
–72
090
0.
572
1 60
738
1.
01
215
Cat
fish
1.5
4 49
0 1
67
5 47
0 0.
541
10
315
0.
577
Ti
lap
ias
1.7
150
13
550
0.5
5 1
670
0.5
14
Oth
er f
resh
wat
er f
ish
1.7
595
551
49
5 5
42
646
555
St
urg
eon
1.5
265
1560
33
2 12
60
663
1211
9
Tota
l
1 28
8 09
8
304
892
1 4
17 0
95
31
7 58
0 1
568
718
34
2 96
8 * F
oo
d c
on
vers
ion
rat
ioSo
urc
e: F
eder
atio
n o
f Eu
rop
ean
Aq
uac
ult
ure
Pro
du
cers
(FE
AP)
(h
ttp
://w
ww
.fea
p.in
fo/f
eap
/aq
uac
ult
ure
dat
a/d
efau
lt_e
n.a
sp)

Wild fish and other aquatic organisms as feed in aquaculture in Europe 233
Typical inclusion rates for fishmeal in animal diets are around 2–10 percent for terrestrial animal species. Efficiencies of conversion of feed to live weight gain are usually quoted in terms of FCR (units of weight gain per unit of feed consumed). In general, efficiencies of feed conversion are higher for fish at 30 percent as compared with poultry, pigs and sheep, 18 percent, 13 percent and 2 percent, respectively (Asgard and Austreng, 1995). It is important to note, however, that with the lower inclusion rates of fishmeal in poultry and pig diets, these species requires less fishmeal than do fish to produce a kilogram of edible product.
The use of fishmeal in ruminant diets8
Although sheep and cattle consume diets that are predominantly forage-based, there is increased use of concentrate diets and supplements at times of increased productivity, such as during pregnancy and lactation and during rapid growth. The use of fishmeal in these situations has considerable advantages over other protein sources such as soybean meal and bone meal in supplying RUP at times when metabolizable protein requirements may be greater than those that can be supplied by microbial protein synthesis and forage RUP.
Use of fishmeal in diets of non-ruminantsFishmeal use in pig diets accounts for approximately 20 percent of total fishmeal use, and it is recognized as a key protein source with a good balance of essential amino acids. Pigs’ diets containing fishmeal show improved feed conversion efficiencies and generally produce leaner carcasses (Wood et al., 1999). The protein is well tolerated in pigs of all ages and has a high digestibility. As with fishmeal used in ruminant diets, however, processing has a significant impact on protein quality in pig diets. Excessive heat treatment results in a significant reduction in digestibility and biological value, due mainly to loss of lysine, a key limiting amino acid in growing pigs. One major environmental benefit in the use of fishmeal in pig diets is the high digestibility of the added protein, resulting in an improved efficiency of dietary protein use with a concomitant reduction in the production of high N-containing effluent.
Use of fishmeal in diets of poultryAs with diets for mammalian species, fishmeal is considered a natural, balanced ingredient for poultry diets with a high protein, high mineral and high micronutrient
TABLE 16
Fishmeal and fish oil use in world agriculture, 2002 and 2010 (predicted)
A. fishmeal usage (2002 and 2010 (predicted)) B. Fish oil usage (2002 and 2010 (predicted))
ConsumerFishmeal use (thousand tonnes)
ConsumerFish oil use (thousand tonnes)
2002 2010 Change in use (%) 2002 2010 Change in
use (%)
Poultry 1 755 975 -44 Edible 375 175 -53
Pigs 1 885 1 430 -24 Industrial 150 88 -41
Ruminants 65 – -100 Pharmaceutical 25 – -100
Others 585 975 67 Total 550 263 -52
Total 4 290 3 380 -21
Source: Barlow (2002)
8 Currently, the inclusion of fishmeal and fishmeal products in feed for ruminant animals is banned under EU legislation as a consequence of the bovine spongiform encephalopathy (BSE) crisis. While there is no inherent risk of the transfer of transmissible spongiform encephalopathies (TSE) from fishmeal, the ban was introduced in response to fears about possible contamination of fishmeal products with processed animal proteins.
Fish as feed inputs for aquaculture – Practices, sustainability and implications234
content. The protein in fishmeal is readily digested by poultry, and it contains all the essential amino acids necessary for adequate growth and production, especially the growth-limiting amino acid lysine. However, as with pig diets, the quality of the fishmeal can seriously affect protein digestion and biological value. Inclusion of fishmeal in poultry diets at about 4 percent results in improved feed conversion efficiency and growth rates. Laying performance is also improved by feeding fishmeal.
3.4 Contribution of feed fisheries to the European economy3.4.1 Direct employmentThe industrial fishing sector is economically very small relative to the EU fisheries as a whole. It accounts for only 0.5 percent of the sector’s employment and 2.1 percent of the sector’s value added (Megapesca, 1998). Table 17 summarizes the economic significance of the fishmeal and oil sector within the EU. The sector contribution to EU gross value added is €137 million. Approximately 2 220 people are employed directly in the sector. More specifically, the level of economic dependency (value added) on feed-fish fisheries accounts for €137 million or 87 percent of the total and as such is significantly greater than the economic value generated from fish offal.
Of the 2 222 workers in the EU dependent upon feed-fish catching and processing, around 64 percent are dependent on feed-fish supplies (fish catching and processing feedfish) and 35 percent on the trimmings sector (Table 18). Employment in the production of feed-fish related meal tends to be less labour intensive than in offal production (Frid et al., 2003).
3.4.2 Interdependence of the catching sectorTable 17 illustrates the relatively low levels of dependency on feed fisheries in the context of the EU fishing fleet. However, some countries, most noticeably Sweden and Denmark, have fleets that are fully or partly dependent on feed fisheries. Reducing feed fisheries in these countries would have a direct impact on a significantly greater number of vessels than those 60 vessels that are strongly dependent on the fishery. The Danish Research Institute of Food Economics (FOI) explored the potential impact on the Danish fishery sector (Andersen and Løkkegaard, 2002) in the event of (a) a ban on sand-eel fishing (scenario 1) and (b) a ban on all industrial fishing (scenario 2). The assessment took account of changes in turnover and costs resulting from a loss of catch and a reduction in fishing effort. Because of the inter-linkages between human and industrial fishing activity, a ban would not only eliminate the 60 dedicated industrial vessels, it would also result in the removal of 125 vessels under scenario 1 and 194 vessels under scenario 2. This would result in a loss of employment of between 479 (scenario 1) and 750 workers (scenario 2). Applying a similar rational for the Swedish fleet would probably see the loss of 88 and 136 jobs, albeit that there are different species dependencies.
4. SUSTAINABILITY ISSUES OF REDUCTION FISHERIES AND FEEDFISH AS FEED INPUTS FOR AQUACULTURE AND ANIMAL FEED4.1 Review of the impacts of feed fisheries on ecosystems4.1.1 Direct effects of feed fisheriesThe removal of large numbers of individuals of fish from an ecosystem may directly impact their prey, predators and the viability of target and bycatch populations. The physical effect of fishing activity will also affect the ecosystem directly through the disturbance of habitats (Auster et al., 1996; Langton and Auster, 1999) and the death and injury of non-target species (Kaiser and Spencer, 1995).

Wild fish and other aquatic organisms as feed in aquaculture in Europe 235
TABLE 17
The economic significance of Europe’s fishmeal and oil sectors, 2003
CountrySector Numbers of
employees (FTE)*Value-added
(million €)
DenmarkFish catching 507 83.0
Fish processing 395 11.1
SwedenFish catching 93 14.0
Fish processing 35 4.3
United KingdomFish catching 11 1.45
Fish processing 105 5.0
IrelandFish catching 10 1.45
Fish processing 46 2.5
SpainFish catching 0 0
Fish processing 250 2.6
FranceFish catching 0 0
Fish processing 270 4.4
GermanyFish catching 0 0
Fish processing 62 1.5
PolandFish catching 60 2.0
Fish processing 53 –
Finland Fish catching 305 3.6
Other Fish processing 20 –
Total Fishmeal 2 222 136.9
Total EU fishery sector 482 374 6 416.8
% Contribution of fishmeal to EU fishery sector 0.46% 2.13%
*Full time equivalentSource: Frid et al. (2003)
TABLE 18
Employment dependency by producing/processing group, 2003
Sector Total dependency
Number %
Fish catching 986 45.5
Fish feed processing 417 19.2
Fish trimming and processing 766 35.3
Total 2 169 100
Source: Frid et al. (2003)
Feed-fish stocksTeleost feed-fish species caught for the production of fishmeal and fish oil are largely small pelagic fish that forage low in the food chain and are preyed upon by fish, marine mammals and seabirds at higher trophic levels. The population dynamics of many small feed-fish species are characterized by their high fecundity and early maturity. The recruitment patterns are highly variable and may rapidly influence stock size due to the short life span of the species, coupled with extrinsic environmental drivers such as sea temperature and associated climatic/hydrological patterns, e.g. the North Atlantic Oscillation (NAO) and the El Niño in the southeast Pacific. This will inevitably lead to uncertainty in the stock forecasts.
Most commercially exploited fish populations are capable of withstanding relatively large reductions in the biomass of fish of reproductive capacity (Daan et al., 1990; Jennings, Kaiser and Reynolds, 2001). However, the removal of extremely high levels of spawning stock may impair recruitment due to inadequate egg production. This has been termed “recruitment overfishing” (Jennings, Kaiser and Reynolds, 2001). Pelagic

Fish as feed inputs for aquaculture – Practices, sustainability and implications236
species are particularly vulnerable to this type of overfishing, as they are short-lived (Lluch-Belda et al., 1989; Santos, Borges and Groom, 2001).
Beverton (1990) reviewed the collapse of stocks of small, short-lived pelagics by examining the effect of fishing and natural extrinsic drivers. In four of the stocks studied (Icelandic spring-spawning herring, Georges Bank herring, California sardine and Pacific mackerel), the evidence indicated that the reproductive capability had fallen, probably due to environmental conditions, but suggested that fishing accelerated the collapse. Beverton (1990) concluded that although the likelihood of harvesting small pelagic species to extinction was remote, a major population collapse may result in subtle changes to the ecosystem that may change the biological structure of the community.
Other researchers also consider that harvesting an entire industrial fish species to extinction seems unlikely (Hutchings, 2000; Sadovy, 2001), but the treatment of stocks as single, panmictic populations means that if there are relatively local and sedentary stocks, overall catches could conceal community extirpation. This has implications for instance, for the management of localized substocks such as the North Sea sand eel.
HabitatsThe pelagic gear and purse seines used to target many industrial fish species – such as sprats, blue whiting and Peruvian anchovy – are deployed in the water column and have minimal contact with the sea floor. Demersal otter trawls are used to catch some species, such as sand eel and Norway pout, and these may have more of an impact on the sea bed and benthos. The degree of impact depends on the targeted species and the location, as specific gears will be used to target specific species, and the impact on the sea floor will depend on both the substrate type and the physiology of the animals that live there.
Typically in the sand-eel fishery, the trawl is kept close to the sea bed, which is usually sandy (Wright, Jensen and Tuck, 2000), but actual contact is kept to a minimum. The gear is also lighter than the other demersal trawls. The effect of this disturbance on the more dynamic sand habitats is less significant than disturbance in areas of lower energy such as muddy substrates and in deep water, as the level of natural disturbance in the more dynamic areas is likely to be greater than that caused by fishing (Kaiser et al., 1998).
Although the impact to the sea bed and benthos by each individual tow may be less than with comparable demersal otter trawling operations, as the gears are lighter, the way the fishery operates suggests that local impact on the sea bed and invertebrate communities may be quite intense. This is because the same trawl path tends to be fished repeatedly over a period of several days by several boats operating in any particular region (Frid et al., 2003). Mitigating against this, however, is the fact that these fisheries are seasonal. The local impact may be intense, but it is followed by long periods of recovery. The fishery for Norway pout occurs primarily through the winter months, with little fishing during the summer, which allows six to eight months of the year for the benthos to recover. The sand-eel fishery is constrained by the hibernation of the species in winter.
4.1.2 Indirect effects of fishingThere are a number of indirect effects of fishing feed-fish stocks, largely due to their foraging low in the food chain and, therefore, being preyed upon by fish, marine mammals and seabirds of higher trophic levels. Changes to specific predator-prey relationships may impact the whole food chain and lead to changes in the composition of biological communities (Greenstreet and Hall, 1996; Rijnsdorp et al., 1996; Bianchi et al., 2000; Hill et al., 2001). Removal of a species’ biomass reduces the buffering capacity of the stock and makes the population more vulnerable to poor prey

Wild fish and other aquatic organisms as feed in aquaculture in Europe 237
availability or climatic conditions. There are also the genetic effects associated with removing large amounts of the gene pool, which may adversely affect populations over long time periods. Indirect effects may also include ghost fishing resulting from lost fishing gears, which may continue to catch and disturb biological communities and habitats unmonitored (Chopin et al., 1996; Laist, 1996).
BycatchThe incidental catch of non-target species, and in particular the capture of juveniles of commercial species, is one of the most controversial aspects of feed fisheries, as most undersized fish are landed and processed. In North Atlantic waters, juvenile herring are known to shoal with sprat (Hopkins, 1986), while juveniles of other commercial species such as whiting and haddock are known to shoal with industrial teleost feedfish such as Norway pout (Huse et al., 2003; Eliasen, 2003). Bycatch levels are not necessarily high – the bycatch in the Danish and Norwegian North Sea sand-eel fishery (mainly herring, saithe and whiting) has averaged 3.5 percent over 1997–2001 (ICES, 2003a). While levels are low, given the scale of the feed fisheries being prosecuted, actual quantities of bycatch can be significant. In 2002, the Danish sand eel landings accounted for 622 100 tonnes, of which 3.7 percent was considered bycatch, totalling 23 018 tonnes of herring, cod, haddock, whiting, saithe and mackerel. In the same period, the sprat fishery took 27 972 tonnes of bycatch. In 2003, an experimental trawl survey (CEFAS, 2004) used a 16 mm commercial sand-eel net to monitor the whitefish bycatch on the West Dogger sand-eel grounds. Sand eels comprised 50–65 percent of the catch, below that required to meet EU catch composition rules, but sand-eel abundance was exceptionally low in 2003. Adult cod and haddock were not caught in the sand-eel net, which was capable of retaining 0-group gadoids (whiting), but their distribution was patchy, and no juvenile cod were caught.
There is recent evidence of declining bycatch in the sand-eel fisheries and the blue whiting fishery as seen in the Danish feed-fish catches (Table 19). Bycatch is an issue in the sprat fisheries, where increased herring bycatch is largely a result of relative increases in abundance (ICES, 2003b).
The composition and volume of catches from the Norwegian industrial fisheries, which target both blue whiting and Norway pout, was reported by ICES (2003b). Between 2000 and 2002, the average annual landings from the mixed fishery was 109 000 tonnes. Blue whiting formed an estimated 58 percent of this catch, while Norway pout formed approximately 17 percent. The remaining 25 percent, or about 16 000 tonnes, consisted of a range of fish and invertebrates. The six most important bycatch species (in terms of landed catch) were saithe, herring, haddock, Atlantic horse mackerel, whiting and mackerel, each of which represented an annual catch of at least 1 000 tonnes in this fishery. This length distribution analysis suggests that the bycatch of these species consisted primarily of immature individuals.
In the North Sea, this issue has been addressed by closures of part of the North Sea to Norway pout fishing to reduce the bycatch of juvenile commercial species. Similarly, seasonal closures exist for the conservation of fishery resources through technical measures for the protection of juveniles of herring and sprat (EC Regulation 850/98; Council of the European Union, 1998). Bycatch regulations and minimum mesh size are also in place, aimed at reducing juvenile bycatch.
The spatial and temporal distribution of cod bycatch in the herring and sprat fisheries of the Baltic Sea was thought to relate to the co-occurrence of the three species on cod and sprat pre-spawning and spawning grounds. ICES (2001) determined that the share of bycatch in total landings of cod was within the range of 1.3 to 2.0 percent. The bycatch in pelagic fisheries, therefore, appeared to have a minor effect on the cod population.

Fish as feed inputs for aquaculture – Practices, sustainability and implications238
In a recent study, the majority of haddock and whiting in the bycatch of the industrial fisheries of Denmark and Norway were of age 3 or less (ICES, 2003c). The mortality of haddock caught as bycatch by the industrial fisheries was small for age groups 0 and 1 (less than 1 percent by number and weight), while the mortality percentages of older fish aged 2 and 3 were more varied. The percentages of whiting caught were generally higher. However, the mortality due to industrial fishing was considered small in comparison with the total estimated survivors for the year classes and considering that the natural mortality of haddock and whiting is very high.
Seabirds Bycatch mortality: The methods for catching fish species depend on the behaviour of the fish. Many fish species shoal, and small-mesh trawls and gillnets are used to capture the shoaling fish. Many of the feed-fish fisheries use trawls, and birds are less likely to be caught by this type of gear (Tasker et al., 2000). A study in the Baltic Sea assessing the bycatch of common guillemot (Uria alga) indicated that a small unquantified degree of mortality could be attributed to trawls, but the researchers did not identify the trawls as specifically targeting an industrial fish species (Österblom, Fransson and Olsson, 2002). Bycatch of birds is potentially an issue in the purse-seining for anchovy, but the level of interaction is little researched (Majluf et al. 2002), and there are only anecdotal reports of bycatch (S. Austermühle, Mundo Azul, personal communication, 2003).
Availability as prey: Seabirds are long-lived, producing few fledglings that only breed if they survive several years, and normally have various mechanisms to overcome periods of low food supply. Specialist seabirds, such as small, surface-feeding species with energetically expensive foraging methods are the most vulnerable to local depletion and (natural) variability in prey availability. The relationship between the reproductive success in black-legged kittiwakes on Shetland and sand-eel abundance has been proposed as an indicator of local sand eel availability in the North Sea (ICES, 2003c). Potential conflicts between fisheries and seabirds are likely to arise only on a local or regional scale (Tasker et al., 2000). Industrial fisheries can affect seabirds by reducing prey stock biomass, leading to declining recruitment or alterations in the food web structure. Although seabirds consume only an insignificant proportion of North
TABLE 19
Landings and bycatch from four Danish North Sea industrial fisheries, 1998–2001 (average) and 2002
Catch species composition
Landings of four industrial feed fisheries (thousand tonnes)
Sand eel Sprat Norway pout Blue whiting
1998–2001 2002 1998–2001 2002 1998–2001 2002 1998–2001 2002
Sand eel 564.3 622.1 6.1 4.1 0.0 0.0 0.1 0.0
Sprat 6.6 1.0 152.8 140.6 0.2 0.0 0.0 0.0
Norway pout 1.6 0.0 0.4 0.2 53.8 43.2 3.5 3.7
Blue whiting 1.4 0.7 0.0 0.0 2.6 4.7 31.1 21.1
Herring 2.6 1.6 11.2 16.6 1.8 3.2 0.8 0.2
Cod 0.2 0.1 0.0 0.0 0.1 0.0 0.0 0.0
Haddock 0.7 1.2 0.1 0.0 0.9 1.5 0.2 0.1
Whiting 1.8 1.5 1.4 2.5 1.3 1.7 0.1 0.1
Mackerel 0.4 0.4 0.4 0.7 0.1 0.0 0.1 0.0
Saithe 0.0 0.0 0.0 0.0 0.0 0.2 0.0 0.1
Other species 2.2 1.4 1.8 2.7 0.9 0.4 3.3 1.6
Total 581.8 630.0 174.2 167.4 61.5 54.9 39.2 26.9
% bycatch 3.0 1.0 12.3 16.1 12.5 21.5 20.9 22.1
Source: Adapted from Frid et al. (2003)

Wild fish and other aquatic organisms as feed in aquaculture in Europe 239
Sea sand-eel stocks compared with fish predators (Bax, 1991; Gislason, 1994; ICES, 1997), this relationship is sensitive to the population levels of key predators such as mackerel and gadoids, which are currently low in the North Sea.
A classic example of how the removal of large quantities of feedfish by industrial fisheries might reduce food supply to seabirds has been reported in Peru. Extrinsically driven dramatic decreases in numbers of guano seabirds occur regularly during El Niño events but, historically, species were shown to recover between events, showing cyclic fluctuations in populations. However, as the Peruvian anchovy fishery increased, seabird numbers began to fail to recover after El Niño driven crashes, and the seabird population fell to only a small fraction of its earlier numbers (Duffy, 1983). Jahncke, Checkley and Hunt (2003) modelled the guano-producing seabirds (cormorant (Phalacrocorax bougainvillii), booby (Sula variegata) and pelican (Pelecanus thagus)) that feed almost exclusively on Engraulis ringens to determine if there is a response in the annual population size of the birds to changes in primary and secondary production of the Peruvian upwelling system. The seabirds were shown to respond to the increased productivity of the Peruvian upwelling system, and declines in seabird abundances after El Niño events were likely due to competition for food with the fishery.
Marine mammalsBycatch mortality: The Ecological Quality Objective for bycatch of small cetaceans adopted under the Bergen Declaration9 requires anthropogenic mortality to be below 1.7 percent per year. No bycatch of marine mammals has been reported in the industrial fisheries (Dalskov, personal communication, 2003), but Huse et al. (2003) provide anecdotal evidence that there are occasional bycatches of cetaceans in the North Sea sand-eel fishery. The opportunistic feeding behaviour of cetaceans and pinnipeds in and around trawls means they are vulnerable to becoming trapped (Fertl and Leatherwood, 1997). There is a need for further investigation of the level and spatial and temporal extent of marine mammal bycatch in the North Sea. Should this prove significant in areas or in certain seasons, pingers could prove an effective management measure (Larsen, 1999).
Bycatch of cetaceans is potentially an issue in the purse-seining for anchovy (Majluf et al., 2002). The dusky dolphin (Lagenorhynchus obscurus) is known to take E. ringens as a major component of its diet (McKinnon, 1994), and the species was reported as caught by purse seines before cetaceans were protected in the region (law No. 26585: 1996) (Read et al., 1988). Van Waerebeek et al. (1997) conducted a survey of Peruvian fishers to estimate mortality on 722 bycaught cetaceans (and direct takes); species reported in multifilament gillnets were 82.7 percent dusky dolphin (L. obscurus), with the remainer Burmeister’s porpoise (Phocoena spinipinnis), long-beaked common dolphin (Delphinus capensis) and bottlenose dolphin (Tursiops truncatus). Van Waerebeek et al. (1997) found that there was no indication of a reduction in dolphin mortality in the industrial purse-seine fisheries, and that large numbers of long-beaked common dolphins are known to be by-caught. Currently, catches are thought to occur, but evidence is anecdotal (S. Austermühle, Mundo Azul, personal communication, 2003).
Availability as prey: Diet composition analyses of cetaceans show the presence of industrial feed-fish species in the diet of harbour porpoise (P. phocoena), bottlenose dolphin (T. truncatus), white-beaked dolphin (L. albirostris), common dolphin (D. delphis), Risso’s dolphin (Grampus griseus), Atlantic white-sided dolphin (L. acutus) and minke whale (Balaenoptera acutorostrata ) (Fontaine et al., 1994; Santos et al., 1994, 1995; Couperus, 1997; Olsen and Holst, 2001; Kastelein et al., 2002; Borjesson,
9 Fifth International Conference on the Protection of the North Sea (the Bergen Declaration) of 20–21 March 2002.

Fish as feed inputs for aquaculture – Practices, sustainability and implications240
Berggren and Ganning, 2003). In some cetaceans, the proportion of feedfish reported in the diet is minimal, but in Scottish waters, sand eels constitute 58 percent by weight of the stomach content in harbour porpoises and 49 percent by weight of the stomach content in the common dolphin. Other feed-fish species, sprat and Norway pout, were less than 1 percent by weight (Santos et al., 1995). In Kattegat and Skagerrak Seas, feedfish (mainly sprat and herring) constitute 13 percent by weight of the contents in juveniles’ stomachs and 10 percent by weight in adults’ stomachs (Borjesson, Berggren and Ganning, 2003). Sand eels contribute 86.7 percent to the diet by weight of Minke whale in the North Sea and further north, into the Norwegian Sea, the diet of Minke whales is dominated by spring-spawning herring (Olsen and Holst, 2001). The differences in the diet composition reflect the local foraging of cetaceans. Industrial fisheries in the North Sea may, therefore, impact marine mammal populations by altering their food supply in certain areas. It is, therefore, important to consider the local availability of feedfish to cetaceans and their ability to switch to other prey if the stocks are depressed, when assessing the effects of feed-fish fisheries on marine mammals. This, however, has yet to be demonstrated in any cetacean population.
There is some evidence that there is a link with fisheries and grey seal population dynamics. The Effects of Large-scale Industrial Fisheries On Non-Target Species (ELIFONTS) study investigated the grey seal population on the Isle of May, in the North Sea. Grey seals (Halichoerus grypus) consumed mainly sand eels (Ammodytes marinus), but the greater sand eel (Hyperoplus lanceolatus) was also taken. For this study, the proportion of not breeding, but reproductively capable females and the number of breeding failures among marked animals were positively correlated with sand-eel catch per unit effort (CPUE) in the southern North Sea in the years 1990–1997. Effects were only seen when the reproductive performances of known seals were examined in relation to fishery data. It is possible that the reproductive performance of some seals may be more affected by changes in sand-eel availability than that of other seals, reflecting either a tendency to specialize on sand-eels or an inadequacy in hunting behaviour. Also, the body condition of female seals was positively correlated with CPUE for the local stock area. However, the total number of pups increased steadily during the study periods and thus, although there appears to be an interaction between sand-eel abundance and seal breeding success, given the current state of the populations, this interaction does not appear to be a major factor explaining variations in seal populations (Harwood, 1999).
Ecosystem changesThe complexity of marine systems makes it difficult to identify the effects of predator/prey removal on other communities. Marine communities often exhibit size-structured food webs, and changes in the abundance and size composition of populations are likely to lead to changes in the quantity and type of prey consumed (Frid et al., 1999). However, these changes may not be predicted by simplistic models of predator-prey interactions, as they do not take into account prey switching, ontogenetic shifts in diet, cannibalism or the diversity of species in marine ecosystems (Jennings and Kaiser, 1998; Jennings, Kaiser and Reynolds, 2001).
Ecological dependence takes account of the ecological linkages in the marine systems. Ecological dependence is already considered in management advice for sand-eel in the Shetland area, and sand eel in Sub-area IV, e.g. the kittiwake/sand eel interaction. ICES (2002) identified several feed-fish stocks for which ecological dependence may need to be considered further in management advice: sand eel in Division IIIa; Norway pout in Sub-area IV and Division IIIa; sand eel in Sub-area IV; Norway pout in Division VIIa and sand eel in Division VIa. However, assessing ecological dependence is problematic, as evidence for the effects of strong ecological interactions on some stocks, e.g. the proposed kittiwake/sand-eel interaction, should not be taken as evidence that they are

Wild fish and other aquatic organisms as feed in aquaculture in Europe 241
necessarily a concern to managers of all stocks. ICES (2003c) suggested that the current approaches for assessing ecological dependence could not be widely applied and that fundamental research is needed to develop an appropriate method for assessing and ranking the strength of ecological dependence of species.
Commercial species as predators of feed-fish speciesFeedfish tend to feed at or near the bottom of the food chain, so fisheries interactions with the marine food web are more likely to affect their predators. Gislason (1994) reported that the sand-eel and Norway pout fisheries of the North Sea took in the region of 20 percent of the annual production of these fish species. The consumption of sand eels in the North Sea by fish that are targeted for human consumption, seabirds and other species (including some fish species and marine mammals) has been estimated as 1.9, 0.2 and 0.3 million tonnes, respectively (ICES, 1997). Bax (1991) reviewed the fish biomass flow to fish, fisheries and marine mammals using a variety of data sets in the Benguela system, on Georges Bank and in Balsfjorden, the East Bering Sea, the North Sea and the Barents Sea, and calculated that consumption of fish by predatory fish was 5–56 tonnes/km2 compared with fisheries (of all types), which removed 1.4–6.1 tonnes/km2, marine mammals, which consumed 0–5.4 tonnes/km2 and seabirds, which consumed 0–2 tonnes/km2. Fish predation on teleost feedfish, is, therefore considered to be higher than industrial fisheries removals, and this is especially true in the sand-eel fisheries.
The ICES stomach sampling project in 1981 showed that sand eel, Norway pout and sprat provided more than 50 percent of the food of saithe and whiting and between 1 and 30 percent of the food of cod, mackerel and haddock (Gislason, 1994). Greenstreet (1996) investigated the diet composition of the main predators in the North Sea; Table 20, which gives the consumption of industrial species, shows that industrial or feed-fish species are a valuable food resource for predatory fish.
However, while bioenergetic estimates of sand-eel consumption in the North Sea show that fish are important predators, predation on sand eels is declining (Furness, 2002), as stocks of large gadoid predators are weak and their spawning stock biomass is declining (Sparholt, Larsen and Nielsen, 2002). Sparholt, Larsen and Nielsen (2002) tested the hypothesis that a reduction in consumption of industrial fish by gadoids such as cod, whiting and saithe should lead to a measurable reduction in the predation mortality of their prey (Norway pout) and found the total mortality of Norway pout for ages 1 and 2 had declined between the 1980s and 2000.
If small pelagic species have become more dominant in marine systems, resulting from a decline in demersal fish predators due to fishing, then there is an argument for management to allow larger harvests of industrial species due to the reduced natural predation pressure on these stocks. However, Naylor et al. (2000) argued that in the North Sea, exploitation of sand eel and Norway pout is implicated in the decline of cod. It has been suggested that a reduction in fishing effort on industrial fish stocks will benefit higher trophic predators (including gadoids) (Dunn, 1998; Cury et al., 2000; Furness, 2002). The more recent assessments of the Norway pout stocks in ICES
TABLE 20
Diet composition (%) of the main predators in the North Sea
Prey Predator
Cod Haddock Whiting Saithe Mackerel Atlantic horse mackerel
Norway pout 7.7 6.3 8.9 32.2 7.3 0.0
Herring 4.1 0.1 6.6 0.6 3.7 8.8
Sprat 2.1 0.3 9.4 0.4 3.2 0.4
Sand eel 7.3 7.2 27.3 9.7 16.6 0.0
Source: Recalculated from Greenstreet (1996)

Fish as feed inputs for aquaculture – Practices, sustainability and implications242
Sub-area IV and Division IIIa (ICES, 2003d) indicate that fishing mortality is lower than natural mortality, and multispecies analyses have indicated that when F (fishing mortality) is below M (natural mortality), the fisheries are not causing problems for their predators on the scale of the stock. It further noted that locally concentrated harvesting may cause local and temporary depletions of predators and, therefore, harvesting should be spread widely across large geographical areas.
The ICES Multispecies Forecast Programme (MSFOR) (reported in Gislason and Kirkegaard, 1998) predicted that if there was a 40 percent reduction in the industrial fishing effort in the North Sea, the harvested yield of sand eel would decrease by
19 percent (compared with the prevailing situation), while the spawning stock biomass would increase by more than 50 percent (Figure 8). The model predicted that reducing the fishing mortality of industrial species, and hence increasing the sand-eel stock, would only have a small effect on predatory species. Such modelling must always be interpreted with caution, as models can only make predictions based on the data available. For example, the overfishing of predatory fish may have perturbed the marine system to such an extent that the recovery of these stocks is unlikely even if there is a reduction of the fishing effort on sand eels (Beddington, 1984). The lack of appropriate modelling frameworks for establishing the ecosystem effects of fisheries is well recognized (Robinson and Frid, 2003). However, it appears that fishing mortality due to the sand-eel and Norway pout feed fisheries is sufficiently low to ensure that prey items are available to predatory fish.
Teleost feedfish as predators of commercial species The survival of the early planktonic phases of the fish life cycle is essential for stock recruitment (Blaxter, 1974; Chambers and Trippel, 1997; Horwood, Cushing and Wyatt, 2000). Even small variations in the mortality rate between egg fertilization and recruitment can have a profound effect on the subsequent adult abundance (Jennings, Kaiser and Reynolds, 2001). Many industrial fish species prey on the eggs and larvae of commercial fish. Sand eel, Norway pout and capelin consume fish eggs and larvae (www.fishbase.org), and sprat and herring prey on cod eggs (Stokes, 1992;
T otal
S ole
P laice
S and eel
N . pout
S prat
H erring
H addock
M ackerel
S aithe
W hiting
C od
-20 0 20 40 60
Y ield
S S B
Source: Gislason and Kirkegaard (1998)
FIGURE 8
MSFOR predictions of the percentage change in yield and spawning stock biomass
(SSB) in the North Sea for 11 North Sea species upon a 40 percent reduction in
sand-eel fishing

Wild fish and other aquatic organisms as feed in aquaculture in Europe 243
Köster and Möllmann, 2000). Juveniles of saithe, cod and whiting may also experience competitive interactions with Norway pout (Albert, 1994). As the abundance of the larger predatory gadoids has been reduced to low levels, the industrial feedfish that prey on their juveniles and eggs may now be exerting a higher level of mortality than previously, and may potentially affect gadoid stock recruitment and slow recovery. However, it should be noted that such profound trophic impacts are difficult to verify, given the lack of information and the confounding effect of other impacts.
Genetic impactsOverfished populations may exhibit the “Allee effect”. This is an inverse density dependence at low densities, e.g. the per capita birth rate declines at low densities. The primary factors involved in generating inverse density dependence include genetic inbreeding and loss of heterozygosity and demographic stochasticity, including sex ratio fluctuations (Courchamp, Clutton-Brock and Grenfell, 1999). Common factors behind the Allee effect are not of a genetic nature and can include gregariousness, sperm competition, cultivation effects, etc.
The genetic viability of a stock is harmed if a stock collapses and recovers, due to the reduced number of genes in the population. However, Stephenson and Kornfeld (reported in Beverton, 1990) concluded that the Georges Bank herring, which reappeared after a collapse in 1977 to 1/1000th of the 1967 peak of over 1 million tonnes, have an unchanged genetic constitution. This result may be an artefact of the limited DNA technology of the time.
Teleost feed-fish species are characterized by a tendency to shoal. Fishing pressure causes shoaling fish to reduce their range and maintain the same average school size (Ulltang, 1980; Winters and Wheeler, 1985). Consequently, there can be a high number of individuals in a shoal that may lead to a high level of genetic diversity within the shoal (Ryman, Utter and Laikre, 1995). The next question is what size can a genetically distinct shoal/or population be reduced to and still recover. Beverton (1990) calculated that the smallest population size that a collapsed population dropped to and subsequently recovered is in the order of a million fish, but local density has to play a role.
4.2 Criteria and indicators presently used to measure the sustainability of reduction fisheries The FAO Code of Conduct for Responsible Fisheries (CCRF), adopted in (FAO, 1995), aims to ensure that the right to fish “carries with it the obligation to do so in a responsible manner so as to ensure effective conservation and management of the living aquatic resources”. Together with its Technical Guidelines for implementation and the other international fisheries instruments developed and adopted within its framework (e.g. International Plan of Action for Reducing Incidental Catch of Seabirds in Longline Fisheries, IPOA-Seabirds; International Plan of Action for the Conservation and Management of Sharks, IPOA-Sharks; International Plan of Action for the Management of Fishing Capacity, IPOA-Capacity; International Plan of Action to Prevent, Deter and Eliminate Illegal and Unreported and Unregulated Fishing; IPOA-IUU fishing), the CCRF is now widely recognized by governments and non-governmental organizations (NGOs) as the global standard for setting out the aims of sustainable fisheries and aquaculture over the coming decades and as a basis for reviewing and revising national fisheries legislation.

Fish as feed inputs for aquaculture – Practices, sustainability and implications244
4.2.1 FIN “Sustainability Dossier”When most feed manufacturers state that they only procure from “sustainable” sources, this claim is usually based upon the Fishmeal Information Network (FIN) Sustainability Dossier, an annually updated assessment initiated by the Grain and Feed Trade Association (GAFTA) and funded by the United Kingdom Seafish Industry Authority (SFIA). Until recently, this dossier has been limited to examining stock assessment reports and the presence of regulatory frameworks, but it has now been expanded to reflect wider ecosystem impacts based on the latest ICES and FAO advice.
4.2.2 MSC “Principles and criteria” for responsible fisheriesThe concept of sustainability is complex and, therefore, has implications for the selection of criteria for “sustainable fishing”. The most widely accepted generic model is the principles and criteria for “responsible fishing” developed by the Marine Stewardship Council (MSC). Developed over a long consultation period, the MSC principles and criteria consider whether a fishery is sustainable depending upon a demonstration of:
• the maintenance and re-establishment of healthy populations of targeted species;• the maintenance of the integrity of ecosystems;• the development and maintenance of effective fisheries management systems,
taking into account all relevant biological, technological, economic, social, environmental and commercial aspects; and
• compliance with relevant local and national laws and standards and international understandings and agreements.
While the MSC criteria respond well to fisheries and ecosystem issues, they do not provide a specific assessment of the economic or social elements. Huntington (2004) took the basic MSC criteria and adapted them to specifically suit feed fisheries, applying them to the five main fisheries that provide the bulk of fishmeal destined for the Scottish fish-farming industry (Table 21).
In the MSC process, indicators are used to assist the scoring of fisheries “sustainability”. For each indicator, there are three “scoring guideposts” that assist assessors in determining the score out of 100. For instance, there are guideposts for what passes at 60, 80 and the ideal score of 100.
The advantage of the MSC approach is that it provides a vigorous quantitative approach to assessing the main elements that ensure that a fishery is sustainable. The main question is whether this approach can be successfully applied to feed fisheries, whose main species constitute an important forage prey, unlike many of the top predators that have formed the focus on many fisheries certifications to date. While MSC does look at implications of target species removal on ecosystem structure and function, it has been a challenge to both determine and quantify in practice. With growing interest in ensuring the sustainability of aquaculture products throughout the production chain, the certification of feed-fish stocks has become an urgent priority.
4.3 Sustainable use of available fishery resources for aquafeedsWhile a future goal may be the complete or majority use of feedfish from a certified “responsibly managed” fishery, in the mean-time, it is important that the fish farming industry in Europe makes a committed move towards sourcing from the better managed and more sustainable fisheries. As mentioned earlier, the main buying criteria for fishmeal for inclusion in aquafeeds are price and quality. Beyond ensuring that fish are purchased from stocks that are managed within national and international laws and agreements, there is little real attempt to limit fishmeal procurement to “sustainable sources”. There are a number of obstacles that must be overcome if the feed-supply chain for the European industry is to become more sustainable. However, it is being

Wild fish and other aquatic organisms as feed in aquaculture in Europe 245
increasingly recognized that the long-term future of the aquaculture industry is entirely dependent on sustainably managed fisheries, and all concerned need to take full account of this.
4.3.1 Barriers to buying aquafeeds sourced from sustainable feed fisheriesThere are a number of practical reasons why it has been difficult for the feed manufacturing industry to source fish feeds entirely from sustainable sources:
TABLE 21
Summary of principles, criteria and corresponding indicators of feed fisheries sustainability
Principle Criterion (C) Indicator
1. F
ish
ing
pre
ssu
re a
nd
su
stai
nab
ility
1.1 High productivity of stock maintained
a) Level of understanding of species and stock biology
b) Knowledge of fishing methods, effort and mortality
c) Existence of acceptable reference points
d) Existence of defined harvest strategy
e) Robust and regular assessment of stocks
f) Stocks are at an appropriate precautionary reference level.
1.2 Fishery able to rebuild stock to a predefined level within a specific time frame
1.3 Reproductive capacity of stock maintained
a) Information on fecundity and recruitment dynamics
b) Information on stock age/sex structure
c) Evidence of changes in reproductive capacity
2. S
tru
ctu
re, p
rod
uct
ivit
y,
fun
ctio
n a
nd
div
ersi
ty o
f d
epen
den
t ec
osy
stem
2.1 Natural functional relationships between species maintained without ecosystem state changes
a) Understanding of ecosystem factors relevant to target species
b) General risk factors known and understood
c) Impacts of gear use and loss known
d) Ecosystem management strategy developed
e) Ecosystem assessment shows no unacceptable impacts
2.2 Fishery does not threaten biodiversity
a) Level of knowledge and implications of interactions
b) Management objectives set for impact identification/avoidance
2.3 Recovery of non-target species populations permitted
a) Information on necessary changes to allow appropriate recovery
b) Management measures permit adaptive change to fishing
c) Management measures allow recovery of affected populations
3. In
form
atio
n, o
rgan
izat
ion
al a
nd
le
gis
lati
ve c
apac
ity
for
sust
ain
able
m
anag
emen
t
3.1 Management system criteria
C2 a) Clearly defined institutional and operational framework
C1, 2, 3 b) Management system has clear legal basis
C2, 5, 7 c) Has a consultative and dispute resolution strategy and pathways
C6 d) Subsidies or incentives exist that affect fishing practices
C8 e) Adequate, operational research plan to address information needs
C7, 9, 10 f) Monitoring and evaluation system for fisheries management objectives
C11 g) Control mechanisms for enabling and enforcing management objectives
3.2 Operational criteria
C12, 13 a) Operational mechanisms to reduce impacts on habitats and non-target species
C14, 15 b) Measures to discourage operational wastes and destructive practices
C16 c) Fishers aware of/compliant with managerial, administrative and legal requirements
C17 d) Fishers involved in catch, discard and other relevant data collection
4. E
con
om
ic a
nd
so
cial
co
nsi
der
atio
ns 4.1 Respects the needs
of fisheries-dependent communities, historic rights and cultures
a) Does not impact resource availability or access, directly or indirectly
b) Fisheries and fishers demonstrate understanding and sensitivity to traditional practices and ways of life
4.2 Fishery and market operate under natural conditions.
a) Fishery operates in an economically efficient manner
b) Product trade is not artificially favoured by trade barriers or protectionism
4.3 Labour conditions conform to International Labour Organization (ILO) standards
a) Freedom from enforced labour
b) Freedom of association and collective bargaining
c) No discrimination of individuals and organizations
d) Non-use of child labour
4.4 Fishery does not prejudice food security
a) Pricing structure operates within market norm
b) Supply operates within market norm
Source: Huntington (2004)

Fish as feed inputs for aquaculture – Practices, sustainability and implications246
• Lack of recognized criteria for suitability: At present, there are no feed manufacturing industry standard definitions or criteria for the sustainability of feed fisheries. It currently uses the FIN Sustainability Dossier for guidance, but this is essentially limited to examining stock assessment reports and regulatory frameworks. This dossier does not include some of the elements included in the assessment criteria used in this study, such as non-target species impacts, regulatory compliance levels, availability of key information and knowledge relevant to sustainability, as well as economic and social factors. The MSC-derived framework used by this study is considered an improvement on the FIN Dossier, and one that should be adopted more widely. The setting of sustainability criteria will ultimately enable both fish producer and consumer to purchase selectively, creating a market for a sustainable product.
• Traceability: Although the traceability of feed ingredient sources is improving rapidly, it may be difficult to ensure the origin of all fishmeal. For instance, fishmeal is often blended to give constant characteristics of density, flow, digestibility and protein content, and thus species identity tends to be uncertain. Much of the South American fishmeal is blended at the time of loading of tankers (both ship and road) and hence cannot be traced beyond that point. Traceability is high on the feed industry’s agenda, and some manufacturers are looking to traceability schemes such as the Universal Feed Assurance Scheme (UFAS) and the Feed Materials Assurance Scheme (FEMAS) to reduce the purchase of feed products where there is not a full traceability chain.
• Fishmeal nutritional performance: Restrictions on certain fishmeal stocks may have implications for fishmeal nutritional performance. For instance, smaller fish (i.e. salmon <1 kg) need high levels of amino acid histidine that is found in much higher levels in South American fishmeal – exclusion from these would necessitate much higher fishmeal inclusion levels for European meals and thus higher levels of consumption. There is the potential for substitution with porcine blood meal, but this is likely to meet retail and consumer resistance. Conversely, for larger fish, the use of meals from the northern hemisphere produced at low temperature (LT) is favoured because they are higher in protein and of the highest digestibility. For instance, blue whiting meal is a highly digestible meal and while some users dislike its higher ash level, most processors find it worthwhile using and may be reluctant to reduce its use.
• Supply assurance: Should the industry become selective for more sustainable fishmeal stocks, the demand for those stocks will increase. This has a number of implications:
o Fishmeal supply may be restricted for reasons outside the control of fishmeal manufacturers and their clients, e.g. the wide inter-annual variability of South American production through the El Niño events.
o Connected with the point above, prices may become more variable, with a general shift upwards as the supply base is effectively reduced.
o Increased pressure will be put upon sustainable fishmeal stocks. However, this should not be an issue if they are well regulated and controlled (as they should be if deemed as sustainable).
o Risk reduction – formulators such as a mix of fishmeals from different sources to reduce the risk of unforeseen quality or contamination problems.
These concerns are only really valid over the short term. Longer-term supply assurance depends on the sustainable management of feed fisheries, and the industry may have to review its approach to fishery exploitation if it is to continue to be viable in the future.

Wild fish and other aquatic organisms as feed in aquaculture in Europe 247
• Seasonal availability: Most fishmeal manufacturers use several species throughout the year to reflect seasonal availability and condition (i.e. oil content). Although it is possible to choose or avoid a particular fish species, to do so necessitates increasing purchases of other meals, possibly at higher cost and, given shipping and storage constraints, having to keep larger stocks to get past the seasons involved. Producers are reluctant to hold stock for more than a few months. When forced to do so, they usually reduce prices to clear stock out. If aquaculture buyers have no storage available, then they spot buy almost always above the market, and because they generally beat the market by buying long and at lows in the cycle whenever possible, this severely impacts their buying strategy. Some aquaculture companies have very long-term frame contracts with fishmeal producers. Agriculture feed buyers source fishmeal in smaller quantities, use traders and have shorter term buying positions. They are more numerous than the oligopoly of aquaculture feed buyers, and so their behaviour is more of an approximation to a perfect market.
• Buying power: Asia’s burgeoning pig and poultry industries require more fishmeal than the aquaculture industry in the western world and thus are an important factor in determining world price and availability. Aquaculture buyers no longer can influence the trade in fishmeal in Peru and elsewhere to the degree they have done in the past. Norway has become a net importer rather than, as once, an exporter. Chile is now a net importer of fish oil. So freedom to avoid or choose certain meals could be constricted by this factor.
4.3.2 Recommendations for improving responsible sourcing of aquafeedsHuntington (2004) made a number of recommendations to the Scottish fish-farming industry to improve their sourcing of sustainable fishmeal and oils for aquafeeds. These have been reviewed and expanded to apply to European aquaculture as a whole:
• Better structured feed-fish fisheries sustainability criteria: The majority of European aquafeed manufacturers use the FIN Sustainability Dossier (FIN, 2003), which is published every year once the EC’s annual fisheries management regime has been agreed. As discussed previously, this dossier now includes a review of the wider ecosystem ramifications of feed-fish utilization. To assist this process further, it would be useful to have a formal series of “sustainability criteria” specifically for feed fisheries that could be applied to the main species being sourced and independently verified to provide consumer confidence. This could act as a first stage to pre-assessment and full certification of the more sustainable feed fisheries over the longer term.
• Improved traceability: Fishmeal purchasers should request improved information on fishmeal species ingredients, their origin and chain of custody. Such information should be made fully available to the public domain to provide assurance of the industry’s transparency.
• Sustainable purchasing strategies: Fishmeal purchasers should develop a purchasing strategy that minimizes and, where possible, eliminates the use of those species considered unsustainable. This strategy could be prepared with a number of different timescales:
a. short term: reduce the purchase of less sustainable species, such as blue whiting or jack mackerel, where possible;
b. medium term: develop approaches to halting purchases of less sustainable species through a detailed analysis of alternatives; and
c. long term: develop alternative protein and oil substitutes for fishmeal and fish oil; set a date for and approach to purchasing all fishmeal and fish oils from sustainable fisheries independently verified for “responsible management”.

Fish as feed inputs for aquaculture – Practices, sustainability and implications248
This purchasing strategy could be updated regularly to reflect changes in different fishing practices and the latest “sustainability assessments”, together with emerging trends in fish nutrition and alternative feed materials. The use by procurement departments of environmental management systems such as International Organization for Standardization (ISO) ISO 14 001 to ensure that procurement strategies minimize the environmental implications of purchasing should also be considered.
• Use of non-fish protein and oil: Greater knowledge should be developed about the options for substituting different fish species with non-fish protein and oil at different times of year to obtain a required fishmeal quality and specification.
• Premium branding: European aquaculture, in partnership with its own customers, should seek to develop its premium brand image by encouraging its feed suppliers to move toward targets for achieving sustainable supplies.
5. ENVIRONMENTAL IMPACT OF AQUACULTURE BASED ON FEEDFISH AS INPUTSWhile the sourcing of sustainable raw materials for aquafeeds is only just now becoming a serious issue in European aquaculture, the impact of aquafeeds on the environment has been on the agenda for a number of years after the potential magnitude of waterbody eutrophication and other effects of intensive aquaculture were realized. As a result, the content, digestibility and physical structure of pelleted feeds have undergone considerable evolution to minimize wastage and their subsequent effect on the environment.
5.1 Environmental impacts of aquafeed use in EuropeCompounded fish feeds, especially for carnivorous fish such as salmon, trout, seabass and seabream, are now used for over 99 percent of European aquaculture production of finfish. Food-derived waste has four sources (Dosdat, 2003):
• Uneaten feed. This is the case with artificial feeding, generally due to poor husbandry, fish diseases or unsuitable environmental conditions.
• Undigested feed. This is the case mainly in bivalves when the control of intake and repletion is insufficient. Thus, they ingest more than they can process and release the intact microalgae in the form of faeces called pseudo-faeces.
• Indigestible compounds. Complex molecules present in the feed are split into small molecules that either can or cannot cross the intestinal barrier during digestion. Those that cannot, due to their size or their shape, are rejected in the form of particulate matter (faeces).
• Excreta. Excretion is the physiological phenomenon by which molecules that come into the body and dissolve in the plasma are released after being processed and degraded. These are soluble compounds that are discharged into the water through particular organs, such as the gills and the kidney. Thus, aquatic animals are directly subjected to the effect of their own waste products.
The impacts of these waste materials can be divided into two main areas of concern:
• Hyper-nutrification of the waterbody: Eutrophication is the process of natural or anthropogenic enrichment of aquatic systems with inorganic nutrient elements. The long-term eutrophication of coastal and estuarine waters results from the additions of both dissolved inorganic and organic nutrients and increased biological oxygen demand (BOD). Dissolved inorganic nutrients released by finfish culture and regenerated from sediments enriched with sedimented organic matter may stimulate phytoplankton production and increase oxygen demand. The degree of nutrient enrichment is influenced by the scale of aquaculture, local hydrographic

Wild fish and other aquatic organisms as feed in aquaculture in Europe 249
characteristics and the magnitude of other sources relative to aquaculture, and internal processes such as uptake by phytoplankton, algae, internal recycling, resuspension of fine material and uptake by biofouling communities that colonize cage-farming areas. Eutrophication can alter the ratio between essential nutrients (carbon: nitrogen: phosphorus), as well as absolute concentrations by causing a shift in phytoplankton species assemblages. The possible interactions between aquaculture and harmful algal blooms (HABs) are of considerable current environmental and public interest in Europe. This relationship exists on two levels: (i) the role of intensive finfish aquaculture in contributing to HAB events through the ability of fish to input nutrients into the aquatic ecosystem through uneaten food, faecal material and metabolic by-products; and (ii) the impact of HABs resulting from wider anthropogenic and natural sources upon aquaculture systems, especially cultured bivalves. Other studies have looked at the effects of different shellfish and finfish excretion products on phytoplankton growth – shellfish excreta are generally stimulatory; finfish ammonia compounds are also stimulatory, but other metabolic products may have an inhibitory effect (Arzul, Seguel and Clément, 2001).
• Sedimentation from faecal solids and uneaten food: Both finfish and shellfish aquaculture produces particulate wastes that mainly result from the undigested organic and inorganic elements of the feed materials. While land-based farms are able to remove these elements from the system through the use of settlement ponds and filtration, they are more difficult to control in cage farms. Particulate loss occurs during finfish feeding, and wastes are usually found directly under the net cages with relatively local impacts. The underlying sediments become enriched with organic matter that degrades more easily than the natural particulates in coastal areas. This may have important consequences for sediment biogeochemistry, especially when microbial activity is engaged. In the marine environment, sulphate reduction is among the most important mineralization processes and is stimulated by enrichment with organic matter. This leads to an increase in the production of sulphides, which may accumulate to levels toxic for benthic fauna. In moderately enriched sediments, opportunistic species may survive, but if enrichment is increased further, the fauna may disappear completely. This leaves the degradation of waste products to microbes only, and such a change is usually followed by increased burial rates of organic matter. It then becomes very difficult for a climax benthic community to re-establish itself. The impact of such sediment deposition may largely be limited to localized effects. However, the change in such coastal benthic faunal communities may have consequences for inshore nursery grounds. These are not necessarily negative, as juvenile stages may benefit from faunal changes, as they are able to consume the copepods or annelids favoured by organic enrichment.
The use of trash fish in European aquaculture is limited to tuna fattening in the Mediterranean Sea. The Worldwide Fund for Nature (WWF) has noted that this has had a number of undesirable impacts, such as increasing the fishing pressure for species that were not previously fished commercially, such as the round sardinella in the western Mediterranean Sea, with possible consequences for one of its main predators, the common dolphin. In addition, they raise the possibility of transmitting viruses from non-endemic feedfish to local wild fish populations, as has been experienced in Australian waters (WWF, 2005).
5.2 Examples of environmental “best practice”Intensive aquaculture in Europe has been driven to improve efficiency by a combination of lower economic margins and an increasingly strict regulatory environment. This is reflected by the very low FCRs now experienced in salmonid and seabass/seabream

Fish as feed inputs for aquaculture – Practices, sustainability and implications250
culture, as well as by the gradual adoption of joint area management, where companies operating within an enclosed or semi-enclosed area work to reduce the cumulative impact of their production.
Various approaches have emerged from the salmon farming industry in Scotland and Norway that provide useful examples of environmental “best practice” that have potential for wider replication through Europe, especially in the expanding cage-culture subsector.
• Modelling of sites to set biomass limits: Computer modelling can provide assessments of both impacts from nutrient loading on waterbody or regional algal productivity, as well as the benthic effects from sub-cage deposition. The particle tracking model Depomod has been extensively used in Europe for determining the theoretical carrying capacity of cage-farming areas as well as assessments of the deposition of organic matter beneath finfish cages and mussel rafts. Depomod is limited to near field predictions through the use of a uniform horizontal flow field – detailed modelling at a waterbody and regional scale requires the capability to represent two or three dimensional flows, depending on the degree to which the waterbody is vertically mixed. Various proprietary models exist, for example Delft3D and Mike21, that can enable detailed assessments of the cumulative effects from aquaculture activity on water quality, such as nutrients and algal activity, in a waterbody. While numerical flow and water-quality models of this nature require considerable effort to set up and calibrate, and the level of effort required increases with the complexity and scale of the model domain and the water quality processes of interest, they can provide useful predictions on the carrying capacity of sites and thus assist in the planning and consenting of aquaculture development.
• Setting of EQS: Environmental Quality Standards (EQS) can be used in assimilative capacity model development. EQS values have to be set for the different environmental quality variables (EQVs) defined by regulators and industry bodies, such as dissolved oxygen concentrations. These then provide the basis for setting environmental quality benchmarks and monitoring targets for aquaculture areas.
• Joint management of sea, semi-enclosed bay, lake and watershed areas: In Scotland, the use of Area Management Groups has resulted in greater coordination between different farming interests within a single waterbody that allows joint management actions, such as the complete fallowing of sea areas between aquaculture production cycles. This helps control and reduce the cumulative impacts of intensive aquaculture, especially in areas with limited flushing rates.
• Waste reduction strategies: Perhaps the greatest change in intensive aquaculture over the last ten years has been the reduction of wastage through better management and monitoring of feeding. Various approaches have been adopted, including maximizing the bioavailability of feed components through applied research, as well as better feed delivery management using computer-controlled, centralized feeding systems. Feeding rates can be further adjusted by the use of underwater cameras and sensors that detect when feed is passing through cage systems and not being utilized by the stock, thus invoking a reduction in feeding rates.
• Environmental monitoring: Intermittent monitoring of the benthos and water column will also provide managers with information on the levels of feed utilization, wastage and impact from aquaculture systems, especially when combined with the EQS approach described above.

Wild fish and other aquatic organisms as feed in aquaculture in Europe 251
6. CURRENT AND POTENTIAL ALTERNATIVE USES OF FEEDFISH AND OTHER AQUATIC SPECIES AND THE RELATED MACRO-LEVEL IMPACT ON FOOD SECURITY AND POVERTY ALLEVIATION 6.1 Current and alternative uses of feed-fish catchesEurope differs from Asia in that aquaculture depends upon formulated diets that have been made from fishmeal and fish oils from targeted feed fisheries. Around three-quarters of European fishmeal is derived from targeted feed-fish fishery catch, while one-quarter is from either (i) those fisheries where a portion is used for direct human consumption or (ii) bycatch or trimmings that are utilized for fishmeal when no economically preferable alternative is available.
Table 22 shows the ten main species used to produce fishmeal in Europe. Excluded from this analysis are the feed fisheries of South America, which are considered separately within this volume. This table indicates a number of trends and opportunities:
6.1.1 Increased utilization of the feed fisheries for human consumption: While some of the feed-fish species are too small to use for human consumption (i.e. sand eel and Norwegian pout), others show some potential for direct human consumption, specifically blue whiting and capelin (Table 22).
Blue whiting are unlikely to find a ready market in chilled form, either as whole fish or as fillets – their small size, discoloration due to autolysis and bruising and the presence of parasites all weigh against them in competition with other well established white fish species. However, research some 10–15 years ago (MAFF, undated) showed that skinless fillets can be produced from chilled or frozen whole fish for the manufacture of frozen laminated blocks for finger or portion production. Another possible product form investigated was blue whiting mince prepared from skinless fillets that could also be used to manufacture fish cakes, fish pies and cook-freeze dishes. One possible European export outlet for blue whiting is to Japan as surimi, an intermediate product in mince form used there for the manufacture of kamaboko, a speciality product of high value. Uptake of these new technologies has been slow and blue whiting is unlikely to become an important food fish in the near term.
A proportion of capelin is currently used for human consumption (Figure 9). Around 16 percent of the Icelandic catch in 2005 was frozen whole for sale in Japanese and East European markets. Over the early part of the 2006 season, of the 135 000 tonnes reported caught by Icelandic vessels, 58 000 tonnes (42 percent) were frozen for human consumption and 78 000 tonnes (58 percent) were processed into meal and oil. Such low capelin catches favour a higher proportion of these fish going for human consumption – an examination of the trend in Icelandic capelin usage over the last ten years indicates a fairly consistent volume of capelin used for human consumption.
6.1.2 Non-target, bycatch or trimmings that are utilized for fishmealA number of food-fish species are also used for reduction into fishmeal and fish oil, either whole when market conditions
Source: FAO (2005a)
FIGURE 9Icelandic capelin production by product type, 1994-2005
0
50 000
100 000
150 000
200 000
250 000
300 000
350 000
400 000
1994 1995 1996 1997 1998 1999 2000 2001 2002 2003 2004 2005
Prod
ucti
on (t
onne
s)
Y e ar
Capelin meal Capelin oil Capelin roes, frozen Capelin, frozen
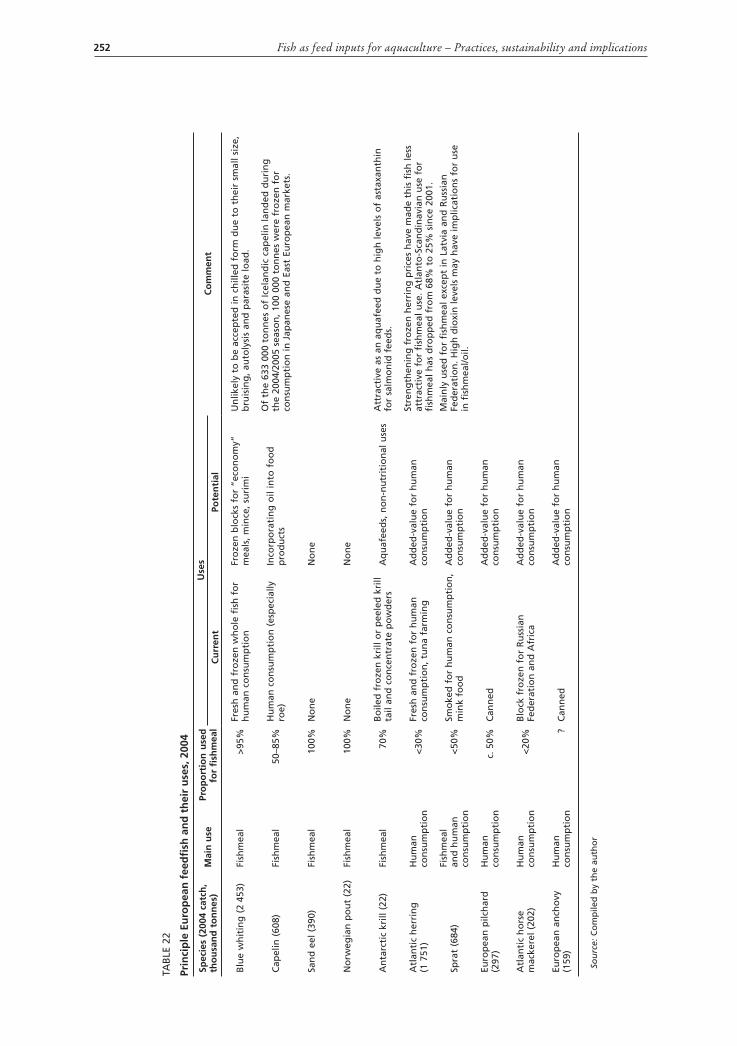
Fish as feed inputs for aquaculture – Practices, sustainability and implications252
TAB
LE 2
2
Prin
cip
le E
uro
pea
n f
eed
fish
an
d t
hei
r u
ses,
200
4
Spec
ies
(200
4 ca
tch
, th
ou
san
d t
on
nes
)M
ain
use
Pro
po
rtio
n u
sed
fo
r fi
shm
eal
Use
sC
om
men
tC
urr
ent
Pote
nti
al
Blu
e w
hit
ing
(2
453)
Fish
mea
l>
95%
Fres
h a
nd
fro
zen
wh
ole
fis
h f
or
hu
man
co
nsu
mp
tio
nFr
oze
n b
lock
s fo
r “e
con
om
y”
mea
ls, m
ince
, su
rim
iU
nlik
ely
to b
e ac
cep
ted
in c
hill
ed f
orm
du
e to
th
eir
smal
l siz
e,
bru
isin
g, a
uto
lysi
s an
d p
aras
ite
load
.
Cap
elin
(60
8)Fi
shm
eal
50–8
5%H
um
an c
on
sum
pti
on
(es
pec
ially
ro
e)In
corp
ora
tin
g o
il in
to f
oo
d
pro
du
cts
Of
the
633
000
ton
nes
of
Icel
and
ic c
apel
in la
nd
ed d
uri
ng
th
e 20
04/2
005
seas
on
, 100
000
to
nn
es w
ere
fro
zen
fo
r co
nsu
mp
tio
n in
Jap
anes
e an
d E
ast
Euro
pea
n m
arke
ts.
San
d e
el (
390)
Fish
mea
l10
0%N
on
eN
on
e
No
rweg
ian
po
ut
(22)
Fish
mea
l10
0%N
on
eN
on
e
An
tarc
tic
krill
(22
)Fi
shm
eal
70%
Bo
iled
fro
zen
kri
ll o
r p
eele
d k
rill
tail
and
co
nce
ntr
ate
po
wd
ers
Aq
uaf
eed
s, n
on
-nu
trit
ion
al u
ses
Att
ract
ive
as a
n a
qu
afee
d d
ue
to h
igh
leve
ls o
f as
taxa
nth
in
for
salm
on
id f
eed
s.
Atl
anti
c h
erri
ng
(1 7
51)
Hu
man
co
nsu
mp
tio
n<
30%
Fres
h a
nd
fro
zen
fo
r h
um
an
con
sum
pti
on
, tu
na
farm
ing
Ad
ded
-val
ue
for
hu
man
co
nsu
mp
tio
n
Stre
ng
then
ing
fro
zen
her
rin
g p
rice
s h
ave
mad
e th
is f
ish
less
at
trac
tive
fo
r fi
shm
eal u
se. A
tlan
to-S
can
din
avia
n u
se f
or
fish
mea
l has
dro
pp
ed f
rom
68%
to
25%
sin
ce 2
001.
Spra
t (6
84)
Fish
mea
l an
d h
um
an
con
sum
pti
on
<50
%Sm
oke
d f
or
hu
man
co
nsu
mp
tio
n,
min
k fo
od
Ad
ded
-val
ue
for
hu
man
co
nsu
mp
tio
n
Mai
nly
use
d f
or
fish
mea
l exc
ept
in L
atvi
a an
d R
uss
ian
Fe
der
atio
n. H
igh
dio
xin
leve
ls m
ay h
ave
imp
licat
ion
s fo
r u
se
in f
ish
mea
l/oil.
Euro
pea
n p
ilch
ard
(2
97)
Hu
man
co
nsu
mp
tio
nc.
50%
Can
ned
Ad
ded
-val
ue
for
hu
man
co
nsu
mp
tio
n
Atl
anti
c h
ors
e m
acke
rel (
202)
Hu
man
co
nsu
mp
tio
n<
20%
Blo
ck f
roze
n f
or
Ru
ssia
n
Fed
erat
ion
an
d A
fric
aA
dd
ed-v
alu
e fo
r h
um
an
con
sum
pti
on
Euro
pea
n a
nch
ovy
(1
59)
Hu
man
co
nsu
mp
tio
n?
Can
ned
Ad
ded
-val
ue
for
hu
man
co
nsu
mp
tio
n
Sou
rce:
Co
mp
iled
by
the
auth
or

Wild fish and other aquatic organisms as feed in aquaculture in Europe 253
make reduction an economically preferable alternative or as trimmings from processing waste.
Atlantic herring stocks are improving and support a number of economically important fisheries. The majority of herring catches are landed as either fresh or frozen whole fish. In the EU, controlled herring fisheries (west of the United Kingdom, the North Sea, the Skagerrak and Kattegat Seas) food grade can only be sent for reduction if there is no market for human consumption. All fish caught in the Baltic Sea can be offered as feed grade.
As shown in Table 23, the proportion of herring processed for fishmeal by the Atlanto-Scandinavian fisheries has decreased from 68 percent in 2001/2002 to 25 percent in 2004/2005 due to a combination of greater land and sea freezing capacity as well as strengthening prices for the frozen whole product for human consumption.
Antarctic krill demand is likely to increase due to its excellent value as a nutrient source for farmed fish and crustaceans (protein, energy, essential amino acids). Other outstanding properties of krill are its natural pigment content (particularly appropriate for salmon farming), its palatability, its low content of pollutants and its likely improvement of larval fish survival. These attributes make krill a more attractive feed than potential competitors such as squid meal, clam meal, artemia soluble and fish soluble (Sclabos, 2004).
The western European catch of sprat has largely been used for fishmeal, but it is a popular food fish in eastern European Baltic states. However, with the increased awareness of dioxin contamination of oily fish in the Baltic Sea, it may be that the demand for human consumption will decrease and a greater proportion will be used for reduction (FAO, 2005b). There is, therefore, the possibility for increased human utilization by the countries of Eastern Europe of the “low-value” feedfish from the cleaner waters of the North Atlantic. However, this potential is likely to be constrained by the continued low demand for low-value fish10 from this region – in 1985, the
TABLE 23
Levels of herring processed for fishmeal and human consumption, 2001–2005
Icelandic herring2001/2002 2002/2003 2003/2004 2004/2005
Thousand tonnes % Thousand
tonnes % Thousand tonnes % Thousand
tonnes %
Processed on land for human consumption 35 35 28 29 33 26 33 29
Processed at sea for human consumption 21 21 19 20 27 21 37 32
Total processed for human consumption 56 56 47 49 60 47 70 61
Total Processed for fishmeal* 45 45 49 51 66 52 45 39
Total processed 101 100 96 100 126 100 115 100
Atlanto-Scandinavian herring
2001/2002 2002/2003 2003/2004 2004/2005
Thousand tonnes % Thousand
tonnes % Thousand tonnes % Thousand
tonnes %
Processed on land for human consumption 7 6 2 2 0 0 3 2
Processed at sea for human consumption 33 26 48 39 47 53 102 73
Total processed for human consumption 40 32 50 41 47 53 105 75
Total processed for fishmeal* 86 68 73 59 42 47 35 25
Total processed 126 100 123 100 89 100 140 100
* It has been assumed that 50 percent of the catch processed on land will be trimmings that are going to the fishmeal industry.Source: www.srmjol.is/displayer.asp?cat_id=47&module_id=220&element_id=207, accessed May 2007

Fish as feed inputs for aquaculture – Practices, sustainability and implications254
regional annual consumption of low-value fish was 2.5 million tonnes but dropped to 150 thousand tonnes by 1997 – and is not predicted to increase to much more than 161 thousand tonnes per year by 2020 (Delgado et al., 2002).
In summary, the use of the main feed-fish species for direct human consumption is driven by market and other economic factors rather than technical or product development constraints. As a result, there is unlikely to be any dramatic change in the production of feed-fish species being used directly as food over the medium term. However, this depends upon a number of extrinsic factors such as the availability and price of other feed protein commodities such as soya meal.
6.2 Comparative analysis of use in aquafeeds versus for human consumptionAs the section above indicates, there are few alternative uses of feedfish for the main feed fisheries supplying fishmeal production in Europe that are not already being utilized. In European feed fisheries, a more fundamental question is whether it is more ecologically efficient if these feed-fish stocks – which are often prey items for both commercial fish species as well as an integral mid-level component of the food chain in many European seas – are left in the sea. Essentially, is it more effective to harvest low trophic-level species in industrial fisheries and convert the biomass obtained to human consumption fish protein in aquaculture systems, or is it better to leave low trophic-level fish in the sea where they can be consumed by their natural predators, and then to harvest species from higher trophic levels in fisheries for human consumption?
This question was asked of ICES by the EC’s DG Fisheries, and its response was published in the annual report of the ICES’ Working Group on Ecosystem Effects of Fishing Activities (ICES, 2004). Its conclusions were as follows:
• Transfer efficiencies in natural marine food webs: The transfer efficiency of both energy and carbon between trophic levels along a food chain is not 100 percent. Energy is required for metabolism and maintenance, and only a fraction of the food consumed by a predator is actually converted to predator biomass. Transfer efficiencies in the range from 10 to 15 percent are generally accepted for predator-prey interactions involving fish predators in marine temperate shelf-sea food webs (Jennings, Kaiser and Reynolds, 2001).
• Transfer efficiencies in aquaculture systems: Taking into account the levels of fishmeal inclusion and food conversion ratios, the total conversion efficiency of, say, a sand eel-derived salmon diet in producing a harvestable biomass is around 10–17 percent, which is much in line with natural food webs.
• Other energetic factors: In addition to the above efficiencies, the energy/material “costs” need to be considered. Additional materials are required for production of fish feeds, as well as the energy involved in processing. However, while the trophic energy efficiency in marine food chains may be around 10–15 percent, this does not account for natural mortality due to predation, which may reduce this efficacy considerably.
• Conclusions: ICES concluded that “if one is only concerned about the efficiency of converting sandeel biomass to human consumption fish biomass, then the exploitation of sandeels by industrial fisheries for the aquaculture industry is at least as efficient ecologically”. ICES then goes on to ask the question as to whether it is of greater benefit to society to exploit lower trophic-level marine fish resources in industrial fisheries and rely on an aquaculture industry to provide mankind’s human consumption fish requirements, or is it better to leave these fish to be processed through the natural marine food web and then to harvest fish in the higher trophic levels in fisheries for human consumption?
10 Low-value fish according to the International Standard Statistical Classification of Aquatic Animals and Plants (ISSCAAP) include herrings, sardines, anchovies and mackerels.

Wild fish and other aquatic organisms as feed in aquaculture in Europe 255
ICES examined the premise that if industrial fisheries are reduced, then gains reflecting 10 percent of the reduction will be made in human consumption landings. Runs of a Multi-Species Virtual Population Analysis (MSVPA) model were used to examine this assumption, as were data on the consequences of a four-year closure of the East of Scotland sand-eel fishery on local gadoid (cod, haddock and whiting) populations. The results provided no evidence to support the contention that ceasing industrial fisheries will stimulate catches in the fisheries for human consumption at the current time and under the prevailing circumstances. ICES goes on to state that so long as the food conversion efficiencies are regularly reviewed, then a closely regulated combination of industrial fisheries and fisheries for human consumption may provide the only solution to the long-term demand for fish protein.
6.3 Risks of utilizing feedfish in the food chainWith European aquafeeds so reliant upon fishmeal from wild sources, the aquafeed industry is potentially vulnerable to economic factors that might change the price of fishmeal, with significant consequences for what is now a low-margin farming process. The industry is also vulnerable to health issues arising from contamination of fishmeal and fish oil raw materials, either through concentration of pollutants through the food chain or via the production and distribution process, that affect consumer confidence in the farmed product.
Two potential problems have become particularly important recently (New and Wijkström, 2002). The first problem is the presence of dioxin, polychlorinated biphenyl (PCB) and other persistent organic pollutant (POP) residues in human food products of animal origin and the potential carryover of these substances from animal feeds. The second problem is the relationship between meat and bone meal and the incidence of bovine spongiform encephalopathy (BSE) in ruminants, coupled with the linkage with Creutzfeld-Jacob Disease (CJD).
6.3.1 Persistent organic pollutant (POP) residuesSalmonids, which represent around 80 percent of European aquaculture production by volume, are relatively oily fish that easily bioaccumulate lipophilic POPs such as PCBs, dioxins and polybrominated diphenyl ethers (PBDEs), should they be present in the diet. It is widely recognized that contamination levels of forage fish from the industrialized waters of the Baltic Sea and coastal waters elsewhere in the northeastern Atlantic are higher than those found in Pacific waters, and this may be mirrored in feeds manufactured from fishmeal originating from these waters.
The levels of POPs (PCBs, dioxins, toxaphene and dieldrin) in farmed fish were brought to wide public attention with a much quoted study reported in the journal Science (Hites, et al., 2004) that investigated contaminants in a variety of fish feeds and farmed salmon products. Hites et al. (2004) concluded that salmon produced in Europe had significantly higher contaminant levels than those produced in both North and South America, reflecting higher contaminant concentrations in forage fish from the industrialized waters of Europe’s North Atlantic as compared with forage fish from the waters off North and South America. Indeed, fishmeal and fish oils of European origin have been reported by the Scientific Committee on Animal Nutrition (SCAN) of the European Commission to contain much higher levels of dioxin than those originating from the cleaner waters off Peru and Chile (SCAN, 2000). Such differences in dioxin content not only affect fishmeal and fish oils but also influence the residue levels in wild fish caught for direct human consumption. In a study of European fish cited by Klinkhard (2001), one of the highest dioxin contents found in samples taken between 1995 and 1999 was in wild salmon from the Baltic Sea (Sweden). Of the farmed salmon and trout analysed during this period from Finland, Germany, Norway, Sweden and

Fish as feed inputs for aquaculture – Practices, sustainability and implications256
the United Kingdom, the highest level of dioxin reported was only 15 percent of the level found in Baltic wild salmon.
In order to improve food safety, the EU has adopted a two-fold strategy of (i) reducing POP inputs into the environment and (ii) restricting the level of POPs that can enter the human food chain by setting the maximum and action levels11 of dioxins in fishmeal, fish oil and aquafeeds over the period 2002–2005 as shown in Table 24. These levels are close to the levels found in fishmeal and fish oil of European origin but much higher than the highest levels found in products originating from Chile and Peru.
The comparisons between different sources of fishmeal and fish oil show very low levels of dioxin. SCAN commented that “no adverse effects from dioxins would be expected in mammals, birds and fishes exposed to the current levels of background pollution” (SCAN, 2000). Despite this, a considerable proportion of the population of Europe (and undoubtedly other regions) is exceeding the tolerable weekly intake (TWI) levels for dioxins set by various authorities. As there is a considerable safety factor imposed on TWI, this does not necessarily mean that there is an appreciable risk to individual health. However, exceeding TWI levels erodes the protection of this safety factor.
European exposure to dioxins and PCBs is decreasing (by a factor of about 50 percent over the last 10–15 years) due to improved waste management and restrictions on the use of these materials.
6.3.2 Transmissible spongiform encephalopathy (TSE)First, it is important to state that there is no epidemiological evidence for the transmission to humans of a variant of CJD caused by prions that use fish or fish products as vectors (GLOBEFISH, 2001).
A temporary EU ban on the use of animal proteins in certain livestock feeds was approved in 2000 (Commission Decision 2000/766/EC; Council of the European Union, 2000) over the period to June 2003 and has since been extended to June 2005. The main purpose of this action by the EU was the removal of meat and bone meal from European animal feeds, together with the destruction of stocks of this material, in an effort to contain the spread of BSE. A permanent TSE Regulation (1234/2003) amending regulation 999/2001 covering feed controls came into effect in September 2003 (although the ban on the use of blood products and blood meal was lifted). The EU ban is still in force at the time of writing.
The EU ban on the use of animal proteins includes the use of fishmeal in ruminant feeds but does not ban its use in feeds for pigs or poultry, or its use in aquafeeds. The EU ban on the use of fishmeal in ruminant feeds was initiated because meat and bone meal has unfortunately been used at times to adulterate fishmeal in order to alter its protein content. While the use of fishmeal is not banned in feeds for other animals, including fish, the ban concerning ruminant feeds causes a further problem for feed manufacturers generally. This problem is that cross-contamination may occur between
TABLE 24
Current limits on dioxins in fishmeal, fish oils and aquafeeds
Product Maximum level(ng/kg product)
Action level(ng/kg product)
Fishmeal 1.25 1.0
Fish oil 6.00 4.5
Compounded fish feed 2.25 1.5
Source: University of New Castle upon Tyne and Poseidon Aquatic Resource Management Ltd . (2004)
11 Action levels act as an “early warning”, triggering a proactive approach from competent authorities and operators to identify sources and pathways of contamination and to take measures to eliminate them.

Wild fish and other aquatic organisms as feed in aquaculture in Europe 257
batches of feeds made for one type of livestock and batches made for other types of animals – the current EC regulation has a zero tolerance, and thus manufacturers have been forced to mill ruminant and non-ruminant feeds at different factories. It is possible that the current ban may stay in place for some time. However, the tolerance level has been lifted to 1 percent, which should ease the situation for feed producers.
7. REGIONAL ISSUES ON THE USE OF FISH AND/OR OTHER AQUATIC SPECIES AS FEED FOR AQUACULTURE7.1 Issues of regional importanceGiven the high level of dependence of European aquaculture on compounded feeds in intensive systems, the issues of regional importance reflect the sourcing of raw materials included in the feeds rather than the environmental impact of their actual use. It is considered that there are three issues of immediate concern:
• Improved sustainable management of feed-fish stocks: Feed fisheries, which are largely composed of small, bony pelagic fish, require quite distinct management approaches compared with the often larger and slower-growing fisheries for human consumption. As described earlier in this report, their management needs to recognize the dynamic turnover of the stock and the high degree of inter-annual variability that may depend upon extrinsic, often climate-related factors. Furthermore, they may be highly migratory and, therefore, often shared among more than one fishing nation.
Within Europe, the majority of the northern feed stocks are managed through the European Commission Common Fisheries Policy (CFP), mainly acting upon the advice of the International Council for the Exploration of the Seas (ICES). Other major fisheries – most notably those managed by Norway and Iceland – are also subject to national, EC and international management agreements. Mediterranean fisheries within EU Member States’ waters operate under the CFP as well as within the wider General Fisheries Council for the Mediterranean (GFCM) management regime with the FAO.
While it is possible to provide science-based precautionary management of feed -fish stocks, political and economic reality may combine to reduce management effectiveness, as typified by the long period in which it took to finalize the joint management of the northern blue whiting stock. Furthermore, the ecosystem linkages between feed fisheries and natural predators such as white fish, tunas, sea birds and marine mammals are still not fully understood, and thus further precautionary thinking is necessary in many cases.
• Increased utilization of feedfish for human consumption: As mentioned earlier, while catchs of a number of food fisheries are not suitable for direct human consumption, catchs of other food fisheries are. The main barriers to their direct use are not so much technical but more related to market and other economic or cultural influences.
• Greater substitution by protein and oil substitutes: Substitutes for fishmeal protein and marine fish oils are continuously being sought and progress is being made. Protein substitutes are already used in fish feed in the United Kingdom and Norway, with up to 25 percent of the protein in the feed derived from plants. The uptake of fish oil substitutes has been slower. Concerns over the dioxin and PCB levels in the northern hemisphere fish oils have increased the pressure on fish oil manufacturers to produce oils with reduced levels of dioxins. Scottish Quality Salmon (SQS) has revised its Quality Manual (Product Certification Scheme for Scottish Quality Farmed Salmon) to allow up to 25 percent of the oils added to the fish feed to be of plant-based origin. However, the level of substitution of fish-based meals and oils possible is limited by their lack of essential amino acids (such as lysine, methionine and histidine). Substitution at higher levels may limit

Fish as feed inputs for aquaculture – Practices, sustainability and implications258
grow. Another issue facing the plant meal and oil substitution option in Europe is consumer opinion and the affect that vegetable oil substitutes may have on the continued acceptance of farmed fish as a “high-quality” product similar to its wild counterpart. To produce a product as “near to the wild product as possible”, research is also focusing on the “dilution” of vegetable oils in the flesh when fish are fed diets containing 100 percent marine fish oils for six months prior to harvest. In addition, vegetable oil substitutes do not necessarily improve the environmental sustainability of the product (e.g. increased soybean production may lead to further rainforest clearance).
7.2 Ongoing work of interest7.2.1 Improved sustainable management of feed-fish stocksIn Europe, most work on northern stocks is through ICES, which includes a number of relevant working groups:
• Planning Group for Herring Surveys• Planning Group on Northeast Atlantic Pelagic Ecosystem Surveys• Regional Ecosystem Study Group for the North Sea• Study Group on Assessment Methods Applicable to Assessment of Norwegian
Spring Spawning Herring and Blue Whiting Stock• Study Group on Regional Scale Ecology of Small Pelagics• Study Group on the Estimation of Spawning Stock Biomass of Sardine and
Anchovy• Working Group on Ecosystem Effects of Fishing Activities• Working Group on Northern Pelagic and Blue Whiting Fisheries• Working Group on the Assessment of Mackerel, Horse Mackerel, Sardine and
AnchovyThese working groups feed information into the decision-making process through
the ICES Advisory Committee on Fishery Management (ACFM). The ACFM meets twice a year (summer and late autumn) to prepare its advice, which is then translated into effective management by the national governments and the EU.
EU fisheries management in the Mediterranean Sea tends to be focused upon coastal fisheries. In general, EU catch limits or quotas are not applicable in the Mediterranean Sea, with the exception of limits on bluefin tuna that have been introduced in response to recommendations by the International Commission for the Conservation of Atlantic Tuna (ICCAT). In contrast, the GFCM’s work has focused on shared or straddling stocks, particularly those involving demersal and large pelagic species. GFCM’s Sub-Committee on Stock Assessment (SCSA) recently assessed the stocks of 11 small pelagic species, which assessment will result in the development of management programmes controlling the pelagic trawling and purse-seine fisheries exploiting anchovy (Engraulis encrasicolus), sardine (Sardina pilchardus) and sprat (Sprattus sprattus) (FAO, 2006b).
The EU is currently finalizing a strategy and action plan to improve scientific advice and research in stock evaluation in the waters of third countries. This strategy will combine actions to (i) improve data collection, management and use; (ii) increase the level of research, especially into ecosystem considerations; (iii) strengthen the role of Regional Fisheries Organization (RFOs) and (iv) provide greater cooperation with European research and advisory organizations, as well as improve the capacity of national fisheries administrations to operate within a regional context.
Ultimately, pressure for improved management of feed-fish stocks must come from both the aquaculture industry and consumers. One of the barriers to the environmental certification of aquaculture in Europe has been the inability of the feed manufacturers to assure the sustainable sources of fishmeal and fish oils in compounded feeds. As mentioned earlier, this has become an increasingly important issue, with feed manufacturers looking to FIN for reassurance (see Section 4.2.1). There has also

Wild fish and other aquatic organisms as feed in aquaculture in Europe 259
been growing pressure for independent certification through such schemes as MSC’s standard for responsible fishing (see Section 4.2.2).
7.2.2 Impact of fisheries on marine ecosystemsThere have been an increasing number of reviews of the impact of fisheries upon marine ecosystems, including:
• ICES/SCOR (Scientific Committee on Oceanic Research) Symposium on Ecosystem Effects of Fishing (ICES Journal of Marine Science, 57(3), June 2000);
• The Workshop on the Use of Ecosystem Models to Investigate Multispecies Management Strategies for Capture Fisheries (Fisheries Centre Research Reports, Vol. 10(2), 2002);
• The IWC Modeling Workshop on Cetacean-Fishery Competition (Journal of Cetacean Research and Management, 6 (Suppl.), 2004); and
• The Workshop on Ecosystem Approaches to Fisheries in the southern Benguela (African Journal of Marine Science 26, 2004).
7.2.3 Increased utilization of feedfish for human consumption Small-pelagic fish tend to be highly perishable – the high oil content of the flesh makes them susceptible to oxidative rancidity, makes the flesh soft and more susceptible to physical damage and faster spoilage than white fish. The high catch rates also mean that fish to be used for human consumption must be landed, chilled and processed in large quantities, and they must be handled rapidly. Much research was carried out in the 1980s in the United States of America into the use of menhaden for surimi, but uptake was limited because it was not possible to de-fat the flesh to achieve a shelf-stable product without affecting the taste and texture of the flesh. The Nordic Industrial Fund supported a Nordic network project entitled “Pelagic fish–New Possibilities” which includes a homepage that collates technical, scientific and industrial information about catching and processing small pelagic fish with the specific aim of facilitating diversification of small pelagic fish products, especially for direct human consumption. Otherwise, there has been extensive private sector interest in developing processing techniques both to stabilize small pelagic material and to extract the main protein components for use in more versatile forms such as surimi.
7.2.4 Greater substitution with protein and oil substitutesThe potential for including higher levels of non-fishmeal protein sources in aquafeeds has been explored for a number of years with gradual but significant success. As discussed earlier, the proportion of oilseed and legume-derived meals in aquafeeds will increase from 17 percent to 24 percent by 2010, resulting in the reduction of northern hemisphere fishmeal, while vegetable oils will become an important source of oils in salmonid aquafeeds, accounting for nearly a quarter of the oil content by 2010, again resulting in the reduction of northern hemisphere, from the feed-fish supplies.
Research is currently being conducted by the major aquafeed manufacturers in Europe and is being supported by research initiatives from both individual governments and the European Commission. Current or recent initiatives of interest include:
• Perspectives of Plant Protein Use in Aquaculture (PEPPA) project: a €2.5 million project over 2001–2004 to (i) replace the greater amount of fishmeal with plant protein sources in fish diets while improving muscle protein growth, fish quality, health, reproductive potential and environmental quality; (ii) understand the metabolic fates of dietary amino acids and carbohydrates as carbon donors and as an energy source; and (iii) strengthen our understanding of the relationships between nutritional factors and endocrine control of muscle growth and adiposity using cellular and molecular approaches.

Fish as feed inputs for aquaculture – Practices, sustainability and implications260
• Researching Alternatives to Fish Oil in Aquaculture (RAFOA): an EU-funded project studying the effect of substitution of fish oils with plant oils on growth performance, fish health and product quality during the entire life cycle of salmon, rainbow trout, seabream and seabass.
• The Directorate of the Fisheries Institute of Food and Nutrition in Norway has also conducted research similar to that of the RAFOA project. In addition, a second project, “Fish Oil Substitution in Salmonids” (FOSIS), is currently investigating whether fish oil can be replaced by vegetable oils in the diet without reducing the nutritional value or the growth performance of the fish, while minimizing fat deposition in the flesh.
• Two EU research projects are studying the effects of plant oils on fish digestion and metabolism, “GLUTINTEGRITY” and “FPPARS”. In addition to vegetable oils, an EU research project “PUFAFEED” is investigating the use of cultivated marine micro-organisms as an alternative to fish oil in feed for aquatic animals.
8. CONCLUSIONS AND RECOMMENDATIONS 8.1 ConclusionsEuropean aquaculture differs from aquaculture in other parts of the world in that it is a maturing industry focusing on a limited number of high-value, mainly carnivorous species. As such, the dynamic growth seen over the 1980s and 1990s has slowed, and European aquaculture is now going through a period of consolidation. This said, while growth in salmon and trout farming has slowed, the farming of seabass and seabream, as well as temperate marine species such as cod and turbot, has expanded to take advantage of the strong market as technological barriers are broken. This study considers that, based on recent trends, a cautious growth in production of around 2–5 percent per year is likely, mainly in the production of these “new” marine species.
In Europe, the intensive production of mainly carnivorous species requires a high demand for fishmeal and fish oil. With typical grow-out diets containing between 30 and 50 percent protein and 10 and 25 percent oil, European aquaculture currently uses around 615 000 tonnes of fishmeal and 317 000 tonnes of fish oil per year, thus requiring around 1.9 million tonnes of feedfish12. The main sources of these feedfish are the small pelagic stocks of northern Europe, as well as the Peruvian anchovy and jack mackerel of South America. In addition, approximately a third of fishmeal is produced from trimmings and the bycatch of food fisheries. The utilization of fishmeal for aquaculture is likely to fall on a per unit basis as inclusion rates drop through the use of alternative vegetable-based substitutes and greater efficiencies in feeding and nutrition. With the conservative rise of European aquaculture production of 2 percent per year, the use of fishmeal and fish oil is likely to rise to 629 000 tonnes and 343 000 tonnes, respectively, by 2015.
The feed fisheries make a low economic contribution to the fisheries sector as a whole, providing an estimated 0.5 percent of the EU’s fisheries-related employment and 2.1 percent of the sector’s value added. Nearly half (45 percent) of this employment is in the catching sector, with the remainder in feed-fish processing (19 percent) and fish trimming (35 percent). The adoption of technically advanced catching and processing methods has ensured that feed fisheries-related employment remains low. However, this low level of dependency hides localized relatively high levels of dependency in the fleets of Denmark and Sweden, where feed fisheries are interwoven into a substantive part of the fisheries sector as a whole.
The main impacts of this demand for fishmeal and fishoil are on the feed-fish stocks and linked elements of the food chain. Feedfish are mainly bony small pelagic fish with
12 This assumes that 66 percent of fishmeal is derived from feed fisheries and that it takes 4.8 tonnes of feedfish to produce 1 tonne of fishmeal.

Wild fish and other aquatic organisms as feed in aquaculture in Europe 261
short lives and a high level of inter-annual variability that may depend upon extrinsic, often climate-related factors. As such, they are difficult to manage on a multi-annual basis when compared with longer-lived stocks for which the state of successive year classes entering the fishery can be monitored in advance. Fortunately the high levels of fecundity allow stocks to recover relatively quickly, and thus they are protected to a certain degree from high levels of exploitation. What is less certain is the consequences of stock variability on natural predators such as gadoids, marine mammals and seabirds, as well as the contribution of fishing mortality to these effects. Recent research suggests that as long as fishing mortality remains below natal mortality, feed fisheries may not cause problems for the predators on the scale of the stock. However, locally concentrated harvesting may cause local and temporary depletions, which might affect subpopulations of species such as sand eel and their natural predators at a local level.
As can be inferred from the above, judging the sustainability of feed-fish stocks is complex. Although quality and price are the main determinants for fishmeal purchasers in the aquafeeds industry, the sustainability of feed-fish sources is beginning to be more important. At present, most buyers depend upon the FIN “Sustainability Dossier” for information on what stocks are “sustainable” or not, but there is a recognized need for a comprehensive analytical framework that integrates target stock assessment with the wider ecosystem linkages. To a degree this exists with the development of ecosystem models and approaches such as the MSC criteria for “responsible fishing”. Once such a framework has been created and is accepted as a suitable benchmark by the aquafeed industry and its detractors, then it will be easier for purchasers to purchase only from sustainable feed-fish stocks. This process will inevitably have consequences, such as greater pressure on those stocks deemed as sustainable, as well as possible effects on market economics. This implies that greater use of vegetable-based substitutes will be essential, which in turn may require a change in consumer attitudes towards their inclusion in farmed-fish diets.
There are a number of impacts of compounded feed use, especially in poorly flushed lakes and semi-enclosed waterbodies with limited flushing, with increased nutrient levels leading to limnological change as well as benthic change due to increased sedimentation. However, the high cost of feed, combined with increasingly strict environmental legislation, has meant that European aquaculture must become generally very efficient, with minimum wastage and production being limited to the assimilative capacity of sites. The rapidly expanding use of whole fish, usually small-pelagic species, for tuna fattening also has its problems, with the possible introduction of exotic pathogens into local coastal fish populations and increased pressure on the target stocks themselves.
The various feed fisheries targeted for fishmeal in Europe have little alternative uses. However, some, such as blue whiting, capelin, anchovy, herring and sprat, can be used for direct human consumption. The proportion that goes for human consumption depends largely on economic and cultural factors rather than technical limitations, and these factors are more difficult to address directly by the industry. Despite the relatively low cost of products from small pelagic fisheries, these products are not considered to contribute significantly to ensuring food security in any part of Europe, due to the ready availability of other nutritional options. In particular, while Eastern European markets have shown interest in utilizing feed-fish species such as capelin for human consumption, the volumes used are low and are not likely to grow significantly. However, the potential for greater utilization of feed-fish fisheries stocks by Eastern European consumers warrants further investigation, with a focus on the price sensitivity of these markets and recommendations on how products can be developed that might better utilize this raw material. However, expectations should be limited –the recent reductions in capelin catches due to low stock availability may impact investment opportunities and confidence.

Fish as feed inputs for aquaculture – Practices, sustainability and implications262
At an ecological level, recent work by ICES questions the immediate assumption that the reduction of fish into fishmeal and subsequent use in aquaculture is less efficient than leaving the fish in the sea to supply predators further up the food chain. It then goes on to state that so long as the food conversion efficiencies are regularly reviewed, then a closely regulated combination of industrial fisheries and fisheries for human consumption fisheries may provide the only solution to the long-term demand for fish protein.
The European aquaculture industry has proven to be vulnerable to health issues arising from contamination of fishmeal and fish oil raw materials – either through the concentration of pollutants through the food chain or via the production and distribution process – that affect consumer confidence in the farmed product. Two potential problems that have become particularly important recently include (i) the presence of dioxin, PCB and other POP residues in human food products of animal origin and (ii) the relationship between meat and bone meal, and the incidence of BSE in ruminants, coupled with the linkage with Creutzfeld-Jacob Disease (CJD). These problems have resulted in a number of pieces of strict legislation that have banned the use of fishmeal in ruminant diets and increased the logistics and costs of feed milling and compounding in order to achieve greater levels of traceability.
In summary, although feed-fish fisheries capture and processing only make a small contribution towards European fisheries-related employment (0.5 percent) and value added (2.8 percent), they help support an important aquaculture industry that has been dependent upon regional fishmeal and fish oil production to sustain its growth. Although the relative contribution of regional feed-fish stocks is likely to fall as alternative protein products become increasingly used, it is considered that they will have a continued role to play in the production of European aquafeeds as part of a balanced strategy of sustainable use and responsibility.
8.2 Recommendations for further actionBased on the above, a number of recommendations can be made to ensure that the moderate forecasted growth in European aquaculture can continue – against a background of increased global demand for fishmeal and fish oils – and yet improve its environmental performance, particularly in regard to the sustainable sourcing of raw materials for aquafeeds. Recommendations include:
• Management of European feed fisheries should be improved through a combination of greater political will and cooperation, as well as the gradual adoption of the ecosystem approach as implementation mechanisms evolve.
• Technical and other assistance should be provided to feed fisheries outside European waters, in particular South American and Antarctic resources, through greater cooperation and the strengthening of relevant regional fisheries management organizations.
• Piloting of innovative management approaches should be done, such as the certification of responsibly managed feed fisheries to provide a market incentive to influence fishmeal and fish oil purchasing.
• Barriers to the sourcing and use of sustainable fishmeal and fish oils should be addressed by (i) adopting well-structured feed-fish fisheries sustainability criteria to guide buyers; (ii) improving traceability of materials, especially if blended during manufacture or distribution; (iii) encouraging sustainable purchasing strategies through the use of formal environmental management systems, and (iv) premium branding of aquafeeds and aquaculture products produced using sustainable raw materials.
• Markets for European feedfish and their by-products in eastern Europe and the Far East should be investigated. These markets currently absorb between 60 000 and 100 000 tonnes of Icelandic capelin per year, which might be increased.
Wild fish and other aquatic organisms as feed in aquaculture in Europe 263
An investigation might focus particularly on the Russian Federation, Romania, Poland and Ukraine, which have traditionally been a keen market for small pelagic products, as well as other emerging markets. Such an investigation would examine why import levels have remained static over the last five years and determine the sensitivity of price, stock availability and other key factors constraining trade. The study should also recognize the recent falls in capelin availability and the likely impact on investor confidence.
• Food products for direct human consumption should be developed from species that are currently reduced to fishmeal and oils. These products should be economically competitive, appeal to European and export markets and be resistant to the cyclical nature of fishmeal and oil commodity pricing.
• Plant and other substitutes for fishmeal and fish oil in aquafeeds should be further developed. These substitutes must be able to provide cost-effective alternatives to fish-based products, be acceptable to consumers and not generate sustainability issues in their own right.
REFERENCESAlbert, O.T. 1994. Biology and ecology of Norway pout (Trisopterus-Esmarki; Nilsson,
1855) in the Norwegian deep. ICES Journal of Marine Science, 51: 45–61.Andersen, J. & Løkkegaard, J. 2002. Industrifiskeriets økonomiske betyding for dansk
fisker. FOI Rapport No. 134. 38 pp.Arzul, G., Seguel, M. & Clément, A. 2001. Effect of marine animal excretions on
differential growth of phytoplankton species. ICES Symposium on Environmental Effects of Mariculture. ICES Journal of Marine Science, 58: 386–390
Åsgård, T. & Austreng, E. 1995. Optimal utilisation of marine proteins and lipids for human interest. In H. Reinersten and H. Haaland, (eds.). Sustainable fish farming, pp. 79–87. Rotterdam, Netherlands, A.A. Balkema.
Auster, P.J., Malatesta, R.J., Langton, R.W., Watling, L., Valentine, P.C., Donaldson, C.L.S., Langton, E.W., Shepard, A.N. & Babb, I.G. 1996. The impacts of mobile fishing gear on sea floor habitats in the Gulf of Maine: implications for conservation of fish populations. Reviews in Fisheries Science, 4: 185–202.
Barlow, S. 2002. Resources and markets: the world market overview of fishmeal and fish oil. Paper presented to the “2nd Seafood By-products Conference, Alaska”.
Bax, N.J. 1991. A comparison of fish biomass flow to fish, fisheries and mammals in six marine ecosystems. ICES Marine Science Symposia, 193: 217–224.
Beddington. 1984. The response of multispecies systems to perturbations. In R.M. May (ed.). Exploitation of marine communities, pp. 209–225. Berlin, Springer-Verlag.
Beverton, R.J.H. 1990. Small marine pelagic fish and the threat of fishing; are they endangered? Journal of Fish Biology, 37: 5–16.
Bianchi, G., Gislason, H., Graham, K., Hill, L., Jin, X., Koranteng, K., Manickchand-Heileman, S., Paya, I., Sainsbury, K. & Sanchez, F. 2000. Impact of fishing on size composition and diversity of demersal fish communities. ICES Journal of Marine Science, 57: 558–571.
Blaxter, J.H.S. 1974. The early life history of fish. The proceedings of an international symposium held at the Dunstaffnage Marine Research Laboratory of the Scottish Marine Biological Association at Oban, Scotland, 17–23 May 1973. New York, Springer-Verlag.
Borjesson, P., Berggren, P. & Ganning, B. 2003. Diet of harbour porpoises in the Kattegat and Skagerrak seas: accounting for individual variation and sample size. Marine Mammal Science, 19: 38–58.
Brugère, C. & Ridler, N. 2004. Global aquaculture outlook in the next decades: an analysis of national aquaculture production forecasts to 2030. FAO Fisheries Circular No. 1001. Rome, FAO. 47 pp.

Fish as feed inputs for aquaculture – Practices, sustainability and implications264
CCAMLR. 2004. Management of the Antarctic krill: ensuring the conservation of the Antarctic marine ecosystem. Presented by the Antarctic and Southern Ocean Coalition (ASOC), October 2004. SC-CCAMLR-XXIII/BG.
CEFAS. 2004. Whitefish bycatch in sandeel fishing areas. Fishing News, 6 August 2004. 1 p.
Chambers, R.C. & Trippel, E.A. 1997. Early life history and recruitment in fish populations. New York, Chapman and Hall. 596 pp.
Chopin, F., Inoue, Y., Matsushita, Y. & Arimoto, T. 1996. Sources of accounted and unaccounted fishing mortality. In T. Wray, (ed.). Solving bycatch workshop: considerations for today and tomorrow, pp. 41–48. Fairbanks, Alaska Sea Grant College Program.
Council of the European Union. 1998. Council Regulation (EC) No. 850/98, for the conservation of fishery resources through technical measures for the protection of juveniles of marine organisms, 30 March 1998.
Council of the European Union. 2000. Council Decision of 4 December concerning certain protection measures with regard to transmissible spongiform encephalopathies and the feeding of animal protein (2000/766/EC). Official Journal of the European Communities, L 306: 32-33. (also available at http://ec.europa.eu/food/food/biosafety/bse/docs/d00-766.pdf)
Council of the European Union. 2003. Commision Regulation (EC) N° 808/2003 of 12 May 2003 and Commision Regulation (EC) N° 811/2003 on the intra-species recyclingban for fish. Official Journal of the European Communities, L 117: 14-18. (also available at http://eur-lex.europa.eu/LexUriServ/LexUriServ.do?uri=OJ:L:2003:117:0014:0014:EN:PDF)
Couperus, A.S. 1997. Interactions between Dutch midwater-trawl and Atlantic white-sided dolphins (Lagenorhynchus acutus) southwest of Ireland. Journal of Northwest Atlantic Fisheries Science, 22: 209–218.
Courchamp, F., Clutton-Brock, T. & Grenfell, B. 1999. Inverse density dependence and the Allee effect. Trends in Ecology & Evolution, 14: 405–410.
Cury, P., Bakun, A., Crawford, R.J.M., Jarre, A., Quinones, R.A., Shannon, L.J. & Verheye, H.M. 2000. Small pelagics in upwelling systems: patterns of interaction and structural changes in “wasp-waist” ecosystems. ICES Journal of Marine Science, 57: 603–618.
Daan, N., Bromley, P.J., Hislop, J.R.G. & Nielsen, N.A. 1990. Ecology of North-Sea fish. Netherlands Journal of Sea Research, 26: 343–386.
Delgado, C., Rosegrant, M., Wada, N., Meijer, S. & Ahmed, M. 2002. Fish as food: projections to 2020 under different scenarios. MSSD Discussion Paper No. 52. Washington, D.C. Markets and Structural Studies Division, International Food Policy Research Institute. 29 pp.
Dosdat, A. 2003. Environmental impact of aquaculture in the Mediterranean: nutritional and feeding aspects. France, IFREMER. 36 pp.
Duffy, D.C. 1983. Environmental uncertainty and commercial fishing: effects on Peruvian guano birds. Biological Conservation, 26: 227–238.
Dunn, E. 1998. The impact of fisheries on sea birds in the North Sea. In D. Symes (ed.). Northern waters: management issues and practice, pp. 208–215. Fishing News Books, Oxford.
Eliasen, J. 2003. Danish monitoring system for landing from the industrial fishery. Letter from the Ministeriet for Fødevarer, Landbrug og Fiskeri (Fiskeriderktoratet) to the European Commission, 10 July 2003.
Failler, P. 2005. Future prospects for fish and fishery products. 4. Fish consumption in the European Union in 2015 and 2030. Part 1. European overview. FAO Fisheries Circular. No. 972/4, Part 1. Rome, FAO. 204 pp.
FAO. 1995. Code of conduct for responsible fisheries. Rome. 41 pp.

Wild fish and other aquatic organisms as feed in aquaculture in Europe 265
FAO. 2002. FAO Fishstat Plus: Universal software for fishery statistical time series. Fisheries Department, Fishery Information, Data and Statistics Unit. Aquaculture production: quantities 1950–2000; Aquaculture production: values 1984–2000; Capture production: 1950–2000; Commodities production and trade: 1950–2000; Total production: 1970–2000, Vers. 2.30. (available at www.fao.org/fi/statist/FISOFT/FISHPLUS.asp).
FAO. 2005a. Fishstat Plus: Universal software for fishery statistical time series. Aquaculture production: quantities 1950–2003; Aquaculture production: values 1984–2003; Capture production: 1950–2003; Commodities production and trade: 1950–2003; Total production: 1970–2003, Vers. 2.30. FAO Fisheries Department, Fishery Information, Data and Statistics Unit. (available at www.fao.org/fishery/statistics/software/fishstat/en)
FAO. 2005b. General Fisheries Commission for the Mediterranean: International Commission for the Conservation of Atlantic Tunas. Report of the third meeting of the Ad hoc GFCM/ICCAT working group on sustainable bluefin tuna farming/fattening practices in the Mediterranean. Rome, 16–18 March 2005. FAO Fisheries Report No. 779. Rome. 108 pp.
FAO. 2005c. The State of World Fisheries and Aquaculture. FAO Fisheries Department. Rome, FAO. 153 pp.
FAO. 2006a. Fishstat Plus: Universal software for fishery statistical time series. Aquaculture production: quantities 1950–2004; Aquaculture production: values 1984–2004; Capture production: 1950–2004; Commodities production and trade: 1950–2004; Total production: 1970–2004, Vers. 2.30. FAO Fisheries Department, Fishery Information, Data and Statistics Unit. (available at www.fao.org/fishery/statistics/software/fishstat/en).
FAO. 2006b. General Fisheries Commission for the Mediterranean. Report of the thirtieth session. Istanbul, Turkey, 24–27 January 2006. GFCM Report No. 30. Rome. 56 pp.
Fertl, D. & Leatherwood, S. 1997. Cetacean interactions with trawls: a preliminary review. Journal of Northwest Atlantic Fisheries Science, 22: 219–248.
FIN. 2003. Sustainability Dossier. Cambridge, UK, The Fishmeal Information Network. 30 pp.
Fontaine, P.M., Hammill, M.O., Barrette, C. & Kingsley, M.C. 1994. Summer diet of the harbour porpoise (Phocoena phocoena) in the estuary and the northern Gulf of St. Lawrence. Canadian Journal of Fisheries and Aquatic Sciences, 51: 172–178.
Frid, C.L.J., Banks, R.M., Lietz, G., Paramor, O.A.L., Scott C.L. & Seal C. 2003. The fish meal and fish oil industry: its role in the common fisheries policy. A report to the European Parliament (Contract No. IV2003/11/01) from the University of Newcastle upon Tyne and Poseidon Aquatic Resource Management Ltd. 159 pp.
Frid, C.L.J., Hansson, S., Ragnarsson, S.A., Rijnsdorp, A. & Steingrimsson, S.A. 1999. Changing levels of predation on benthos as a result of exploitation of fish populations. Ambio, 28: 578–582.
Furness, R.W. 2002. Management implications of interactions between fisheries and sandeel-dependent seabirds and seals in the North Sea. ICES Journal of Marine Science, 59: 261–269.
Gislason, H. 1994. Ecosystem effects of fishing activities in the North Sea. Marine Pollution Bulletin, 29: 520–527.
Gislason, H. & Kirkegaard, E. 1998. Is the industrial fishery in the North Sea sustainable? In D. Symes, (ed.) Northern waters: management issues and practice, pp. 195–207. Fishing News Books, Oxford, U.K.
GLOBEFISH. 2001. One page (internet) presentations: fishmeal (available at http://www.globefish.org)
Greenstreet, S.P.R. 1996. Estimation of the daily consumption of food by fish in the North Sea in each quarter of the year. Scottish Fisheries Research Report, 55. 17 pp. plus appendices.
Greenstreet, S.P.R. & Hall, S.J. 1996. Fishing and the ground-fish assemblage structure in the north-western North Sea: an analysis of long-term and spatial trends. Journal of Animal Ecology, 65: 577–598.

Fish as feed inputs for aquaculture – Practices, sustainability and implications266
Harwood, J. 1999. Effects of large-scale industrial fisheries on non-target species (ELIFONTS). Final report under contract 95/78 to DGXIV of the European Commission.
Hill, L., Mohn, R., Collie, J.S. & Borges, M.F. 2001. Life history characteristics as tools to evaluate changes in exploited fish communities. ICES CM 2001/T:08. 17 pp.
Hites, R.A., Foran, J.A., Carpenter, D.O., Hamilton, M.C., Knuth, B. & Schwager, S.J. 2004. Global assessment of organic contaminants in farmed salmon. Science, 303: 226–229.
Hopkins, P.J. 1986. Exploited fish and shellfish population in the Moray Firth. Proceedings of the Royal Society of London, Series B, Biological Sciences, 91: 57–72.
Horwood, J., Cushing, D. & Wyatt, T. 2000. Planktonic determination of variability and sustainability of fisheries. Journal of Plankton Research, 22: 1419–1422.
Huntington, T. 2004. Feeding the fish: sustainable fish feed and Scottish aquaculture. Report to the Joint Marine Programme (Scottish Wildlife Trust and WWF Scotland) and RSPB Scotland. Lymington, U. K., Poseidon Aquatic Resource Management Ltd. 35 pp.
Huse, I., Aanondsen, S., Ellingsen, H., Engaas, A., Furevik, D., Graham, N., Isaksen, B., Joergensen, T., Loekkeborg, S. & Noettestad, L. 2003. A desk-study of diverse methods of fishing when considered in perspective of responsible fishing, and the effect on the ecosystem caused by fishing activity. TemaNord 501. 122 pp.
Hutchings, J.A. 2000. Collapse and recovery of marine fishes. Nature, 406: 882–885.ICES. 1997. Report of the multispecies assessment working group. ICES CM 1997 Assess,
16: 1–235.ICES. 2001. Report of the Baltic fisheries assessment working group. ICES CM 2001/
ACFM:18. 546 pp.ICES. 2002. Report of the ICES advisory committee on ecosystems, 2002. ICES Cooperative
Research Report, 254: 49–53.ICES. 2003a. Report of the ICES/NSCFP study group on the incorporation of additional
information from the fishing industry into fish stock assessments. ICES CM 2003/ACFM: 14.
ICES. 2003b. Report of the northern pelagic and blue whiting fisheries working group. ICES CM 2003/ACFM: 23.
ICES. 2003c. Report of the working group on ecosystem effects of fishing activities. ICES Advisory Committee on Fishery Management, 1–8 April 2003. ICES CM 2003/ACE: 05. 193 pp.
ICES. 2003d. ACFM Report. ICES. 2004. Report on the working group on ecosystem effects of fishing activities. ICES
Advisory Committee on Ecosystems, Copenhagen, 14–21 April 2004. ICES CM 2004/ACE:03 Ref. D, E, G. 176 pp.
ICES. 2005. Report on the working group on the assessment of demersal stock in the North Sea and Skagerrak. ICES_CM2006/ACFM:09. 981 pp.
IFFO. 2002. Digest of select statistics. Annual Conference, Cancun, Mexico.Jahncke, J., Checkley, D. & Hunt, Jr., G.L. 2003. Trends in carbon flux to seabirds in the
Peruvian upwelling. Fisheries Oceanography, 13: 208–223.Jennings, S. & Kaiser, M. J. 1998. The effects of fishing on marine ecosystems. In Advances
in Marine Biology, 34. 201 pp.Jennings, S., Kaiser, M.J. & Reynolds, J.D. 2001. Marine fisheries ecology. Oxford,
Blackwell Science Ltd. 438 pp.Kaiser, M.J. & Spencer, B.E. 1995. Survival of by-catch from a beam trawl. Marine Ecology
Progress Series, 126: 31–38.Kaiser, M.J., Edwards, D.B., Armstrong, P.J., Radford, K., Lough, N.E.L., Flatt, R.P. &
Jones, H.D. 1998. Changes in megafaunal benthic communities in different habitats after trawling disturbance. ICES Journal of Marine Science, 55: 353–361.

Wild fish and other aquatic organisms as feed in aquaculture in Europe 267
Kastelein, R.A., Vaughan, N., Walton, S. & Wiepkema, P.R. 2002. Food intake and body measurements of Atlantic bottlenose dolphins (Tursiops truncates) in captivity. Marine Environmental Research, 53: 199–218.
Klinkhard, M. 2001. How contaminated are fish and fish products? EUROFISH Magazine, 4/2001: 102–104.
Köster, F.W. & Möllmann, C. 2000. Trophodynamic control by clupeid predators on recruitment success in Baltic cod? ICES Journal of Marine Science, 57: 310–323.
Laist, D.W. 1996. Marine debris entanglement and ghost fishing: a cryptic and significant type of bycatch? In T. Wray (ed.). Solving bycatch workshop: considerations for today and tomorrow, pp. 33–40. Fairbanks, Alaska Sea Grant College Program.
Langton, R.W. & Auster, P.J. 1999. Marine fishery and habitat interactions: to what extent are fisheries and habitat interdependent? Fisheries, 24: 14–21.
Lankester, K. 2005. Sustainability in the anchoveta fisheries in Peru: descriptive background document. Report to the Netherlands Committee for IUCN. Amsterdam, The Netherlands. 24 p.
Larsen, F. 1999. The effect of acoustic alarms on the by-catch of harbour porpoises in the Danish North set gill net fishery: a preliminary analysis. Paper SC/51/SM41 submitted to the 51st IWC meeting, Grenada. 8 pp.
Lluch-Belda, D., Crawford, R.J.M., Kawasaki, T., MacCall, A.D., Parrish, R.H., Schwartzlose, R.A. & Smith, P.E. 1989. World-wide fluctuations of sardine and anchovy stocks: the regime problem. South African Journal of Marine Science, 8: 195–205.
Lovatelli, A. 2003. Summary report on the status of BFT aquaculture. In Report of the second meeting of the ad hoc working group on sustainable tuna farming/fattening practices in the Mediterranean, pp. 73–89. Izmir, Turkey, 15–17 December 2003. GFCM and ICCAT.
MAFF. (undated) Handling and processing blue whiting. Torry Advisory Note No. 81. Aberdeen, U.K. Torry Research Station, Ministry of Agriculture, Fisheries and Food. See http://www.fao.org/wairdocs/tan/x5952e/x5952e00.htm
Majluf, P., Babcock, E.A., Riveros, J.C., Schreiber, M.A. & Alderete, W. 2002. Catch and bycatch of sea birds and marine mammals in the small-scale fishery of Punta San Juan, Peru. Conservation Biology, 16: 1333–1343.
McKinnon, J. 1994. Feeding-habits of the dusky dolphin, Lagenorhynchus obscurus, in the coastal waters of central Peru. Fishery Bulletin, 92: 569–578.
Megapesca. 1998. Regional socio-economic studies on employment and the levels of dependency on fishing. European Commission. See http://ec.europa.eu/fisheries/cfp/structural_measures/socio_economic/study_2001/results_en.htm
Naylor R.L., Goldburg R.J., Primavera J., Kautsky N., Beveridge M., Clay J., Folke C., Lubchenco J., Mooney H. & Troell M. 2000. Effect of aquaculture on world fish supplies. Nature, (405): 1097–1024.
New, M. & Wijkström, U. 2002. Use of fishmeal and fish oil in aquafeeds: further thoughts on the fishmeal trap. FAO Fisheries Circular No. 975. Rome, FAO. 61 pp.
Olsen, E. & Holst, J.C. 2001. A note on common minke whale (Balaenoptera acutorostrata). Journal of Cetacean Research and Management, 3: 179–183.
Österblom, H., Fransson, T. & Olsson, O. 2002. Bycatches of common guillemot (Uria aalge) in the Baltic Sea gillnet fishery. Biological Conservation, 105: 309–319.
Read, A.J., Van Waerebeek, K., Reyes, J.C., McKinnon, J.S. & Lehman, L.C. 1988. The exploitation of small cetaceans in coastal Peru. Biological Conservation, 46: 53–70.
Rijnsdorp, A.D., Leeuwen, P., Daan, N. & Heessen, H.J.L. 1996. Changes in abundance of demersal fish species in the North Sea between 1906–1909 and 1990–1995. ICES Journal of Marine Science, 53: 1054–1062.
Robinson, L.A. & Frid, C.L.J. 2003. Dynamic ecosystem models and the evaluation of ecosystem effects of fishing: can we make meaningful predictions? Aquatic Conservation – Marine and Freshwater Ecosystems, 13: 5–20.

Fish as feed inputs for aquaculture – Practices, sustainability and implications268
Ryman, N., Utter, F. & Laikre, L. 1995. Protection of intraspecific biodiversity of exploited fishes. Reviews in Fish Biology and Fisheries, 5: 417–446.
Sadovy, Y. 2001. The threat of fishing to highly fecund fishes. Journal of Fish Biology, 59: 90–108.
Santos, A.P., Borges, M. & Groom, S. 2001. Sardine and horse mackerel recruitment and upwelling off Portugal. ICES Journal of Marine Science, 58: 589–596.
Santos, M.B., Pierce, G.J., Ross, H.M., Reid, R.J. & Wilson, B. 1994. Diets of small cetaceans from the Scottish coast. ICES CM 1994/N:11.
Santos, M.B., Pierce, G.J., Wijnsma, G., Ross, H.M. & Reid, R.J. 1995. Diets of small cetaceans stranded in Scotland 1993–1995. Copenhagen, ICES. CM 1995/N:6.
SCAN. 2000. Opinion of the scientific committee on animal nutrition on the dioxin contamination of feeding stuffs and their contribution to the contamination of food of animal origin. Adopted 6 November 2000. Brussels, European Commission. 105 pp.
Sclabos, K. 2004. The krill. Article in Aquafeed.com (available at www.aquafeed.com/article.php?id=365).
SEAFeeds. 2003. Sustainable environmental aquaculture feeds. EU funded Draft Workshop Report. 36 pp.
Sparholt, H., Larsen, L.I. & Nielsen, J.R. 2002. Non-predation natural mortality of Norway pout (Trisopterus esmarkii) in the North Sea. ICES Journal of Marine Science, 59: 1276–1284.
Stokes, T.K. 1992. An overview of the North Sea multispecies work in ICES. South African Journal of Marine Science, 12: 1051–1060.
Tasker, M.L., Kees-Camphuysen, M.C., Cooper, J., Garthe, S., Montevecchi, W.A. & Blaber, S.J. 2000. The impacts of fishing on marine birds. ICES Journal of Marine Science, 57: 531–547.
Ulltang, O. 1980. Factors affecting the reaction of pelagic fish stocks to exploitation and requiring a new approach to assessment and management. Rapports et Proces-Verbaux des Reunions Conseil International pour l’Exploration de la Mer, 177: 489–504.
University of New Castle upon Tyne and Poseidon Aquatic Resource Management Ltd. 2004. The fish meal and fish oil industry: its role in the common fisheries policy. European Parliament Directorate-General for Research. Working Paper, Fisheries Series, Fish 113 EN, Luxemburg. 148 pp. (also available at www.consult-poseidon.com/reports/EP%20Role%20of%20Fish%20Oil-Meal%20in%20the%20CFP.pdf
Van Waerebeek, K., Van Bressem, M.F., Felix, F., Alfaro-Shigueto, J., Garcia-Godos, A., Chavez-Lisambart, L., Onton, K., Montes, D. & Bello, R. 1997. Mortality of dolphins and porpoises in coastal fisheries off Peru and southern Ecuador in 1994. Biological Conservation, 81: 1–2.
Winters, G.H. & Wheeler, J.P. 1985. Interaction between stock area, stock abundance, and catchability coefficient. Canadian Journal of Fisheries and Aquatic Sciences, 42: 989–998.
Wood, J.D., Enser, M., Fisher, A.V., Nute, G.R., Richardson, R.I. & Shear, P.R. 1999. Manipulating meat quality and composition. Proceedings of the Nutrition Society, 58: 363–370.
Wright, P.J., Jensen, H. & Tuck, I. 2000. The influence of sediment type on the distribution of the lesser sandeel, Ammodytes marinus. Journal of Sea Research, 44: 243–256.
WWF. 2005. Risk on local fish populations and ecosystems posed by the use of imported feed fish by the tuna farming industry in the Mediterranean. WWF Mediterranean Programme. April 2005. 12 pp.
Ye, Y. 1999. Historical consumption and future demand for fish and fishery products: exploratory calculations for the years 2015–2030. FAO Fisheries Circular No. 946. Rome, FAO. 31 pp.