Embed Size (px)
Citation preview
USE OF TRANSMIT POWER AND GPS DATA TO BETTER CHARACTERIZE MOBILE PHONE
EXPOSURE FOR EPIDEMIOLOGIC STUDIES J.J. Morrissey, Motorola, Ft. Lauderdale FL USA
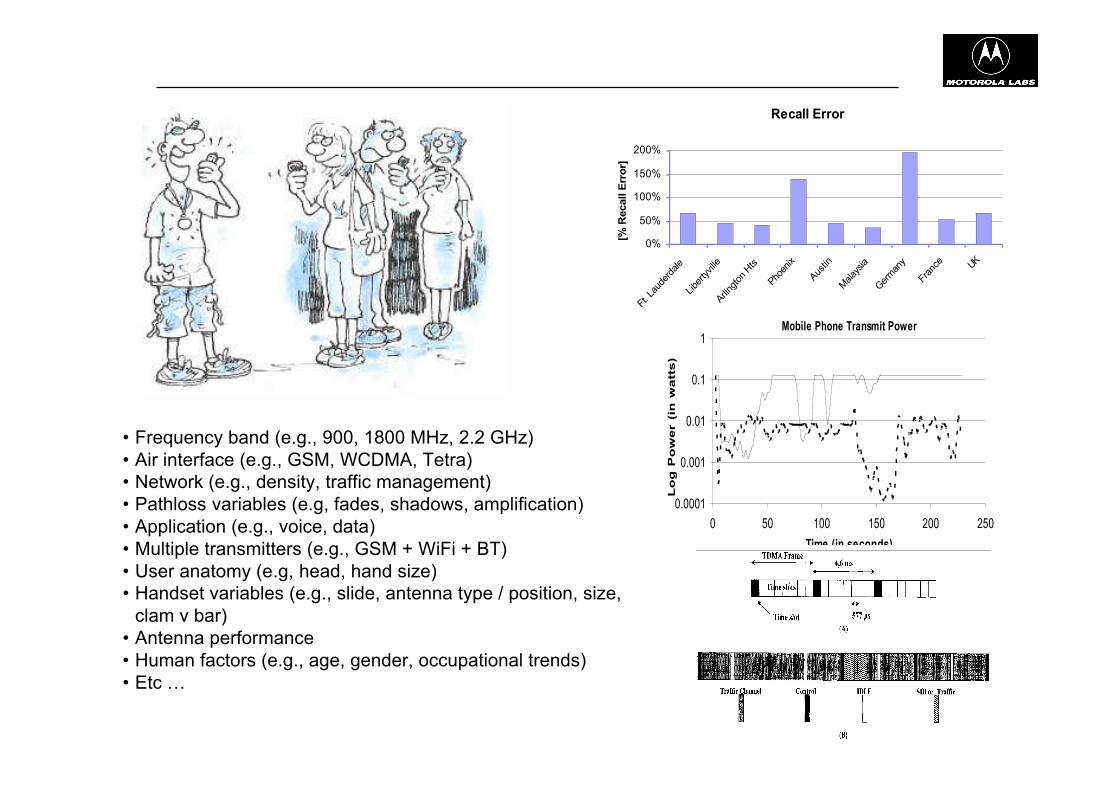
Figure 1. A) [from ref 9]: Tx Power associated with calls (in good vs.
poor coverage) made on a US 1900 MHz GSM network. B)
Discontinuous Transmission (DTx) showing truncated transmission
during periods of no speech.
0.0001
0.001
0.01
0.1
1
0 50 100 150 200 250
Time (in seconds)
Lo
g P
ow
er (in
w
atts
)
Mobile Phone Transmit Power
Average Transmit Power
0.00
0.05
0.10
0.15
0.20
0.25
Ft.
Lauderdale,
FL
Libertyville, Il A rlington
Hts, Il
Phoenix, Az Austin, TX Malaysia Germany France UK
Po
wer
(watt
s)
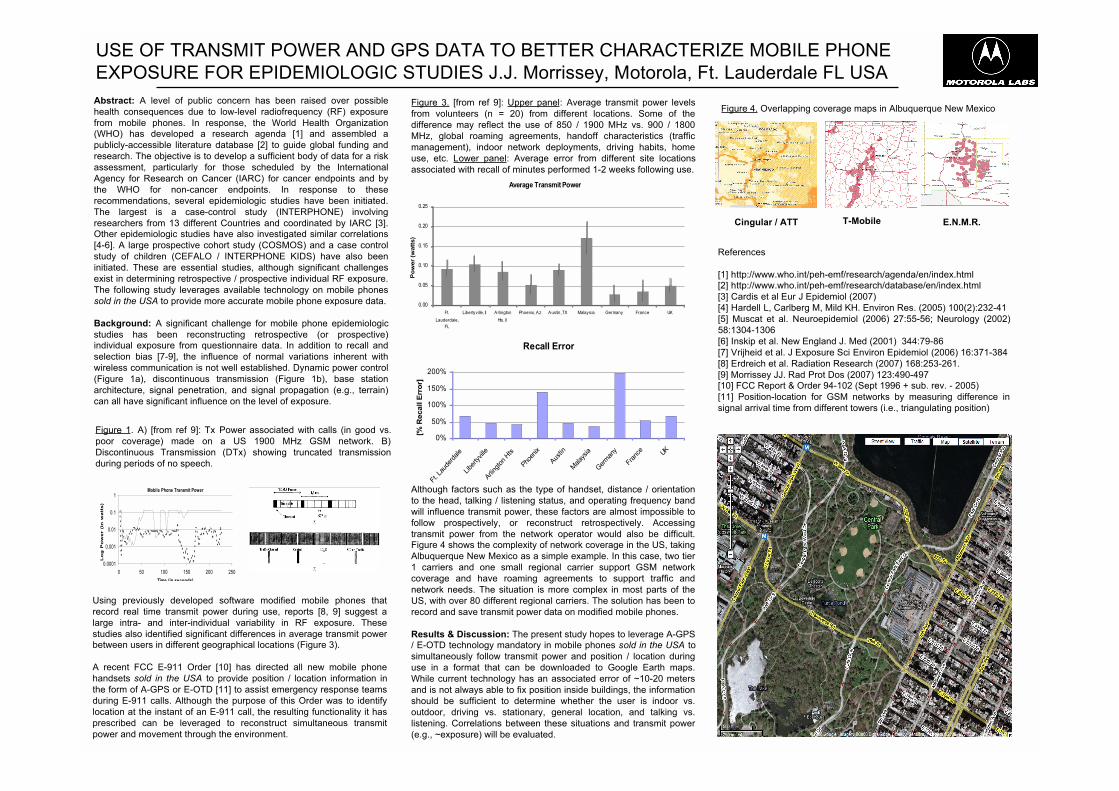
Figure 3. [from ref 9]: Upper panel: Average transmit power levels
from volunteers (n = 20) from different locations. Some of the
difference may reflect the use of 850 / 1900 MHz vs. 900 / 1800
MHz, global roaming agreements, handoff characteristics (traffic
management), indoor network deployments, driving habits, home
use, etc. Lower panel: Average error from different site locations
associated with recall of minutes performed 1-2 weeks following use.
Recall Error
0%
50%
100%
150%
200%
Ft. L
aude
rdale
Libe
rtyville
Arling
ton
Hts
Pho
enix
Aus
tin
Malay
sia
Ger
man
y
Fran
ce UK
[% R
ecall E
rro
r]
E.N.M.R.Cingular / ATT T-Mobile
Although factors such as the type of handset, distance / orientation
to the head, talking / listening status, and operating frequency band
will influence transmit power, these factors are almost impossible to
follow prospectively, or reconstruct retrospectively. Accessing
transmit power from the network operator would also be difficult.Figure 4 shows the complexity of network coverage in the US, taking
Albuquerque New Mexico as a simple example. In this case, two tier
1 carriers and one small regional carrier support GSM network
coverage and have roaming agreements to support traffic and
network needs. The situation is more complex in most parts of the
US, with over 80 different regional carriers. The solution has been to
record and save transmit power data on modified mobile phones.
Results & Discussion: The present study hopes to leverage A-GPS/ E-OTD technology mandatory in mobile phones sold in the USA to
simultaneously follow transmit power and position / location during
use in a format that can be downloaded to Google Earth maps.
While current technology has an associated error of ~10-20 meters
and is not always able to fix position inside buildings, the information
should be sufficient to determine whether the user is indoor vs.
outdoor, driving vs. stationary, general location, and talking vs.
listening. Correlations between these situations and transmit power
(e.g., ~exposure) will be evaluated.
Figure 4. Overlapping coverage maps in Albuquerque New MexicoAbstract: A level of public concern has been raised over possible
health consequences due to low-level radiofrequency (RF) exposure
from mobile phones. In response, the World Health Organization(WHO) has developed a research agenda [1] and assembled a
publicly-accessible literature database [2] to guide global funding and
research. The objective is to develop a sufficient body of data for a risk
assessment, particularly for those scheduled by the International
Agency for Research on Cancer (IARC) for cancer endpoints and by
the WHO for non-cancer endpoints. In response to these
recommendations, several epidemiologic studies have been initiated.
The largest is a case-control study (INTERPHONE) involving
researchers from 13 different Countries and coordinated by IARC [3].Other epidemiologic studies have also investigated similar correlations
[4-6]. A large prospective cohort study (COSMOS) and a case control
study of children (CEFALO / INTERPHONE KIDS) have also been
initiated. These are essential studies, although significant challenges
exist in determining retrospective / prospective individual RF exposure.
The following study leverages available technology on mobile phones
sold in the USA to provide more accurate mobile phone exposure data.
Background: A significant challenge for mobile phone epidemiologic
studies has been reconstructing retrospective (or prospective)individual exposure from questionnaire data. In addition to recall and
selection bias [7-9], the influence of normal variations inherent with
wireless communication is not well established. Dynamic power control
(Figure 1a), discontinuous transmission (Figure 1b), base station
architecture, signal penetration, and signal propagation (e.g., terrain)
can all have significant influence on the level of exposure.
Using previously developed software modified mobile phones that
record real time transmit power during use, reports [8, 9] suggest a
large intra- and inter-individual variability in RF exposure. These
studies also identified significant differences in average transmit powerbetween users in different geographical locations (Figure 3).
A recent FCC E-911 Order [10] has directed all new mobile phone
handsets sold in the USA to provide position / location information in
the form of A-GPS or E-OTD [11] to assist emergency response teams
during E-911 calls. Although the purpose of this Order was to identify
location at the instant of an E-911 call, the resulting functionality it has
prescribed can be leveraged to reconstruct simultaneous transmit
power and movement through the environment.
References
[1] http://www.who.int/peh-emf/research/agenda/en/index.html[2] http://www.who.int/peh-emf/research/database/en/index.html
[3] Cardis et al Eur J Epidemiol (2007)
[4] Hardell L, Carlberg M, Mild KH. Environ Res. (2005) 100(2):232-41
[5] Muscat et al. Neuroepidemiol (2006) 27:55-56; Neurology (2002)
58:1304-1306
[6] Inskip et al. New England J. Med (2001) 344:79-86
[7] Vrijheid et al. J Exposure Sci Environ Epidemiol (2006) 16:371-384
[8] Erdreich et al. Radiation Research (2007) 168:253-261.
[9] Morrissey JJ. Rad Prot Dos (2007) 123:490-497[10] FCC Report & Order 94-102 (Sept 1996 + sub. rev. - 2005)
[11] Position-location for GSM networks by measuring difference in
signal arrival time from different towers (i.e., triangulating position)

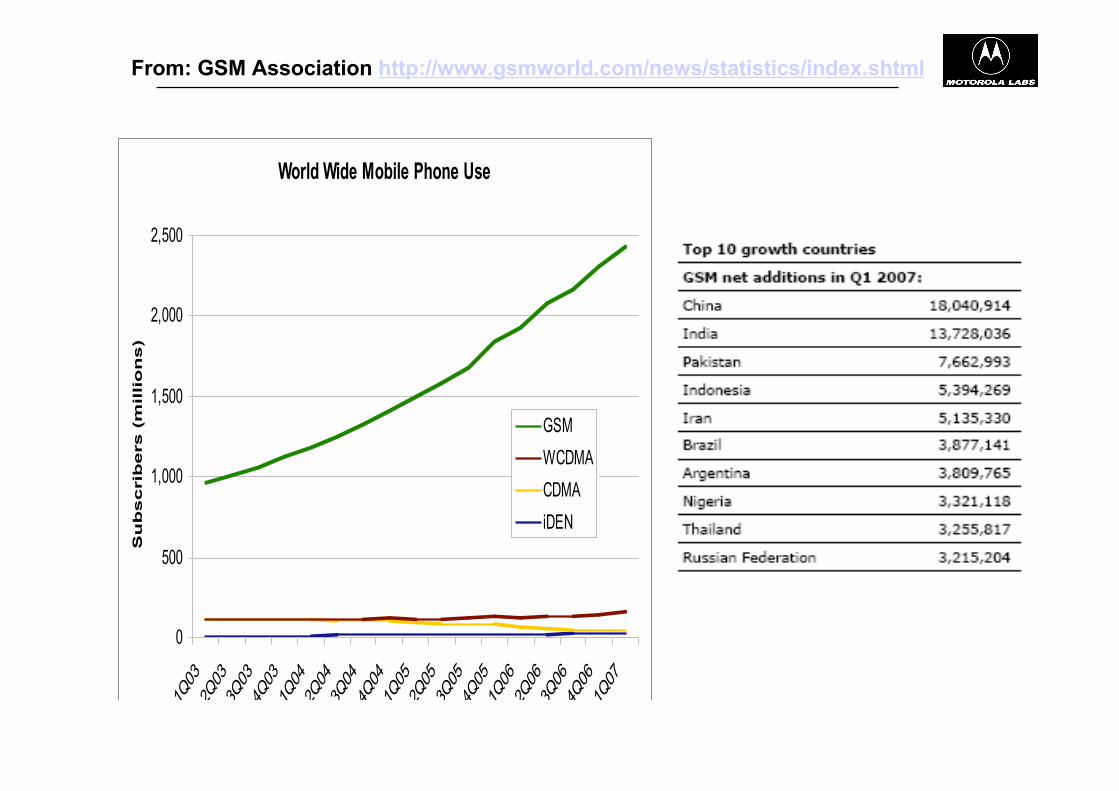
World Wide Mobile Phone Use
0
500
1,000
1,500
2,000
2,500
1Q03
2Q03
3Q03
4Q03
1Q04
2Q04
3Q04
4Q04
1Q05
2Q05
3Q05
4Q05
1Q06
2Q06
3Q06
4Q06
1Q07
Su
bscrib
ers (
millio
ns)
GSM
WCDMA
CDMA
iDEN
From: GSM Association http://www.gsmworld.com/news/statistics/index.shtml
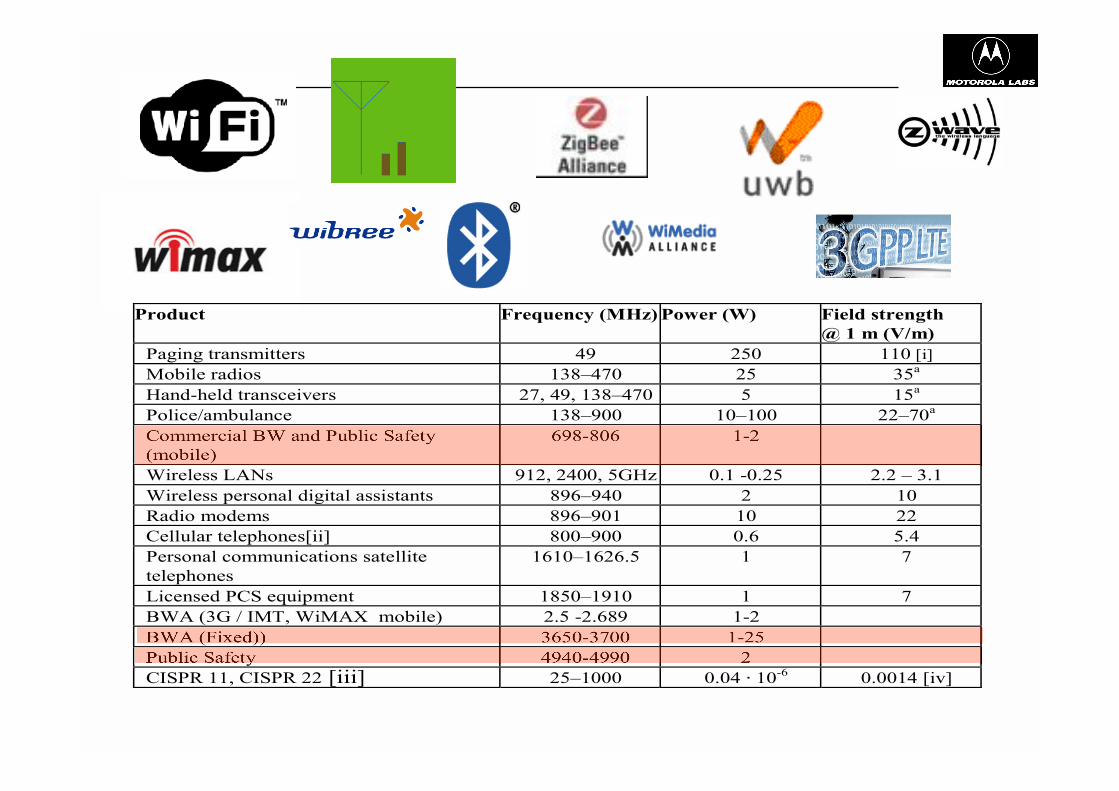
Product Frequency (MHz) Power (W) Field strength
@ 1 m (V/m)
Paging transmitters 49 250 110 [i]
Mobile radios 138–470 25 35a
Hand-held transceivers 27, 49, 138–470 5 15a
Police/ambulance 138–900 10–100 22–70a
Commercial BW and Public Safety
(mobile)
698-806 1-2
Wireless LANs 912, 2400, 5GHz 0.1 -0.25 2.2 – 3.1
Wireless personal digital assistants 896–940 2 10
Radio modems 896–901 10 22
Cellular telephones[ii] 800–900 0.6 5.4
Personal communications satellite
telephones
1610–1626.5 1 7
Licensed PCS equipment 1850–1910 1 7
BWA (3G / IMT, WiMAX mobile) 2.5 -2.689 1-2
BWA (Fixed)) 3650-3700 1-25
Public Safety 4940-4990 2
CISPR 11, CISPR 22 [iii] 25–1000 0.04 10-6
0.0014 [iv]
0.0001
0.001
0.01
0.1
1
0 50 100 150 200 250
Time (in seconds)
Lo
g P
ow
er (in
w
atts
)
Mobile Phone Transmit Power
• Frequency band (e.g., 900, 1800 MHz, 2.2 GHz)
• Air interface (e.g., GSM, WCDMA, Tetra)
• Network (e.g., density, traffic management)
• Pathloss variables (e.g, fades, shadows, amplification)
• Application (e.g., voice, data)
• Multiple transmitters (e.g., GSM + WiFi + BT)
• User anatomy (e.g, head, hand size)
• Handset variables (e.g., slide, antenna type / position, size,
clam v bar)
• Antenna performance
• Human factors (e.g., age, gender, occupational trends)
• Etc …
Recall Error
0%
50%
100%
150%
200%
Ft. L
aude
rdale
Libe
rtyville
Arling
ton
Hts
Phoen
ix
Aus
tin
Malay
sia
Ger
man
y
Fran
ce UK
[% R
ecall E
rro
r]


Country Time period Budget (M )
Australia 2004-2009 1.5
Denmark 2004-2008 4.0
Finland 2004-2007 1.5
Germany 2002-2007 17.0
UK: MTHR 1 (8.8 ML) MTHR 2
2002-2008 2007-2012
10.8 est 11.25
France 2006-2010 4.8
Korea 2005-2010 10.8
Netherlands 2006-2014 16.6
Switzerland 2006-2010 3.2
USA/NTP 2005-2010 18.0
Total 99.45 M = $130 million USD
+ Japan, China, EU 7th Framework, etc.
National Funding Programs (low-level health effects)
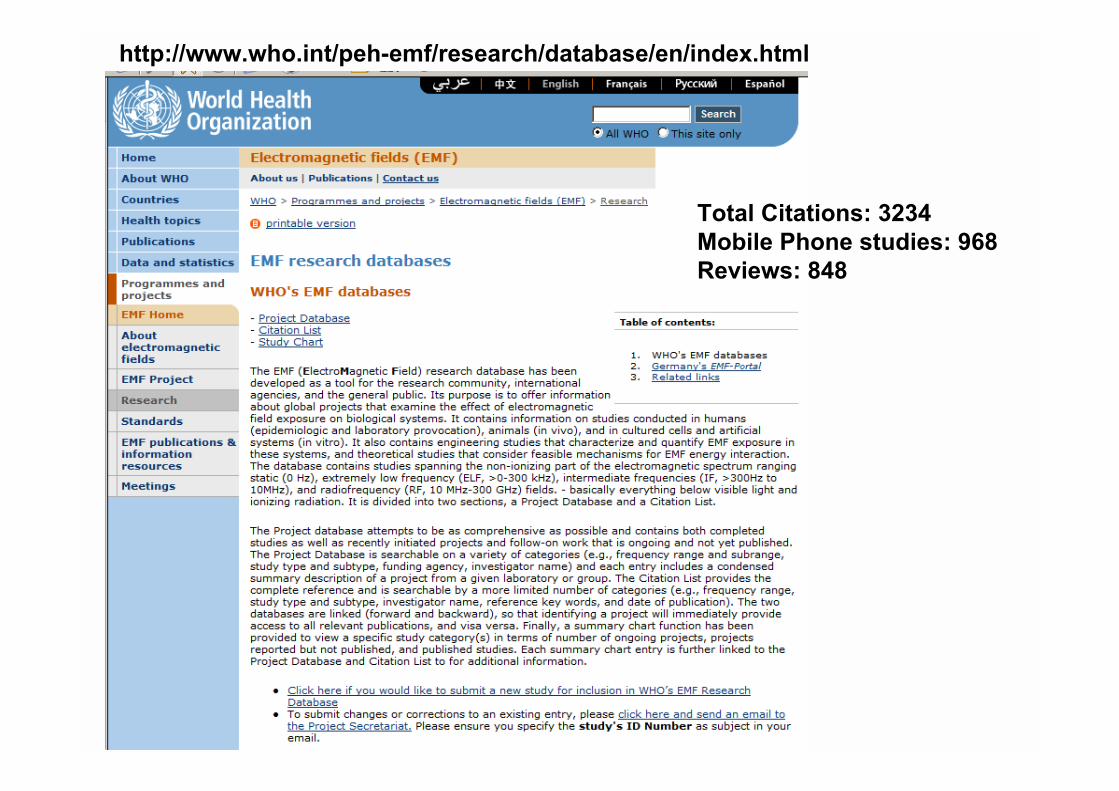
http://www.who.int/peh-emf/research/database/en/index.html
Total Citations: 3234
Mobile Phone studies: 968
Reviews: 848


![Analysis of Addax-Sinopec Outdoor Pathloss Behavior … · Keywords pathloss issues owing to location techniques used [5],[6]. In Wifi, WiMax, Mobility, Pathloss, QoS, Signal Degradation,](https://img.pdfslide.us/doc/110x75/5b5e63247f8b9aa3048cf02e/analysis-of-addax-sinopec-outdoor-pathloss-behavior-keywords-pathloss-issues.jpg)