Embed Size (px)
Citation preview
City of San JoseCity of San JoseEnvironmental Services DepartmentEnvironmental Services Department 2006 NWQMC Presentation2006 NWQMC Presentation
Cyanide Attenuation StudyCyanide Attenuation Study
Use of TraceUse of Trace--Level Cyanide Method Level Cyanide Method to Determine Attenuation of to Determine Attenuation of
Discharged Cyanide in Lower South Discharged Cyanide in Lower South San Francisco BaySan Francisco Bay
City of San JoseCity of San JoseEnvironmental Services DepartmentEnvironmental Services Department 2006 NWQMC Presentation2006 NWQMC Presentation
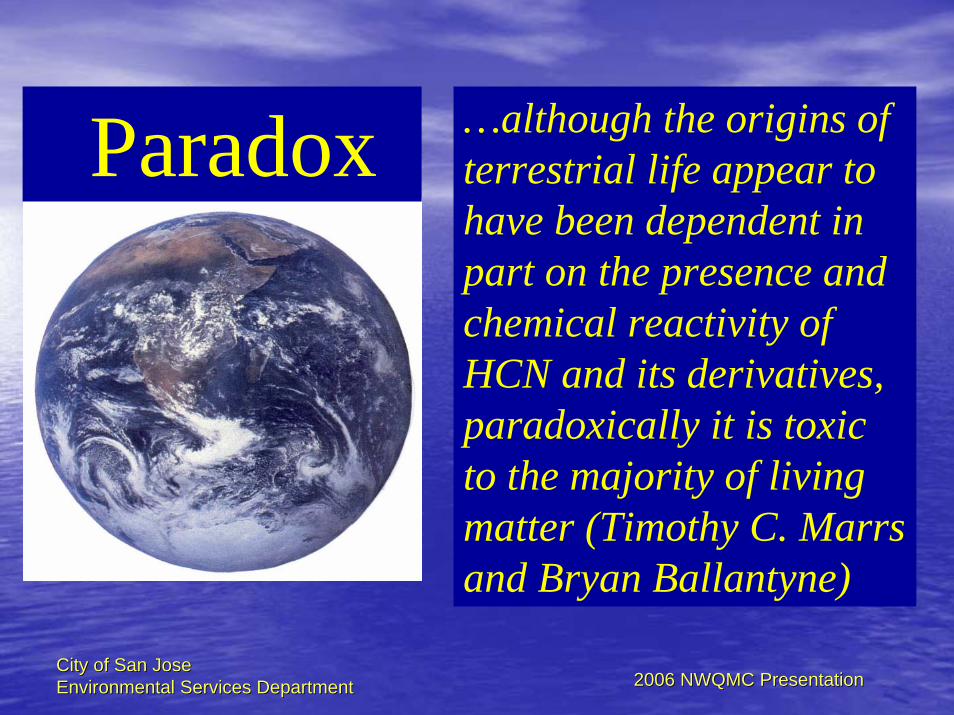
…although the origins of terrestrial life appear to have been dependent in part on the presence and chemical reactivity of HCN and its derivatives, paradoxically it is toxic to the majority of living matter (Timothy C. Marrs and Bryan Ballantyne)
Paradox
City of San JoseCity of San JoseEnvironmental Services DepartmentEnvironmental Services Department 2006 NWQMC Presentation2006 NWQMC Presentation
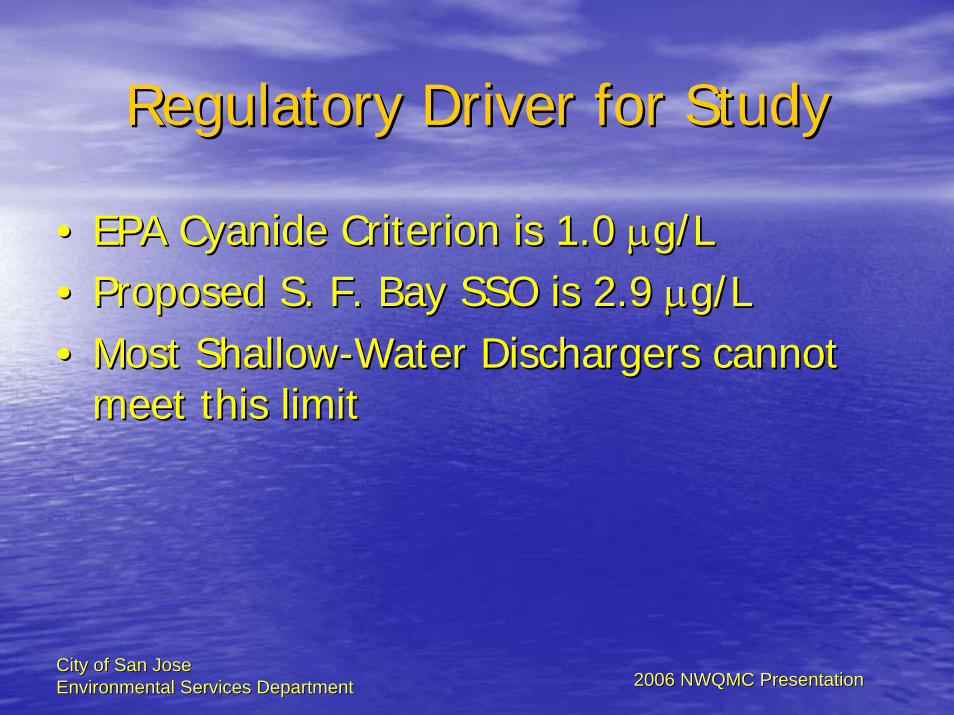
Regulatory Driver for StudyRegulatory Driver for Study
•• EPA Cyanide Criterion is 1.0 EPA Cyanide Criterion is 1.0 μμg/Lg/L•• Proposed S. F. Bay SSO is 2.9 Proposed S. F. Bay SSO is 2.9 μμg/Lg/L•• Most ShallowMost Shallow--Water Dischargers cannot Water Dischargers cannot
meet this limitmeet this limit

City of San JoseCity of San JoseEnvironmental Services DepartmentEnvironmental Services Department 2006 NWQMC Presentation2006 NWQMC Presentation
Compliance StrategiesCompliance Strategies•• WaterWater--Effect Ratio study: results Effect Ratio study: results ≅≅ 11•• Spiking studySpiking study•• Translator StudyTranslator Study
–– Free:Total cyanideFree:Total cyanide–– EPA criteria based on free cyanideEPA criteria based on free cyanide–– MDL for free cyanide too highMDL for free cyanide too high
•• Fate and transport studyFate and transport study–– Need trace total cyanide methodNeed trace total cyanide method

City of San JoseCity of San JoseEnvironmental Services DepartmentEnvironmental Services Department 2006 NWQMC Presentation2006 NWQMC Presentation
Attenuation StudyAttenuation Study
•• F & T Most Reasonable Strategy for ReliefF & T Most Reasonable Strategy for Relief–– Attenuation = dilution + degradationAttenuation = dilution + degradation
•• Based on low levels of Total CyanideBased on low levels of Total Cyanide•• Need Lower Reporting LimitNeed Lower Reporting Limit•• Another type of Another type of ““TranslatorTranslator””
City of San JoseCity of San JoseEnvironmental Services DepartmentEnvironmental Services Department 2006 NWQMC Presentation2006 NWQMC Presentation
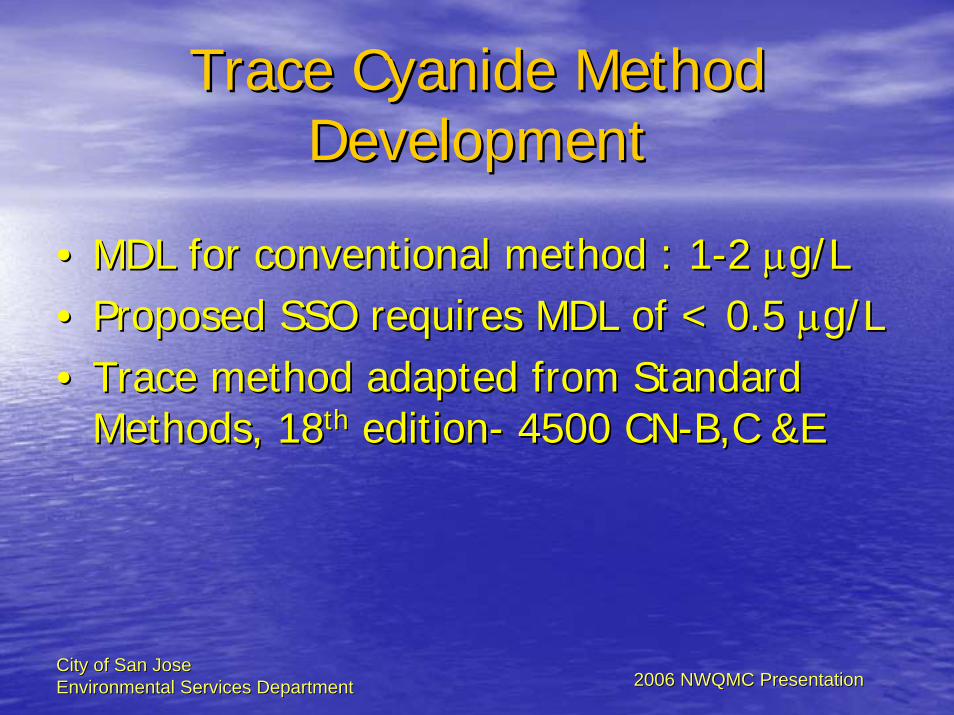
Trace Cyanide Method Trace Cyanide Method DevelopmentDevelopment
•• MDL for conventional method : 1MDL for conventional method : 1--2 2 μμg/Lg/L•• Proposed SSO requires MDL of < 0.5 Proposed SSO requires MDL of < 0.5 μμg/Lg/L•• Trace method adapted from Standard Trace method adapted from Standard
Methods, 18Methods, 18thth editionedition-- 4500 CN4500 CN--B,C &EB,C &E

City of San JoseCity of San JoseEnvironmental Services DepartmentEnvironmental Services Department 2006 NWQMC Presentation2006 NWQMC Presentation
Method ModificationsMethod Modifications
•• Concentration Factor increased from two Concentration Factor increased from two to six foldto six fold
•• Increased distillation timeIncreased distillation time•• Use of a 10 cm Cell for color Use of a 10 cm Cell for color
determinationdetermination•• Use of Nitrogen as a carrier gasUse of Nitrogen as a carrier gas

City of San JoseCity of San JoseEnvironmental Services DepartmentEnvironmental Services Department 2006 NWQMC Presentation2006 NWQMC Presentation
MethodologyMethodology
•• Preliminary Treatment of samplesPreliminary Treatment of samples–– to remove interferencesto remove interferences
•• DistillationDistillation–– to liberate cyanide as gaseous HCN from the to liberate cyanide as gaseous HCN from the
matrix background. HCN is collected as CNmatrix background. HCN is collected as CN-- in in the NaOH scrubbing solutionthe NaOH scrubbing solution
•• Colorimetric Determination of CyanideColorimetric Determination of Cyanide–– UVUV--VIS SpectrophotometerVIS Spectrophotometer

City of San JoseCity of San JoseEnvironmental Services DepartmentEnvironmental Services Department 2006 NWQMC Presentation2006 NWQMC Presentation
Distillation ApparatusDistillation Apparatus
•• Heating MantlesHeating Mantles•• Distillation FlasksDistillation Flasks•• Cold Finger Cold Finger
CondenserCondenser•• SpargerSparger•• Sparger VesselSparger Vessel•• Nitrogen GasNitrogen Gas

City of San JoseCity of San JoseEnvironmental Services DepartmentEnvironmental Services Department 2006 NWQMC Presentation2006 NWQMC Presentation
Distillation ProcedureDistillation Procedure
•• Sample Volume: 700 mlSample Volume: 700 ml•• Reagents: Reagents:
70 ml 0.04N NaOH 70 ml 0.04N NaOH PbCO3PbCO3MgCL2, NH2SO3HMgCL2, NH2SO3HH2SO4H2SO4Spikes: 2Spikes: 2--5ug/L (1ug/ml std) KCN5ug/L (1ug/ml std) KCNNitrogen Flow Rate Nitrogen Flow Rate
22--4 air bubbles/sec4 air bubbles/sec

City of San JoseCity of San JoseEnvironmental Services DepartmentEnvironmental Services Department 2006 NWQMC Presentation2006 NWQMC Presentation
MDL StudiesMDL Studies
MatrixMatrixDistilled Distilled WaterWater
Final Final EffluentEffluent SeawaterSeawater
MDLMDL((μμg/L)g/L) 0.060.06 0.20.2 .06.06
PQLPQL((μμg/L)g/L) 0.30.3 1.01.0 0.30.3

City of San JoseCity of San JoseEnvironmental Services DepartmentEnvironmental Services Department 2006 NWQMC Presentation2006 NWQMC Presentation
Cyanide RecoveriesCyanide Recoveries
0
20
40
60
80
100
120
140
9/22/200310/12/200311/1/200311/21/200312/11/200312/31/20031/20/20042/9/20042/29/20043/20/20044/9/20044/29/20045/19/20046/8/2004
Date
Perc
ent R
ecov
ery
0
5
10
15
20
25
30
35
40
45
50
Rel
ativ
e Pe
rcen
t Diff
eren
ce
Blank Spike Blank - Low & High Matrix Spike Matrix - Low & High % RPD
Mean = 93.3 Mean = 81.4
Mean = 6.1
City of San JoseCity of San JoseEnvironmental Services DepartmentEnvironmental Services Department 2006 NWQMC Presentation2006 NWQMC Presentation
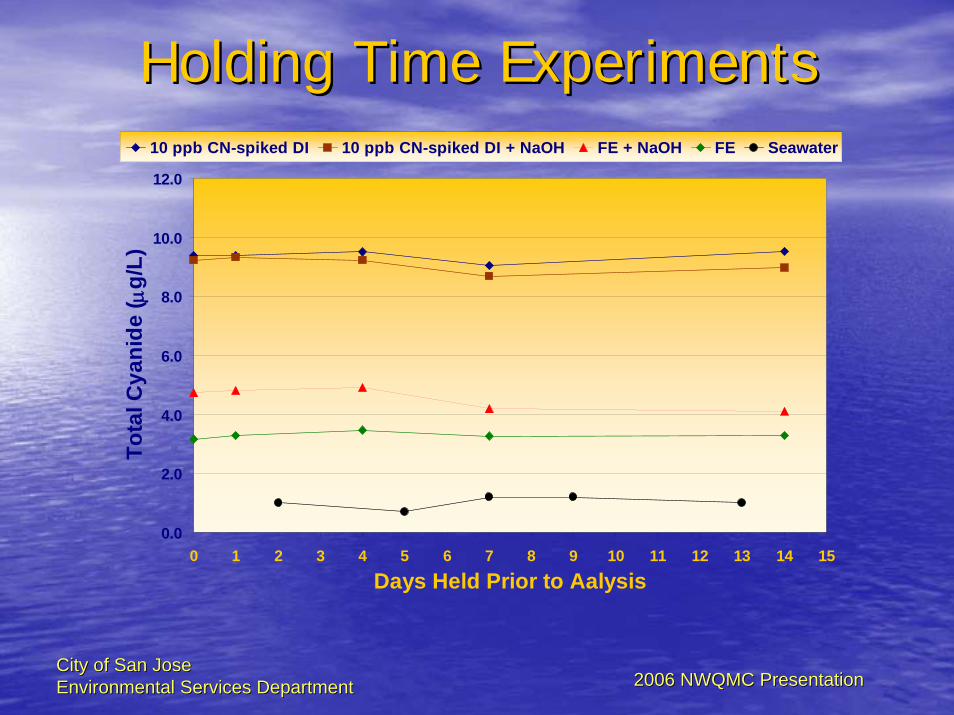
Holding Time ExperimentsHolding Time Experiments
0.0
2.0
4.0
6.0
8.0
10.0
12.0
0 1 2 3 4 5 6 7 8 9 10 11 12 13 14 15
Days Held Prior to Aalysis
Tota
l Cya
nide
( μg/
L)10 ppb CN-spiked DI 10 ppb CN-spiked DI + NaOH FE + NaOH FE Seawater

City of San JoseCity of San JoseEnvironmental Services DepartmentEnvironmental Services Department 2006 NWQMC Presentation2006 NWQMC Presentation
Effect of NaOH PreservationEffect of NaOH Preservation
0
2
4
6
8
10
12
1 2 3Plant Effluent
Tota
l Cya
nide
μg/
LWithout NaOH With NaOH

City of San JoseCity of San JoseEnvironmental Services DepartmentEnvironmental Services Department 2006 NWQMC Presentation2006 NWQMC Presentation
Cyanide Recoveries in Raw SewageCyanide Recoveries in Raw Sewage
Spike Spike ConcConc((μμg/L)g/L)
Preserved Preserved K3Fe(CN)6 K3Fe(CN)6 % Recovery% Recovery
Unpreserved Unpreserved K3Fe(CN)6 K3Fe(CN)6 % Recovery% Recovery
55 73.673.6 80.280.2
1010 74.374.3 81.681.6
2020 81.981.9 87.887.8
5050 66.866.8 84.384.3
Average Average RecoveryRecovery
74.274.2 83.583.5

City of San JoseCity of San JoseEnvironmental Services DepartmentEnvironmental Services Department 2006 NWQMC Presentation2006 NWQMC Presentation
Cyanide Recoveries in Raw SewageCyanide Recoveries in Raw Sewage
•• Recoveries : Independent of Spike ConcentrationRecoveries : Independent of Spike ConcentrationHigher with K3Fe(CN)6 than KCNHigher with K3Fe(CN)6 than KCN
•• Average Recoveries with K3Fe(CN)6:Average Recoveries with K3Fe(CN)6:-- 74.2% Preserved74.2% Preserved-- 83.5% Unpreserved83.5% Unpreserved

City of San JoseCity of San JoseEnvironmental Services DepartmentEnvironmental Services Department 2006 NWQMC Presentation2006 NWQMC Presentation
Future ResearchFuture Research
•• Cyanide Speciation Studies Cyanide Speciation Studies –– Free CyanideFree Cyanide•• Sample Preservation IssuesSample Preservation Issues•• Cyanide Formation:Cyanide Formation:
-- ChloraminationChloramination-- ThiocyanateThiocyanate

City of San JoseCity of San JoseEnvironmental Services DepartmentEnvironmental Services Department 2006 NWQMC Presentation2006 NWQMC Presentation
Plant Cyanide MeasurementsPlant Cyanide Measurements
0.0
0.5
1.0
1.5
2.0
2.5
3.0
3.5
4.0
Plant Influent (RawSewage)
NitrificationEffluent
Plant Final Effluent
Plant Location
Mea
n To
tal C
yani
de ( μ
g/L
+ s.
d.)
* *1.5
2.7
1.8

City of San JoseCity of San JoseEnvironmental Services DepartmentEnvironmental Services Department 2006 NWQMC Presentation2006 NWQMC Presentation
Plant Variability StudyPlant Variability Study
0.0
0.5
1.0
1.5
2.0
2.5
3.0
0100 0400 0700 1000 1300 1600 1900 2200
Time
Tota
l Cya
nide
( μg/
L)2/17/2004 2/18/2004 2/19/2004
City of San JoseCity of San JoseEnvironmental Services DepartmentEnvironmental Services Department 2006 NWQMC Presentation2006 NWQMC Presentation
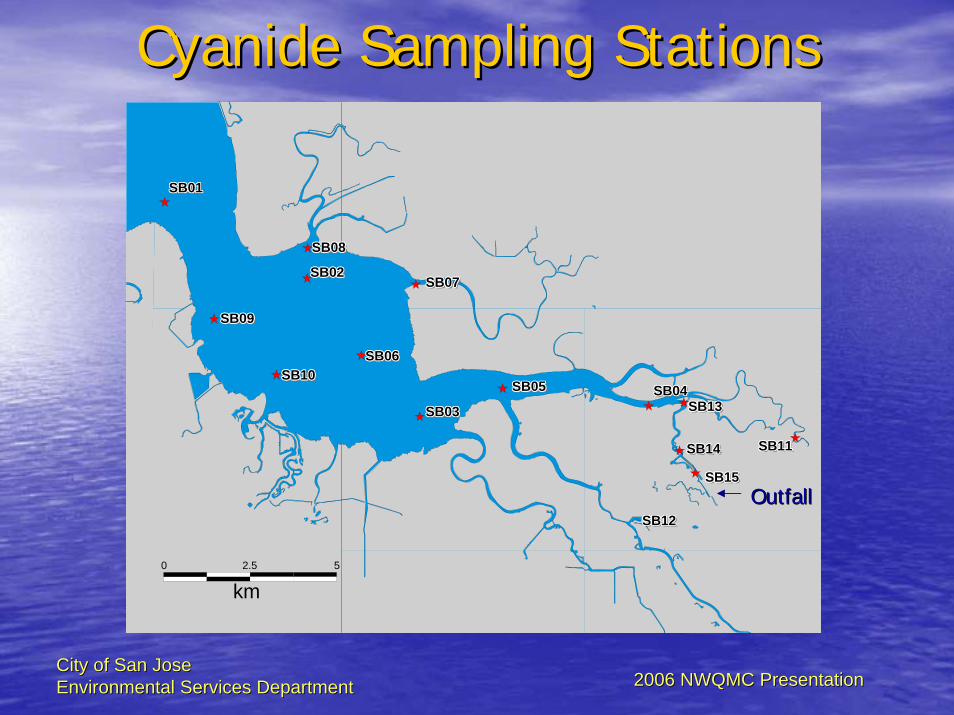
Cyanide Sampling StationsCyanide Sampling Stations
km0 2.5
SB08SB08SB08SB08SB08SB08SB08SB08SB08SB08
SB01SB01SB01SB01SB01SB01SB01SB01SB01SB01
SB09SB09SB09SB09SB09SB09SB09SB09SB09SB09
SB10SB10SB10SB10SB10SB10SB10SB10SB10SB10
SB02SB02SB02SB02SB02SB02SB02SB02SB02SB02
SB06SB06SB06SB06SB06SB06SB06SB06SB06SB06
SB07SB07SB07SB07SB07SB07SB07SB07SB07SB07
5
SB03SB03SB03SB03SB03SB03SB03SB03SB03SB03
SB05SB05SB05SB05SB05SB05SB05SB05SB05SB05
SB14SB14SB14SB14SB14SB14SB14SB14SB14SB14
SB12SB12SB12SB12SB12SB12SB12SB12SB12SB12
SB04SB04SB04SB04SB04SB04SB04SB04SB04SB04SB13SB13SB13SB13SB13SB13SB13SB13SB13SB13
SB15SB15SB15SB15SB15SB15SB15SB15SB15SB15
SB11SB11SB11SB11SB11SB11SB11SB11SB11SB11
OutfallOutfall

City of San JoseCity of San JoseEnvironmental Services DepartmentEnvironmental Services Department 2006 NWQMC Presentation2006 NWQMC Presentation

City of San JoseCity of San JoseEnvironmental Services DepartmentEnvironmental Services Department 2006 NWQMC Presentation2006 NWQMC Presentation

City of San JoseCity of San JoseEnvironmental Services DepartmentEnvironmental Services Department 2006 NWQMC Presentation2006 NWQMC Presentation

City of San JoseCity of San JoseEnvironmental Services DepartmentEnvironmental Services Department 2006 NWQMC Presentation2006 NWQMC Presentation
Cyanide AttenuationCyanide Attenuation
0.0
1.0
2.0
3.0
4.0
5.0
Final EffluentSB15SB14SB13SB04SB05SB03SB06SB02SB08SB10SB07SB09SB01SB11SB12
Cyanide stations going away from the Plant
Mea
n C
yani
de (
μg/
L +
s.d.
)
Proposed Site-Specific Objective (red line)
7 9 9
10
Station SB11 is Upstream of Plant
Station SB12 is in Alviso Slough

City of San JoseCity of San JoseEnvironmental Services DepartmentEnvironmental Services Department 2006 NWQMC Presentation2006 NWQMC Presentation
Cyanide Attenuation FactorsCyanide Attenuation Factors
Date Tidal Cycle
SB04 Cyanide Concentration*
SB05 Cyanide Concentration*
Final Effluent Cyanide
Concentration*
SB04 Attenuation
Factor
SB05 Attenuation
Factor
7/9/03 Flooding 1 0.4 1.6 1.6 4.08/20/03 Flooding 0.8 0.6 1.8 2.3 3.09/24/03 Flooding 1.2 0.5 3.5 2.9 7.0
10/15/03 Ebbing 1.8 0.9 2.3 1.3 2.611/19/03 Flooding 0.7 0.2 2.7 3.9 13.512/3/03 Ebbing 0.7 0.4 5.2 7.4 13.01/21/04 Flooding 1.1 0.4 1.8 1.6 4.52/27/04 Ebbing 0.9 0.7 2 2.2 2.93/17/04 Flooding 0.8 0.3 3.1 3.9 10.34/16/04 Flooding 1.7 0.4 4.7 2.8 11.86/23/04 Ebbing 1.3 0.8 2.5 1.9 3.1
Mean 2.9 6.9* Concentration: μg/L Median 2.3 4.5
n 11 11
City of San JoseCity of San JoseEnvironmental Services DepartmentEnvironmental Services Department 2006 NWQMC Presentation2006 NWQMC Presentation
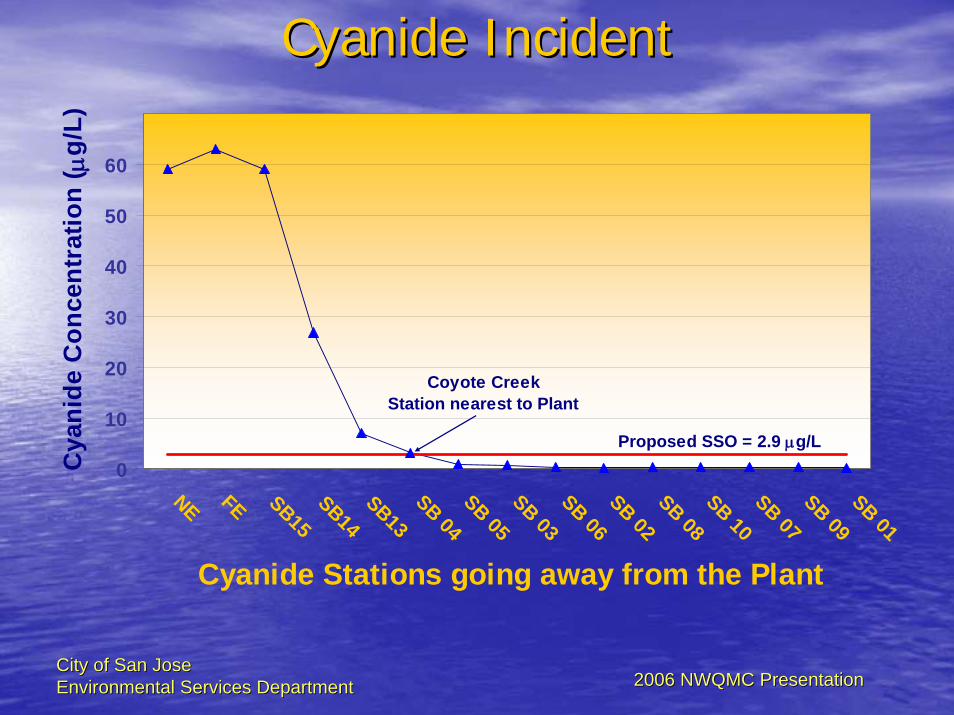
Cyanide IncidentCyanide Incident
0
10
20
30
40
50
60
NE FE SB15SB14SB13SB 04SB 05SB 03SB 06SB 02SB 08SB 10SB 07SB 09SB 01
Cyanide Stations going away from the Plant
Cya
nide
Con
cent
ratio
n ( μ
g/L)
Proposed SSO = 2.9 μg/L
Coyote CreekStation nearest to Plant

City of San JoseCity of San JoseEnvironmental Services DepartmentEnvironmental Services Department 2006 NWQMC Presentation2006 NWQMC Presentation
Report available at:
http://www.sanjoseca.gov/esd/pub_res.htm
Cyanide Attenuation Study
Watershed Investigations
and
Laboratory Staff
Watershed Protection Group
Environmental Services Department
City of San Jose
September 1, 2004