Embed Size (px)
Citation preview

Use of the efficiency factor to account for previous straining on the tensile behavior of paperDouglas W Coffin
KEYWORDS: Tensile Properties, Efficiency Factor,
Viscoelasticity, Plasticity, Strain Hardening
SUMMARY: The presented results suggest that the
concept of efficiency factor previously used to
demonstrate that changes in inter-fiber bonding in paper
do not change the shape of the stress-strain curve can be
extended to describe the changes that are observed in the
tensile response of paper subjected to previous straining.
It is found that the pre-yielding response for samples that
have fully recovered from previous straining scales with
changes in maximum tangent modulus. This deformation
is mainly recoverable. When the scaling holds, one can
extract a reasonable approximation of the initial
recoverable deformation, which is separate from the
plastic deformation. In essence, the efficiency factor acts
as a stress magnification factor that easily can be
incorporated into a constitutive equation. Tracking the
change in efficiency factor with straining allows one to
account for the loss of observed compliance for the entire
range of recoverable deformation.
ADDRESS OF THE AUTHOR: Douglas W. Coffin
([email protected]), Department of Chemical and
Paper Engineering, Miami University, Oxford, OH
45056, USA
Corresponding author: Douglas W. Coffin
The tensile response of paper manifests from a complex
interaction of materials and structure on size-scales
ranging from molecular, cell wall, fiber, and network.
Still, the response is repeatable and systematic enough
that continuum-based constitutive modeling can be
successful at modeling the response. Many different
approaches to modeling the constitutive behavior of paper
have been applied including for example: hyperelasticity
(Johnson 1986), damage accumulation, (Isaksson et al.
2006), elastic-plastic behavior (Mäkelä and S. Östlund
2003), viscoelasticity (Lif, Fellers 1999), and nonlinear
viscoelastic-plastic behavior (Coffin, 2009). Although
these models can be fit to data and can be useful for
modeling specific situations, they cannot be used for
general loading cases. In addition, a model that only
considers limited contributing factors, will over-attribute
observed behavior to the accounted for feature. For
example, if one considers only damage it is attractive to
account for all decreases in tangent modulus with damage
accumulated in the sheet. On the other hand, a
viscoplastic model will attribute the drop in tangent
modulus entirely to relaxation and yielding, while
ignoring any contribution due to damage. Only after
accounting for all the main contributing factors, will a
model be adequate. The aim of the present work is to
determine how to account for both loss of properties
attributed to damage and strain hardening due to
structural alignment or activation while maintaining the
essential time-dependent and yielding aspects that are
inherent in the cellulosic materials from which paper is
made.
Craven (1962) studied work hardening in paper, which
he defined as an increase in the measured slope of the
initial de-straining part of a stress-strain cycle with
increased peak strain. In general, Craven (1962) found a
significant increase in this slope with increased
magnitude of strain. Skowronski and Robertson (1985)
also observed the increase in de-loading modulus with
strain level. In addition, they noted a decrease in initial
modulus for samples loaded to a previous strain and then
given time to recover under no load. Skowronski and
Robertson (1985) suggest that there are two competing
effects, (1) structural or material failure causing the
decrease in modulus and (2) activation of new material
with strain level. Skowronski and Robertson (1986)
further studied the recovery process for samples
previously loaded and allowed to recover under no
applied load. They again noted the decrease in initial
modulus with previous straining and the increase in local
modulus with level of straining. Whereas in the previous
paper they reported that little additional plastic strain
developed with stress-relaxation, in the latter paper they
reported that stress-relaxation did cause significant
increase in plastic strain when one allowed enough time
for the relaxation.
Isaksson et al. (2005) observed changes in modulus with
straining and correlated it with acoustic emissions from
the sheet. The acoustic emissions suggest damage is
occurring within the material and it was correlated with
damage observed with microscopy. Much of the damage
occurred as the sample approached the maximum load
and was especially increased post peak-load straining.
Tryding (1996) found that for straining beyond the post-
peak stress, very large decreases in modulus occurred.
The significant damage occurring near and after peak
stress is most likely dominated by the localized
progression to failure at some weak point in the system.
The damage that occurs prior to this is more likely
distributed through out the entire structure and an
inherent feature that changes the observed tensile
response.
Associating these observations of damage with inter-
and intra- fiber mechanisms has been a long-standing
debate. Ebeling (1973) summarized the early work and
added new information based on his measurements of
heat flow into and out of the sample during tensile load
cycles. He concludes that while inter-fiber bond breaking
occurs during straining, it is not required to explain the
plastic flow. Seth and Page (1981) showed that
differences in levels of bonding did not change the shape
of the stress-strain curve. They introduced the concept of
an efficiency factor, = Ei/E0, where Ei is the elastic
modulus of a sheet with low bonding and E0 is the elastic
modulus of a well-bonded sheet. Decreased bonding may
PAPER PHYSICS
Nordic Pulp and Paper Research Journal Vol 27 no.2/2012 305
cause the efficiency factor to decrease from unity and will
lower strength and stretch by moving the failure point
along the stress-strain curve. For sheets with insufficient
bonding for full activation of the network, the efficiency
factor is less than one and the observed stress-strain curve
is only a scaled version of the well-bonded sheet except
that the failure point is also moved to lower strain. Coffin
(2005) and DeMaio and Patterson (2005) showed that
this same efficiency factor could be used to explain the
changes in the measured creep response due to changes in
bonding created during papermaking. The implication of
this observation is that the factor 1/ acts like a stress
magnification factor to explain the role of bonding on the
development of the stress-strain curve.
It is well established that there are changes in structure
that occur during tensile straining. New surfaces are
created: material can re-align. Changes in the structure
can result in decreased initial elastic modulus, while at
the same time increasing the yield stress. Considering
that the degree of bonding in papermaking is associated
with modulus and strength development, the increase in
surface area and loss of modulus during straining should
be considered as inter-fiber interactions. The increased
yield and plastic deformation are likely to be more
associated with intra-fiber actions.
The influence of papermaking process changes and
previous straining on the development and subsequent
changes in material properties should be consistent. An
adequate model will have to account for multiple features
to give a more representative prediction. The following
results and discussion try to provide some insights on
how this reconciliation can be achieved by extending the
concept that the efficiency factor can decrease with
straining.
Materials and Methods Testing was conducted with the papers specified in Table
1. The tensile results in Table 1 were conducted using an
Instron 3344 in an environment held constant at 50% RH
and 22°C. Specimens had a gage length of 178 mm and a
width of 25.4 mm. The samples were clamped with line
clamps, and the rate of loading was 25.4 mm/min. The
standard deviation of the measurements is given in
parenthesis. The seventh column gives the ratio of the
tensile strength index to the tensile stiffness index. The
two-ply paperboard is a commercially laminated product
made from two-side coated bleached paperboard. The
hardwood market pulp is in the form of a dried
fiberboard.
All specialized tensile tests sections were conducted on
the Instron 3344 universal testing machine in a lab
conditioned to 50% RH and 22 °C. These specimens were
clamped using flat clamps with serrated edges. Masking
tape was used as tabs to reinforce the paper under the
clamps. The rate of displacement was 10 mm/min.
Dimensions of the tensile specimens varied with widths
from 15.0 mm to 76.2 mm and gage lengths from 100
mm to 535 mm. All the results presented here are for
cross direction, CD, testing. Preliminary results showed
that similar behavior as reported here for CD is observed
in MD, but to a much lesser extent.
Specimens were cut using a manual guillotine cutter.
Preliminary tests were conducted to determine the
difference between using the guillotine cutter and a
manual rotary trimmer and no significant variations were
found.
Several cases of tensile testing were completed as listed
below:
1) Loading to failure at a constant rate of elongation
2) Loading to a specified strain followed by cyclic
unloading-loading between specified limits.
3) Loading to a specified strain followed by rapid
unloading.
4) Loading to a specified elongation followed by a
period of stress relaxation.
Loading and unloading was conducted at constant rates
of elongation. Some samples were subjected to multiple
loading and unloading events. After any loading event,
the sample was allowed to recover under no load for
extended periods (up to 7 days). Examples of stress-
strain curves illustrating the four loading cases are
provided in Fig 1.
For the stress-strain curves given in the results section,
the stress was normalized to the tensile stiffness ratios
given in Table 1 and expressed as a percentage. The
strain is also shown as a percentage. Thus, the maximum
slope of the initial loading curve is equal one. The
deviation from linear-elastic behavior is observed in
deviation of the curve from the one-to one proportional
line.” All the samples tested have significant deviation
from a linear-elastic response
Results Fig 1 illustrates several important aspects of how the
response of paper changes with previous loadings. First,
note that that although there is not a significant change in
stretch with various loading cycles, samples that undergo
many cycles of loading tend to have lower stretch (Loss
Table 1. Properties of tested papers (standard deviation in parentheses).
Paper Grammage g/m2
Density kg/m3
MD/CD ratio of Tensile Strength Index
CD Tensile Stiffness Index MNm/kg
CD Tensile Strength Index kNm/kg
Scaled Tensile Strength, %
CD Stretch
2-Ply paperboard 300 900 2.4 3.80 (.1) 31.1 (0.6) 0.82 6.2 (0.4) linerboard 168 616 1.7 3.74 (.4) 43 (3.5) 1.15 4.3 (0.6) Copy paper 78 746 2.2 2.95 (0.1) 25.5 (0.5) 0.86 3.9 (0.3) Bond paper 75 750 2.1 3.40 (0.1) 32.9 (0.7) 0.97 6.1 (0.4) Newsprint 46 625 3.8 1.74 (0.2) 14.4 (0.4) 0.83 2.3 (0.2) Hardwood market pulp
990 990 1.2
3.60 (0.1) 24.4 (0.3) 0.68 3.8 (0.2)
PAPER PHYSICS
306 Nordic Pulp and Paper Research Journal Vol 27 no.2/2012

Fig 1. Example of four types of tensile testing completed in study for 2-ply paperboard.
of stretch observed in Fig 3). Second, the slope of the
recovered stress-strain curve (case 3) is lower than the
original curve for a large portion of the pre-yielding
curve. Third, the relaxation (case 4) causes additional
plastic deformation, implying time dependence on plastic
deformation. Fourth, the slope of the unloading and re-
loading (case 2) tend to be higher than the initial loading
from a recovered state. Fig 2 displays the slope or
tangent modulus for the stress-strain curves provided in
Fig 1. Note, that the maximum initial slope decreases
when the sample is reloaded after recovery. The peak
slope for immediate re-load cycle reaches higher limits,
and the initial unloading slope is higher than the re-
loading slope.
Four regimes of deformation appear after study of the
case 4 line (blue dash-dot line) in Figs 1 and 2.
(I) Initial activation of the network where the slope
increases rapidly to a peak,
(II) Recoverable stress-relaxation occurs where the
slope decays towards a middle plateau,
(III) Transition to additional plastic yielding where the
slope begins to drop rapidly
(IV) Plastic yielding dominates where the slope tends
toward a lower plateau.
This four–regime behavior was observed for many
different papers and loading schemes. For the results of
Fig 2, it appears that for the recoverable relaxation the
slope relaxes to about a third of its peak value. The
transition from elastic dominated behavior to plastic
dominated behavior gets shorter as the yield point
increases.
Fig 3 provides the stress-strain curves for a specimen
subjected to multiple events of case 2 loadings. After
loading to a specified strain, the sample was cycled
between the maximum strain and a lower load limit of
1 N for three cycles. Then recovery at zero load was
allowed before loading to the next event of strain. Nine
loading and unloading events were conducted before the
sample failed. Fig 3 also provides a loading to failure
Fig 2. Specific tangent modulus for stress-strain curves shown in Fig 1.
curve, case 1, for a similar sample. Note in loading event
6, a larger strain increment was taken. The strain at
failure for this sample is much lower than that of the
straight loading to failure. Presumably, this is due to
fatigue from the multiple loadings to which it was
subjected.
The maximum tangent modulus continues to decrease
for each subsequent reloading after recovery. Thus, an
efficiency factor, , can be defined for each re-loading
curve as the ratio of maximum tangent modulus to initial
maximum tangent modulus. Fig 4 shows the shifted and
scaled re-loading curves corresponding to Fig 3. Curve 1
is the same in Figs. 3 and 4. The other curves are shifted
by the plastic strain, taken as the amount of strain
required to shift the curves to curve one, and then scaled
by the inverse of the efficiency factor. In other words,
curves 2 to 9 in Fig 3 are divided by the corresponding
efficiency factor, The efficiency and the plastic strain
are given in the table inserted in Fig 4. The convergence
of the curves is good. The last loading event nine appears
to be stiffer than seven, and eight, but when one considers
the fact that the modulus has dropped to 68% of its
original value, the agreement is quite impressive. In fact,
when one looks at the scaling using the third re-loading
curves previously shown in Fig 3, the superposition is
quite good. The superimposed third reloading is given in
Fig 5, where the same scaling factors from Fig 4 are used
but shifted up one curve because the additional plastic
deformation and loss of efficiency occurred with the first
loading. For these third reloading curves, the strain is
fully recoverable.
The results in Fig 4 show that the scaling factor
remained one for strains up to 0.7% and the subsequent
scaling allowed the superposition of the curves to
increase to about 1.5% strain. This new level of
superposition would work for stress levels up to the
tensile strength, which has a stress to modulus ratio of
0.82.
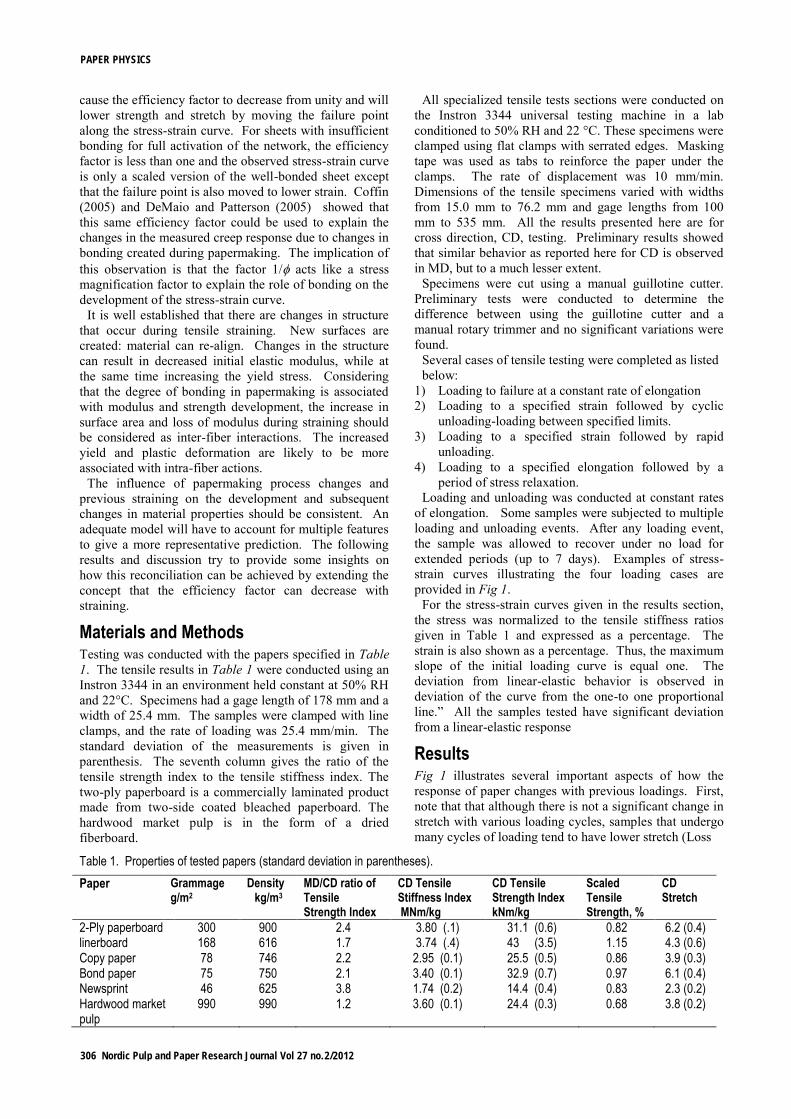
The shifting by the plastic strain and the scaling by 1/,
appears to hold for all the papers tested. Fig 6 provides
PAPER PHYSICS
Nordic Pulp and Paper Research Journal Vol 27 no.2/2012 307

Fig 3. Stress-strain curves for a 2-ply paperboard subjected to nine load cycles.
Fig 4. Superposition of reloading from a recovered state of subsequent stress-strain curves using the efficiency factor.
shifted and scaled curves for tensile tests using the other
papers listed in Table 1. For the bond paper, Fig 6a, nine
events of loading case 3, rapid unloading, were
conducted. These curves appear to scale well. Figs 6b-e
show examples of multiple loading events of loading case
2, where only one cycle of loading and unloading was
completed. Each subsequent loading event was to a
higher strain except curve 3 in Fig 6c, where the loading
was to the same maximum strain of curve 2. It appears
that scaling the reloading curves with the factor 1/
provides a method to account for the loss of modulus as
the sample isstrained. Obviously, the initial linear pro-
portional part of the stress-strain curve must superimpose,
Fig 5. Third reloading stress-strain curves from Fig 3 shifted and superimposed with the efficiency factor (Note x-axis has range of 1.6% strain compared to 3% strain for Fig 4).
but Figs 3-6 show that the superposition can work for the
entire re-loading curves. A comparison of Figs 4 and 5
reveal that the relaxed loading curve is much more
compliant than the immediate re-loading curve. The
difference is due to relaxation and emphasizes that time-
dependence cannot be ignored.
Fig 7 provides a graph of efficiency factor versus plastic
strain for the papers shown in Figs. 4 and 6. Although,
there is not a universal trend, for each paper there appears
to be a systematic drop in efficiency with plastic
straining. The newsprint is the most sensitive and the
copy and bond paper are the least sensitive. The lines
PAPER PHYSICS
308 Nordic Pulp and Paper Research Journal Vol 27 no.2/2012
(a)
(b) (c)
(d) (e)
Fig 6. Superimposed re-loading curves for various papers.
PAPER PHYSICS
Nordic Pulp and Paper Research Journal Vol 27 no.2/2012 309

Fig 7. Efficiency factor versus plastic strain for samples shown in Figs 4 and 6.
Fig 8. Third unloading curves shifted along strain axis and scaled by efficiency factor (third loading curve for event 8 provided for reference.)
Fig 9. Increase in modulus with applied strain.
shown in Fig 7 are included only to suggest that a trend
exists.
After investigating the unloading curves, it was found
that they do not superimpose with the efficiency factors
given in Figs. 4 and 5. This is because the paper has a
stiffer response at higher levels of straining. When the
sample is unloaded from a higher strain the initial slope is
higher. As the load approaches zero load level
components of the sheet are put into compression. Fig 8
shows that the unloading curves do form an envelope that
is comparable to the re-loading curves. The unloading
curves were inverted by taking the peak stress as the
origin. The curves were scaled by the same efficiency
factors given in Fig 5. For the larger peak strains (curves
7 and 8), the initial unloading has a significantly stiffer
response.
Fig 9 illustrates the increase in stiffness that occurs with
loading. A sample of linerboard that was previously
strained to 1.5% was strained to 3.5% followed
immediately by one minute of relaxation and three and
one half cycles of saw tooth strain with a magnitude of
0.19% strain (curve 1 in Fig 9). Then the sample was
allowed time for recovery. Eight more events of loading
to a specified strain followed by 1 minute of relaxation,
PAPER PHYSICS
310 Nordic Pulp and Paper Research Journal Vol 27 no.2/2012
and the 0.19% amplitude strain cycles were completed.
After the cycling and unloading, a recovery period was
given (curves 2, 3, and 5-8 in Fig 9). Fig 9 shows the
modulus normalized to the initial modulus for these
events. At the end of event 4, the sample was not
unloaded, and one observes that the initial slope of curve
5 matches that of curve 4. Event 10 also occurred after
holding the sample at the end of event 9. One sees that
the slope rapidly approaches that of the slope in the
plastic flow regime. Fig 9 shows that for the 2% strain
reloading range, the stiffness increases about 20%. Event
2 in Fig 9 shows that at the peak slope, the network is just
being fully activated and the loading portion of the cycle
does not experience elevated stiffness, but the unloading
portion does.
The curves provided in Fig 9, demonstrates how the
slope changes during the small-scale loading and this is
typical of a viscoelastic response. Curve 1 in Fig 9 also
shows the four regimes of deformation previously defined
above.
Discussion When previously strained samples are re-loaded, the yield
point tends to be much better defined and the deformation
below yield is mostly recoverable. When plastic yielding
occurs, one assumes that any increase in load is
accompanied by an increase in recoverable deformation.
Separating the recoverable deformation from the plastic
deformation can be achieved only if one knows the shape
of the recoverable curve. The use of the Seth and Page
(1981) efficiency factor, , allows one to account for the
loss of load carrying ability due to previous strain
loading. It also allows for an estimate of the original
recoverable deformation from the subsequent re-loadings
of recovered samples. The scaling of 1/ magnifies the
stress and allows for a systematic extrapolation to higher
stresses. One only needs to know the shape up to the
tensile strength of the sample. For example, one could
use the loading curves labeled 7 or 8 in Fig 4 as the shape
of the recoverable curve, which is needed up to a scaled
value of /E=0.82, which is the scaled failure stress. In a
model, one would take this as the shape of the
recoverable deformation curve and then modify it by
multiplying it by the efficiency factor as straining
progresses and efficiency is lost.
Given that significant relaxation influences the
recoverable response, the stress-strain curves could be
predicted from a viscoelastic model. Just scaling the
initial modulus by the efficiency factor would not suffice.
Coffin (2005, 2009) showed that if 1/ is considered a
load magnification factor the effect of initial bonding
level could be incorporated into a nonlinear viscoelastic
model for paper. If the constitutive equation for the paper
is written as a function of stress, strain, and their
derivatives,
F(, d/dt, d2/dt
2 …, , d/dt, d
2/dt2 )=0. [1] (1)
The scaling results presented here suggest that one
would simply modify it by dividing all stress terms by the
factor .
F(, d( )/dt, d2( )/dt
2 …, , d/dt, d
2/dt2 )=0 [2]
The efficiency factor would be a specified function of
the plastic strain. This approach provides a solid
connection to the previous observations of the effect of
initial bonding level on the stress strain curve given by
Seth and Page (1981) and the loss of bonding observed
during plastic strain accumulation, (Ebeling 1973) and
(Isaksson et al 2006). This new result would suggest that
lack or loss of bonding influences the tensile behavior in
the same manner regardless of whether it was initially
low bonding or a later loss of bonding. For strained
sheets, this loss of bonding can be considered as damage
to the sheet. This damage is not localized in one region
but dispersed though the entire sample. Linerboard
samples (583 mm x 75 mm) that were strained to failure
in tension were cut and tensile and compressive tests
were conducted in regions away from the failure. In
tension, the samples exhibited a yield stress at the level of
the previous failure stress and displayed more yielding
before failure. The compressive strength dropped 8%.
Clearly, damage was induced in the sheet. It also
suggests that while yielding and plastic behaviors are
more likely attributed to intra-fiber behavior, there is a
significant loss of inter-fiber interactions resulting in a
reduction of both elastic modulus and compressive
strength.
The data suggests that the efficiency factor changes
mainly when plastic deformation occurs. Thus, a
functional dependence of efficiency factor versus plastic
deformation can be established. The plot of efficiency
factor versus plastic strain for the papers tested (Fig 7),
gave multiple curves. Some papers appeared to follow
the same trend, but newsprint for example is much more
sensitive than the other papers. Presumably, this is
because the newsprint is a low-density sheet and made
from a mechanical pulp so it would be expected to be
more sensitive to bonding changes. The shape of the
curves does not appear to be linear, but rather after the
efficiency factor begins to drop the slope decreases as
plastic strain accumulates.
Even though tensile strains induce damage in the sheet,
strain hardening still occurs. This strain hardening can be
significant and must be accounted for in a model. It
would seem likely that this hardening is due to re-
alignment of stiff components with the direction of the
strain. When loads are removed, the material recovers
and the modulus drops. Since the third reloading curves
can be scaled, the effect of damage appears to influence
the degree of strain hardening uniformly. For unloading,
the strain hardening at high strains prevents the same
scaling as the loading curve. As the sample approaches
peak load and failure, there is additional observed
hardening, curve 9 in Fig 4, which prevents the scaling.
The strain hardening could be accounted for in a model
by prescribing the stiffness associated with the
recoverable deformation to be functions of recoverable
train level. It appears that a linear function would suffice.
Damage and strain hardening can be reconciled with
each other. One effect of straining on subsequent tensile
loading is that it induces damage and opens the structure
up. In the recovered state, the paper is then more
compliant requiring additional deformation for full
PAPER PHYSICS
Nordic Pulp and Paper Research Journal Vol 27 no.2/2012 311

activation of the network. At first, the loads are not
sufficient for plastic deformation of load-carrying
components. Once the load carrying components are
activated, some structural alignment will occur. Once
load levels are sufficiently high, yielding occurs and
material self-stiffening will occur. Along with this plastic
yielding, more damage accumulates, most likely in
regions where load is transferred between stiff elements.
Upon subsequent recovery and reloading, the load
transfer is less efficient and treated as a magnification of
actual stress.
Conclusions The effect of pre-straining on the tensile response of
paper can be accounted for by scaling the initial response
by an efficiency factor and allowing the network
efficiency to decrease with the accumulation of plastic
strain in the sheet. Subsequent loading curves from a
recovered state can be obtained by multiplying the initial
response by the efficiency factor. For recoverable
deformation, the scaling appears to be adequate for load
levels up to the tensile strength of the material. The
decrease in modulus with subsequent loading is not
negligible and a previously strained paper can possess
significantly more compliance in the recoverable
deformation zone. If the damage is not accounted for, too
much compliance may be associated with relaxation or
plastic flow.
Paper also exhibits strain hardening when under tension.
The hardening is inherently active during constant rate of
loading but is masked by relaxations. If hardening is not
accounted for, the elastic deformation or relaxation at
higher loads may be under predicted.
A significant portion of the load can be relaxed from the
sample, especially if enough time is provided for plastic
deformation, which is time dependent. Much of the
curvature of the recoverable deformation curve also
appears to be associated with relaxations. If the time
dependence was ignored too much emphasis would be
placed on either plastic flow or damage.
Thus, to have a more representative model for the
tensile response of paper, time dependence, plastic
yielding, damage evolution, and strain hardening should
all be accounted for. Time-dependence and yielding can
be adequately handled with viscoelastic-plastic models,
damage can be accounted for by tracking the efficiency
factor, and strain hardening will require tracking stiffness
as a function of some loading parameter.
Literature
Coffin, D.W. (2005): “The Creep Response of Paper,” Advances in Paper Science and Technology, Trans. of the 13th Fund. Res. Symp., (S. J. I’Anson ed.), Vol II, 651-747.
Coffin D. W. (2009): “Developing a deeper understanding of the constitutive behavior of paper”, Advances in Pulp and Paper Research, Trans, of the 14th Fund. Res. Symp., (S. J. I’Anson ed.) 841-876 .
Craven, B.D. (1962): “Stress Relaxation and Work Hardening in Paper,” Appita J 16(2);57-70
Ebeling K.I. (1973): “Distribution of energy consumption during the straining of paper,” The Fundamental Properties of Paper Related to its Uses, Trans. Vth Fund. Res. Symp., (F. Bolam, ed.), 304–335.
Isaksson, P., Hagglund, R. and Gradin, P. A. (2004): “Continuum damage mechanics applied to paper,” Int. J. Solids Structures 41, 4731-4755.
Isaksson P., Gradin, P.A., and Kulachenko, A. (2006): “The onset and progression of damage in isotropic paper sheets,” Int. J. Solids Structures 43, 713-726.
DeMaio, A. and Patterson, T. (2005): Influence of fiber-fiber bonding on the tensile creep behavior of paper. Advances in Paper Science and Technology, Trans. of the 13th Fund. Res. Symp., ( S. J. I’Anson ed.) Vol II, 749–775.
Seth, R. S. and Page, D.H. (1981):“The stress-strain curve of paper”, The Role of Fundamental Research in Paper Making, Trans. of the .7th Fund. Res. Symp., (J. Brander, ed.), 421–452.
Skowronski, J. and Robertson, A.A. (1985): “A Phenomenological Study of the Tensile Deformation Properties of Paper,” J. Pulp Paper Sci. 11(1), J21-J28.
Skowronski, J. and Robertson A.A. (1986): “The Deformation Properties of Paper: Tensile Strain and Recovery,” J. Pulp Paper Sci 12(1), J20-J25.
Lif, J. and Fellers, C. (1999): “In-plane viscoelasticity of paper in the frequency domain,” Nord. Pulp Paper Res. J. 14(1), 82-91.
Johnson, M.W. (1986): “Constitutive Models of Paper Properties,” Solid Mechanics Advances in Paper Related Industries, (R. W. Perkins, R. E. Mark, and J. L Thorpe eds), 210-221.
Mäkelä, P. and Östlund, S. (2003): “Orthotropic elastic-plastic material model for paper materials,” Int. J. Solids Structures 40: 5599-5620.
PAPER PHYSICS
312 Nordic Pulp and Paper Research Journal Vol 27 no.2/2012