Embed Size (px)
Citation preview
Final Report
1
Use of sulfate and water isotopes to improve water and
chemical balance estimates for water seeping from
tailings basins (focus on US Steel’s Minntac Basin)
An MWRAP 2 Final Report
Megan Kelly, Michael Berndt, and Travis Bavin
August 28, 2014
Minnesota Department of Natural Resources
Division of Lands and Minerals
500 Lafayette Rd.
St. Paul, MN 55155

Final Report
2
TABLE OF CONTENTS 1. Abstract ………………………………………………………………………………………3
2. Introduction ……………………………………………………………………………………3
3. Background ……………………………………………………………………………………4
3.1. Water Isotopes ………………………………………………………………………4
3.2. Sulfate Isotopes ……………………………………………………………………6
3.2.1. Sulfide Oxidation …………………………………………………………6
3.2.2. Sulfate Reduction …………………………………………………………7
4. Methods…………………………………………………………………………………...……9
4.1. Site Description………………………………………………………………………9
4.2. Sample Collection and Analysis ……………………………………………………9
5. Results ……………………………………………………………………………………….11
6. Discussion…………………………………………………………………………………….12
6.1. Dilution ……………………………………………………………………………12
6.2. Oxidation and Reduction …………………………………………………………14
7. Summary and Future Work …………………………………………………………………16
8. Acknowledgements …………………………………………………………………………17
9. References ……………………………………………………………………………………17
Tables ……………………………………………………………………………………………21
Figures……………………………………………………………………………………………24

Final Report
3
1. ABSTRACT
The Minnesota Department of Natural Resources performed a chemical and isotopic
investigation of waters in and around the Minntac Tailings Basin during 2011-2012. The aim of
this study was to assess multiple processes that can influence sulfate concentrations in basin
seepage waters. Samples were analyzed for major cations and anions, the isotope composition of
water (δ2HH2O and δ
18OH2O) and the isotopic composition of dissolved sulfate (δ
34SSO4 and
δ18
OSO4). This report details the methods used to calculate the impact of dilution, oxidation of
sulfide minerals, and bacterial sulfate reduction on sulfate concentrations measured at seeps,
wells, and stream downgradient of the basin.
Several approaches were taken to estimate the downstream dilution of mine-impacted water.
Bromide and chloride appear to be suitable for use as conservative tracers, with similarly
decreasing concentration profiles moving away from the tailings basin. However, initial chloride
and bromide concentrations in the basin have changed over time, potentially impacting the
calculated dilution effect. An alternative method involves the identification of characteristic
water isotope end members and the application of mass balance calculations to estimate dilution
by fresh water sources. A percent dilution was assigned for each downstream location sampled
based on the combined evidence from the chloride, bromide, and water isotope measurements.
Sulfate concentration at many of the downgradient locations were higher than expected based on
the applied dilution effect. Furthermore, a positive shift in sulfate isotopes provides the first
clear indication that sulfate reduction is impacting the seepage waters. We simultaneous solve
sulfate isotopic mass balance and Rayleigh equations to determine the amount of sulfide
oxidation and sulfate reduction occurring around the basin. We calculate that up to 600 mg/L of
“extra” sulfate is present in waters surrounding the basin, demonstrating that the oxidation of
sulfide minerals in tailings does impact the sulfate concentration of seepage into both the Sand
and Dark River watersheds. Sulfate is also being reduced and subsequently precipitated in the
form of iron sulfide minerals as water seeps through the subsurface, reducing total sulfate
concentrations by up to ~30%. It is critical, then, to account for these processes in the
development of a basin sulfate balance.
2. INTRODUCTION
The release of dissolved sulfate from minelands continues to be an issue of concern for the iron
mining region of Minnesota, in part due to the potential link between sulfate reduction and
production of methyl mercury (MeHg), a toxic form of mercury that bioaccumulates in the food
chain. While recent research efforts suggest that most MeHg is produced in non-mining
influenced wetlands, high sulfate inputs at some specific wetland environments may promote the
production and transport of MeHg (Berndt and Bavin, 2009; 11). There is also ecological,
Final Report
4
economic, and cultural concern over the impact of sulfate levels on Minnesota’s wild rice
production. Minnesota’s legal SO4 standard for wild rice producing waters, 10 mg/L, was
adopted in response to studies showing that wild rice grew only in low sulfate waters (Moyle,
1956). The standard is currently being reviewed, along with a detailed study of the linkages
between elevated sulfate concentrations and the growth cycle of wild rice. Results of those
studies will dictate the levels that need to be achieved during the growing season in all waters
classified as wild rice producing waters. Through mixing with non-contaminated recharge
waters, high concentrations of solutes (such as sulfate) in seepage waters are naturally attenuated
moving away from the source. Dilution alone is often sufficient to bring downstream waters into
compliance. However, particularly when this is not the case, it is important to have an
understanding of chemical and biological reactions that can occur along the transport path.
Stable isotope information complements the hydrogeochemical methods often used to develop
mine water and chemical balances, ultimately giving us a better understanding of the
environmental impacts of mining activities. Isotopes have the potential to deliver information
that is otherwise unattainable, uncovering previously overlooked complexities. At the same
time, certain isotopic applications may be more cost- and time-efficient, as more information can
be ascertained with fewer, precise measurements. Hydrogen and oxygen isotopes of water
(δ2HH2O and δ
18OH2O) are relevant in mineland studies as they act as a natural fingerprint for
different water bodies, allowing us to identify sources, evaluate mixing relationships, and
estimate the impact of evaporative loss. Isotopes of dissolved sulfate (δ34
SSO4 and δ18
OSO4) can
be used to trace the origin of sulfate and assess subsequent cycling processes.
This report focuses on the Minntac taconite mine property and surrounding area. Our study of
seeps, monitoring wells, and downstream waters suggests that new SO4 is added to the adjacent
watersheds via oxidation of sulfide minerals in tailings. In addition, we find that that a
considerable amount of sulfate reduction occurs as seepage escapes from the tailings basin and
travels downgradient through the subsurface, potentially offsetting a portion of the impact from
sulfide oxidation. Careful examination of isotopic information helps constrain the influence of
both processes on the sulfate balance at the Minntac mine.
3. BACKGROUND
3.1. Water Isotopes
Isotopes are atoms of a given element that differ in mass due to the presence of additional
neutrons. A water molecule, for example, has a different mass depending on what isotopes of
hydrogen and oxygen are present. Heavy and light isotopes preferentially fractionate into
different phases or reservoirs during certain physical, chemical, and biological processes. As a
consequence, small differences in the isotopic composition can be observed, providing
information on processes that have impacted the phase of interest over time. The isotope
fractionation factor, α, describes the isotope ratios of the coexisting reactant and product phases.
Final Report
5
The fractionation between the liquid phase and the vapor phase of water can be described by the
following equation:
α = [18
O/16
O]L/[18
O/16
O]V
Isotope fractionation typically results in very slight changes in the isotopic ratios, and thus,
isotope values themselves are reported as delta (δ) values, in per mil (‰) units relative to a
standard.
δ18
O (‰) = [(18
O/16
O)sample/(18
O/16
O)standard - 1] x 1000
The isotope separation factor,
ε = 1000 (αl-v-1) ≈ δL - δV
is a more convenient way to express isotope fractionation, as this value also approximates the
difference in δ-values between the two phases. Comparable equations apply for 2H/
1H as well.
Isotope fractionation of water isotopes occurs during phase changes and meteorological
processes. Mass-related differences in vapor pressure influence the δ2H and δ
18O values of
precipitation during rainout, with the isotopic composition of precipitation related to that of the
source vapor by the equilibrium fractionation factor. The isotope separation factor for hydrogen,
εH, is approximately 8 times greater than that for oxygen, εO. Consequently, the isotopic
composition of global precipitation falls on a well-defined line in δ2H and δ
18O space referred to
as the “global meteoric water line” (GMWL, see Figure 1) with a slope of ~8 (Craig, 1961).
Latitude, elevation, seasonal conditions and air mass history can all affect where the δ2H and
δ18
O of precipitation plots along the GMWL.
Evaporation of surface waters also generates a fractionation effect, in part due to the mass-
related differences in vapor pressure; heavy molecules with lower vapor pressure are less likely
to enter the vapor phase during evaporation. Molecular diffusion and turbulent transport of
evaporated moisture across the water/air interface impart an additional kinetic fractionation
effect during evaporation. The result is an enrichment in the heavy isotopes of both hydrogen
and oxygen relative to the original composition of the water body. The composition of lake and
river water recharge is approximately equivalent to that of local mean annual precipitation
(MAP), which has a δ18OH2O of approximately -10.7‰ in the iron mining region of Minnesota,
estimated using the online isotopes in precipitation calculator (OIPC) website (Bowen, 2013;
Bowen et al., 2005; Bowen and Revenaugh, 2003) . The progressive impact of evaporation pulls
the isotopic values away from the initial composition along a trend called a local evaporation line
(LEL, see Figure 1).
Examination of the differences in isotopic composition of δ2H and δ
18O therefore allows us to
trace the origin and evolution of various waters. By identifying isotopic end member
compositions, we can use simple mass balance equations to evaluate mixing and dilution. A

Final Report
6
combined isotopic and mass balance, along with site specific climate parameters, can also be
used to estimate the amount of evaporative loss (Gibson et al., 1993), especially important in the
development a water balance for mining operations.
3.2. Sulfate Isotopes
3.2.1. Sulfide Oxidation
δ34S values of dissolved sulfate can provide information on source mineralogy, while the δ
18O
can help clarify the oxidation pathway responsible for forming the sulfate. The MN DNR has
measured the concentration and isotopic composition of dissolved sulfate in mine pits and
discharges across the Mesabi Iron Range of NE Minnesota (see Figure 2 for data, Figure 3 for
location map). Figure 2a shows the δ34
SSO4 values vs. concentration of dissolved sulfate for the
mine pit and discharge waters (Berndt and Bavin, 2012; unpublished data). Most data points fall
between about +4 and +12‰, similar to the range of δ34
S values associated with primary sulfides
in the iron formation (Carrigan and Cameron, 1991; Johnston et al., 2006; Poulton et al., 2010;
Theriault, 2011). There is little to no net fractionation of sulfur isotopes during the oxidation of
sulfide minerals (Taylor et al., 1984; Toran 1986; Toran and Harris, 1989), and thus the overlap
in values suggests that the origin of dissolved sulfate in the mine waters is likely the oxidation of
primary sulfide minerals. Alternatively, the range may represent a bulk average resulting from
the oxidation of both primary and secondary sulfides. Mine pits with low sulfate concentrations,
however, have δ34S values that fall outside of the primary sulfide range, spanning between about
-7 and +5‰. This suggests that at these sites, which tend to be located towards the western side
of the iron range, the mineral source for dissolved sulfate source is predominantly secondary
sulfides with more negative δ34
S compositions.
The oxygen isotopic composition of sulfate produced by the oxidation of sulfide minerals is a
more complicated story. The δ18
O of sulfate is influenced by the specific oxidation pathway and
the associated equilibrium and/or kinetic fractionation effects. Though the overall process
involves a number of intermediate steps, pyrite oxidation is commonly described by two end
member reactions,
(1) FeS2 + 3½O2 + H2O Fe2+
+ 2SO42-
+ 2H+
(2) FeS2 + 14Fe3+
+ 8H2O 15Fe2+
+ 2SO42-
+ 16H+
In Reaction 1, dissolved molecular oxygen (O2) is the oxidant, whereas in Reaction 2 the
oxidizing agent is ferric (Fe3+
) iron. Reaction 2 is limited by the supply of Fe3+
, and can proceed
only as the supply of Fe3+
is replenished by the oxidation of Fe2+
. According to the above
reactions, sulfate oxygen can either come from O2, with a δ18
O of +23.5‰, or oxygen from the
water molecule, which typically has a negative δ18
O. Locally, the oxygen isotopic composition
of mean annual precipitation is approximately -10‰. The large difference in potential source
Final Report
7
18O/
16O composition should allow for a closer examination of the sulfide oxidation process
responsible for producing the sulfate.
However, most studies show that regardless of the oxidizing agent, water-oxygen is the dominant
source of oxygen in the product sulfate molecule, and that O2 does not interact directly with the
sulfur atom during oxidation of sulfide minerals (Moses et al., 1987; Rimstidt and Vaughn,
2003). Isotopic investigations generally support this interpretation, but suggest that under certain
conditions, a significant portion of the sulfate-oxygen can come from the isotopically heavier O2
molecule (Taylor et al., 1984; Van Stempvorrt and Krouse, 1994; Balci et al., 2007). The
oxidation of sulfide to sulfate involves a series of electron transfers, producing sulfoxy anions of
intermediate oxidation states along the way such as thiosulfate (S2O32-
) and sulfite (SO32-
).
Depending on environmental conditions, such as pH and O2 and/or Fe3+
availability, intermediate
species may dissociate from the mineral surface and accumulate in solution prior to the final
oxidation to sulfate (Moses et al, 1987; Kohl and Bao, 2011). Experimental results indicate that
isotope effects associated with the final intermediate sulfoxy anion, sulfite (SO32-
), may largely
be responsible for the final signature of product sulfate (Müller et al., 2013). If sulfite oxidation
is rapid relative to the exchange of SO32-
-oxygen with water, then the δ18
O of sulfite (with either
a water or O2 source) will be at least partially preserved in the sulfate. Slower oxidation allows
more time for the oxygen isotopic signature of sulfite to be reset by equilibrium exchange with
water and the associated fractionation effect. Again, the rate and extent of oxygen exchange are
controlled by a combination of environmental factors.
Oxygen isotope values of dissolved sulfate in Mesabi Range mine pit and discharge waters vary
along a trend between -11 and +5‰, and the cause of this variability remains unclear. However,
there appears to be a link between 18
OSO4 and sulfate concentration, suggesting that different
processes are involved in the oxidation of sulfide minerals at different sulfate concentrations
(Figure 2b). The range in sulfate concentrations, as noted earlier, also appears to be spatially
dependent. Dissolved sulfate in waters from central-eastern locations have relatively high sulfate
concentrations along with more negative δ18
OSO4, which implies that the sulfate-oxygen is
derived entirely from the water molecule (δ18
OH2O ~-10‰) with little to no net fractionation
effect. Sulfate concentrations are lower in mine waters towards the western end of the iron
formation, and these waters typically exhibit more positive δ18
OSO4 values. These relatively
heavy oxygen isotope compositions may suggest a reaction pathway where O2-oxygen is also
incorporated into the product sulfate and/or may implicate the aforementioned interplay between
the rates of sulfite oxidation and sulfite-water isotope exchange in shaping the isotopic
composition of sulfate during sulfide oxidation (Müller et al., 2013).
3.2.2. Sulfate Reduction
The 34
S/32
S ratio of dissolved sulfate can also be used to determine whether and the degree to
which bacterial sulfate reduction has impacted the initial sulfate pool. In the presence of an

Final Report
8
organic carbon source (represented here by CH2O), certain strains of bacteria are capable of
simultaneously oxidizing organic carbon and reducing sulfate to gain energy for growth, as
depicted in the following general equation:
2(CH2O) + SO42-
= 2(HCO3-) + H2S
The sulfate is reduced to S2-
in the form of HS-, H2S, or where iron is present, may precipitate as a
solid Fe-sulfide. Lighter isotopes often accumulate in the product pool during isotope
fractionation because of mass dependent thermodynamic properties. Chemical bonds in lighter
isotopes are easier to break than the bonds in molecules containing the heavier isotopes.
Therefore, the lighter 32
SO4 is preferentially utilized by the bacteria during metabolism. The
sulfide produced will have a δ34
S that is isotopically lighter than that the source sulfate.
The pertinent isotope fractionation factor describes the ratio of 34
S/32
S in the coexisting reactant
(SO4) and product (H2S) phases:
α = [34
S/32
S]SO4/[34
S/32
S]H2S
and the isotope fractionation effect, ε, is related to the fractionation factor by the following
formula:
ε = 1000 (αSO4-H2S 1).
We assume that a Rayleigh distillation process applies for 34
SSO4 during sulfate reduction.
Implicit in the Rayleigh model is the requirement that the product (S2-
) is instantaneously
removed from the system as Fe-sulfide or H2S gas, and permanently isolated from the source
SO42-
pool. As mentioned above, the product sulfide is enriched in 32
S compared to 34
S, and thus
the residual dissolved sulfate pool becomes progressively enriched in 34
S compared to 32
S. The
Rayleigh Equation, shown below, describes the partitioning of isotopes and the reactant reservoir
progressively decreases in size.
R = R0f(α-1)
In this equation, “R0” refers to the initial 34
S/32
S ratio of the sulfate pool and “f” refers to the
fraction of the original sulfate remaining. As reduction proceeds, “f” decreases and the SO4
becomes progressively more enriched in the heavier 34
S (and 18
O). We can also convert the
isotope ratios to express the Rayleigh equation in delta notation:
34
SSO4= (34
SSO4,init + 1000) f (α-1)
– 1000
Detailed studies of microbial sulfate reduction using both laboratory cultures and environmental
samples show that the associated fractionation effect can vary widely. Laboratory studies
typically give a range between ~2 and +46‰, but under certain conditions a fractionation effect
of up to +70‰ is possible (Canfield and Teske, 1996; Detmers et al., 2001; Sim et al., 2011a).

Final Report
9
The degree of isotope fractionation is controlled by an inverse relationship with the rate of
sulfate reduction (slower rates lead to higher fractionations). Sulfate reduction rates, in turn, are
impacted by a variety of factors, including the make-up of the bacterial community, sulfate
concentration, temperature, and the type of organic substrate or fuel (Bruchert et al., 2001;
Canfield, 2001; Detmers et al., 2001; Kleikemper et al., 2004; Sim et al., 2011b). For the
purposes of this study, we adopt a value of α = 0.983 (ε = 17‰). Berndt and Bavin (2011)
arrived at this value using data from nearby sites where “f” was available using alternate
methods.
While the lighter isotopes of oxygen are also generally favored during bacterial sulfate reduction
as well, the oxygen isotopic signature of residual sulfate is again more complicated to interpret.
The isotopic signature of oxygen potentially involves the recycling of sulfur intermediates and
oxygen isotopic exchange with water/atmospheric O2. Studies are underway to examine the
isotopic response to the sulfate reduction process in more detail, and are discussed elsewhere in
more detail (Kelly and Berndt, 2014b). We concentrate mainly on the 34
S of sulfate to examine
sulfate reduction in the vicinity of the Minntac mine property.
4. METHODS
4.1. Site Description
This study focuses on the United States Steel corporation Minntac tailings basin site in Mountain
Iron, Minnesota (Figure 3), located in the central portion of the Mesabi Iron Range just north of
the Laurentian Divide. The basin holds tailings produced during the processing of ore and also
stores water for reuse in the plant facility. The basin covers a total area of 7612 acres, with an
open water area (including Cell 1 and Cell 2 pools) of 1234 acres. Most of the water stored in
the Cell 1 and Cell 2 pools is cycled back to the plant for use in processing. A portion, however,
seeps from the bottom of the basin and through the perimeter dike into the surrounding
watersheds, namely the Sand River watershed to the east of the basin and the Dark River
watershed to the west. The concentration of dissolved sulfate is elevated in the Tailings Basin
pool waters, and thus the seepage water that discharges into the Sand and Dark River watersheds
is elevated as well.
4.2. Sample Collection and Analysis
Samples were collected for aqueous chemistry and environmental isotopes (2H/
1H and
18O/
16O of
water, 34
S/32
S and 18
O/16
O of sulfate) from in and around the Minntac plant and tailings basin. In
December 2011, samples included the Mountain Iron Pit Reservoir, a number of plant process
waters (Scrubber, Blowdown, Thickener, Agglomerator Process Water, Fine Tails), Tailings
Basin Cell 1 (return water), two seepage collection sites at the eastern toe of the basin, and
downstream on the Sand River. One liter water samples were collected by hand or with a Teflon
sampling cup. In the case of Fine Tailings, sample water was decanted of the top after the solids
Final Report
10
were allowed to settle. A similar set of samples was collected in September 2012, with the
addition of Tailings Basin Cell 2 water, two monitoring wells on the east side of the basin, and a
downstream site on the Dark River, which drains the west side of the basin. We returned in late
October of 2012 to sample an additional suite of 8 monitoring wells around the perimeter of the
basin (see Figure 2). Prior to sampling, monitoring wells need to be purged to ensure that fresh
water samples are obtained. Minntac personnel bailed each well the day before our sampling
visits, and on the day of, several well volumes were purged by pumping water through Teflon
tubing attached to a portable peristaltic pump. Well waters were passed through a flow-through
YSI cell to measure field parameters including temperature, pH, dissolved oxygen (DO), and
conductance. Sampling commenced once the parameters had stabilized.
Major cation and anion samples were filtered at the DNR lab in Hibbing, MN with 0.45 µm PES
filters, or at the site using a 0.45 µm cartridge filter. Cation samples were preserved with ultra-
pure nitric acid and shipped on ice along with the anion samples for analyses by the University
of Minnesota – Geochemistry Laboratory (Minneapolis, M) for analysis by ICP –AES and ion-
chromatography, respectively.
All water isotope samples collected in 2012 were filtered using a 0.45 µm PES membrane filter
and stored unpreserved in 30 mL HDPE bottles until shipped to University of Waterloo
Environmental Isotope Lab for analysis. Bottles were tightly sealed with limited headspace to
minimize further evaporative loss. Samples obtained in 2011 were collected in 1L bottles for
both water and sulfate isotope analysis. The 1L samples were filtered in the Hibbing laboratory
using 0.7 µm glass fiber filters and sent to the University of Waterloo for analysis. Water
isotope samples were analyzed using standard isotope ratio mass spectrometry methods. 18
O/16
O
abundance was determined via gas equilibration and head space injection into an IsoPrime
Continuous Flow Isotope Ratio Mass Spectrometer (CF-IRMS). 2H/
1H was determined via
chromium reduction on a EuroVector Elemental Analyzer coupled with an IsoPrime CF-IRMS.
Internal laboratory standards are calibrated and tested against international standards from the
International Atomic Energy Agency (IAEA), including Standard Light Antarctic Precipitation
(SLAP), Greenland Ice Sheet Precipitation (GISP), and Vienna Standard Mean Ocean Water
(VSMOW). δ18
OH2O and δ2HH2O are reported in ‰ relative to the international standard Vienna
Standard Mean Ocean Water (VSMOW), which approximates the composition of the global
ocean. Sample replicates are run approximately every 8 samples. Analytical uncertainties are
±0.2‰ and ±0.8‰ for δ18
O and δ2H, respectively.
Approximately 250 mL to 1 L water was collected for S and O isotope analysis of SO42-
.
Samples were filtered after collection at the Hibbing laboratory using 0.7 µm glass fiber filter
paper. All samples collected in 2012 were prepared for analysis at the DNR Hibbing Lab.
Sulfate was extracted as solid BaSO4 using procedures modified from Carmody et al. (1998).
Water samples were first filtered through a 0.45 µm PES membrane filters. The filtrate was
acidified with 1M HCl to a pH of 3-4 and heated at 90°C for ~ one hour so that any carbonate
present would be degassed as CO2. Approximately 6 ml of 6% H2O2 was also added to each

Final Report
11
sample prior to heating to oxidize and degas any dissolved organic matter. These measures
reduce contamination of the BaSO4 precipitate. After heating, ~5 ml of 20% BaCl2 was added
(in excess) and the samples were allowed to cool for several hours or overnight. The BaSO4
precipitate was collected on pre-weighed 0.45 µm PES membrane filters, and was dried
overnight at 90°C. Once dry, the BaSO4 powder was weighed, scraped into glass vials, and
stored until shipment to the University of Waterloo Environmental Isotope Laboratory in
Ontario, CA for isotopic analysis. Prior to the 2012 sampling season, water samples were
shipped to the University of Waterloo, where they were then prepared for analysis in a similar
manner.
The University of Waterloo Environmental Isotope Laboratory analyzed each BaSO4 sample for
δ34
SSO4 and δ18
OSO4. Relative 34
S and 32
S abundances for the precipitates were determined using
an Isochrom Continuous Flow Stable Isotope Ratio Mass Spectrometer (GV Instruments,
Micromass, UK) coupled to a Costech Elemental Analyzer (CNSO 2010, UK). Relative 18
O and 16
O abundances for the precipitate were determined using a GVI Isoprime Mass Spectrometer
coupled to a Hekatech High Temperature Furnace and a Euro Vector Elemental Analyzer.
δ34
SSO4 values are reported in ‰ units against the primary reference scale of Vienna-Canyon
Diablo Troilite meteorite (VCDT), with an analytical precision of 0.3‰. δ18
OSO4 is reported
relative to VSMOW, with analytical precision of 0.5‰.
5. RESULTS
Geochemical and isotopic results for mine plant, basin, and well waters are summarized in Table
1. Two wells that are classified as background waters, Monitoring Well 9 located west of the
basin in the Slow Creek watershed, and Monitoring Well 10 located to the east in the Sand River
watershed, were sampled in October 2012. These background waters have low SO42-
concentrations, 0.1 and 11 mg/L, respectively. Cl- and Br
- concentrations measured at these
wells are also quite low, 0.4 and 1.4 mg/L for Cl- and 0.01 and 0.02 mg/L for Br
-. In comparison,
concentrations in Tailings Basin Cell 1 are much higher, with and average SO42-
of 970.5 mg/L,
Cl- of 159.3 mg/L, and Br
- of 1.2 mg/L. With the exception of Line 3 scrubber blowdown water,
other process waters have concentrations similar to the basin waters. Seeps, wells and
downstream sites have concentrations falling in between the background wells and the
basin/process water values.
Water isotope values range from approximately -10‰ to -4‰ for δ18
OH2O and -75‰ to -50‰ for
δ2HH2O. Tailings basin waters are relatively enriched in the heavy isotopes as they have been
subject to a larger degree of evaporation than precipitation or fresh groundwater recharge
sources. The average δ18
OH2O of Minntac’s Tailings Basin Cell 1 is -4.9‰, compared to mean
annual precipitation in the area, -10.7‰. The background wells are both more depleted in 18
O,
both plotting close to the GMWL itself with isotopic values that suggest they are recharged

Final Report
12
mainly by warm season (May-Oct) precipitation. Seepage collection waters along with mine-
impacted wells and downstream locations fall along the evaporative trend in between the
evaporation-impacted basin water and the recharge water. Relative contributions of the two end
members can be determined for each site using isotope mass balance calculations. Line 3
scrubber blowdown water is more enriched in the heavy isotopes than all other waters, with
average δ18
OH2O and δ2HH2O of +1.8‰ and -42.6‰, respectively
The δ34
S and δ18
O of dissolved sulfate also vary widely depending on the type of water and
location. Monitoring Well 9, one of the background sites, has very low SO42-
concentrations (<1
mg/L) which prohibited isotopic analysis of sulfate. The other background well, Monitoring
Well 10, had a measured sulfate concentration of 11 mg/L and a δ34
SSO4 value of +7.1‰ and a
δ18
O value of +11.1‰. The isotopic signature of the background well is similar to background
sulfate measured elsewhere in the region. Plant waters cluster between +7‰ and +8.6‰, with
average Tailing Basin Cell 1 water δ34
SSO4 and δ18
OSO4 of +8.3‰ and +0.1‰, respectively.
Average Mountain Iron Pit δ34
SSO4 is +5.8‰ and average δ18
OSO4 is -6.8‰. Mine influenced
wells, seeps, and downstream waters are characterized by more positive isotopic values, ranging
between +10.7‰ and +24.1‰ for δ34
SSO4 and between -2.7‰ and +7.6‰. Increasingly positive
δ34
SSO4 is generally accompanied by more positive δ18
OSO4 values.
6. DISCUSSION
6.1. Dilution
Solute concentrations downgradient of the Minntac tailings basin generally fall in between those
in the tailings basin pool waters and those measured at background wells. Intermediate values
suggest that as water flows away from the basin, seepage is mixing with precipitation and/or
uncontaminated groundwater. Water and chemical balance models often rely solely upon
hydrological parameters to estimate fresh water infiltration, many of which are hard to attain.
Alternatively, we can measure the dilution of the contaminated waters using different
geochemical techniques. Each method is associated with its own limitations, but the inclusion of
geochemical information can lead to a more accurate representation of how the mine signal is
diluted along its flow path.
Certain chemical species are considered non-reactive and are therefore often used as
conservative tracers. Measured concentrations of the conservative chloride (Cl-) and bromide
(Br-) ions, for example, can provide information on water movement and dilution.
Concentrations of these species are considerably elevated in Minntac pool and process waters
relative to nearby background waters, likely due to the grinding and addition of fluxstone
(marine dolomite, limestone) during pellet production (Engesser, 2006). The concentration of
Cl- and Br
- in surface, seep, and well water samples can be compared to basin waters to calculate
the effect of dilution during transport.

Final Report
13
Chloride and bromide concentrations measured in the Minntac Tailings Basin and the
surrounding seep, monitoring well, and downstream sites correlate well, as demonstrated in
Figure 4. The strong correlation substantiates the conservative nature of the two dissolved
constituents. As a result, there is a good agreement between Cl- and Br
--based dilution estimates
for the seep and well waters (Table 2), which range from about 5% to 47%. The Cl--based
dilution estimates tend to be slightly higher, particularly at PZ12, though the magnitude of these
differences would have only minor implications for subsequent interpretations
Chloride and bromide dilution estimates, however, are made with the assumption that the initial
concentrations are equal to the average of tailings basin waters sampled in 2011 and 2012 by the
MN DNR. If the residence time for the water is long, on the order of decades, this may not be
accurate as concentrations of both species have increased over time since flux pellet production
began in 1986. If we are able to determine the amount of dilution using alternative means, we
can assess the initial concentration assumption. To these ends, we also calculated dilution using
isotope mass balance techniques. Using the isotope-derived estimates, we can then calculate
starting basin water Cl- concentrations for waters collected from each well, accounting for the
fact that the chemical composition of basin return water has changed over time. A lower than
present initial basin Cl- concentration would qualitatively indicates a longer residence time.
The Tailings Basin Cell 1 pool is impacted by long-term evaporation (~35%, see Figure 5; Kelly
and Berndt, 2013a) and thus enriched in the heavy isotopes of both oxygen and hydrogen, in
addition to having elevated concentrations of SO42-
, Cl-, and Br
-, when compared to background
waters (see Table 1). In this scenario, we consider Cell 1 to be the mine impacted end member,
called End Member #1 (see Figure 5), with a δ18
OH2O of -4.9‰ and a δ2HH2O of -53.8‰. There
are two options for opposing end members, one being the average basin recharge, which is
represented by the intersection of the LEL with the GMWL and labeled as End Member #2
(Figure 5). The δ18
OH2O of End Member #2 is -11.7‰ and the δ2HH2O is -84.0‰, similar to local
MAP. The seepage collection waters, Mountain Iron Pit, and Monitoring Well 8, appear to fall
on a trend between End Member #1 (Cell 1) and End Member #2 (LEL Recharge).
Alternatively, End Member #3, which represents the average isotopic composition of
background wells 9 and 10, might be a more appropriate choice for a mixing line for a number of
the well locations. The background water composition suggests that groundwater at the
background wells is recharged mainly from warm season precipitation, with average δ18
OH2O = -
9.6‰ and δ2HH2O = -68.3‰. This would be the case if winter snowfall did not infiltrate into the
groundwater. The majority of well waters fall on or near the trend between End Member #1
(Cell 1) and End Member #3 (Background Recharge). Seepage collection and Pit waters, on the
other hand, fall on the LEL recharge trend because they collect winter precipitation and annual
snow melt in addition to the precipitation that falls during the warmer months.
For each well, we apply a mass balance to calculate the relative contribution of the two source
end members, indicating how much dilution of basin water by either recharge waters has
occurred. The estimates using both isotope end member methods are listed in Table 2. If an
Final Report
14
unsuitable recharge end member is used, the calculations may give a starting Cl- concentration
that is unreasonably high. This is apparent, for example, when Background Recharge is used as
an End Member for the seepage pump back calculations. By considering all of the evidence, we
can rule out any anomalous results and determine which method(s) are likely the most accurate
representations of true dilution at each particular sampling location. These carefully determined
“best estimates” are emphasized in bold face in Table 2 and retained for use in additional
calculations.
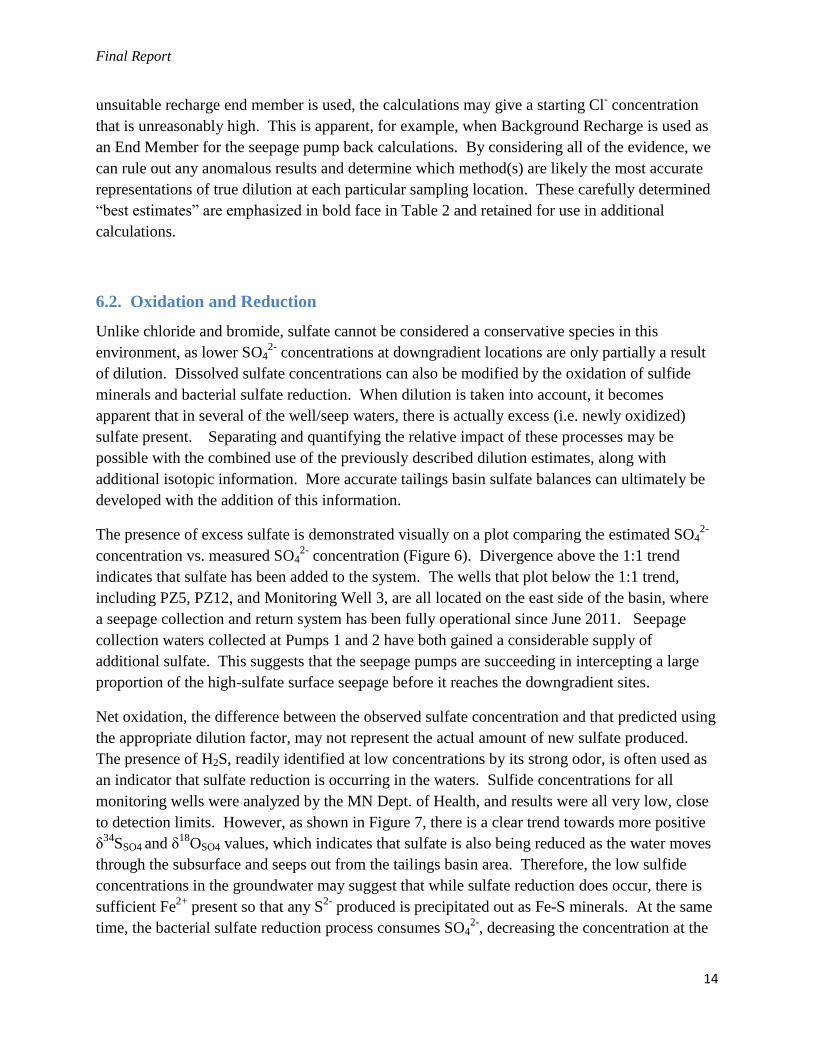
6.2. Oxidation and Reduction
Unlike chloride and bromide, sulfate cannot be considered a conservative species in this
environment, as lower SO42-
concentrations at downgradient locations are only partially a result
of dilution. Dissolved sulfate concentrations can also be modified by the oxidation of sulfide
minerals and bacterial sulfate reduction. When dilution is taken into account, it becomes
apparent that in several of the well/seep waters, there is actually excess (i.e. newly oxidized)
sulfate present. Separating and quantifying the relative impact of these processes may be
possible with the combined use of the previously described dilution estimates, along with
additional isotopic information. More accurate tailings basin sulfate balances can ultimately be
developed with the addition of this information.
The presence of excess sulfate is demonstrated visually on a plot comparing the estimated SO42-
concentration vs. measured SO42-
concentration (Figure 6). Divergence above the 1:1 trend
indicates that sulfate has been added to the system. The wells that plot below the 1:1 trend,
including PZ5, PZ12, and Monitoring Well 3, are all located on the east side of the basin, where
a seepage collection and return system has been fully operational since June 2011. Seepage
collection waters collected at Pumps 1 and 2 have both gained a considerable supply of
additional sulfate. This suggests that the seepage pumps are succeeding in intercepting a large
proportion of the high-sulfate surface seepage before it reaches the downgradient sites.
Net oxidation, the difference between the observed sulfate concentration and that predicted using
the appropriate dilution factor, may not represent the actual amount of new sulfate produced.
The presence of H2S, readily identified at low concentrations by its strong odor, is often used as
an indicator that sulfate reduction is occurring in the waters. Sulfide concentrations for all
monitoring wells were analyzed by the MN Dept. of Health, and results were all very low, close
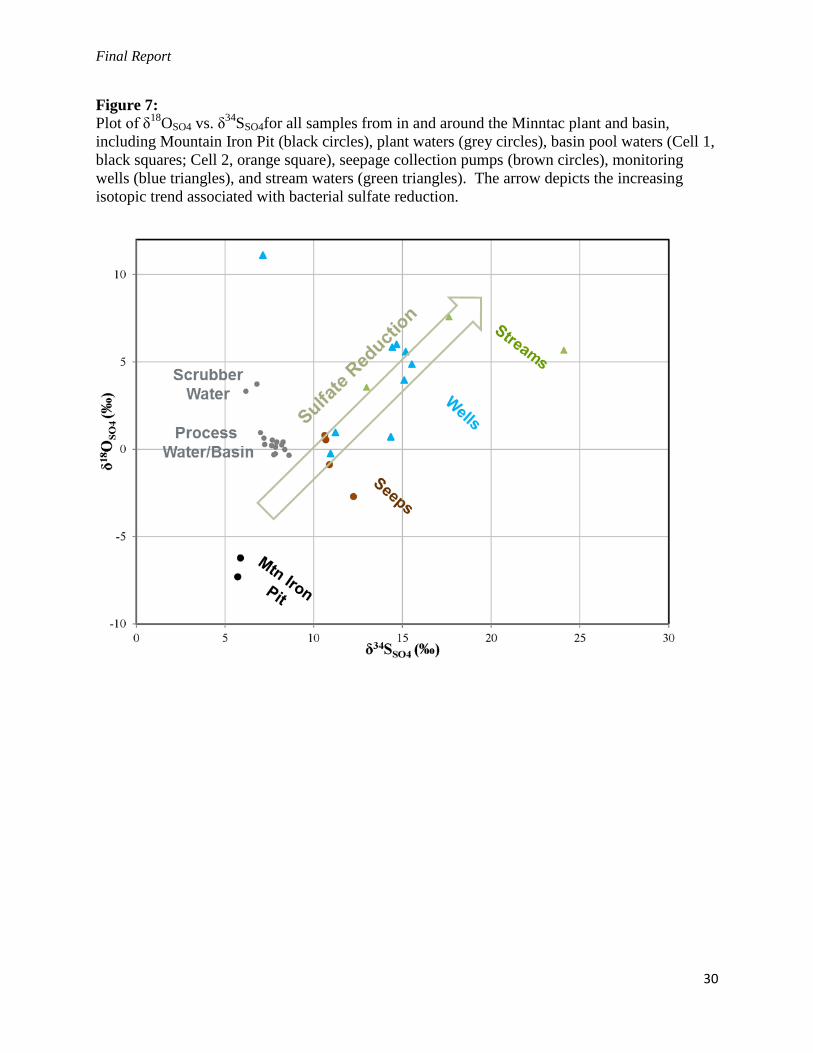
to detection limits. However, as shown in Figure 7, there is a clear trend towards more positive
δ34
SSO4 and δ18
OSO4 values, which indicates that sulfate is also being reduced as the water moves
through the subsurface and seeps out from the tailings basin area. Therefore, the low sulfide
concentrations in the groundwater may suggest that while sulfate reduction does occur, there is
sufficient Fe2+
present so that any S2-
produced is precipitated out as Fe-S minerals. At the same
time, the bacterial sulfate reduction process consumes SO42-
, decreasing the concentration at the

Final Report
15
downstream sites beyond what is expected from dilution alone. Net oxidation in this situation
would tend towards underestimating the actual gross amount of sulfate being added to the
waters.
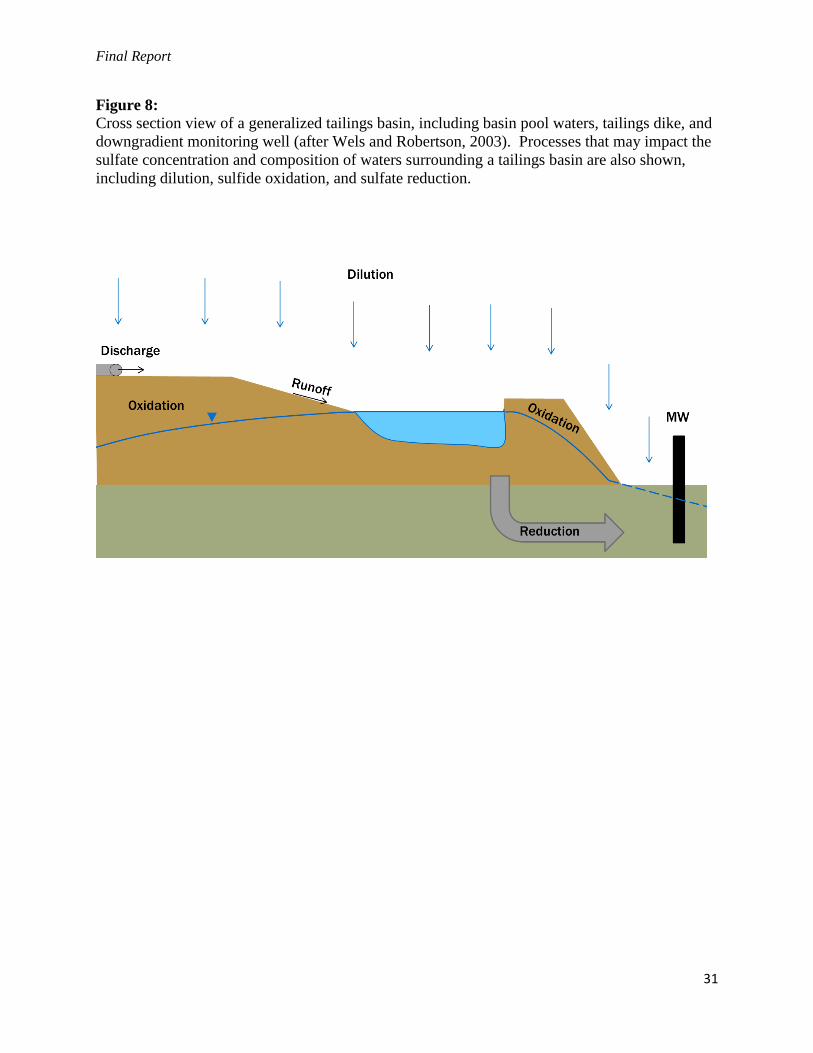
A combination of the above processes can affect the sulfate balance in and around a tailings
basin, as pictured in Figure 8. To review, these include (1) dilution as precipitation infiltrates
and mixes with mine impacted seepage, (2) oxidation of sulfides in tailings dike around the
basin, adding new SO42-
to the balance, and (3) reduction of sulfate in the subsurface, removing a
portion of the SO42-
from the balance and trapping it as Fe-sulfide minerals. We can
simultaneously solve for the relative contribution of these processes using the relevant isotopic
mass balance and Rayleigh equations. Results of this exercise are shown in Table 3.
It is important to note that several assumptions are necessary when making these calculations.
To begin, we assume that the addition of new sulfate occurs prior to the sulfate reduction.
Second, we need to assign a δ34
SSO4 value for the new sulfate generated in the tailings basin.
Previously reported δ34
SSO4 values for Minntac East and West Pit waters fall within the range of
results from other mine pit waters in the central portion of the range (Figure 2), consistent with
the derivation from the oxidation of primary sulfide minerals in the iron formation. We consider
the average of this data, which is +7.7‰, to be the composition of “new” sulfate added to the
system resulting from the oxidation of primary sulfide minerals in the tailings. Finally, we
assume that the sulfur isotope fractionation effect during sulfate reduction is 17‰, as mentioned
previously.
Our calculations show that the relative amounts of oxidation and reduction vary around the
basin. Except for PZ5 and PZ12, which fall downgradient of the seepage collection and return
system, a considerable amount of newly formed sulfate is present. The largest estimated amount
of oxidation, other than the seepage waters, is calculated for Monitoring Well 8 on the southwest
side of the basin at just under 600 mg/L of additional sulfate. Sulfate reduction estimates at the
well sites surrounding the basin generally range between ~150-400 mg/L. This translates to a
reduction of ~15-30% of the total sulfate pool, which includes both the “old” sulfate seeping
from the basin cell waters and the “new” sulfate from the oxidation of sulfide minerals in
tailings. Spatial variability in sulfate reduction around the basin may relate to a combination of
factors, including sulfate concentration, seepage rate, quality and availability of organic matter,
variability in bacterial community, etc. On the east side of the basin, it appears that on average
about 1/3 of the total sulfate pool is reduced and precipitated out as sulfide minerals. This is a
particularly timely and important realization, as groundwater measured at PZ12 is currently
flagged as exceeding Minnesota’s drinking water sulfate standard of 250 mg/L. Work is being
carried out to determine how best to reduce sulfate concentrations at this site. It is clear from
isotope results that dilution of the high-sulfate basin water is only partially responsible for the
concentration of sulfate measured in groundwater surrounding the basin. It is critical that
oxidation of sulfide minerals in tailings and sulfate reduction are also considered in model
development.
Final Report
16
We tested the sensitivity of our oxidation and reduction calculations for each well using ε = +10,
+17, and +25‰. Estimates appear to be most sensitive to a decrease in the fractionation effect.
When a smaller fractionation effect value is used, a larger percentage of the total sulfate pool
needs to be reduced in order to produce the required change in isotopic composition. Calculated
values for both new sulfate produced and sulfate lost to reduction are much larger than the
original estimates, up to and additional ~400 mg/L for each. As we would expect, using a higher
value for the fractionation effect instead yields lower oxidation and reduction estimates. The
differences, however, are not so large that they are unrealistic or qualitatively change the
interpretations. We consider the original 17‰ value to be a sound choice in this case, but a
slightly higher value may also be appropriate.
7. SUMMARY AND FUTURE WORK
A chemical and isotopic investigation of the Minntac Tailings Basin has shown that natural
dilution of the high solute waters, oxidation of sulfide minerals within the tailings dike, and
bacterial sulfate reduction in the subsurface are all important factors controlling the
concentration of sulfate in well waters surrounding the basin. The latter two processes are often
unaccounted for, as it is difficult to attain quantifiable estimates without the aid of isotopic
measurements. For the first time, we can assign values to each of the three processes for the seep
and well sites studied here. Additional work, however, may improve the accuracy of our
estimates. Berndt (2011) developed a “framework model” to describe the isotopic evolution of
dissolved sulfate with progressive sulfate reduction in the St. Louis River Watershed, using
similar assumptions applied here for the oxidation and reduction calculations. Ongoing efforts
are in place to refine aspects of the framework, including the fractionation effect associated with
sulfate reduction as well as the initial composition of mineland sulfate. At the Minntac site, we
may be able to further address the initial composition assumption through a direct examination of
sulfide δ34
S in Minntac tailings core samples. The Minntac Tailings Basin investigation would
also benefit from seasonal water isotope sampling to determine variability over the course of a
year and to better pinpoint dilution end members, improving both our dilution and oxidation
calculations. Additional sampling downstream on both the Dark and Sand Rivers, including
flow data, would expand our ability to determine average basin seepage accounting for the
processes detailed in this report. While these measures would be valuable to the Minntac tailings
basin investigation, we may also learn a great deal by expanding this work to other mining
operations in the area. This would enable us to better characterize sulfate behavior in seepage
waters from a diverse group of settings.
Final Report
17
8. ACKNOWLEDGEMENTS
The work described in this report was funded by the Minnesota DNR’s Iron Ore Cooperative
Research and Environmental Cooperative Research programs. Benjamin Von Korff and
Katherine Rasley of the MN DNR helped with sample processing. We would like express our
thanks to Minntac for cooperating with this research effort, particularly Tom Moe who facilitated
and assisted with sample collection.
9. REFERENCES
Balci, N., Shanks III, W. C., Mayer, B., and Mandernack, K. W., 2007. Oxygen and sulfur
isotope systematics of sulfate produced by bacterial and abiotic oxidation of pyrite. Geochimica
et Cosmochimica Acta 71, 3796-3811.
Bavin, T., and Berndt , M., (2013) A Geochemical Mass Balance Method for Estimated Water
and Sulfate Balances at Mining Facilities. A MWRAP 1 Interim Report, Minnesota Department
of Natural Resources
Berndt, M.E., 2011. An interpretive framework for δ34
SSO4 and δ18
OSO4 in water samples from
the St. Louis River Basin, in: Resources, M.D.o.N. (Ed.), Minnesota Department of Natural
Resources Memo, 6 pages,
Berndt, M.E., Bavin, T.K., 2011. Sulfur and Mercury Cycling in Five Wetlands and a Lake
Receiving Sulfate from Taconite Mines in Northeastern Minnesota: A Report to Iron Ore
Cooperative Research Program., in: Resources, M.D.o.N. (Ed.). Minnesota Department of
Natural Resources, Division of Lands and Minerals, St. Paul, MN, p. 77.
Berndt, M.E., Bavin, T.K., 2012. On the cycling of sulfur and mercury in the St. Louis River
watershed, Northeastern Minnesota. An Environmental and Natural Trust Fund Report,
Minnesota Department of Natural Resources, St. Paul, MN, 91 pages.
Bowen, G. J., 2013. The Online Isotopes in Precipitation Calculator, version 2.2.
http://www.waterisotopes.org.
Bowen G. J. and Revenaugh J., 2003. Interpolating the isotopic composition of modern meteoric
precipitation. Water Resources Research 39(10), 1299, doi:10.129/2003WR002086. (for annual
average values)
Bowen G. J., Wassenaar L. I. and Hobson K. A., 2005. Global application of stable hydrogen
and oxygen isotopes to wildlife forensics. Oecologia 143, 337-348, doi:10.1007/s00442-004-
1813-y. (for monthly average values)

Final Report
18
Brüchert, V., Knoblauch, C., and Jorgensen, B. B., 2001. Controls on stable sulfur isotope
fractionation during bacterial sulfate reduction in Arctic sediments. Geochimica et
Cosmochimica Acta 65, 763-776.
Canfield, D. E., and Teske, A., 1996. Late Proterozoic rise in atmospheric oxygen concentration
inferred from phylogenetic and sulphur-isotope studies. Nature 382, 127-132.
Canfield, D. E., 2001. Biogeochemistry of sulfur isotopes. In: Valley,J.W., Cole, D.R. (Eds.),
Reviews in Mineralogy and Geochemistry, vol. 43. Mineralogical Society of America,
Blacksburg, VA, p. 607–636.
Carmody, R. W., Plummer, L. N., Busenberg, E., Coplen, T. B., 1998. Methods for collection of
dissolved sulfate and sulfide and analysis of their sulfur isotopic composition. U.S. Geological
Survey Open-File Report 97-234.
Carrigan and Cameron, 1991. Petrological and stable isotope studies of carbonate and sulfide
minerals from the Gunflint Formation, Ontario: evidence for the origin of early Proterozoic iron-
formation. Precambrian Research 52, 347-380.
Chapelle, F. H., Bradley, P. M., Thomas, M. A., McMahon, P. B., 2009. Distinguishing iron-
reducing from sulfate-reducing conditions. Ground Water 47, 300-305.
Clark, I., Fritz, P., 1997. Environmental isotopes in hydrogeology. CRC Press/Lewis
Publishers, Boca Raton, FL, p. 328.
Craig, H., 1961. Isotopic variations in meteoric waters. Science 133, 1702-1703.
Detmers, J., Brüchert, V., Habicht, K. S., Kuever, J., 2001. Diversity of sulfur isotopes
fractionations by sulfate-reducing prokaryotes. Applied and Environmental Microbiology 67(2),
888-894.
Engesser, J., 2006. Evaluation of Minnesota Taconite Wet Scrubbers at Minntac, Keewatin
Taconite, Hibbing Taconite, and United Taconite. Minnesota Department of Natural Resources,
St. Paul, MN, 15 pages.
Gibson, J. J., Edwards, T. W. D., Bursey, G. G., Prowse, T. D., 1993. Estimating Evaporation
using stable isotopes: Quantitative results and sensitivity analysis for two catchments in northern
Canada. Nordic Hydrology 24, 79-94.
Heitmann, T., Blodau, C., 2006. Oxidation and incorporation of hydrogen sulfide by dissolved
organic matter. Chemical Geology 235, 12-20.
Johnson, N. W., and Zhu, X., 2012. Carbon and iron additions to stimulate in-pit sulfate
reduction and removal. University of Minnesota Duluth Research Report. 35 pages.

Final Report
19
Johnston, D.T., Poulton, S.W., Fralick, P.W., Wing, B.A., Canfield, D.E., Farquhar, J., 2006.
Evolution of the oceanic sulfur cycle at the end of the Paleoproterozoic. Geochimica et
Cosmochimica Acta 70, 5723-5739.
Kelly, M. J., and Berndt, M. E., 2013a. A Water Isotope-Based Evaporation Model for US
Steel’s Minntac Tailings Basin. Minnesota Department of Natural Resources Memo, 12 pages.
Kelly, M. J., and Berndt, M. E., 2013b. An updated isotopic analysis of sulfate cycling and
mixing processes in the St. Louis River Watershed. Minnesota Department of Natural Resources
Memo, 22 pages.
Kleikemper, J., Schroth, M.H., Bernasconi, S. M., Brunner, B., and Zeyer, J., 2004. Sulfur
isotope fractionation during growth of sulfate-reducing bacteria on various carbon sources.
Geochimica et Cosmochimica Acta 68, 4891-2904.
Kohl, Issaku, and Bao, Huiming, 2011. Triple-oxygen-isotope determination of molecular
oxygen incorporation in sulfate produced during abiotic pyrite oxidation (pH=2-11).
Geochimica et Cosmochimica Acta 75, 1785-1798.
Moses, C. O., Nordstrom, D. K., Herman, J. S., and Mills, A. L., 1987. Aqueous pyrite oxidation
by dissolved oxygen and by ferric iron. Geochimica et Cosmochimica Acta 51, 1561-1571.
Moyle, J., 1956. Relationships between water chemistry of Minnesota surface waters and
wildlife management. Journal of Wildlife Management 30, 303-320.
Müller, I. A., Brunner, B., and Coleman, M., 2013. Isotopic evidence of the pivotal role of
sulfite oxidation in shaping the oxygen isotope signature of sulfate. Chemical Geology 351, 186-
202.
Poulton, S.W., Fralick, P.W., Canfield, D.E., 2010. Spatial variability in oceanic redox structure
1.8 billion years ago. Nature Geoscience 3, 486-490.
Rimstidt, J. D., and Vaughan, D. J., 2003. Pyrite oxidation: A state-of-the-art assessment of the
reaction mechanism. Geochimica et Cosmochimica Acta 67, 873-880.
Sim, M. S., Bosak, T., and Ono, S., 2011a. Large sulfur isotope fractionation does not require
disproportionation. Science 333, 74-77.
Sim, M. S., Ono, S., Donovan, K., Templer, S. P., and Bosak, T., 2011b. Effect of electron
donors on the fractionation of sulfur isotopes by a marine Desulfovibrio sp. Geochimica et
Cosmochimica Acta 75, 4244-4259.
Taylor, B. E., Wheeler, M. C., Nordstrom, D. K. 1984. Isotope composition of sulphate in acid
mine drainage as measure of bacterial oxidation. Nature 308, 538-541.
Final Report
20
Theriault, S. A., Miller, J. D., Berndt, M. E., and Ripley, E. M., 2011. The mineralogy, spatial
distribution, and isotope geochemistry of sulfide minerals in the Biwabik Iron Formation.
Institute for Lake Superior Geology, Abstract.
Theriault, S.A., 2011. Mineralogy, Spatial Distribution, and Isotope Geochemistry of Sulfide
Minerals in the Biwabik Iron Formation, Geology. University of Minnesota, 165 p.
Toran, L., and Harris, R. F., 1989. Interpretation of sulfur and oxygen isotopes in biological and
abiological sulfide oxidation. Geochimica et Cosmochimica Acta 53, 2341-2348.
Van Stempvoort, D. R., and Krouse, H. R., 1994. Controls of δ18
O in sulfate. Review of
experimental data and application to specific environments. American Chemical Society 446-
480.
Wels, C., and Robertson, A.M., 2003. Conceptual model for estimating water recovery in
tailings impoundments. Tailings and Mine Waste: Proceedings of the Ninth International
Conference, Vail, CO. Colorado State University, January 27-30, 2002. 459-468.

Final Report
21
Table 1:
Geochemical and isotopic results for Minntac Waters collected in 2011 and 2012.
Site Description
Date
Collected
Cl-
(mg/L)
Br-
(mg/L)
SO42-
(mg/L)
δ18OH2O
(‰VSMOW)
δ2HH2O
(‰VSMOW)
δ34SSO4
(‰VCDT)
δ18OSO4
(‰VSMOW)
Mountain. Iron Pit 12/7/2011 28.6 0.10 349 -9.8 -72.8 5.7 -7.3
Scrubber Makeup Water
167.8 1.20 996 -5.8 -54.4 8.6 -0.3
Line 5, Thickener Input
207.6 1.32 1044 -5.4 -55.7 8.3 0.4
Lines 6 and 7, Thickener Input 243.7 1.56 1110 -5.1 -55.2 7.9 0.3
Steps 1 and 2 Fine Tails
181.2 1.28 1008 -5.5 -55.7 7.8 -0.3
Step 3 Fine Tails
191.2 1.38 1021 -5.3 -54.9 7.8 0.1
Line 3 Blowdown
859.1 4.59 2446 2.2 -43.9 6.8 3.7
Tailings Basin Cell 1 Return Water 169.6 1.21 1008 -5.0 -56.4 8.4 0.0
East Seep; Pump 2; Catch Basin 10 104.2 0.74 1006 -7.1 -64.9 10.9 -0.9
East Seep; Pump 1; Catch Basin 5 135.6 0.95 950 -6.1 -61.6 10.6 0.8
Sand River at Hwy 53
43.8 0.24 212 -8.2 -68.2 17.6 7.6
Mountain. Iron Pit 9/12/2012 28.0 0.11 312 -9.5 -74.7 5.9 -6.2
Scrubber Makeup Water
138.2 1.03 868 -5.2 -53.4 7.6 0.2
Lines 4 and 5, Thickener Input 165.7 1.19 936 -4.5 -51.4 7.7 0.5
Lines 6 and 7, Thickener Input 170.1 1.25 1058 -4.3 -52.5 7.2 0.6
Steps 1, 2, and 3 Fine Tails 171.8 1.32 893 -5.0 -53.0 7.8 -0.3
Step 2 Agglomerator Process Water 171.5 1.30 1030 -4.6 -52.2 7.0 0.9
Step 1 Agglomerator Process Water 165.7 1.23 946 -4.7 -51.9 7.2 0.3
Line 3 Blowdown
842.0 4.89 2303 1.5 -41.3 6.2 3.3
Tailings Basin Cell 2
142.1 1.08 914 -4.8 -50.0 7.9 0.4
Tailings Basin Cell 1 Return Water 148.9 1.12 933 -4.8 -51.2 8.2 0.2
East Seep; Pump 2; Catch Basin 10 88.4 0.68 1121 -8.0 -68.4 12.2 -2.7
East Seep; Pump 1; Catch Basin 5 138.5 1.05 1031 -6.5 -62.1 10.7 0.5
PZ5
147.8 1.14 742 -5.4 -54.8 14.4 5.8
PZ12
101.1 0.83 479 -6.2 -58.4 15.2 5.6
Sand River at Hwy 53
25.4 0.06 36 -6.6 -60.0 24.1 5.7
Dark River at CR 668
85.7 0.60 710 -6.1 -55.2 13.0 3.5
Well 3 10/25/2012 132.1 0.98 750 -6.6 -59.0 14.7 6.0
Well 4
75.5 0.61 481 -7.3 -60.5 14.3 0.7
Well 6
105.0 0.78 825 -6.6 -60.2 10.9 -0.2
Well 7
118.7 0.91 872 -6.9 -60.1 11.2 1.0
Well 8
73.3 0.54 755 -8.0 -66.0 15.1 4.0
Well 9
0.4 0.01 0 -9.4 -68.7
Well 10
1.4 0.02 11 -9.7 -67.9 7.1 11.1
PZ12 100.5 0.82 449 -6.3 -56.3 15.5 4.9

Final Report
22
Table 2:
All dilution estimates for seep and wells measured in 2011 and 2012. See text and Figure 5 for
additional information regarding the isotope end members. The estimates that are used in the
oxidation and reduction calculations are indicated in bold font.
Dilution Estimate (%)
Site Description Date
Collected Bromide
Chloride
Isotope – End
Member #2
Isotope – End
Member #3
E Seep Pump 2 12/7/2011 36.7 34.6 34.8 62.1
E Seep Pump 2 9/12/2012 41.9 44.5 47.1 83.7
E Seep Pump 1 12/7/2011 18.6 14.9 22.0 40.1
E Seep Pump 1 9/12/2012 9.4 13.0 25.5 45.8
PZ5 9/12/2012 2.1 7.2 5.1 8.4
PZ12 9/12/2012 28.8 36.6 17.2 29.8
PZ12 10/25/2012 29.8 36.9 14.7 23.9
Well 3 10/25/2012 15.7 17.1 20.9 35.7
Well 4 10/25/2012 47.4 52.6 28.9 49.0
Well 6 10/25/2012 32.6 34.1 23.1 40.2
Well 7 10/25/2012 21.5 25.5 25.2 43.3
Well 8 10/25/2012 54.0 54.0 43.2 75.5

Final Report
23
Table 3:
Estimates for the fraction of sulfate added and fraction lost to reduction (in % and mg/L), using
the best isotope-based dilution estimate (see text and Table 2).
Site Date
Collected
Best Dilution
Estimate (%)
New Sulfate
(%)
Sulfate Reduced
(%)
New Sulfate
(mg/L)
Sulfate Reduced
(mg/L)
E Seep Pump 2 12/7/2011 34.8 46.8 15.5 557 184
E Seep Pump 2 9/12/2012 47.1 64.4 22.3 929 321
E Seep Pump 1 12/7/2011 22.0 31.2 13.6 343 150
E Seep Pump 1 9/12/2012 25.5 39.9 14.2 479 170
PZ5 9/12/2012 8.4 16.7 30.4 178 325
PZ12 9/12/2012 29.8 4.9 33.1 35 237
PZ12 10/25/2012 23.9 -8.1 34.2 -56 233
Well 3 10/25/2012 20.9 30.0 31.7 330 348
Well 4 10/25/2012 49.0 28.4 30.4 196 210
Well 6 10/25/2012 40.2 40.6 15.6 397 152
Well 7 10/25/2012 25.2 30.6 16.6 320 174
Well 8 10/25/2012 43.3 51.8 33.9 592 388
Final Report
24
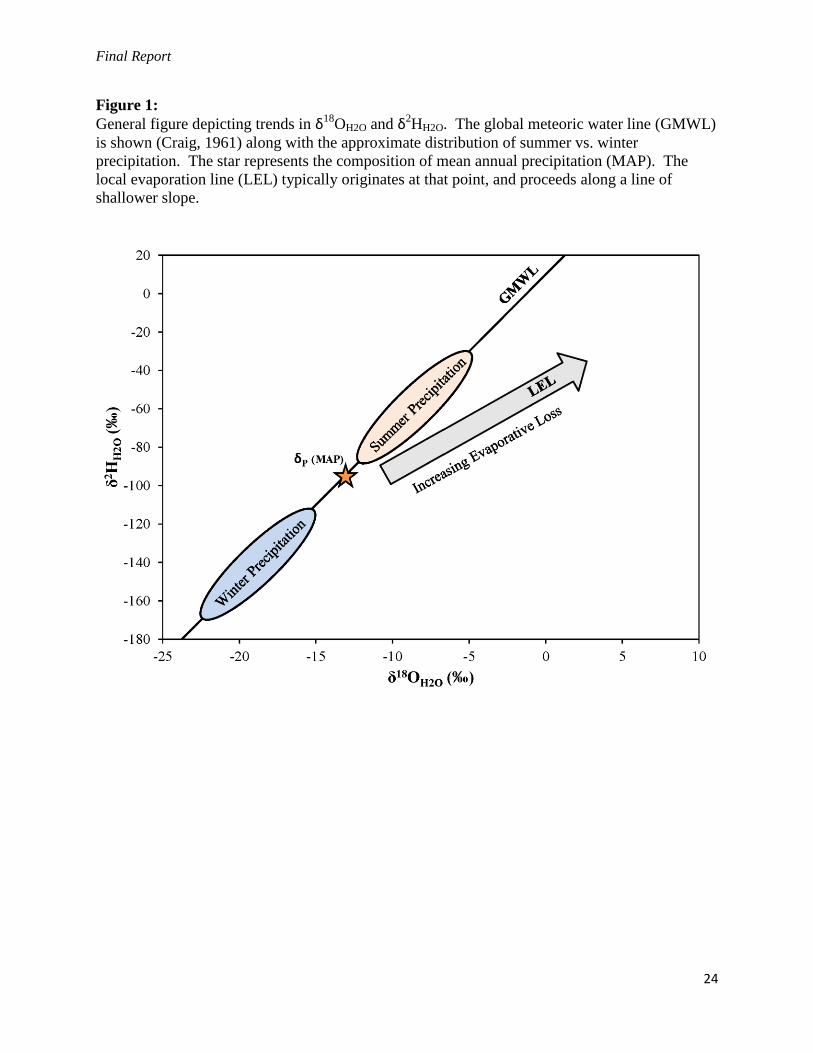
Figure 1:
General figure depicting trends in δ18OH2O and δ2
HH2O. The global meteoric water line (GMWL)
is shown (Craig, 1961) along with the approximate distribution of summer vs. winter
precipitation. The star represents the composition of mean annual precipitation (MAP). The
local evaporation line (LEL) typically originates at that point, and proceeds along a line of
shallower slope.

Final Report
25
Figure 2:
Plot of (A) δ34SSO4 vs. SO4 concentration, and (B) δ18
OSO4 vs. SO4 concentration for mine pit and
discharge waters measured by the DNR over the last several years (Berndt and Bavin, 2012;
unpublished data). Waters with sulfate concentrations ≤130 mg/L are from locations towards the
western end of the Mesabi Iron Range (southwest of the Minntac Basin), and have isotopic
compositions distinct from central-eastern locations.
(A)
(B)
Final Report
26
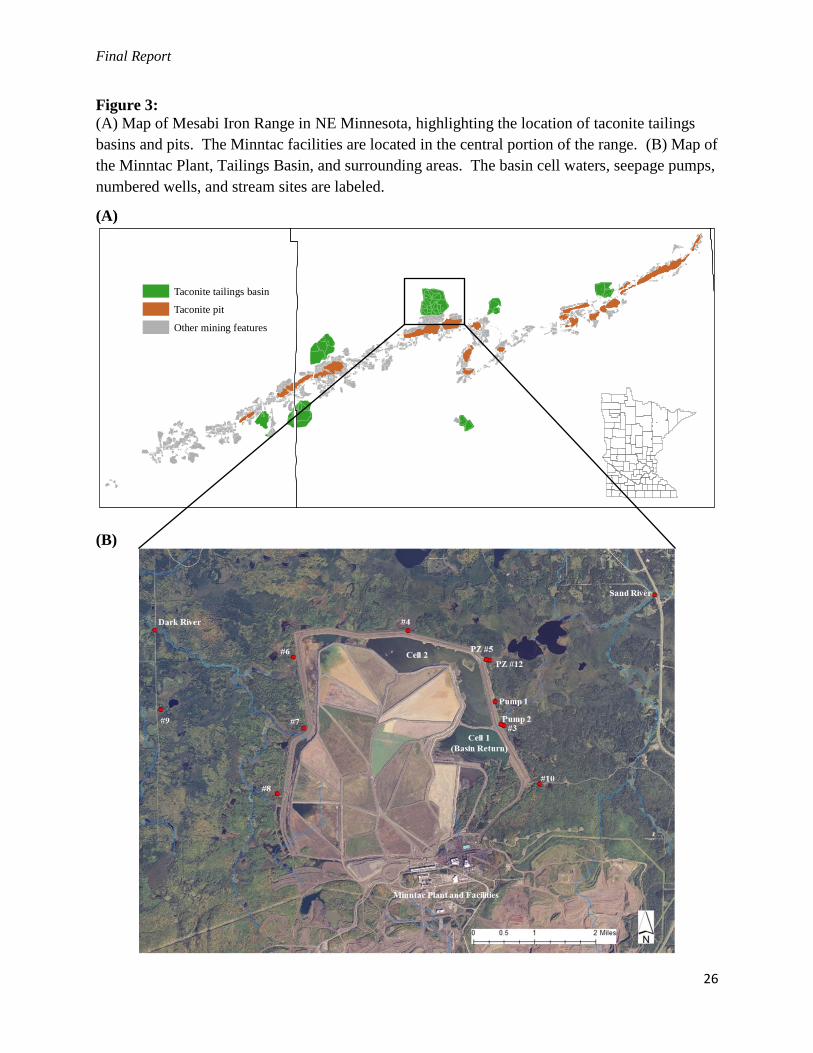
Figure 3:
(A) Map of Mesabi Iron Range in NE Minnesota, highlighting the location of taconite tailings
basins and pits. The Minntac facilities are located in the central portion of the range. (B) Map of
the Minntac Plant, Tailings Basin, and surrounding areas. The basin cell waters, seepage pumps,
numbered wells, and stream sites are labeled.
(A)
(B)
Taconite tailings basin
Taconite pit
Other mining features

Final Report
27
Figure 4:
Chloride vs. bromide concentrations measured in Minntac basin waters (black squares) and all
downgradient locations, including seeps (brown circles), monitoring wells (blue triangles), and
rivers (green triangles). Results are correlate well, with and linear regression R2 value of 0.9732.
Streams Wells Seeps Basin

Final Report
28
Figure 5:
(A) δ2H-δ
18O plot showing data for Minntac Cell 1 Basin Return (black squares) and Mountain
Iron Pit (black circles). Labeled star symbols represent the compositions of Global Meteoric
Water Line (GMWL), Mean Annual Precipitation (MAP), mean May-October precipitation, and
average recharge water. The modeled evaporative trend is shown (grey line), which indicates
that ~35% of basin water is lost to evaporation.
(B) Figure as above along with Minntac plant process waters (grey circles), seeps (brown
circles), wells (blue triangles), and streams (green triangles). Two dilution trends between the
different end members are also shown, as discussed in the text.
Final Report
29
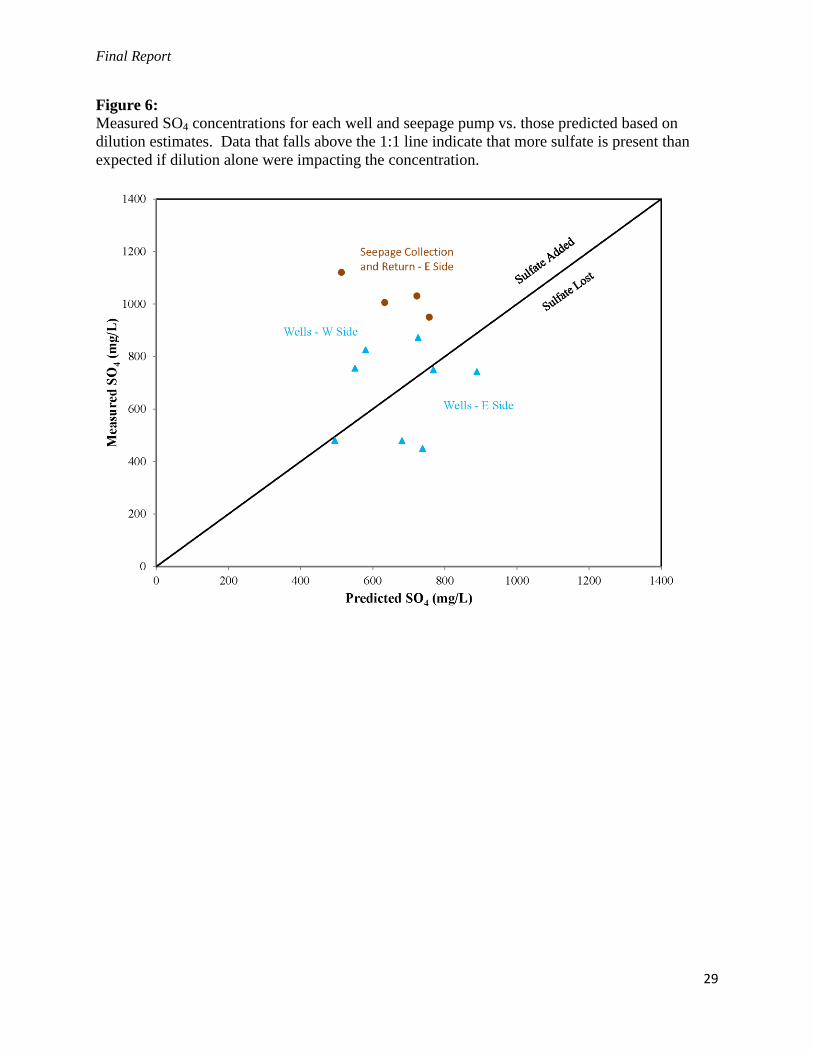
Figure 6:
Measured SO4 concentrations for each well and seepage pump vs. those predicted based on
dilution estimates. Data that falls above the 1:1 line indicate that more sulfate is present than
expected if dilution alone were impacting the concentration.
Final Report
30
Figure 7:
Plot of δ18
OSO4 vs. δ34
SSO4for all samples from in and around the Minntac plant and basin,
including Mountain Iron Pit (black circles), plant waters (grey circles), basin pool waters (Cell 1,
black squares; Cell 2, orange square), seepage collection pumps (brown circles), monitoring
wells (blue triangles), and stream waters (green triangles). The arrow depicts the increasing
isotopic trend associated with bacterial sulfate reduction.
Final Report
31
Figure 8:
Cross section view of a generalized tailings basin, including basin pool waters, tailings dike, and
downgradient monitoring well (after Wels and Robertson, 2003). Processes that may impact the
sulfate concentration and composition of waters surrounding a tailings basin are also shown,
including dilution, sulfide oxidation, and sulfate reduction.