Embed Size (px)
Citation preview
ENDANGERED SPECIES RESEARCHEndang Species Res
Vol. 18: 265–278, 2012doi: 10.3354/esr00448
Published online September 28
INTRODUCTION
Harbour porpoises Phocoena phocoena are theonly cetacean species regularly occurring and re -pro ducing in the Baltic Sea (Scheidat et al. 2008).Porpoises are protected under European legislation,
in particular, by being listed in Annex II and IV ofthe EU Habitats Directive (92/43/EEC; EuropeanUnion 1992). These listings require the creation ofspecial areas of conservation (Art. 6) and the estab-lishment of a system of strict protection for the ani-mal species listed (Art. 12) to maintain or allow
© Inter-Research 2012 · www.int-res.com*These authors contributed equally to the manuscript**Corresponding author. Email: [email protected]
Use of static passive acoustic monitoring to assess the status of the ‘Critically Endangered’
Baltic harbour porpoise in German waters
Anja Gallus 1,*, Michael Dähne1,2,*,**, Ursula Katharina Verfuß1, Stefan Bräger1,4, Sven Adler2,3,5, Ursula Siebert2, Harald Benke1
1German Oceanographic Museum, 18439 Stralsund, Germany2Institute for Terrestrial and Aquatic Wildlife Research (ITAW), University of Veterinary Medicine Hannover, Foundation,
25761 Büsum, Germany3Institute for Biodiversity, University of Rostock, 18057 Rostock, Germany
4Present address: The Whale Museum, Friday Harbor, Washington 98250, USA5Present address: Swedish University of Agricultural Sciences, 90183 Umeå, Sweden
ABSTRACT: Harbour porpoise Phocoena phocoena abundance in the Baltic Proper (BP) is at alevel where measures for improving the status of this genetically and morphologically discretepopulation are urgently needed. Without knowledge on seasonal and geographical distribution, acommon basis for conservation efforts has been lacking for the past decades. We deployed 22 por-poise detectors from March 2005 until August 2007 in the eastern German Baltic Sea to study sea-sonal migrations and abiotic factors associated with porpoise presence/absence patterns. Twoyears of continuous monitoring resulted in 11 890 recording days from 21 stations within the BP,with only 207 porpoise-positive days (ppd — a day with verified porpoise detection), equaling1.86% ppd per month and station over the study period. Data were analysed using generalisedadditive models to find significantly influencing factors. Detection rates in the BP peaked twiceseasonally: once associated with the summer occurrence of animals from the population livingmostly in the Belt Sea and once correlated with (1) cold air temperatures and (2) air temperatureslower than water surface temperatures. The latter suggests that porpoises from the BP migratetowards mostly ice-free waters in winter to avoid suffocation. In order to reduce harmful set-net-ting, conservation measures must be seasonally regulated, at least, or less harmful fishing meth-ods must be implemented. These findings should help to improve the current European anti-by-catch legislation, e.g. regulation EC 812/2004, which is currently under review.
KEY WORDS: Phocoena phocoena · Temporal and spatial distribution · Baltic Sea · Generalizedadditive modelling · Click detector · T-POD
Resale or republication not permitted without written consent of the publisher
Contribution to the Theme Section ‘Beyond marine mammal habitat modeling’ OPENPEN ACCESSCCESS
Endang Species Res 18: 265–278, 2012
them to recover sufficiently to reach a favourableconservation status. Additional obligations for por -poise conservation in the Baltic Sea arise from in -tergovernmental agreements and their porpoiserecovery goals, such as the ‘Jastarnia Plan’ of theAgreement on the Conservation of Small Cetaceansof the Baltic, North East Atlantic, Irish and NorthSeas (ASCOBANS 2009) and HELCOM Recom-mendation 17/2 of the Helsinki Convention (Hel -sinki Commission 1996). Early last century, harbourporpoises occurred within the Baltic Proper (BP),east of the Darß and Limhamn Sill and adjacentwaters (Fig. 1), in fairly high numbers, as indicatedby strandings (Skóra et al. 1988), by-catch in fisheries (Skóra & Kuklik 2003) and direct catch(Kinze 1995). Since the population has declined(reviewed in Koschinski 2001), special measuresare needed to protect this apex predator in a fragileecosystem.
The causes for the decline of harbour porpoises inthe BP are still poorly understood. Possible factorsinclude habitat deterioration due to eutrophication,prey depletion due to over-fishing, severe winterswith freezing of large parts of the BP (Seinä & Palo-suo 1996) and subsequent die-offs (Koschinski 2001),pollution with chemical toxins such as poly chlor -inated biphenyls and heavy metals, ship traffic (Ko -sch inski 2001, Jastarnia Group & Bräger 2009) and —probably most important — non-target by-catch in
bottom-set gill nets and drift nets (Berggren et al.2002, ASCOBANS 2009). The European Commissionattempted to regulate by-catch of small cetaceans ingill nets (EU Council 2004) by making mandatory (1)the use of acoustic deterring devices (such aspingers) to prevent by-catch in gill nets, (2) dedicatedobservers to report cetacean by-catch in specifiedEuropean waters and (3) banning drift nets. Most ofthe Belt Sea and almost all of the BP, except for ICES(International Council for the Exploration of the Sea)Area 24, however, were ex cluded from such meas-ures (1 and 2). The use of pingers may not solve the
problem in low- density areas (Carl-ström et al. 2009), because even verylow by-catch rates will prevent recov-ery of Baltic harbour porpoises (Berg -gren et al. 2002). Construction noiseand anthropogenic noise in generalprobably add a further threat (e.g.Car sten sen et al. 2006).
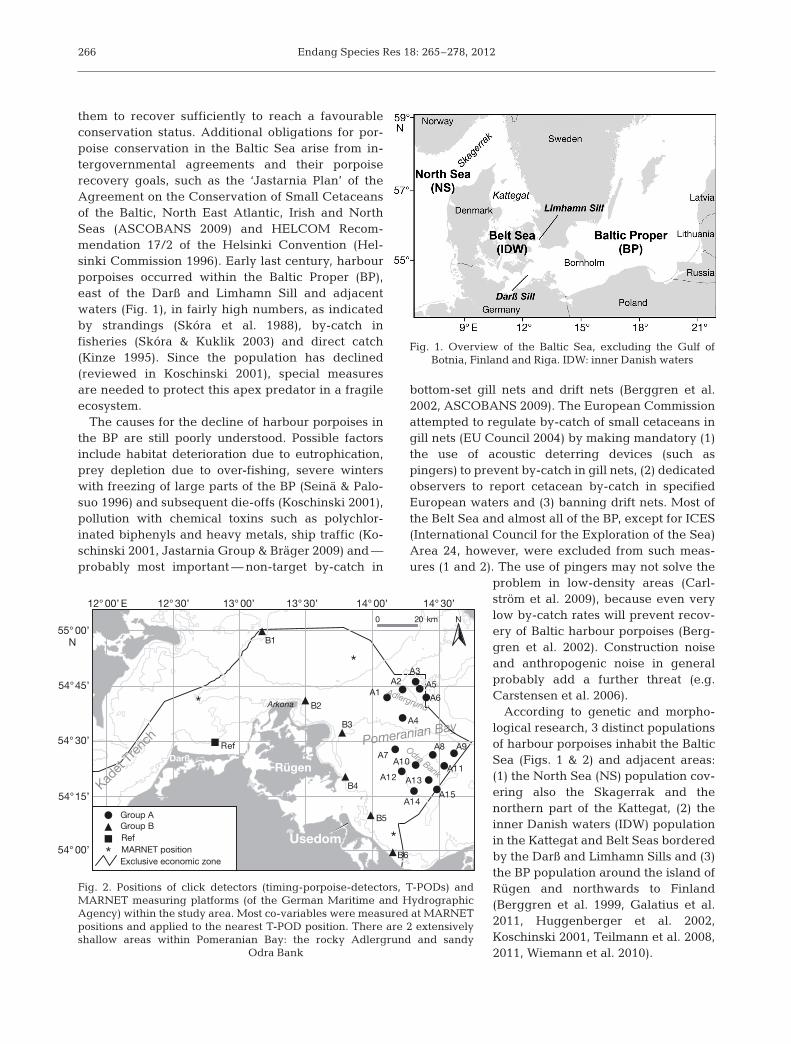
According to genetic and morpho-logical research, 3 distinct populationsof harbour porpoises inhabit the BalticSea (Figs. 1 & 2) and adjacent areas:(1) the North Sea (NS) population cov-ering also the Skagerrak and thenorthern part of the Kattegat, (2) theinner Danish waters (IDW) populationin the Kattegat and Belt Seas borderedby the Darß and Limhamn Sills and (3)the BP population around the island ofRügen and northwards to Finland(Berg gren et al. 1999, Galatius et al.2011, Huggenberger et al. 2002,Kosch inski 2001, Teilmann et al. 2008,2011, Wiemann et al. 2010).
266
Fig. 1. Overview of the Baltic Sea, excluding the Gulf of Botnia, Finland and Riga. IDW: inner Danish waters
j
m
m
m
m
d
ddd
d
d
d
dd
d
dd
dd
d
m
m
*
*
*
12° 00’ E 12° 30’ 13° 00’ 14° 00’ 14° 30’13° 30’
55° 00’N
54°45’
54° 30’
54°15’
54° 00’
0 20 km
Ref
B1
B2
B3
B4
B5
B6
A14A15
A13A11
A9A8
A10
A12
A7
A4
A1A2
A3
A5
A6
Kadet
Tre
nch
N
Usedom
RügenDarß
Adlergrund
Odra Bank
Pomeranian Bay
Group B
Exclusive economic zone
#md Group A
#j RefMARNET position%*
Arkona
Fig. 2. Positions of click detectors (timing-porpoise-detectors, T-PODs) andMARNET measuring platforms (of the German Maritime and HydrographicAgency) within the study area. Most co-variables were measured at MARNETpositions and applied to the nearest T-POD position. There are 2 extensivelyshallow areas within Pomeranian Bay: the rocky Adlergrund and sandy
Odra Bank
Gallus et al.: Static acoustic monitoring of Baltic harbour porpoises
While the population in the North Sea appears tohave shifted its distribution south between July 1994and July 2005 according to the 2 SCANS (SmallCetaceans in the [European] Atlantic and North Sea)surveys (Hammond et al. 2002, SCANS II 2008), thebasin-wide abundance has not significantly chan ged.Healthy status is unlikely, however, for the IDW pop-ulation (Teilmann et al. 2011) and is most definitelynot the case for the BP population. Aerial line tran-sect survey data were collected in an area extendingfrom the south coast of Sweden to Poland and theisland of Rügen (Berggren et al. 2002, 2004, L. Hiby &P. Lovell unpubl. data) in the summers of 1995 and2002. In 1995, a total of 3 porpoises were sighted, andin 2002 a total of 2 observations of porpoise podswere collected off the south coast of Sweden. Fromthese very few observed animals it was estimatedusing distance sampling, that 599 porpoises (95%CL = 200 to 3300) inhabited this area in 1995 and ap -proximately 93 groups in 2002 (95% CL = 10 to 460).Harbour porpoise in the Baltic are usually ob servedin group sizes between 1 and 2 individuals (e.g.Berg gren et al. 2002, Scheidat et al. 2008). The 2002result is not significantly lower than in 1995, becausethe confidence bands are very large due to the ex -tremely small sample sizes.
These low abundance estimates, detection ratesand high uncertainty caused serious concern aboutthe population status of harbour porpoises in the BParea. Uncertainty is so high that even the survival ofthis population has been in question at times. Boat-based surveys with passive acoustic methods as wellas visual observers were carried out using a towedhydrophone system in 2001 and 2002 (Gillespie et al.2005). Only 3 acoustic detections were recorded inthe western BP (excluding Polish waters) in 2002,and only 1 visual sighting was obtained on effort inPolish waters in 2001. These surveys confirmed the‘Critically Endangered’ status of the BP harbour por-poise population as stated by the IUCN Red list(Hammond et al. 2008).
The border between the 2 populations (IDW andBP) was originally assumed to be the salt waterinflow barriers into the BP: the Limhamn Sill in theØresund and the Darß Sill in the Kadet Trench(Huggenberger et al. 2002, Palme et al. 2004). Teil-mann et al. (2011) found that some satellite-taggedporpoise in IDW moved east of the island of Rügeneven towards Bornholm. They also found that a smallproportion of porpoises from the NS and IDW popu-lations briefly resided within the neighbouring popu-lation’s area, suggesting that some overlap in distrib-utional range may exist. The Baltic Sea is one of the
largest brackish water bodies of the world and isprone to freezing in severe winters, which may con-stitute 11% of all winters (Seinä & Palosuo 1996). Iceconditions vary with a salinity gradient from thesouth-westerly waters of the Belt Sea, dominated byporous ice, up to the north-easterly waters aroundFinland, Sweden, Russia, Estonia and Latvia, domi-nated by fast freshwater ice (Granskog et al. 2006).
Harbour porpoises are extremely mobile animalsand can travel up to 50 km d−1 (Westgate et al. 1995)and swim approximately 7 km h−1 (Schulze 1996).Maximum speeds are probably between 16.6 km h−1
(Kanwisher & Sundnes 1965) and 22.2 km h−1
(Gaskin et al. 1974), but are unlikely to be sustainedover long periods of time.
The use of echolocation click loggers in low-den-sity areas has provided new research opportunitiesfor species such as the vaquita Phocoena sinus(Rojas-Bracho et al. 2006, Jaramillo-Legorreta et al.2007), the Hector’s dolphin Cephalorhynchus hectori(Rayment et al. 2009), as well as its highly endan-gered sub-species, the Maui dolphin C. hectori maui(Rayment et al. 2011). Since 2002, the GermanOceanographic Museum has been carrying out staticacoustic monitoring (SAM) of harbour porpoisesusing click detectors called T-PODs (timing- porpoise-detectors, Chelonia Ltd.) to record the occurrence ofthese animals continuously within the framework ofvarious research projects (Verfuß et al. 2007, 2008a).Results from these studies suggested strong geo-graphical and seasonal variation in habitat use in theGerman Baltic Sea west of the island of Rügen.Acoustic detections declined from west to east,increased during spring to peak in summer anddeclined again in fall. Verfuß et al. (2007) did notshow any seasonal variation north and east of theisland of Rügen (Pomer anian Bay), the area mostprobably inhabited by the BP population. Already in2002, the first version of the Jastarnia Plan of ASCO -BANS (2009) outlined the need for more detailedknowledge on the habitat use of the Baltic harbourporpoise.
We conducted large-scale acoustic monitoring with22 measuring positions to obtain new information ondistribution, seasonal and geographic variation, andecological dependencies of the BP population in Ger-man waters. One major aim of the present study wasto find possibilities to protect BP porpoises withregard to their geographical and seasonal distribu-tion, a possible habitat partitioning between BP andIDW populations, and to determine whether SAM isan appropriate tool for monitoring this low-densitypopulation.
267
Endang Species Res 18: 265–278, 2012
MATERIALS AND METHODS
T-PODs are self-contained acoustic data-loggersdeveloped to register echolocation clicks of odonto-cetes via a hydrophone, filters, a sound processor andbattery in a watertight housing tested for up to 150 mwater depth. The T-POD compares the energy con-tent of the porpoise echolocation frequency band,which typically lies around 130 kHz (Au et al. 1999,Kamminga et al. 1999), and a reference band around90 kHz, in real-time. Time of occurrence and dura-tion of possible echolocation clicks are saved to amemory chip. Durations registered are highly corre-lated with the loudness of the signal and can beregarded as a proxy for amplitude. T-POD detectionranges are smaller than 500 m. Calibration of the T-PODs (Dähne et al. 2006, Verfuß et al. 2008b) wasconducted before and after the study and once everyyear to obtain a measure for the variation of instru-ment sensitivity probably resulting in differences inthe amount of recorded clicks. T-POD (Versions 2to 5) instrument settings are described in Table 1.‘Minimum intensity/sensitivity’ was adjusted for in di -vidual T-PODs to standardise the detection thresholdto 127 dB re 1 µPa peak-peak. As not all T-PODscould be set to this value, detection threshold andhardware version were also included as co-variablesin the modelling process. Furthermore T-PODs wererotated among deployment locations.
Data were downloaded, processed and exportedwith the proprietary software ‘T-POD.exe’ Version 7.4
using train detection algorithm Version 3.0. Train de -tection of likely harbour porpoise vocalisations in alldetection classes (‘CetHi’ to ‘very doubtful’) was usedto find possible click trains within any given 10 minperiod. These detections were double-checked visu-ally by trained observers for the presence of harbourporpoise Phocoena phocoena echolocation click se -quen ces and then classified as porpoise, boat, or othersound. The minimum number of automatically classi-fied clicks to be regarded as porpoise was defined tobe 5. The progression of inter-click intervals (ICI) andduration of individual clicks was used for visual classi-fication taking all registered clicks in that time periodinto account. Automatic detections of possible porpoiseorigin were rejected (false positives) when (1) ICI didnot show a variation in click pattern typical for echolo-cation click trains (see Amundin 1991, Au 1993, Verfußet al. 2005, 2009), e.g. an ICI variation in consecutiveclicks of up to ±40%; (2) duration was constantly ormostly <20 or >500 µs; and (3) another source of theautomatically detected sounds could be identified(boat engine or sonar, ambient noise) as the likelysource of the classified clicks. Only verified clicksequences were in cluded in all subsequent analyses.From these detections, the proportion of porpoise pos-itive days (ppd) and porpoise positive hours (pph),defined as the percentage of days and hours with atleast 1 porpoise detection, was calculated for eachmonth. These fairly coarse time periods were used toreduce the number of zeros for this low-density data-set, to reduce effects of temporal and spatial autocorre-lation and to have no or only small impacts from varia-tions in instrument sensitivity and hardware version.
Geographic distribution and seasonal variation
A total of 21 recording positions were chosen fordeployment: of these, 15 were placed with evenspacing in the 2 extensive shallow-water areasAdler grund and Odra Bank (marked ‘A’ in Fig. 2;water depth: 7 to 26 m) under the restrictions of thewater and shipping authorities for the PomeranianBay. In addition, 5 coastal positions were located be -tween the Arkona cliffs and the Usedom peninsulaand another one north of Rügen (marked with ‘B’ inFig. 2; water depth: 10 to 22 m). Finally, 1 positionnorth of the Darß peninsula (marked ‘Ref’ in Fig. 2;water depth: 11 m) was used as a proxy for the occur-rence of animals from the IDW population (Verfuß etal. 2007, 2008a). The positioning was consistent withthat used by Verfuß et al. (2007), and instrumentswere deployed approximately 5 to 7 m below the
268
Setting Applicable T-POD version for V2 & V3 V4 & V5
Target (A) filter V2−V5 130 kHz 132 kHzfrequency
Reference (B) filter V2−V5 90 kHz 90 kHzfrequency
Selectivity (ratio A/B) V2,V3 6
Click bandwidth V4,V5 4‘A’ integration period V2,V3 Short (10) ‘B’ integration period V2,V3 Long (18)
Noise adaptation V4,V5 ++Minimum intensity/ V2−V5 Variable Variablesensitivity
Scan limit of no. V2−V5 240 240of clicks logged
Table 1. Instrument settings used during the study; minimumintensity/sensitivity setting was adjusted for each instru-ment’s detection threshold. Versions 2 and 3 (V2 & V3) havesimilar settings; settings for Versions 4 and 5 (V4 & V5) aredifferent due to adaptation of the hardware by the manufac-turer; hence, not all settings are applicable to each version. ++: noise adaption switched on. A and B areas, see Fig. 2
Gallus et al.: Static acoustic monitoring of Baltic harbour porpoises
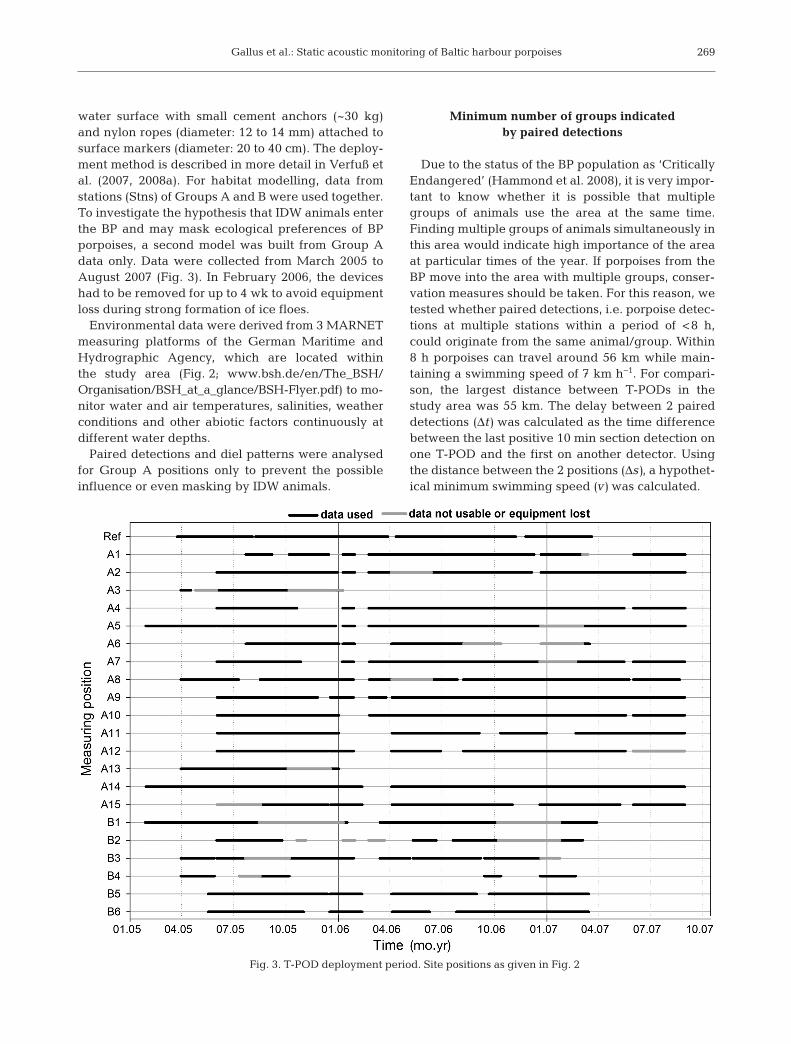
water surface with small cement anchors (~30 kg)and nylon ropes (diameter: 12 to 14 mm) attached tosurface markers (diameter: 20 to 40 cm). The deploy-ment method is described in more detail in Verfuß etal. (2007, 2008a). For habitat modelling, data fromstations (Stns) of Groups A and B were used together.To investigate the hypothesis that IDW animals enterthe BP and may mask ecological preferences of BPporpoises, a second model was built from Group Adata only. Data were collected from March 2005 toAugust 2007 (Fig. 3). In February 2006, the deviceshad to be removed for up to 4 wk to avoid equipmentloss during strong formation of ice floes.
Environmental data were derived from 3 MARNETmeasuring platforms of the German Maritime andHydrographic Agency, which are located withinthe study area (Fig. 2; www.bsh.de/ en/ The _BSH/Organisation / BSH_at_a_glance/BSH-Flyer.pdf) to mo -nitor water and air temperatures, salinities, weatherconditions and other abiotic factors continuously atdifferent water depths.
Paired detections and diel patterns were analysedfor Group A positions only to prevent the possibleinfluence or even masking by IDW animals.
Minimum number of groups indicated by paired detections
Due to the status of the BP population as ‘CriticallyEndangered’ (Hammond et al. 2008), it is very impor-tant to know whether it is possible that multiplegroups of animals use the area at the same time.Finding multiple groups of animals simultaneously inthis area would indicate high importance of the areaat particular times of the year. If porpoises from theBP move into the area with multiple groups, conser-vation measures should be taken. For this reason, wetested whether paired detections, i.e. porpoise detec-tions at multiple stations within a period of <8 h,could originate from the same animal/ group. Within8 h porpoises can travel around 56 km while main-taining a swimming speed of 7 km h−1. For compari-son, the largest distance between T-PODs in thestudy area was 55 km. The delay be tween 2 paireddetections (Δt) was calculated as the time differencebetween the last positive 10 min section detection onone T-POD and the first on another detector. Usingthe distance between the 2 positions (Δs), a hypothet-ical minimum swimming speed (v) was calculated.
269
Fig. 3. T-POD deployment period. Site positions as given in Fig. 2
Endang Species Res 18: 265–278, 2012
Paired detections were classified by the resultingswimming speeds as follows: 0 to 7 km h−1: possiblyfrom the same animal/group; 7 to 10 km h−1: likely 2groups, if the swimming speed was maintained for>90 min (i.e. the involved stations were >10.5 kmapart); 10 to 22 km h−1: likely 2 different animals/groups, if the time difference was >45 min (i.e. thestations were 8 to 17 km apart); >22 km h−1: definitely2 different animals/groups. If more than 2 positionshad paired detections (according to these criteria),then all speeds between the positions were calcu-lated in the same fashion.
The number of paired detections might also beused as a metric to be considered for a future abun-dance estimate. As statistics need to be developed forthis metric in order to be used in this fashion, wewant to show here that they can support species con-servation within very low-density areas, where anabundance estimate using regular statistical methodsmight not be feasible.
Diel pattern
Two daily periods were defined. ‘Daytime’ was thetime between sunrise and sunset, and ‘nighttime’was defined as the time between sunset and sunrise.The proportion of ‘pph’ was calculated per dailyperiod and station, and a test was carried out using a
pairwise comparison (pphnighttime vs. pphdaytime) in ageneralised linear mixed model with day as a ran-dom factor under a quasi-binomial distribution.
Habitat modelling
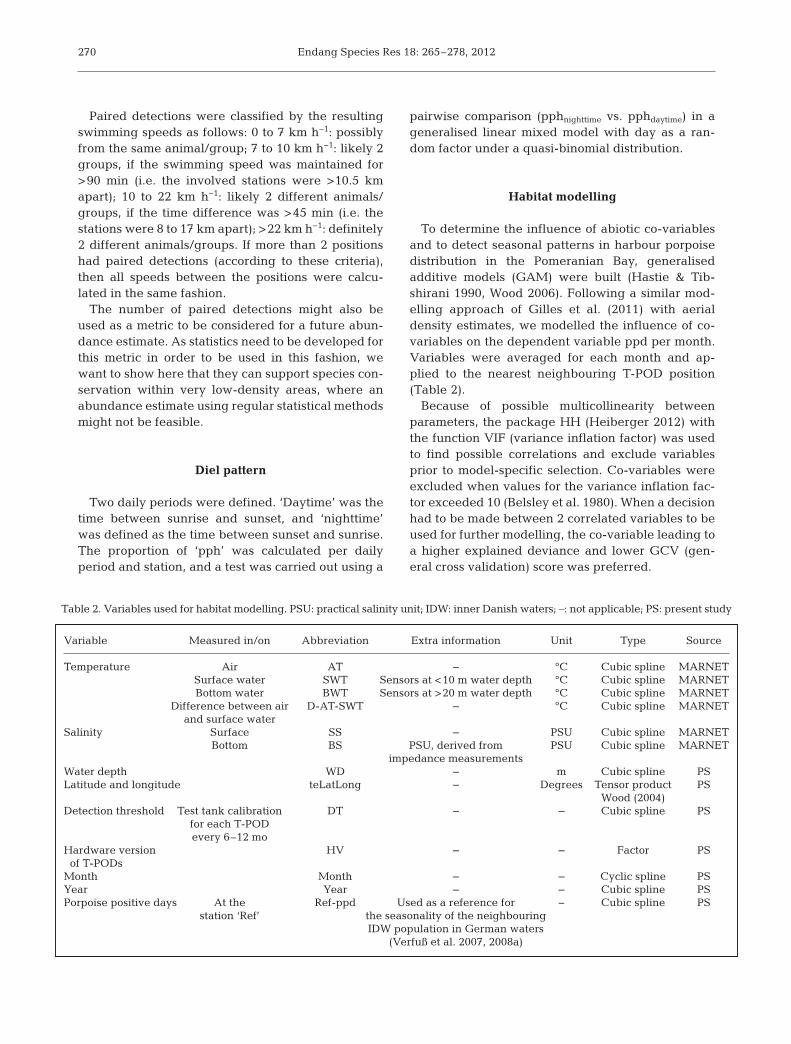
To determine the influence of abiotic co-variablesand to detect seasonal patterns in harbour porpoisedistribution in the Pomeranian Bay, generalisedadditive models (GAM) were built (Hastie & Tib -shirani 1990, Wood 2006). Following a similar mod-elling approach of Gilles et al. (2011) with aerialdensity estimates, we modelled the influence of co-variables on the dependent variable ppd per month.Variables were averaged for each month and ap -plied to the nearest neighbouring T-POD position(Table 2).
Because of possible multicollinearity betweenparameters, the package HH (Heiberger 2012) withthe function VIF (variance inflation factor) was usedto find possible correlations and exclude variablesprior to model-specific selection. Co-variables wereexcluded when values for the variance inflation fac-tor exceeded 10 (Belsley et al. 1980). When a decisionhad to be made between 2 correlated variables to beused for further modelling, the co-variable leading toa higher explained deviance and lower GCV (gen-eral cross validation) score was preferred.
270
Variable Measured in/on Abbreviation Extra information Unit Type Source
Temperature Air AT – °C Cubic spline MARNET Surface water SWT Sensors at <10 m water depth °C Cubic spline MARNET Bottom water BWT Sensors at >20 m water depth °C Cubic spline MARNET Difference between air D-AT-SWT – °C Cubic spline MARNET and surface waterSalinity Surface SS – PSU Cubic spline MARNET Bottom BS PSU, derived from PSU Cubic spline MARNET impedance measurementsWater depth WD – m Cubic spline PSLatitude and longitude teLatLong – Degrees Tensor product PS Wood (2004)Detection threshold Test tank calibration DT – – Cubic spline PS for each T-POD every 6–12 moHardware version HV – – Factor PSof T-PODs
Month Month – – Cyclic spline PSYear Year – – Cubic spline PSPorpoise positive days At the Ref-ppd Used as a reference for − Cubic spline PS station ‘Ref’ the seasonality of the neighbouring IDW population in German waters (Verfuß et al. 2007, 2008a)
Table 2. Variables used for habitat modelling. PSU: practical salinity unit; IDW: inner Danish waters; –: not applicable; PS: present study
Gallus et al.: Static acoustic monitoring of Baltic harbour porpoises
Calculations were carried out using R 2.14.1 (RDevelopment Core Team 2012) and the packagemgcv 1.7.13 (Wood 2004) assuming a quasi-Poissondistribution, as it can cope with zero inflated values(Zuur et al. 2009). To find the most appropriatemodel, we used backward selection of significant co-variables tested via an ANOVA. Models with signifi-cantly lower residual deviance were preferred, aswell as models with fewer variables and non-signifi-cant differences to the model with more variables.After model selection 10-fold cross validation wascarried out to estimate the root mean square error ofthe prediction (RMSEP; Hastie et al. 2009).
The importance of variables was estimated usingthe F-value. Spatial and temporal autocorrelation wasassessed using jittered variograms and autocorrela-tion function plots of the model residuals in R 2.14.1and the package geoR 1.7.2 (Paulo et al. 2001, Diggle& Ribeiro 2007) for spatial autocorrelation. No auto-correlation patterns were apparent, probably due tothe coarse time period (month) used. Data with <5recording days per month and position were excludedto prevent a bias due to differences in effort.
RESULTS
Between March 2005 and August 2007, recordingsof Phocoena phocoena were made at all 21 stations inthe Pomeranian Bay for a total of 11 890 d (9282 d forGroup A only). Of these, porpoise echolocation clicktrains were recorded on 207 d (Group A: 132 d),resulting in an overall mean of 1.86% ppd per stationand month (Group A: 1.48%). For comparison, StnREF had a mean of 34.02% ppd per month, rangingfrom 0 to 83.3% during 694 d of operation.
Geographic distribution and seasonal variation
Porpoises were registered at every recording posi-tion, except A3 and A13, which had only limited log-ging time (Fig. 3). With the exception of April andMay 2007, porpoises were registered every month.Detections peaked at 19.4% ppd at Stn A7 in July2007 and 25.8% ppd at Stn B2 in August 2006. Max-imum average values per station and month for theentire German part of the Pomeranian Bay wereobtained in January 2006 with 5.4% ppd (Group A)and 5.2% ppd in March 2006 for Group AB.
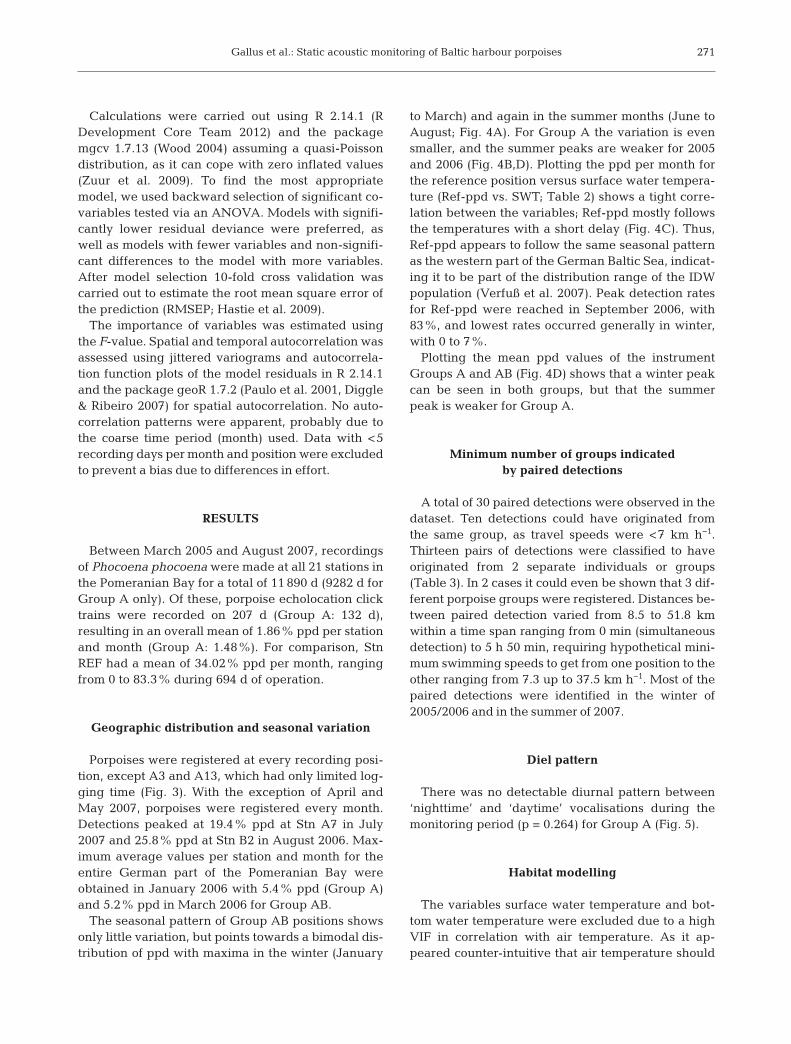
The seasonal pattern of Group AB positions showsonly little variation, but points towards a bimodal dis-tribution of ppd with maxima in the winter (January
to March) and again in the summer months (June toAugust; Fig. 4A). For Group A the variation is evensmaller, and the summer peaks are weaker for 2005and 2006 (Fig. 4B,D). Plotting the ppd per month forthe reference position versus surface water tempera-ture (Ref-ppd vs. SWT; Table 2) shows a tight corre-lation between the variables; Ref-ppd mostly followsthe temperatures with a short delay (Fig. 4C). Thus,Ref-ppd appears to follow the same seasonal patternas the western part of the German Baltic Sea, indicat-ing it to be part of the distribution range of the IDWpopulation (Verfuß et al. 2007). Peak detection ratesfor Ref-ppd were reached in September 2006, with83%, and lowest rates occurred generally in winter,with 0 to 7%.
Plotting the mean ppd values of the instrumentGroups A and AB (Fig. 4D) shows that a winter peakcan be seen in both groups, but that the summerpeak is weaker for Group A.
Minimum number of groups indicated by paired detections
A total of 30 paired detections were observed in thedataset. Ten detections could have originated fromthe same group, as travel speeds were <7 km h−1.Thirteen pairs of detections were classified to have originated from 2 separate individuals or groups(Table 3). In 2 cases it could even be shown that 3 dif-ferent porpoise groups were registered. Distances be-tween paired detection varied from 8.5 to 51.8 kmwithin a time span ranging from 0 min (simultaneousdetection) to 5 h 50 min, requiring hypothetical mini-mum swimming speeds to get from one position to theother ranging from 7.3 up to 37.5 km h−1. Most of thepaired detections were identified in the winter of2005/2006 and in the summer of 2007.
Diel pattern
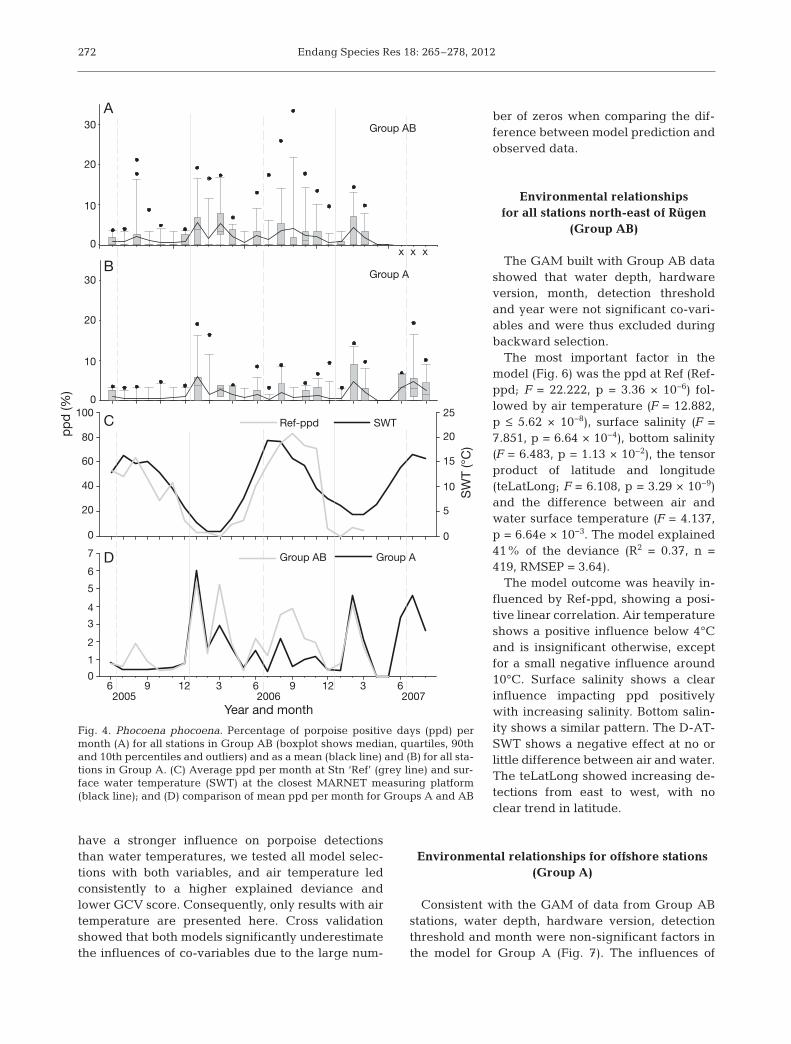
There was no detectable diurnal pattern between‘nighttime’ and ‘daytime’ vocalisations during themonitoring period (p = 0.264) for Group A (Fig. 5).
Habitat modelling
The variables surface water temperature and bot-tom water temperature were excluded due to a highVIF in correlation with air temperature. As it ap -peared counter-intuitive that air temperature should
271
Endang Species Res 18: 265–278, 2012
have a stronger influence on porpoise detectionsthan water temperatures, we tested all model selec-tions with both variables, and air temperature ledconsistently to a higher explained deviance andlower GCV score. Consequently, only results with airtemperature are presented here. Cross validationshowed that both models significantly underestimatethe influences of co-variables due to the large num-
ber of zeros when comparing the dif-ference between model prediction andobserved data.
Environmental relationships for all stations north-east of Rügen
(Group AB)
The GAM built with Group AB datashowed that water depth, hardwareversion, month, detection thresholdand year were not significant co-vari-ables and were thus excluded duringbackward selection.
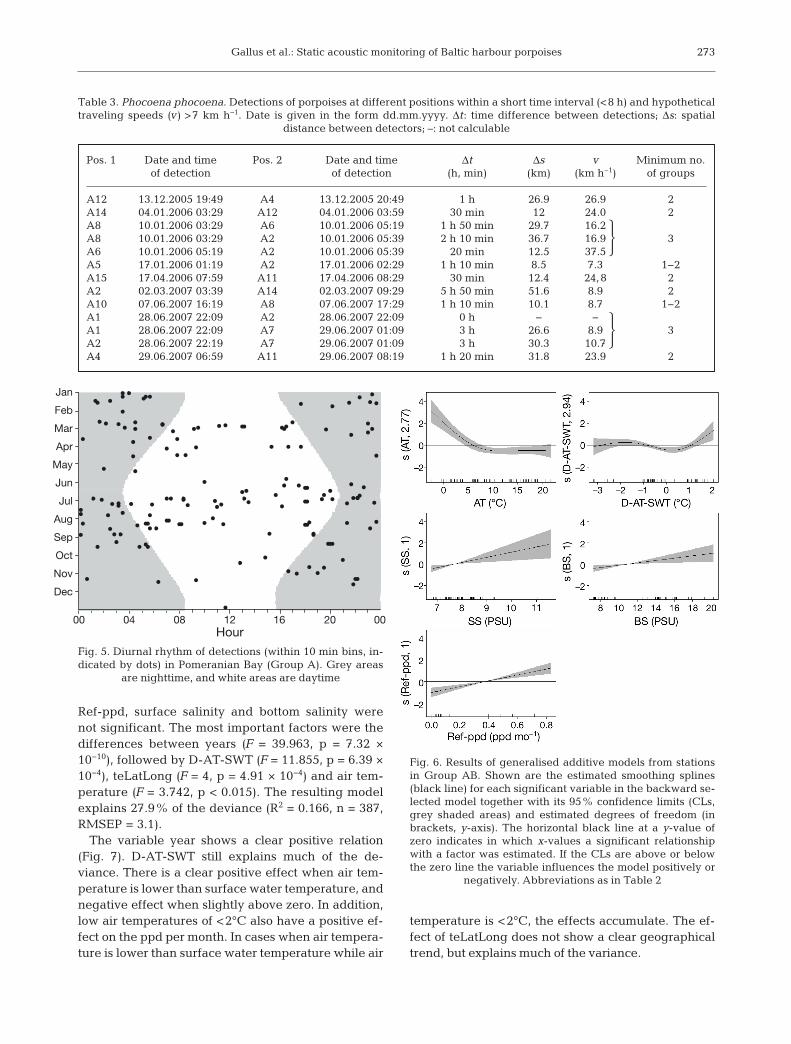
The most important factor in themodel (Fig. 6) was the ppd at Ref (Ref-ppd; F = 22.222, p = 3.36 × 10⁻⁶) fol-lowed by air temperature (F = 12.882,p ≤ 5.62 × 10⁻⁸), surface salinity (F =7.851, p = 6.64 × 10⁻⁴), bottom salinity(F = 6.483, p = 1.13 × 10⁻²), the tensorproduct of latitude and longitude(teLatLong; F = 6.108, p = 3.29 × 10⁻⁹)and the difference between air andwater surface temperature (F = 4.137,p = 6.64e × 10−3. The model explained41% of the deviance (R2 = 0.37, n =419, RMSEP = 3.64).
The model outcome was heavily in -fluenced by Ref-ppd, showing a posi-tive linear correlation. Air temperatureshows a positive influence below 4°Cand is insignificant otherwise, ex ceptfor a small negative influence around10°C. Surface salinity shows a clearinfluence impacting ppd positivelywith increasing salinity. Bottom salin-ity shows a similar pattern. The D-AT-SWT shows a negative effect at no orlittle difference between air and water.The teLatLong showed increasing de -tections from east to west, with noclear trend in latitude.
Environmental relationships for offshore stations(Group A)
Consistent with the GAM of data from Group ABstations, water depth, hardware version, detectionthreshold and month were non-significant factors inthe model for Group A (Fig. 7). The influences of
272
x
Group AB
Group A
Group AB Group A
Ref-ppd
x x
20
30
10
0
30
100 25
20
15
10
5
0
A
B
C
D
SWT
pp
d (%
)
SW
T (°
C)
80
60
40
20
0
6
7
62005 2006
Year and month2007
9 12 3 6 9 12 3 6
5
4
3
2
1
0
20
10
0
Fig. 4. Phocoena phocoena. Percentage of porpoise positive days (ppd) permonth (A) for all stations in Group AB (boxplot shows median, quartiles, 90thand 10th percentiles and outliers) and as a mean (black line) and (B) for all sta-tions in Group A. (C) Average ppd per month at Stn ‘Ref’ (grey line) and sur-face water temperature (SWT) at the closest MARNET measuring platform(black line); and (D) comparison of mean ppd per month for Groups A and AB
Gallus et al.: Static acoustic monitoring of Baltic harbour porpoises
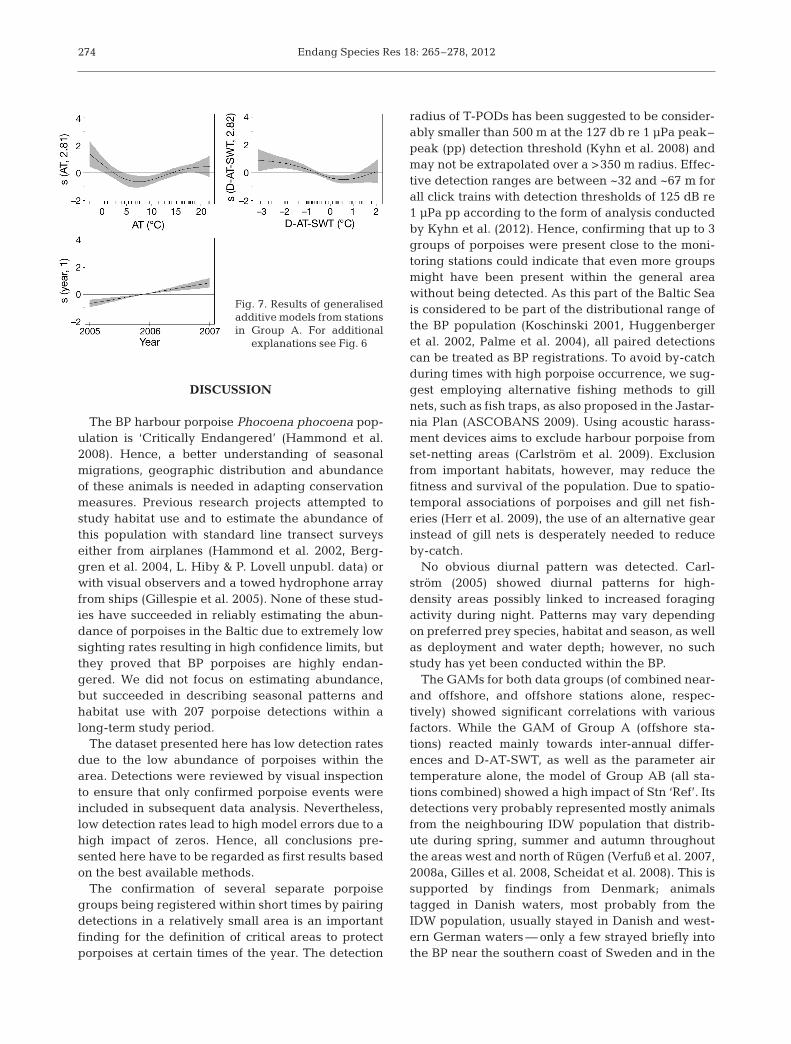
Ref-ppd, surface salinity and bottom salinity werenot significant. The most important factors were thedifferences between years (F = 39.963, p = 7.32 ×10⁻¹⁰), followed by D-AT-SWT (F = 11.855, p = 6.39 ×10⁻⁴), teLatLong (F = 4, p = 4.91 × 10⁻⁴) and air tem-perature (F = 3.742, p < 0.015). The resulting modelexplains 27.9% of the deviance (R2 = 0.166, n = 387,RMSEP = 3.1).
The variable year shows a clear positive relation(Fig. 7). D-AT-SWT still explains much of the de -viance. There is a clear positive effect when air tem-perature is lower than surface water temperature, andnegative effect when slightly above zero. In addition,low air temperatures of <2°C also have a positive ef-fect on the ppd per month. In cases when air tempera-ture is lower than surface water temperature while air
temperature is <2°C, the effects accumulate. The ef-fect of teLatLong does not show a clear geographicaltrend, but explains much of the variance.
273
Pos. 1 Date and time Pos. 2 Date and time Δt Δs v Minimum no. of detection of detection (h, min) (km) (km h−1) of groups
A12 13.12.2005 19:49 A4 13.12.2005 20:49 1 h 26.9 26.9 2A14 04.01.2006 03:29 A12 04.01.2006 03:59 30 min 12 24.0 2A8 10.01.2006 03:29 A6 10.01.2006 05:19 1 h 50 min 29.7 16.2
A8 10.01.2006 03:29 A2 10.01.2006 05:39 2 h 10 min 36.7 16.9 3A6 10.01.2006 05:19 A2 10.01.2006 05:39 20 min 12.5 37.5
A5 17.01.2006 01:19 A2 17.01.2006 02:29 1 h 10 min 8.5 7.3 1−2A15 17.04.2006 07:59 A11 17.04.2006 08:29 30 min 12.4 24,8 2A2 02.03.2007 03:39 A14 02.03.2007 09:29 5 h 50 min 51.6 8.9 2A10 07.06.2007 16:19 A8 07.06.2007 17:29 1 h 10 min 10.1 8.7 1−2A1 28.06.2007 22:09 A2 28.06.2007 22:09 0 h − −
A1 28.06.2007 22:09 A7 29.06.2007 01:09 3 h 26.6 8.9 3A2 28.06.2007 22:19 A7 29.06.2007 01:09 3 h 30.3 10.7
A4 29.06.2007 06:59 A11 29.06.2007 08:19 1 h 20 min 31.8 23.9 2
Table 3. Phocoena phocoena. Detections of porpoises at different positions within a short time interval (<8 h) and hypotheticaltraveling speeds (v) >7 km h−1. Date is given in the form dd.mm.yyyy. Δt: time difference between detections; Δs: spatial
distance between detectors; –: not calculable
Jan
Feb
Mar
Apr
May
Jun
Jul
Aug
Sep
Oct
Nov
Dec
00 04 08 12Hour
16 20 00
Fig. 5. Diurnal rhythm of detections (within 10 min bins, in-dicated by dots) in Pomeranian Bay (Group A). Grey areas
are nighttime, and white areas are daytime
Fig. 6. Results of generalised additive models from stationsin Group AB. Shown are the estimated smoothing splines(black line) for each significant variable in the backward se-lected model together with its 95% confidence limits (CLs,grey shaded areas) and estimated degrees of freedom (inbrackets, y-axis). The horizontal black line at a y-value ofzero indicates in which x-values a significant relationshipwith a factor was estimated. If the CLs are above or belowthe zero line the variable influences the model positively or
negatively. Abbreviations as in Table 2
�
�
Endang Species Res 18: 265–278, 2012
DISCUSSION
The BP harbour porpoise Phocoena phocoena pop-ulation is ‘Critically Endangered’ (Hammond et al.2008). Hence, a better understanding of seasonalmigrations, geographic distribution and abundanceof these animals is needed in adapting conservationmeasures. Previous research projects attempted tostudy habitat use and to estimate the abundance ofthis population with standard line transect surveyseither from airplanes (Hammond et al. 2002, Berg -gren et al. 2004, L. Hiby & P. Lovell unpubl. data) orwith visual observers and a towed hydrophone arrayfrom ships (Gillespie et al. 2005). None of these stud-ies have succeeded in reliably estimating the abun-dance of porpoises in the Baltic due to extremely lowsighting rates resulting in high confidence limits, butthey proved that BP porpoises are highly endan-gered. We did not focus on estimating abundance,but succeeded in describing seasonal patterns andhabitat use with 207 porpoise detections within along-term study period.
The dataset presented here has low detection ratesdue to the low abundance of porpoises within thearea. Detections were reviewed by visual inspectionto ensure that only confirmed porpoise events wereincluded in subsequent data analysis. Nevertheless,low detection rates lead to high model errors due to ahigh impact of zeros. Hence, all conclusions pre-sented here have to be regarded as first results basedon the best available methods.
The confirmation of several separate porpoisegroups being registered within short times by pairingdetections in a relatively small area is an importantfinding for the definition of critical areas to protectporpoises at certain times of the year. The detection
radius of T-PODs has been suggested to be consider-ably smaller than 500 m at the 127 db re 1 µPa peak–peak (pp) detection threshold (Kyhn et al. 2008) andmay not be extrapolated over a >350 m radius. Effec-tive detection ranges are between ~32 and ~67 m forall click trains with detection thresholds of 125 dB re1 µPa pp according to the form of analysis conductedby Kyhn et al. (2012). Hence, confirming that up to 3groups of porpoises were present close to the moni-toring stations could indicate that even more groupsmight have been present within the general areawithout being detected. As this part of the Baltic Seais considered to be part of the distributional range ofthe BP population (Koschinski 2001, Huggenbergeret al. 2002, Palme et al. 2004), all paired detectionscan be treated as BP registrations. To avoid by-catchduring times with high porpoise occurrence, we sug-gest employing alternative fishing methods to gillnets, such as fish traps, as also proposed in the Jastar-nia Plan (ASCOBANS 2009). Using acoustic harass-ment devices aims to exclude harbour porpoise fromset-netting areas (Carlström et al. 2009). Exclusionfrom important habitats, however, may reduce thefitness and survival of the population. Due to spatio-temporal associations of porpoises and gill net fish-eries (Herr et al. 2009), the use of an alternative gearinstead of gill nets is desperately needed to reduceby-catch.
No obvious diurnal pattern was detected. Carl-ström (2005) showed diurnal patterns for high- density areas possibly linked to increased foragingactivity during night. Patterns may vary dependingon preferred prey species, habitat and season, as wellas deployment and water depth; however, no suchstudy has yet been conducted within the BP.
The GAMs for both data groups (of combined near-and offshore, and offshore stations alone, respec-tively) showed significant correlations with variousfactors. While the GAM of Group A (offshore sta-tions) reacted mainly towards inter-annual differ-ences and D-AT-SWT, as well as the parameter airtemperature alone, the model of Group AB (all sta-tions combined) showed a high impact of Stn ‘Ref’. Itsdetections very probably represented mostly animalsfrom the neighbouring IDW population that distrib-ute during spring, summer and autumn throughoutthe areas west and north of Rügen (Verfuß et al. 2007,2008a, Gilles et al. 2008, Scheidat et al. 2008). This issupported by findings from Denmark; animalstagged in Danish waters, most probably from theIDW population, usually stayed in Danish and west-ern German waters — only a few strayed briefly intothe BP near the southern coast of Sweden and in the
274
Fig. 7. Results of generalisedadditive models from stationsin Group A. For additional
explanations see Fig. 6
Gallus et al.: Static acoustic monitoring of Baltic harbour porpoises
waters near Bornholm (Teilmann et al. 2011). Wetherefore conclude that data from near-shore stationson the east coast of Rügen have a high impact on themodel of Group AB, adding the strong influence ofmigrating IDW animals that are registered in sum-mer at these stations. Thus, the few detections of BPindividuals with differing ecological preferences mayhardly influence the model. This hypothesis is ofcourse weakened by the fact that we cannot distin-guish the 2 populations acoustically; theoretically,underlying ecological variables may hence causeboth populations to migrate similarly. Nevertheless,genetic and morphologic differences have alreadybeen shown for the 2 populations, and physiologicaldifferences and adaptation to the less saline BalticBasins are probable and would result in differentecological preferences.
As the influence of Stn ‘Ref’ was not significant inthe model of Group A stations, there appeared to befewer or no detections of IDW animals among thesestations, and any summer peak in the offshore datamay be due to a few IDW animals taking advantageof periods with increased prey availability as pro-posed by Scheidat et al. (2008). The influence of thefactor ‘year’ might be biased by not covering the fullyear of 2007 and having fewer stations being re -corded in the beginning of 2005.
The difference between air and water surface tem-perature is one of the strongest factors at Group A(offshore) stations, which suggests that BP porpoisesremaining in the BP during winter, while IDW por-poises migrate westwards, are probably respondingto the temperature gradient. We hypothesise thatthey move into ice-free waters to avoid confinementand possible suffocation due to ice cover in cold win-ters. This is supported by higher detection rates dur-ing low temperatures at both groups of stations. Oncethe temperature drops to a certain level, porpoisesfrom the north-eastern parts of the BP might continueto migrate towards the saltier waters farther south-west. During summer, however, animals from theIDW might also use the area east of Rügen, whenthey appear to disperse throughout all parts of theGerman Baltic Sea. Therefore, BP porpoises appearto have a seasonal pattern of area use alternatingwith IDW animals. When including data influencedby IDW animals, population-dependent effects maythus be masked.
Surface and bottom salinity have an effect on thedata of Group AB stations. This result underpins thefindings of Edrén et al. (2010) who noted a largeinfluence of bottom salinity on tagged animals inDanish waters. Salinity was not significant in Group
A, possibly pointing to different factors driving sea-sonal migrations for the 2 populations.
Cross validation showed that both models have ahigh model error and underestimated the importanceof model factors when comparing the distribution oferrors. Important information for a better under-standing of habitat utilisation is therefore still miss-ing, mainly due to low detection rates and ecologicalvariables not incorporated into the model.
Nevertheless, the differences presented in habitatuse add important information to the on-going con-servation discussion. Distinct populations have gen e -tical (Wiemann et al. 2010) and morphological differ-ences (Huggenberger et al. 2002), but also differ intheir ecological preferences, as presented here. Ourdataset shows that porpoises in the German BP arescarcely encountered. It thus confirms that porpoisesof the BP have become rare and are seriously endan-gered. Nevertheless, the existence of a BP populationstill appears to be evident in the different seasonalpatterns as it is migrating south-westward into Ger-man waters, especially in cold winters. In the ab -sence of detailed knowledge about the spring, sum-mer and autumn distributions of this population, wesupport the employment of a large-scale use of SAMto an extended area of potentially preferred habitatsin the BP, as is currently in progress through an EU-LIFE+ project called ‘Static Acoustic Monitoring ofBaltic Harbour Porpoises’ (www. SAMBAH. org).
CONCLUSIONS
Static acoustic monitoring of a small part of the dis-tributional range of porpoises Phocoena phocoena inthe BP has enabled us to draw conclusions about thespatial and temporal distribution of harbour por-poises in this low-density area. This was not possiblewith previous visual abundance estimates. In winter,porpoises from the BP most probably move into thesaltier German waters (less prone to freezing). Por-poises appear to predict ice-forming conditions viathe empirical difference of surface water and air tem-perature or this co-variable serves as a proxy foranother process that was not modelled. Although ourdata suggest that the distribution range of the IDWand BP populations possibly overlap geographically,the 2 populations appear to be separated by theirtemporal distribution pattern.
This implies a direct opportunity for conservationmeasures, because now — for the first time — data onthe temporal and spatial distributions of BP porpoiseare available for German waters. Acoustic detection
275
Endang Species Res 18: 265–278, 2012
rates are low, indicating that the BP population is cur-rently extremely small and at risk of extinction. Con-servation actions must be taken im me diately to havean effect. Therefore, European le gis lation such asby-catch regulation EC 812/2004 (EU Council 2004)needs to be improved immediately to ban the use ofgill nets in critical parts of the BP, at least at certaintimes of the year. Other measures such as the use ofpingers may not prevent anthropogenic mortalitysufficiently and leave Baltic harbour porpoises at fur-ther risk.
Acknowledgements. We thank the German Federal Agencyfor Nature Conservation (BfN) for funding the JastarniaResearch Project (Research Grant FKZ80486011 − K1). Sup-plementary projects were funded by the German Ministryfor the Environment, Nature Conservation and NuclearSafety (FKZ0329946C) and the BfN (FKZ80285260). Thecrews of the vessels ‘Seefuchs’ and ‘Palaemon’, as well asthe coast guard, the water police and the water and shippingauthorities provided essential support during fieldwork.Thanks also to D. Machoczek of the German Maritime andHydrographic Agency (BSH) for access granted to the MAR-NET data, and to C. Honnef for continuous support duringthe field work as well as for many helpful discussions. Forthe critical inspection of the raw datasets we thank K. Krügeland I. Giannikos. D. Tode and A. Kirsch provided adminis-trative support for the project. Considering the differencebetween air and water temperatures as a co-variable was aningenious idea from A. Gilles for which we thank her. S.Würtz and A. Gilles gave comments on an earlier version ofthis manuscript. We thank them and 4 anonymous reviewersfor helpful suggestions that greatly improved the paper.Last, but not least, we thank N. Tregenza for developingsuch a marvellous research tool, for answering all of ourquestions, for frequent troubleshooting and for his good-humoured comments. This article is dedicated to the mem-ory of Wolfgang Dinter, who lived for the conservation ofmarine mammals.
LITERATURE CITED
Amundin M (1991) Sound production in odontocetes withemphasis on the harbour porpoise Phocoena phocoena.PhD thesis, University of Stockholm, Stockholm
ASCOBANS (Agreement on the Conservation of SmallCetaceans on the Baltic and North Seas) (2009) Recoveryplan for Baltic harbour porpoises ‘Jastarnia Plan‘ (2009).Available at: www.ascobans.org/pdf/ASCOBANS_Jas-tarniaPlan_MOP6.pdf (accessed 11 October 2011)
Au WWL (1993) The sonar of dolphins, Springer-Verlag,New York, NY
Au WWL, Kastelein RA, Rippe T, Schooneman NM (1999)Transmission beam pattern and echolocation signals of aharbour porpoise (Phocoena phocoena). J Acoust Soc Am106: 3699−3705
Belsley DA, Kuh E, Welsch RE (1980) Regression diagnos-tics: identifying influential data and sources of collinear-ity. John Wiley, New York, NY
Berggren P, Ishaq R, Zebühr Y, Näf C, Bandh C, Broman D(1999) Patterns and levels of organochlorines (DDTs,
PCBs, non-ortho PCBs and PCDD/Fs) in male harbourporpoises (Phocoena phocoena) from the Baltic Sea, theKattegat-Skagerrak Seas and the West Coast of Norway.Mar Pollut Bull 38: 1070−1084
Berggren P, Wade PR, Carlström J, Read AJ (2002) Potentiallimits to anthropogenic mortality for harbour porpoises inthe Baltic region. Biol Conserv 103: 313−322
Berggren P, Hiby L, Lovell P, Scheidat M (2004) Abundanceof harbour porpoises in the Baltic Sea from aerial surveysconducted in summer 2002. Working paper SC/56/SM7presented to the Scientific Committee of the Interna-tional Whaling Commission, July 2004, Sorrento
Carlström J (2005) Diel variation in echolocation behaviourof wild harbor porpoises. Mar Mamm Sci 21: 1−12
Carlström J, Berggren P, Tregenza NJC (2009) Spatial andtemporal impact of pingers on porpoises. Can J FishAquat Sci 66: 72−82
Carstensen J, Henriksen OD, Teilmann J (2006) Impacts ofoffshore wind farm construction on harbour porpoises: acoustic monitoring of echolocation activity using por-poise detectors (T-PODs). Mar Ecol Prog Ser 321: 295−308
Dähne M, Verfuß UK, Diederichs A, Meding A, Benke H(2006) T-POD test tank calibration and field calibration.In: Leeney RH, Tregenza NJC (eds) Workshop: StaticAcoustic Monitoring of Cetaceans; 20th Annual meetingof the European Cetacean Society, 2–7 April, Gdynia,Poland. ECS Newsl 46 Spec Issue):34−36
Diggle PJ, Ribeiro PJ Jr (2007) Model based geostatistics.Springer, New York, NY
Edrén SMC, Wisz MS, Teilmann J, Dietz R, Söderkvist J(2010) Modelling spatial patterns in harbour porpoisesatellite telemetry data using maximum entropy. Ecogra-phy 33: 698−708
EU (European Union) Council (2004) Verordnung (EG) Nr.812/2004 des Rates vom 26.04.2004 zur Festlegung vonMaßnahmen gegen Walbeifänge in der Fischerei undzur Änderung der Verordnung (EG) Nr. 88/98. Availableat: http: //eur-lex.europa.eu/LexUriServ/site/ de/oj/2004/l_150/l_15020040430de00120031.pdf (accessed 27 Octo-ber 2011)
European Union (1992) Council Directive 92/43/EEC of 21May 1992 on the conservation of natural habitats and ofwild fauna and flora. Available at: http: //eur-lex. europa.eu/ LexUriServ/LexUriServ.do?uri=CONSLEG: 1992 L 00 43: 20070101: EN: PDF (accessed 19 October 2011)
Galatius A, Kinze CC, Teilmann J (2011) Population struc-ture of harbor porpoises in the greater Baltic region: evi-dence of separation based on geometric morphometriccomparisons. Report to ASCOBANS Jastarnia group.Available at: www.ascobans. org/pdf/ ASCOBANS_ JG7_Report_withAnnexes.pdf (accessed 27 May 2012)
Gaskin DE, Arnold PW, Blair BA (1974) Phocoena phocoena.Mamm Species 42: 1−8
Gilles A, Herr H, Lehnert K, Scheidat M, Siebert U (2008)Harbour porpoises — abundance estimates and seasonaldistribution patterns. In: Wollny-Goerke K, Eskildsen K(eds) Marine mammals and seabirds in front of offshorewind energy. Teuber Verlag & GWV Fachverlage, Wies-baden, p 19−36
Gilles A, Adler S, Kaschner K, Scheidat M, Siebert U(2011) Modelling harbour porpoise seasonal densityas a function of the German Bight environment: implications for management. Endang Species Res 14: 157−169
276
Gallus et al.: Static acoustic monitoring of Baltic harbour porpoises
Gillespie D, Berggren P, Brown S, Kuklik I and others (2005)Relative abundance of harbour porpoises (Phocoena pho-coena) from acoustic and visual surveys of the Baltic Seaand adjacent waters during 2001 and 2002. J Ceta ceanRes Manag 7: 51−57
Granskog M, Kaartokallio H, Kuosa H, Thomas DN, Vainio J(2006) Sea ice in the Baltic Sea — a review. Estuar CoastShelf Sci 70: 145−160
Hammond PS, Berggren P, Benke H, Borchers DL and others(2002) Abundance of harbour porpoise and othercetaceans in the North Sea and adjacent waters. J ApplEcol 39: 361−376
Hammond PS, Bearzi G, Bjørge A, Forney K and others(2008) Phocoena phocoena. In: IUCN 2011, IUCN RedList of threatened species, Version 2011.1. Available at: www.iucnredlist.org (accessed 27 October 2011)
Hastie TJ, Tibshirani RJ (1990) Generalized additive mod-els. Chapman & Hall/CRC, London
Hastie TJ, Tibshirani RJ, Friedman JH (2009) The elementsof statistical learning: data mining, inference, and pre-diction, 2nd edn. Springer-Verlag, New York, NY
Heiberger RM (2012) HH: Statistical analysis and data dis-play: Heiberger and Holland. R package version 2. 3–17http://CRAN.R-project.org/package=HH
Helsinki Commission (1996) Protection of harbour porpoisein the Baltic Sea area. HELCOM Recommendation 17/2adopted 12 March 1996. Available at: www.helcom.fi/Recommendations/en_GB/rec17_2/ (accessed 11 Octo-ber 2011)
Herr H, Fock HO, Siebert U (2009) Spatio-temporal associa-tions between harbour porpoise Phocoena phocoena andspecific fisheries in the German Bight. Biol Conserv 142: 2962−2972
Huggenberger S, Benke H, Kinze CC (2002) Geographicalvariation in harbour porpoise (Phocoena phocoena)skulls: support for a separate non-migratory populationin the Baltic Proper. Ophelia 56: 1−12
Jaramillo-Legorreta A, Rojas-Bracho L, Brownell RL Jr,Read AJ, Reeves RR, Ralls K, Taylor BL (2007) Saving thevaquita: immediate action, not more data. Conserv Biol21: 1653−1655
Jastarnia Group, Bräger S (2009) Decline of the harbour por-poise (Phocoena phocoena) in the southwestern BalticSea. HELCOM Indicator Fact Sheets (ASCOBANS) 2009.Available at: www.helcom.fi /BSAP_ assessment/ ifs/ archive/ ifs2009/en_GB/HarbourPorpoise/?u4.highlight= declineof the harbour porpoise (accessed 27 October 2011)
Kamminga C, Engelsma FJ, Terry RP (1999) An adult-likesonar wave shape from a rehabilitated orphaned harbourporpoise (Phocoena phocoena). Ophelia 50: 35−42
Kanwisher J, Sundnes G (1965) Physiology of a smallcetacean. Hvalråd Skr 48: 45−53
Kinze CC (1995) Exploitation of harbour porpoises (Pho-coena phocoena) in Danish waters: a historical review.Rep Int Whal Comm Spec Issue 16: 141−153
Koschinski S (2001) Current knowledge on harbour por-poises (Phocoena phocoena) in the Baltic Sea. Ophelia55: 167−197
Kyhn LA, Tougaard J, Teilmann J, Wahlberg M, JørgensenPB, Bech NI (2008) Harbour porpoise (Phocoena pho-coena) static acoustic monitoring: laboratory detectionthresholds of T-PODs are reflected in field sensitivity.J Mar Biol Assoc UK 88: 1085−1091
Kyhn LA, Tougaard J, Thomas L, Duve LR and others (2012)From echolocation clicks to animal density — acoustic
sampling of harbor porpoises with static dataloggers.J Acoust Soc Am 131: 550−560
Palme A, Laikre L, Ryman N (2004) Population genetics ofharbour porpoise in Swedish waters. Report 5419,Swedish Environmental Protection Agency, Stockholm
Paulo J, Ribeiro PJ Jr, Diggle PJ (2001) geoR: a package forgeostatistical analysis. R-News 1(2): 15−18
R Development Core Team (2012) R: a language and environment for statistical computing. R Foundation forStatistical Computing, Vienna. Available at: www.R- project.org
Rayment W, Dawson S, Slooten L (2009) Trialling an auto-mated passive acoustic detector (T-POD) with Hector’sdolphins (Cephalorhynchus hectori). J Mar Biol AssocUK 89: 1015−1022
Rayment W, Dawson S, Scali S, Slooten L (2011) Listeningfor a needle in a haystack: passive acoustic detection ofdolphins at very low densities. Endang Species Res 14: 149−156
Rojas-Bracho L, Reeves RR, Jaramillo-Legorreta A (2006)Conservation of the vaquita Phocoena sinus. MammalRev 36: 179−216
SCANS II (2008) Small cetaceans in the European Atlanticand North Sea. Final report to the European Commissionunder Project LIFE04NAT/GB/000245. Sea MammalResearch Unit, Gatty Marine Laboratory, University of StAndrews, St Andrews
Scheidat M, Gilles A, Kock KH, Siebert U (2008) Harbourporpoise Phocoena phocoena abundance in the south-western Baltic Sea. Endang Species Res 5: 215−223
Schulze G (1996) Die Schweinswale. Westarp Wissen -schaften, Magdeburg
Seinä A, Palosuo E (1996) The classification of the maximumannual extent of ice cover in the Baltic Sea 1720−1995,based on materials collected by Risto Jurva (winters1720−1940) and the material of the Ice Service of theFinnish Institute of Marine Research (winters 1941−1995). Merentutkimuslaitoksen 27: 79−91
Skóra KE, Kuklik I (2003) Bycatch as a potential threat forharbour porpoise (Phocoena phocoena) in Polish BalticWaters. NAMMCO Sci Publ 5: 303−315
Skóra KE, Pawliczka I, Klinowska M (1988) Observations ofthe harbour porpoise (Phocoena phocoena) on the PolishBaltic coast. Aquat Mamm 14: 113−119
Teilmann J, Sveegaard S, Dietz R, Petersen IK, Berggren P,Desportes G (2008) High density areas for harbour por-poises in Danish waters. NERI Tech Rep No. 657,National Environmental Research Institute, University ofAarhus, Aarhus
Teilmann J, Sveegaard S, Dietz R (2011) Status of a harbourporpoise population — evidence of population separationand declining abundance. In: Sveegaard S (author) Spa-tial and temporal distribution of harbor porpoises in rela-tion to their prey. PhD thesis, Aarhus University, Aarhus,p 73−84
Verfuß UK, Miller LA, Schnitzler HU (2005) Spatial orienta-tion in echolocating harbour porpoises (Phocoena pho-coena). J Exp Biol 208: 3385−3394
Verfuß UK, Honnef CG, Meding A, Dähne M, Mundry R,Benke H (2007) Geographical and seasonal variation ofharbour porpoise (Phocoena phocoena) presence in theGerman Baltic Sea revealed by passive acoustic monitor-ing. J Mar Biol Assoc UK 87: 165−176
Verfuß UK, Honnef CG, Meding A, Dähne M, Adler S, KilianA, Benke H (2008a) The history of the German Baltic Sea
277
Endang Species Res 18: 265–278, 2012
harbour porpoise acoustic monitoring at the GermanOceanographic Museum. In: Wollny-Goerke K, Eskild-sen K (eds) Marine mammals and seabirds in front of off-shore wind energy. Teubner Verlag & GWV Fachver-lage, Wiesbaden, p 41−56
Verfuß UK, Dähne M, Diederichs A, Benke H (2008b) Appli-cations and analytical methods for T-POD developmentin environmental impact studies for wind farms: compa-rability and development of standard methods. In: EvansPGH (ed) Proceedings of the Workshop on ‘Wind farmsand marine mammals, 21st annual meetings of the Euro-pean Cetacean Society, April 22nd–25th 2007, SanSebastian, Spain. ECS Spec Pub Ser 49: 27−31
Verfuß UK, Miller LA, Pilz PKD, Schnitzler HU (2009) Echo -location by two foraging harbor porpoises (Phocoenaphocoena). J Exp Biol 212: 823−834
Westgate AJ, Read AJ, Berggren P, Koopmann HN, GaskinDE (1995) Diving behaviour of harbour porpoises, Pho-coena phocoena. Can J Fish Aquat Sci 52: 1064−1073
Wiemann A, Andersen LW, Berggren P, Siebert U and others(2010) Mitochondrial control region and microsatelliteanalyses on harbour porpoise (Phocoena phocoena)unravel population differentiation in the Baltic Sea andadjacent waters. Conserv Genet 11: 195−211
Wood SN (2004) Stable and efficient multiple smoothingparameter estimation for generalized additive models.J Am Stat Assoc 99: 673−686
Wood SN (2006) Generalized additive models — an intro-duction with R. Chapman & Hall/CRC, Boca Raton, FL
Zuur AF, Ieno EN, Walker NJ, Saveliev AA, Smith GM(2009) Mixed effects models and extension in ecology inR. Springer Science + Business Media, New York, NY
278
Editorial responsibility: Ana Cañadas, Madrid, Spain
Submitted: January 30, 2012; Accepted: July 5, 2012Proofs received from author(s): September 13, 2012