Embed Size (px)
Citation preview

1
Use of standardised outcome measures in adult mental health services: randomised controlled trial
Mike Slade Paul McCrone
Elizabeth Kuipers Morven Leese Sharon Cahill
Alberto Parabiaghi Stefan Priebe
Graham Thornicroft
2
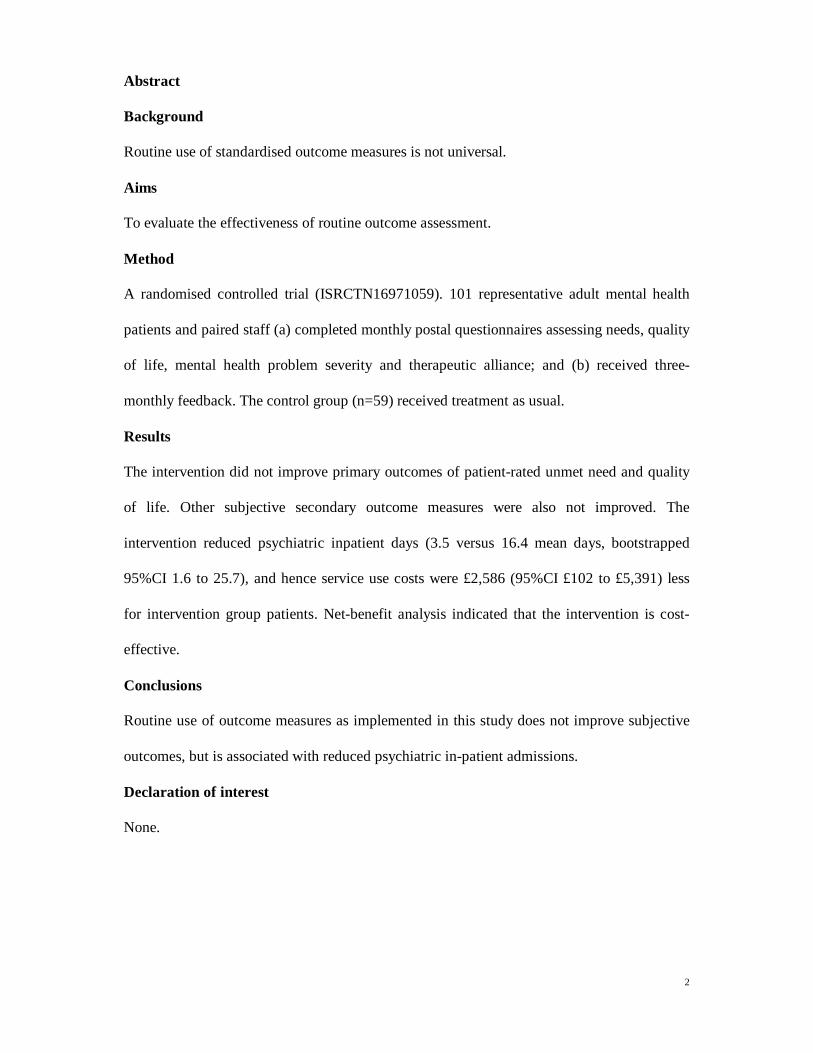
Abstract
Background
Routine use of standardised outcome measures is not universal.
Aims
To evaluate the effectiveness of routine outcome assessment.
Method
A randomised controlled trial (ISRCTN16971059). 101 representative adult mental health
patients and paired staff (a) completed monthly postal questionnaires assessing needs, quality
of life, mental health problem severity and therapeutic alliance; and (b) received three-
monthly feedback. The control group (n=59) received treatment as usual.
Results
The intervention did not improve primary outcomes of patient-rated unmet need and quality
of life. Other subjective secondary outcome measures were also not improved. The
intervention reduced psychiatric inpatient days (3.5 versus 16.4 mean days, bootstrapped
95%CI 1.6 to 25.7), and hence service use costs were £2,586 (95%CI £102 to £5,391) less
for intervention group patients. Net-benefit analysis indicated that the intervention is cost-
effective.
Conclusions
Routine use of outcome measures as implemented in this study does not improve subjective
outcomes, but is associated with reduced psychiatric in-patient admissions.
Declaration of interest
None.
3
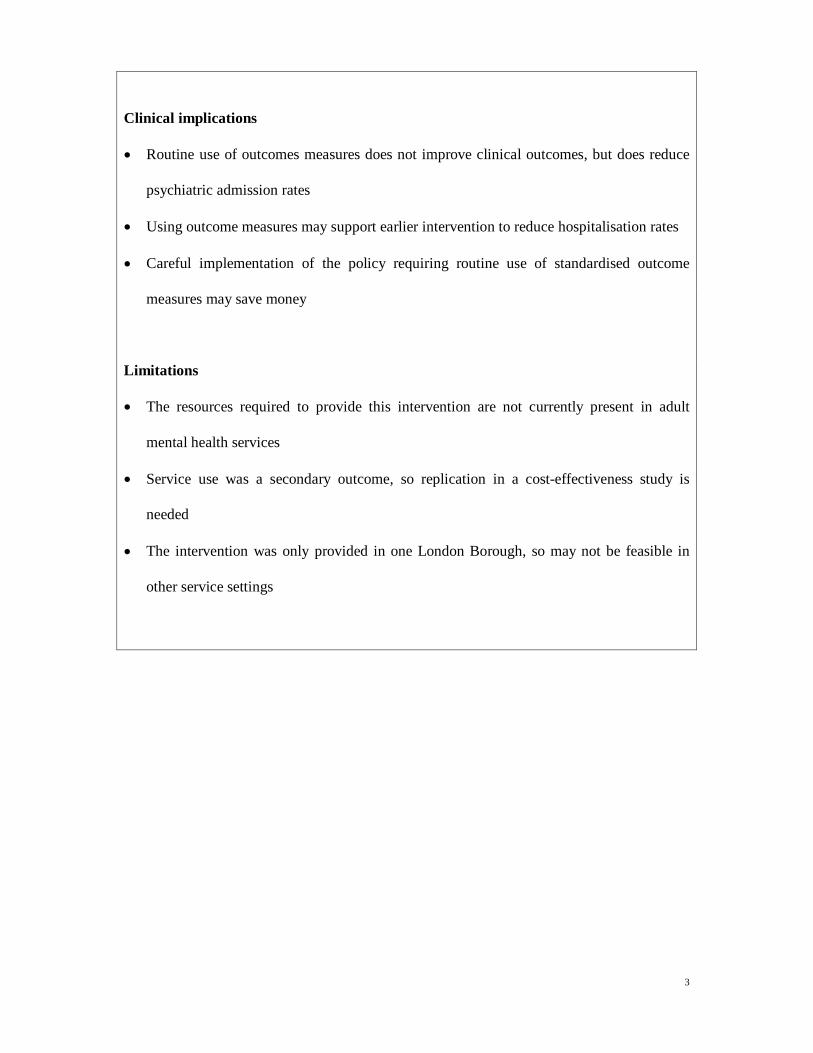
Clinical implications
• Routine use of outcomes measures does not improve clinical outcomes, but does reduce
psychiatric admission rates
• Using outcome measures may support earlier intervention to reduce hospitalisation rates
• Careful implementation of the policy requiring routine use of standardised outcome
measures may save money
Limitations
• The resources required to provide this intervention are not currently present in adult
mental health services
• Service use was a secondary outcome, so replication in a cost-effectiveness study is
needed
• The intervention was only provided in one London Borough, so may not be feasible in
other service settings
4
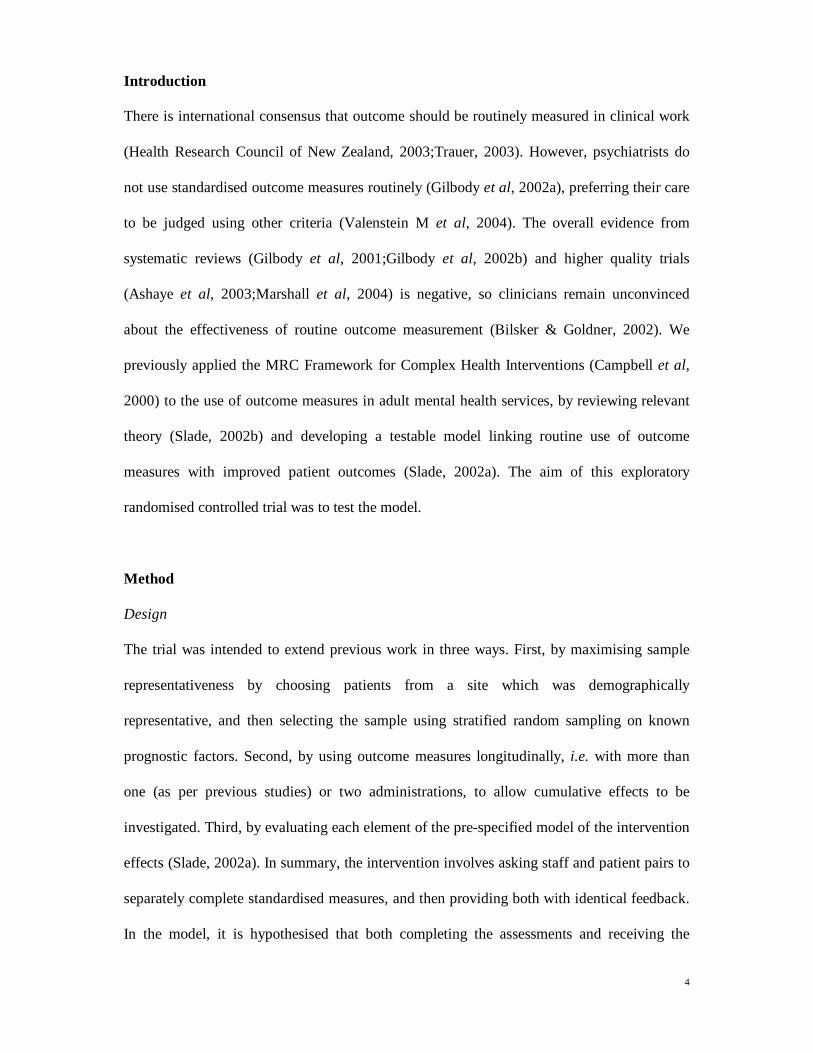
Introduction
There is international consensus that outcome should be routinely measured in clinical work
(Health Research Council of New Zealand, 2003;Trauer, 2003). However, psychiatrists do
not use standardised outcome measures routinely (Gilbody et al, 2002a), preferring their care
to be judged using other criteria (Valenstein M et al, 2004). The overall evidence from
systematic reviews (Gilbody et al, 2001;Gilbody et al, 2002b) and higher quality trials
(Ashaye et al, 2003;Marshall et al, 2004) is negative, so clinicians remain unconvinced
about the effectiveness of routine outcome measurement (Bilsker & Goldner, 2002). We
previously applied the MRC Framework for Complex Health Interventions (Campbell et al,
2000) to the use of outcome measures in adult mental health services, by reviewing relevant
theory (Slade, 2002b) and developing a testable model linking routine use of outcome
measures with improved patient outcomes (Slade, 2002a). The aim of this exploratory
randomised controlled trial was to test the model.
Method
Design
The trial was intended to extend previous work in three ways. First, by maximising sample
representativeness by choosing patients from a site which was demographically
representative, and then selecting the sample using stratified random sampling on known
prognostic factors. Second, by using outcome measures longitudinally, i.e. with more than
one (as per previous studies) or two administrations, to allow cumulative effects to be
investigated. Third, by evaluating each element of the pre-specified model of the intervention
effects (Slade, 2002a). In summary, the intervention involves asking staff and patient pairs to
separately complete standardised measures, and then providing both with identical feedback.
In the model, it is hypothesised that both completing the assessments and receiving the

5
feedback will create cognitive dissonance (an awareness of discrepancy between actual and
ideal states) regarding the content and process of care, which in turn leads to behavioural
change in content and process of care, and consequent improvement in outcome. Therefore
the two active ingredients are completion of outcome measures and receipt of feedback, and
the intervention may have an impact on patients as well as staff. Hence, in contrast to
previous studies in which staff received feedback on patient-completed assessments (Ashaye
et al, 2003;Marshall et al, 2004;van Os et al, 2004), in this model both staff and patients
complete assessments and receive feedback. The model has the advantage of being explicit
about the anticipated effects of the intervention, and therefore testable and falsifiable at each
stage.
Participants
The inclusion criteria for patients were: (a) they had been on the caseload of any of the 8
Community Mental Health Teams (CMHTs) in Croydon, South London on 1 May 2001 for
at least three months; and (b) they were aged between 18 and 64 inclusive. Croydon has a
nationally representative population of 319,000, with 3,500 patients using eight CMHTs. To
ensure epidemiological representativeness, sample selection involved stratified random
sampling on known prognostic factors: age (tertiles), gender, ethnicity (White versus Non-
White), diagnosis (psychosis versus other), and CMHT. One member of staff was then
identified who was working most closely with each selected patient.
Measures
The rationale for the choice of measures is reported elsewhere (Slade, 2002b). Staff
completed three measures in the postal questionnaire. The Threshold Assessment Grid (TAG)
is a 7-item assessment of the severity of a person’s mental health problems (range 0-24, low

6
score better) (Slade et al, 2000). The Camberwell Assessment of Need Short Appraisal
Schedule Staff version (CANSAS-S) is a 22-item assessment of unmet needs (current serious
problem, regardless of any help received) and met needs (no / moderate problem due to help
given) (range for both 0-22, low score better) (Slade et al, 1999). The Helping Alliance Scale
– Staff (HAS-S) is a 5-item assessment of therapeutic alliance (range 0-10, high score better)
(McCabe et al, 1999).
Patients completed three measures in the postal questionnaire. The CANSAS-P is a 22-item
assessment of met and unmet needs (scores as for CANSAS-S) (Slade et al, 1999). The
Manchester Short Assessment (MANSA) is a 12-item assessment of quality of life (range 1-
7, high score better) (Priebe et al, 1999). The HAS-P is a 6-item assessment of therapeutic
alliance (score as for HAS-S) (McCabe et al, 1999).
Three measures were assessed at baseline and follow-up only. The Brief Psychiatric Rating
Scale (BPRS) is an 18-item interviewer-rated assessment of symptomatology (range 0-126,
low score better) (Overall & Gorham, 1988). The Health of the Nation Outcome Scale
(HoNOS) is a 12-item staff-rated assessment of clinical problems and social functioning
(range 0-48, low score better) (Wing et al, 1998). The patient-rated Client Service Receipt
Inventory (CSRI) was used to assess service use during the previous six months (Beecham J
& Knapp, 2001).
Sample size
CANSAS-P and MANSA were the primary outcome measures, and a reduction of 1.0 unmet
needs in CANSAS-P or an increase of 0.25 in MANSA were defined in advance as the
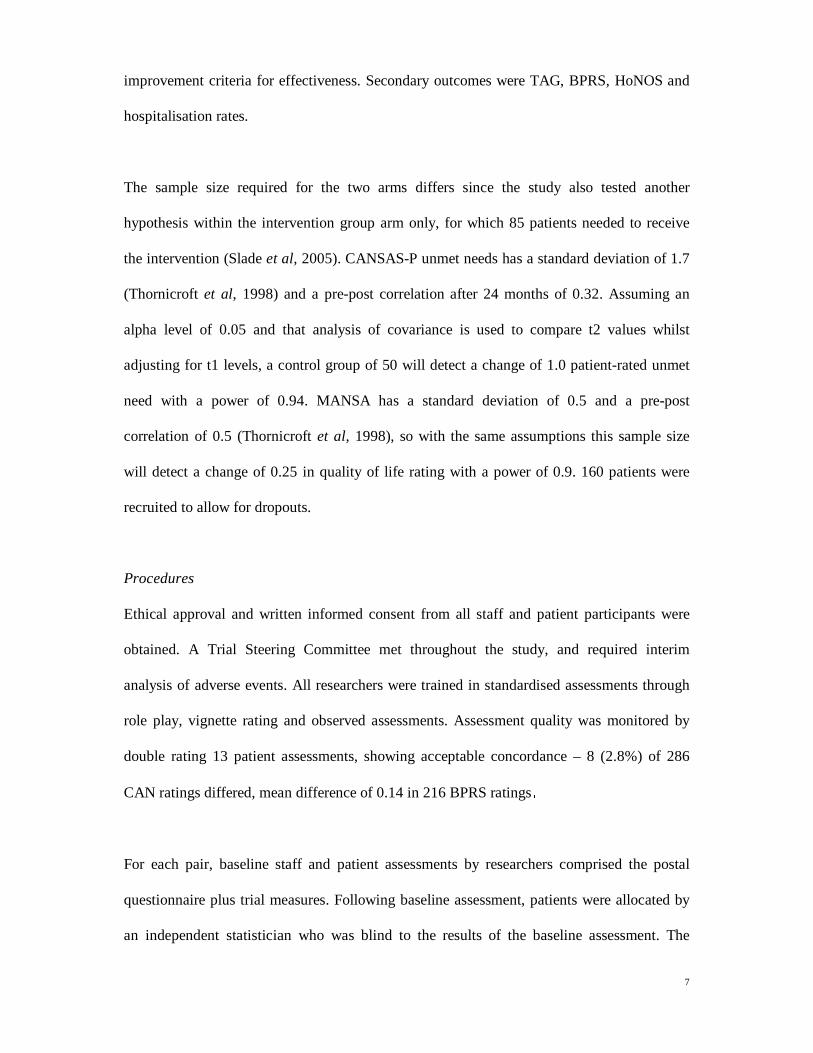
7
improvement criteria for effectiveness. Secondary outcomes were TAG, BPRS, HoNOS and
hospitalisation rates.
The sample size required for the two arms differs since the study also tested another
hypothesis within the intervention group arm only, for which 85 patients needed to receive
the intervention (Slade et al, 2005). CANSAS-P unmet needs has a standard deviation of 1.7
(Thornicroft et al, 1998) and a pre-post correlation after 24 months of 0.32. Assuming an
alpha level of 0.05 and that analysis of covariance is used to compare t2 values whilst
adjusting for t1 levels, a control group of 50 will detect a change of 1.0 patient-rated unmet
need with a power of 0.94. MANSA has a standard deviation of 0.5 and a pre-post
correlation of 0.5 (Thornicroft et al, 1998), so with the same assumptions this sample size
will detect a change of 0.25 in quality of life rating with a power of 0.9. 160 patients were
recruited to allow for dropouts.
Procedures
Ethical approval and written informed consent from all staff and patient participants were
obtained. A Trial Steering Committee met throughout the study, and required interim
analysis of adverse events. All researchers were trained in standardised assessments through
role play, vignette rating and observed assessments. Assessment quality was monitored by
double rating 13 patient assessments, showing acceptable concordance – 8 (2.8%) of 286
CAN ratings differed, mean difference of 0.14 in 216 BPRS ratings.
For each pair, baseline staff and patient assessments by researchers comprised the postal
questionnaire plus trial measures. Following baseline assessment, patients were allocated by
an independent statistician who was blind to the results of the baseline assessment. The
8
statistician used a purpose-written Stata program (StataCorp, 2003), to ensure random
allocation and balance on prognostic factors of age (tertiles), gender, ethnicity (White versus
Non-White), diagnosis (psychosis versus other), and CMHT. Allocation was concealed until
the intervention was assigned. Staff and patients were aware of their allocation status.
The control group received treatment-as-usual, involving mental health care from the
multidisciplinary CMHT focussed on mental health and social care needs, along with care
from the General Practitioner for physical health care needs.
The intervention group received treatment-as-usual, and in addition staff-patient pairs (i)
were separately asked to complete a monthly postal questionnaire; and (ii) were provided by
the research team with identical feedback by post at 3-monthly intervals. Feedback was sent
two weeks after round 3 and round 6 postal questionnaires. It comprised colour-coded
graphics and text, showing change over time and highlighting areas of disagreement. Patients
were paid £5 for each round of assessments.
Follow-up assessments were made at 7 months. At follow-up, patients were asked not to
disclose their status, and assignment was guessed by the researcher after the postal
questionnaire element. Staff and patient self-report data were collected on the cognitive and
behavioural impact of the intervention. Written care plans were audited at baseline and
follow-up.
Analysis
Differences in administration time were tested using paired sample t-tests, and between
patients with and without follow-up data using chi-squared and independent samples t-tests.
9
Data analysis was undertaken on an intention-to-treat basis, for all participants with follow-
up data. Effectiveness was investigated using independent samples t-tests to compare the
outcome at follow-up for intervention and control group patients. Sensitivity analyses were:
(i) analysis of covariance to adjust for the baseline level; (ii) analysis of covariance including
random effects for staff member and CMHT (to check for any clustering effects); (iii) t-test
on the outcomes, with missing values imputed from baseline data; and (iv) Mann-Whitney
tests.
A broad costing perspective was used. Production costs were not included. Service cost data
were obtained by combining CSRI data with unit cost information to generate service costs.
Most unit costs were taken from a published source (Netten A & Curtis L, 2002). Some
criminal justice unit costs were estimated specifically for the study: £100 per court
attendance and £50 per solicitor contact. Based on assessment processing time, the average
cost of providing the intervention was £400 per person. This was based on the assumption
that the two researchers employed on the study for two years provided two rounds of the
intervention to 100 patients, plus two assessments for 160 patients. It was further assumed
that the assessments entailed the same administrative time as the intervention. Per year
therefore each research worker could provide 130 assessments or interventions and the salary
cost of this is about £200 (i.e. £400 for both rounds of the intervention).
Mean number of service contacts (bed days for in-patient care) and costs at follow-up were
compared using regression analysis, with the allocation status and baseline service use or cost
entered as independent variables. Resource use data are typically skewed, so bootstrapping
with 1,000 repetitions was used to produce confidence intervals for cost differences (Netten
10
A & Curtis L, 2002). A sensitivity analysis was performed by assessing the significance of
the difference in total costs after excluding in-patient care.
Cost-effectiveness was investigated using the net-benefit analysis and cost-effectiveness
acceptability curves (not shown). Net-benefit analysis uses the equation Net Benefit =λO-SC,
where O = outcome, SC = service cost and λ = the value placed on one unit of outcome
(Briggs AH, 2001). λ is a hypothetical amount that would be problematic to determine, but
net benefits can be compared for different values of λ. This was done using regression
analysis (controlling for baseline costs), with the net benefits associated with λs between £0
and £90 used as the dependent variables, and allocation status used as the main independent
variable. For each regression, 1,000 bootstrap resamples were produced, and for each of these
the proportion of regression coefficients that were above zero indicated the probability that
the intervention was more cost-effective than the control condition.
Results
Participants
160 patients
were recruited between May 2001 and December 2002, with follow-up
completed by July 2003. Sociodemographic and baseline clinical assessments for patients are
shown in Table 1.
Insert Table 1 here
74 staff participated in baseline assessments, including 43 psychiatric nurses, 14 social
workers and 11 psychiatrists. Postal questionnaire completion rates for staff for rounds 2 to 6
were 78%, 71%, 67%, 59% and 58%. 486 staff postal questionnaires were sent and 325

11
(67%) returned. For patients the completion rates were 85%, 84%, 76%, 76% and 76%. 487
postal questionnaires were sent and 386 (79%) returned. Three-monthly summary feedback
was sent after round 3 to 96 (95%) staff-patient pairs, and after round 6 to 93 (92%) staff-
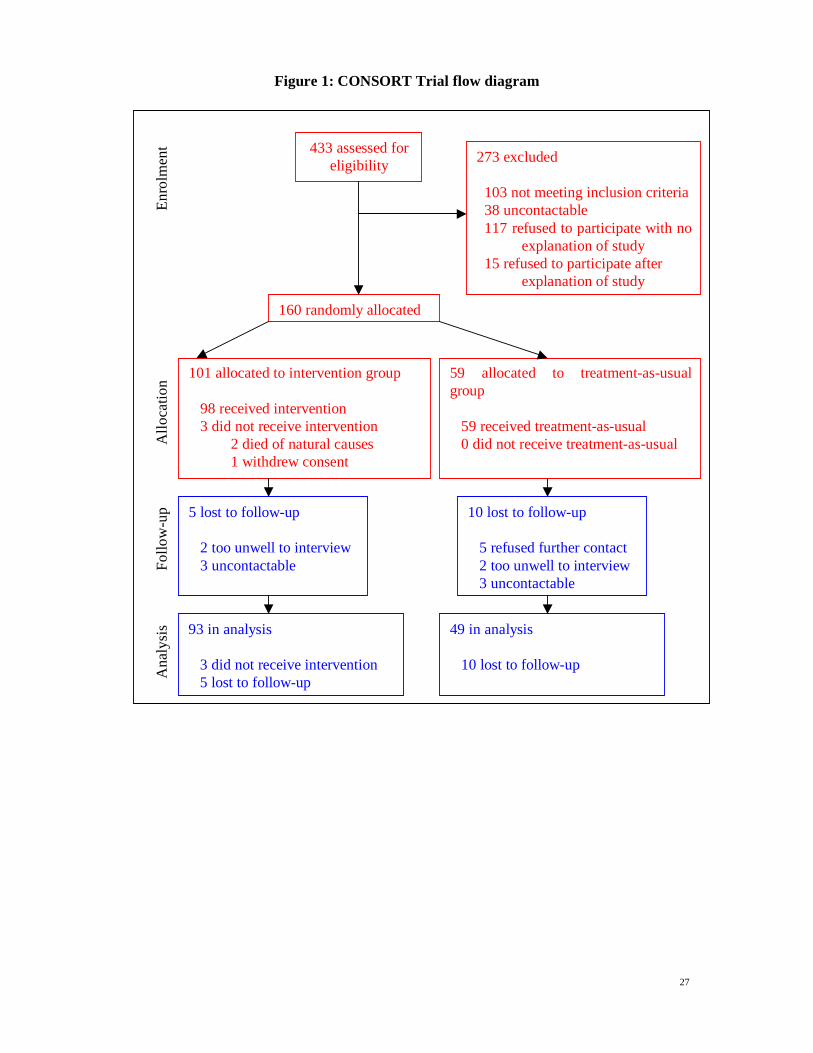
patient pairs. The trial flow diagram is shown in Figure 1.
Insert Figure 1 here
No demographic or baseline clinical variables differed between the 142 patients with and the
18 patients without full follow-up data (Figure 1).
There was a significant reduction in completion time by the 129 patients for whom
completion time data were available (14.9 to 8.7 minutes, p<0.001), but not for the 130 staff
with these data (7.8 to 7.4 minutes).
Some researcher blinding to allocation status was retained. In 81 (57%) of the 143 staff
12
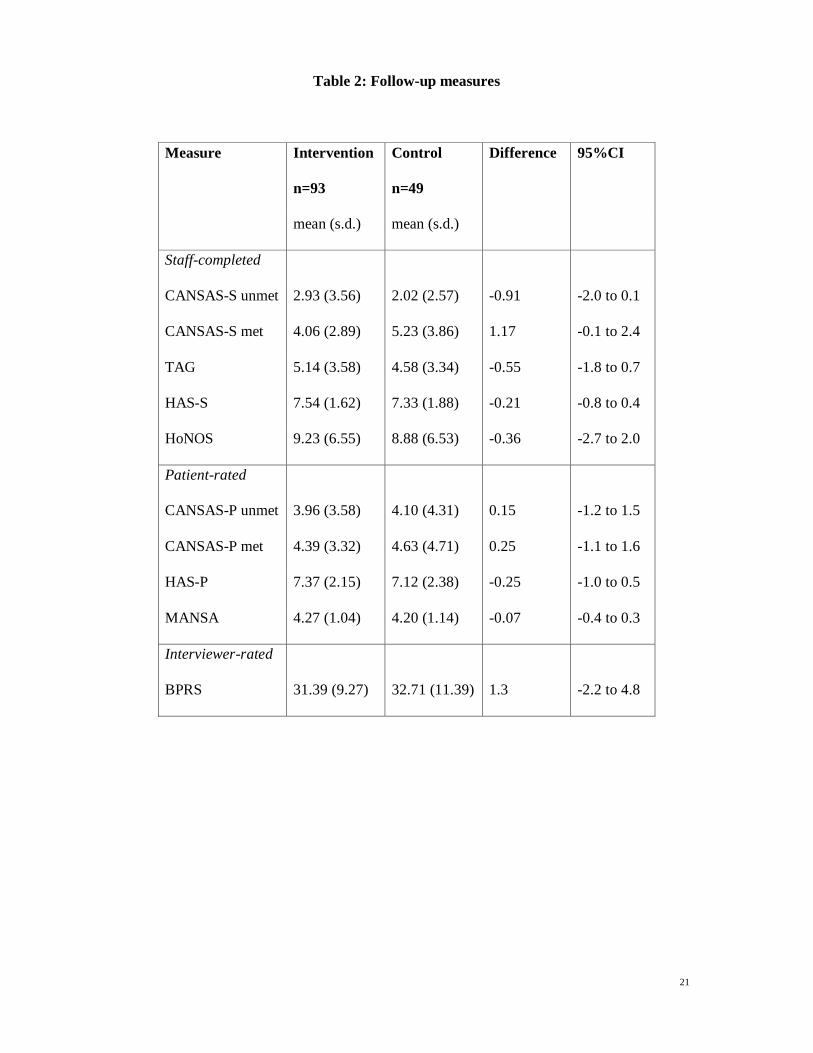
Follow-up assessments of the two primary outcomes are shown in Table 2.
Insert Table 2 here
For the 142 patients with baseline and follow-up patient-rated unmet need data, 79 (56%)
had at least 1 fewer unmet need at follow-up, comprising 51 (55%) out of 93 in the
intervention group and 28 (57%) out of 49 in the control group. There was no evidence for
differences between groups in mean follow-up patient-rated unmet need (mean difference =
0.15, 95%CI = -1.20 to 1.49, p=0.83). The sensitivity analyses all confirmed this conclusion.
There was no evidence for clustering due to staff (intraclass correlation 0.0) and a minimal
impact for CMHT (intraclass correlation 0.01).
For the 141 patients with baseline and follow-up quality of life data, 56 (40%) had a
MANSA rating at least 0.25 higher at follow-up, comprising 39 (42%) out of 92 in the
intervention group and 17 (35%) out of 49 in the control group. There was no evidence for
differences between groups in mean follow-up quality of life (mean difference = -0.07,
95%CI = -0.44 to 0.31, p=0.72). The sensitivity analyses all confirmed this conclusion.
Intraclass correlations were 0.078 for patients with the same staff member and 0.005 for
patients belonging to the same CMHT.
Secondary outcomes
There was no evidence for differences between groups for the three subjective secondary
outcomes: mental health problem severity (mean difference = 0.55, 95%CI = -1.8 to 0.7,
p=0.38), symptomatology (mean difference = 1.3, 95%CI = -2.2 to 4.8, p=0.46) or social
disability (mean difference = -0.4, 95%CI = -2.7 to 2.0, p=0.46).
13
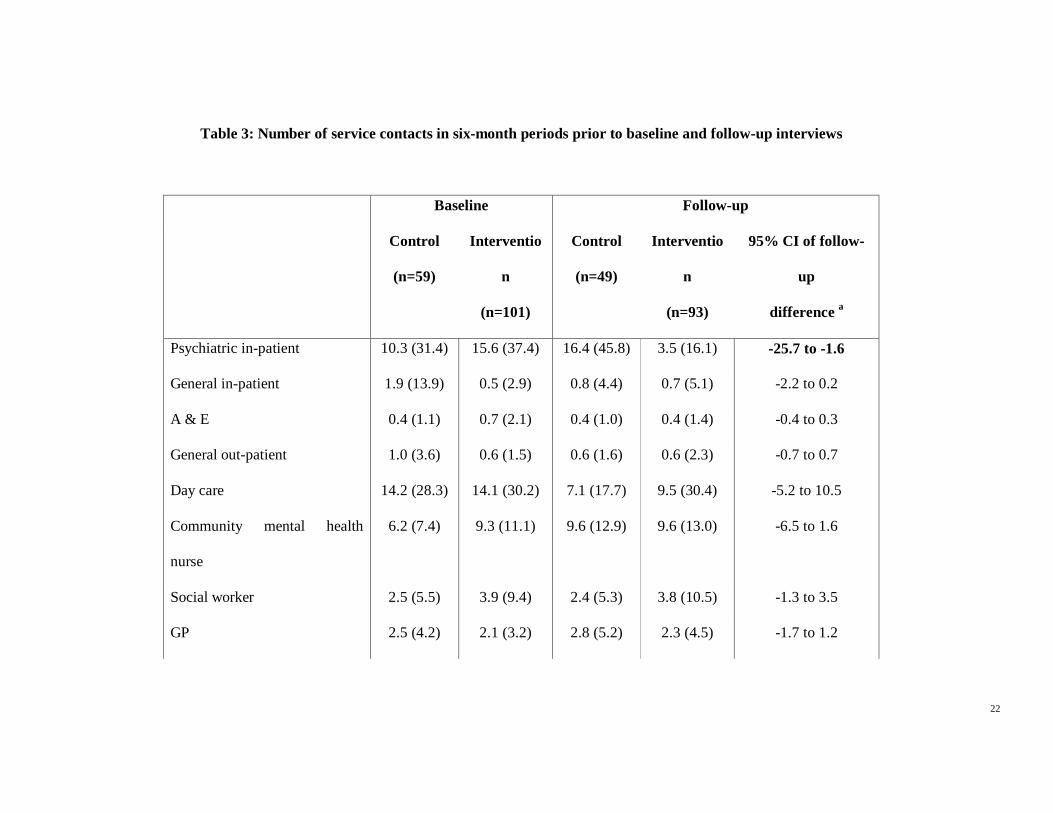
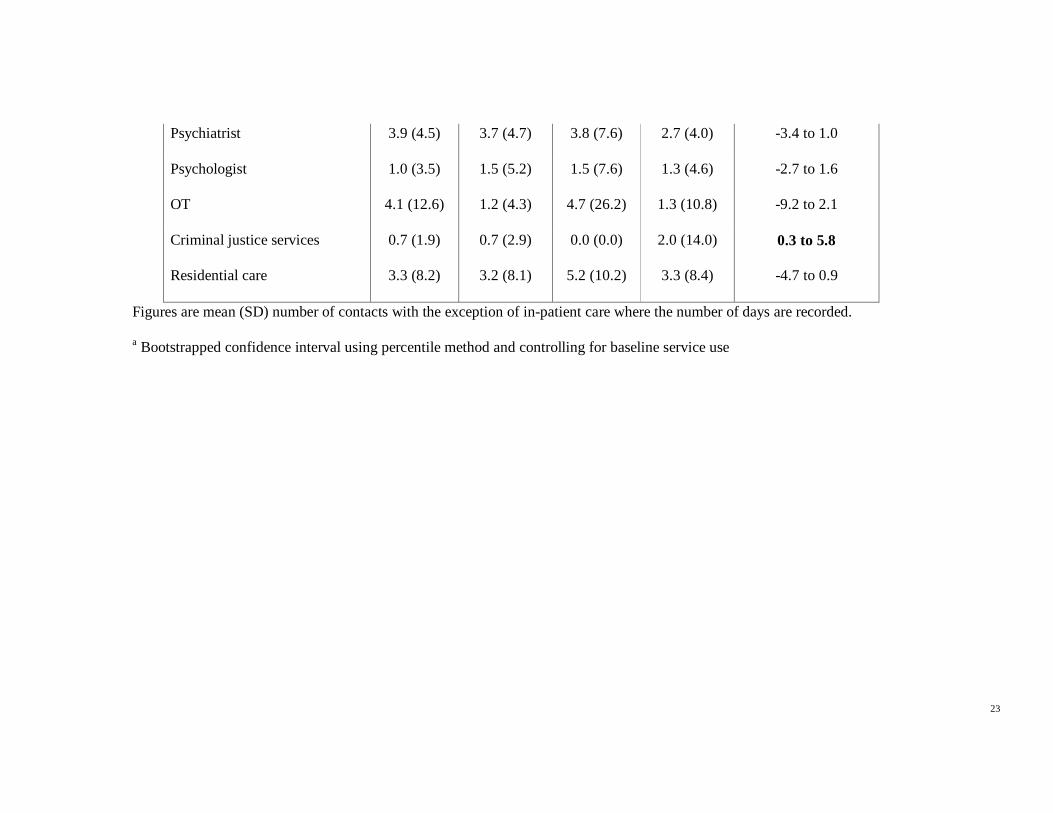
Service use is shown in Table 3.
Insert Table 3 here
Intervention group patients had reduced hospitalisation, with admissions in the six months
before follow-up being both fewer (means 0.13 versus 0.33, bootstrapped 95%CI -0.46 to --
0.04) and tending to be shorter (mean 3.5 days versus 10.0 days, bootstrapped 95%CI -16.4
to 1.5). Criminal justice service differences were due to one intervention group patient who
spent 121 days in prison.
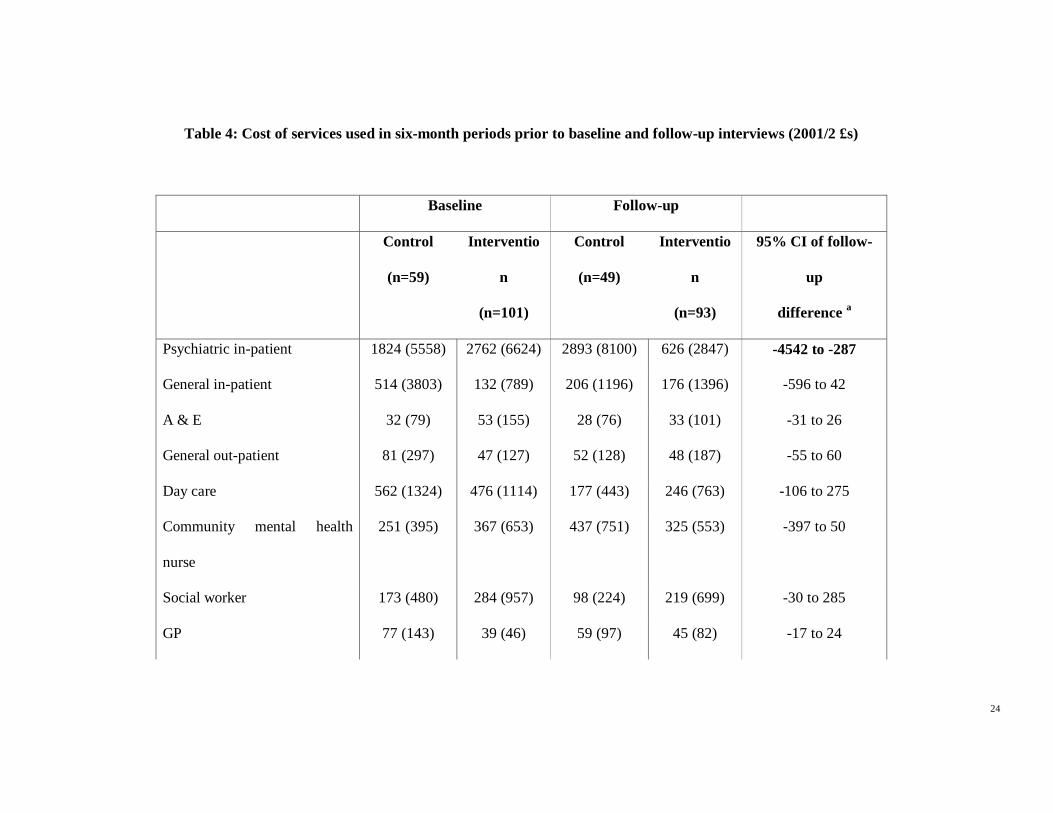
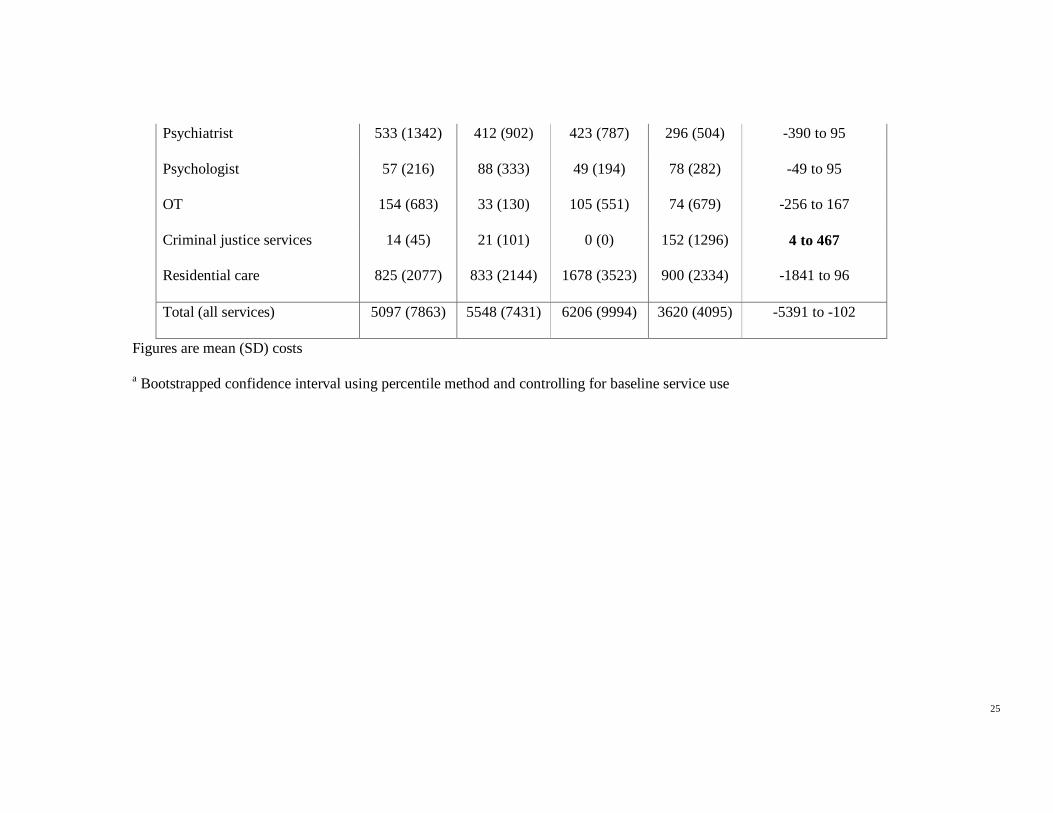
Table 4 shows the cost of services used.
Insert Table 4 here
Total costs increased by an average of £1,109 in the control group and fell by an average of
£1,928 in the intervention group. Follow-up costs were £2,586 less for the intervention
group. Most of the difference was due to reduced in-patient costs, and after excluding these
the mean total cost difference was £338 less for the intervention group, which was not
statistically significant (95% CI -£1,500 to £731).
Net-benefit analysis indicated that if no value is placed on improved quality of life, the
probability that the intervention is cost-effective is approximately 0.98, and any positive
value would raise this probability still higher. A positive value placed on a clinically
significant reduction in unmet needs would reduce the probability of the intervention being
14
cost-effective, as unmet needs were marginally less frequent in the control group. However,
the value would need to approach £1 million before there would be even a 60% chance that
the control condition was more cost-effective.
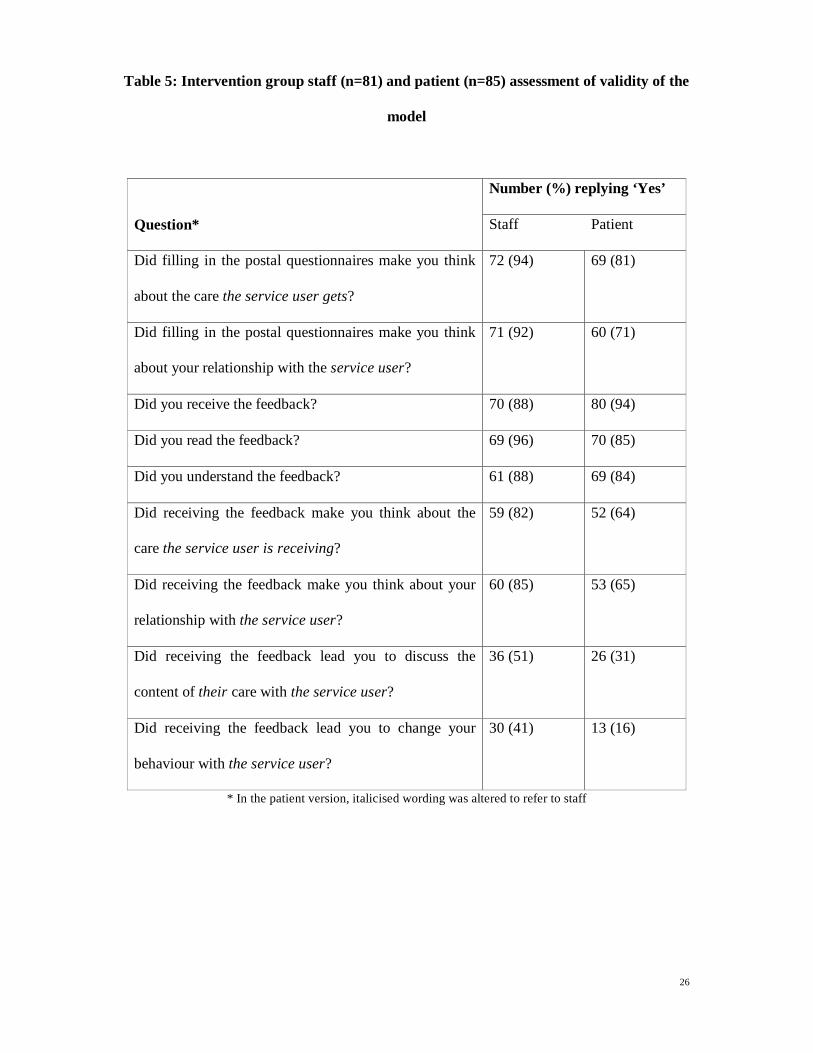
The cognitive and behavioural impacts of the intervention were investigated at follow-up,
and are shown in Table 5.
Insert Table 5 here
Care plan audit indicated no difference between baseline and follow-up for direct care
(possible range 0-10, intervention change 0.0, control change 0.7, difference in change 0.7,
95%CI –0.1 to 1.5), planned assessments (range 0-4, intervention change 0.2, control change
0.2, difference –0.1, 95%CI –0.4 to 0.3), referrals (range 0-3, intervention change 0.0,
control change 0.1, difference in change 0.1, 95%CI –0.3 to 0.5) and carer support (range 0-
6, intervention change 0.5, control change 0.5, difference 0.0, 95%CI –0.6 to 0.6).
Discussion
This randomised controlled trial evaluated the impact over seven months of monthly
assessment of important outcomes by staff and patients, plus feedback to both every three
months. Routine outcome assessment was not shown to be effective, since means of the
subjective outcomes were similar across the two groups. It was, however, associated with
cost savings, since patients receiving the intervention had fewer psychiatric admissions.
Subjective outcomes appear not to have changed because the intervention was unsuccessful
at promoting behaviour change.
15
Unchanged subjective outcomes
Subjective outcomes did not significantly improve, so the model did not accurately predict
the impact of the intervention. On the basis of their self-report at follow-up, most staff and
patients were prompted to consider the process and content of care both by completing the
assessments and considered the feedback. However, self-report and care plan audits indicate
that behaviour did not change as a result.
The intervention was not entirely implemented as planned, since the turnover of staff was
high – 41 (26%) patients had a different member of staff at 7-month follow-up, including 29
(29%) from the intervention group. This may have invalidated some of the intended process-
related mechanisms of action. Similarly, there was a progressive reduction in staff return
rates, which may indicate a growing lack of enthusiasm if the feedback was not perceived as
useful.
More generally, improvement in subjective outcomes may require greater attention to the
context of the intervention (Iles & Sutherland, 2001). A service whose shared beliefs are
congruent with the use of outcome measures is necessary if the intervention is not to be
‘swimming against the tide’. This will involve changing organisational beliefs and working
practices, the need for research programmes rather than isolated research studies, and
demonstration sites (Nutley et al, 2003). A demonstration site in this context would be a
service which uses outcome measures as a routine element of care on an ongoing basis. What
would such a service look like? The characteristics of such a service would be a focus on the
patient’s perspective in assessment, the systematic identification of the full range of health
and social care needs of the patient, the development of innovative services to address these
needs, and the evaluation of the success of the service in terms of impact on quality of life.
16
The intervention also needs to be more tailored to fostering behaviour change - identifying
topics which the patient would like to discuss with staff (van Os et al, 2004), or providing
(and auditing for level of implementation) more prescriptive advice for staff action (Lambert
et al, 2001). The feedback was provided every three months, which may have been too long a
gap – feedback may need to be more prompt (Lambert et al, 2001;Bickman et al,
2000;Hodges & Wotring, 2004).
However, the objective criterion of admission rates did improve, and so some aspects of
behaviour did change. This is now considered.
Reduced admissions
Why were admissions reduced? Reduced in-patient use and costs may be due to earlier or
different actions. Staff received regular clinical information about intervention patients,
possibly triggering earlier support and hence avoiding the need for admission. This could be
investigated by assessing whether the time between prodromal indications of relapse and key-
worker awareness of the need for increased support is reduced when outcome information is
routinely collected and available to staff.
Furthermore, staff had more information about intervention than control group patients.
Since decisions to admit patients are made using the best clinical information available, there
may have been a marginal raising of admission threshold for intervention patients. Further
attention needs to be given to the influences which alter thresholds for in-patient admission.
17
Finally, the way in which the feedback is used by patients and staff needs to be investigated,
for example using qualitative methodologies such as conversation analysis (McCabe et al,
2002).
Limitations
Service use data were obtained via patient self-report, which may be unreliable. However, a
number of studies have found an adequate correlation between self-report data and
information collected by service providers (Goldberg RW et al, 2002;Caslyn RJ et al, 1993).
Neither patients nor staff were blind to allocation status. Researchers conducting the follow-
up interviews were partially blind – they guessed allocation status correctly for 38% of staff
and for 68% of patients.
46 (78%) of the 59 patients in the control group had a member of staff who also had an
intervention group patient, indicating that contamination was possible between the two
groups. A solution to contamination problems would have been cluster randomisation by
CMHT. Cluster randomised controlled trials overcome some of the theoretical, ethical and
practical problems of investigating mental health services (Gilbody & Whitty, 2002),
although they are more complex to design, and require larger samples and more complex
analysis (campbell et al, 2004). On the basis of intraclass correlations in this study, a cluster
trial randomising by CMHT would require an increase of 20% in the sample size.
Randomisation by staff member would entail an increase of 10%.
Finally, the follow-up period of 7 months may not have been long enough to capture all
potential service use changes brought about by the intervention.
18
Implications for clinicians and policy-makers
This study demonstrates that it is feasible to implement a carefully developed approach to
routine outcome assessment in mental health services. The staff response rate over the 7
rounds of assessment was 67%, the patient response rate was 79%, and 92% of the
intervention group received two rounds of feedback. Furthermore, 84% of staff and patients
received, read and understood the feedback.
The intervention costs around £400 per person, which for a primary care trust with a caseload
of 3,500 people would equate to around £1.4 million. However, the results of this study
suggest that this cost could be more than offset by savings in service use.
This study is the first investigation of the use of standardised outcome measures over time in
a representative adult mental health sample. As with previous studies (Marshall et al,
2004;Ashaye et al, 2003), subjective outcomes did not improve. However, a carefully
developed and implemented approach to routinely collecting and using outcome data has
been shown to reduce admissions, and consequently save money.
Acknowledgements
Ian White was the trial statistician. The study was funded by the Medical Research Council
through a Clinician Scientist Fellowship (G108/390).
19
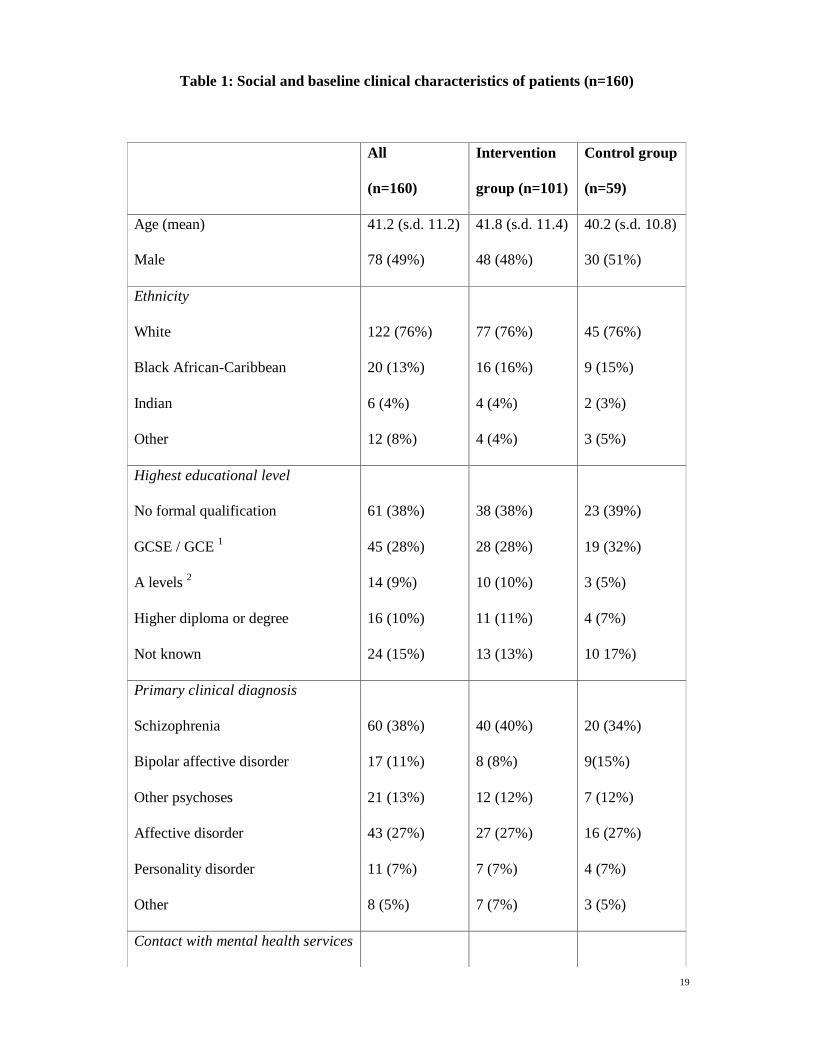
Table 1: Social and baseline clinical characteristics of patients (n=160)
All
(n=160)
Intervention
group (n=101)
Control group
(n=59)
Age (mean) 41.2 (s.d. 11.2) 41.8 (s.d. 11.4) 40.2 (s.d. 10.8)
Male 78 (49%) 48 (48%) 30 (51%)
Ethnicity
White 122 (76%) 77 (76%) 45 (76%)
Black African-Caribbean 20 (13%) 16 (16%) 9 (15%)
Indian 6 (4%) 4 (4%) 2 (3%)
Other 12 (8%) 4 (4%) 3 (5%)
Highest educational level
No formal qualification 61 (38%) 38 (38%) 23 (39%)
GCSE / GCE 1 45 (28%) 28 (28%) 19 (32%)
A levels 2 14 (9%) 10 (10%) 3 (5%)
Higher diploma or degree 16 (10%) 11 (11%) 4 (7%)
Not known 24 (15%) 13 (13%) 10 17%)
Primary clinical diagnosis
Schizophrenia 60 (38%) 40 (40%) 20 (34%)
Bipolar affective disorder 17 (11%) 8 (8%) 9(15%)
Other psychoses 21 (13%) 12 (12%) 7 (12%)
Affective disorder 43 (27%) 27 (27%) 16 (27%)
Personality disorder 11 (7%) 7 (7%) 4 (7%)
Other 8 (5%) 7 (7%) 3 (5%)
Contact with mental health services
20
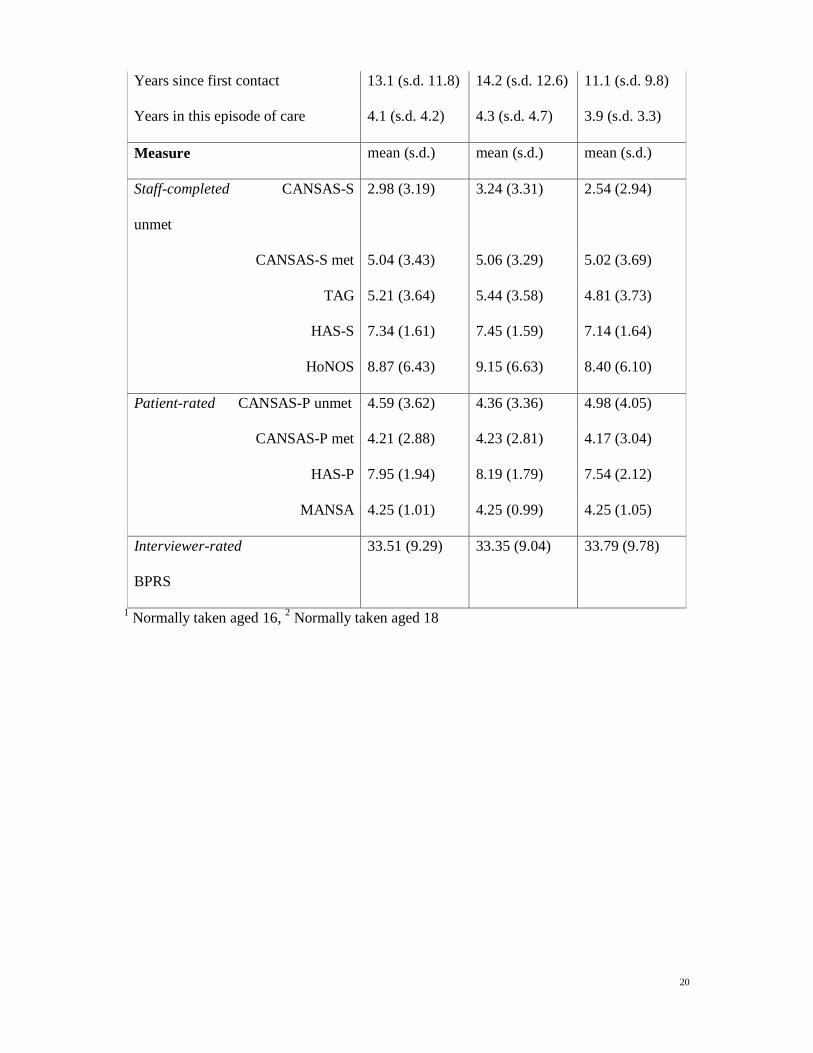
Years since first contact 13.1 (s.d. 11.8) 14.2 (s.d. 12.6) 11.1 (s.d. 9.8)
Years in this episode of care 4.1 (s.d. 4.2) 4.3 (s.d. 4.7) 3.9 (s.d. 3.3)
Measure mean (s.d.) mean (s.d.) mean (s.d.)
Staff-completed CANSAS-S
unmet
2.98 (3.19) 3.24 (3.31) 2.54 (2.94)
CANSAS-S met 5.04 (3.43) 5.06 (3.29) 5.02 (3.69)
TAG 5.21 (3.64) 5.44 (3.58) 4.81 (3.73)
HAS-S 7.34 (1.61) 7.45 (1.59) 7.14 (1.64)
HoNOS 8.87 (6.43) 9.15 (6.63) 8.40 (6.10)
Patient-rated CANSAS-P unmet 4.59 (3.62) 4.36 (3.36) 4.98 (4.05)
CANSAS-P met 4.21 (2.88) 4.23 (2.81) 4.17 (3.04)
HAS-P 7.95 (1.94) 8.19 (1.79) 7.54 (2.12)
MANSA 4.25 (1.01) 4.25 (0.99) 4.25 (1.05)
Interviewer-rated
BPRS
33.51 (9.29) 33.35 (9.04) 33.79 (9.78)
1 Normally taken aged 16, 2 Normally taken aged 18
21
Table 2: Follow-up measures
Measure Intervention
n=93
Control
n=49
Difference 95%CI
mean (s.d.) mean (s.d.)
Staff-completed
CANSAS-S unmet 2.93 (3.56) 2.02 (2.57) -0.91 -2.0 to 0.1
CANSAS-S met 4.06 (2.89) 5.23 (3.86) 1.17 -0.1 to 2.4
TAG 5.14 (3.58) 4.58 (3.34) -0.55 -1.8 to 0.7
HAS-S 7.54 (1.62) 7.33 (1.88) -0.21 -0.8 to 0.4
HoNOS 9.23 (6.55) 8.88 (6.53) -0.36 -2.7 to 2.0
Patient-rated
CANSAS-P unmet 3.96 (3.58) 4.10 (4.31) 0.15 -1.2 to 1.5
CANSAS-P met 4.39 (3.32) 4.63 (4.71) 0.25 -1.1 to 1.6
HAS-P 7.37 (2.15) 7.12 (2.38) -0.25 -1.0 to 0.5
MANSA 4.27 (1.04) 4.20 (1.14) -0.07 -0.4 to 0.3
Interviewer-rated
BPRS 31.39 (9.27) 32.71 (11.39) 1.3 -2.2 to 4.8
22
Table 3: Number of service contacts in six-month periods prior to baseline and follow-up interviews
Baseline Follow-up
Control
(n=59)
Interventio
n
(n=101)
Control
(n=49)
Interventio
n
(n=93)
95% CI of follow-
up
difference a
Psychiatric in-patient 10.3 (31.4) 15.6 (37.4) 16.4 (45.8) 3.5 (16.1) -25.7 to -1.6
General in-patient 1.9 (13.9) 0.5 (2.9) 0.8 (4.4) 0.7 (5.1) -2.2 to 0.2
A & E 0.4 (1.1) 0.7 (2.1) 0.4 (1.0) 0.4 (1.4) -0.4 to 0.3
General out-patient 1.0 (3.6) 0.6 (1.5) 0.6 (1.6) 0.6 (2.3) -0.7 to 0.7
Day care 14.2 (28.3) 14.1 (30.2) 7.1 (17.7) 9.5 (30.4) -5.2 to 10.5
Community mental health
nurse
6.2 (7.4) 9.3 (11.1) 9.6 (12.9) 9.6 (13.0) -6.5 to 1.6
Social worker 2.5 (5.5) 3.9 (9.4) 2.4 (5.3) 3.8 (10.5) -1.3 to 3.5
GP 2.5 (4.2) 2.1 (3.2) 2.8 (5.2) 2.3 (4.5) -1.7 to 1.2
23
Psychiatrist 3.9 (4.5) 3.7 (4.7) 3.8 (7.6) 2.7 (4.0) -3.4 to 1.0
Psychologist 1.0 (3.5) 1.5 (5.2) 1.5 (7.6) 1.3 (4.6) -2.7 to 1.6
OT 4.1 (12.6) 1.2 (4.3) 4.7 (26.2) 1.3 (10.8) -9.2 to 2.1
Criminal justice services 0.7 (1.9) 0.7 (2.9) 0.0 (0.0) 2.0 (14.0) 0.3 to 5.8
Residential care 3.3 (8.2) 3.2 (8.1) 5.2 (10.2) 3.3 (8.4) -4.7 to 0.9
Figures are mean (SD) number of contacts with the exception of in-patient care where the number of days are recorded.
a Bootstrapped confidence interval using percentile method and controlling for baseline service use
24
Table 4: Cost of services used in six-month periods prior to baseline and follow-up interviews (2001/2 £s)
Baseline Follow-up
Control
(n=59)
Interventio
n
(n=101)
Control
(n=49)
Interventio
n
(n=93)
95% CI of follow-
up
difference a
Psychiatric in-patient 1824 (5558) 2762 (6624) 2893 (8100) 626 (2847) -4542 to -287
General in-patient 514 (3803) 132 (789) 206 (1196) 176 (1396) -596 to 42
A & E 32 (79) 53 (155) 28 (76) 33 (101) -31 to 26
General out-patient 81 (297) 47 (127) 52 (128) 48 (187) -55 to 60
Day care 562 (1324) 476 (1114) 177 (443) 246 (763) -106 to 275
Community mental health
nurse
251 (395) 367 (653) 437 (751) 325 (553) -397 to 50
Social worker 173 (480) 284 (957) 98 (224) 219 (699) -30 to 285
GP 77 (143) 39 (46) 59 (97) 45 (82) -17 to 24
25
Psychiatrist 533 (1342) 412 (902) 423 (787) 296 (504) -390 to 95
Psychologist 57 (216) 88 (333) 49 (194) 78 (282) -49 to 95
OT 154 (683) 33 (130) 105 (551) 74 (679) -256 to 167
Criminal justice services 14 (45) 21 (101) 0 (0) 152 (1296) 4 to 467
Residential care 825 (2077) 833 (2144) 1678 (3523) 900 (2334) -1841 to 96
Total (all services) 5097 (7863) 5548 (7431) 6206 (9994) 3620 (4095) -5391 to -102
Figures are mean (SD) costs
a Bootstrapped confidence interval using percentile method and controlling for baseline service use
26
Table 5: Intervention group staff (n=81) and patient (n=85) assessment of validity of the
model
Number (%) replying ‘Yes’
Question* Staff Patient
Did filling in the postal questionnaires make you think
about the care the service user gets?
72 (94) 69 (81)
Did filling in the postal questionnaires make you think
about your relationship with the service user?
71 (92) 60 (71)
Did you receive the feedback? 70 (88) 80 (94)
Did you read the feedback? 69 (96) 70 (85)
Did you understand the feedback? 61 (88) 69 (84)
Did receiving the feedback make you think about the
care the service user is receiving?
59 (82) 52 (64)
Did receiving the feedback make you think about your
relationship with the service user?
60 (85) 53 (65)
Did receiving the feedback lead you to discuss the
content of their care with the service user?
36 (51) 26 (31)
Did receiving the feedback lead you to change your
behaviour with the service user?
30 (41) 13 (16)
* In the patient version, italicised wording was altered to refer to staff
27
Figure 1: CONSORT Trial flow diagram
433 assessed for eligibility
160 randomly allocated
273 excluded 103 not meeting inclusion criteria 38 uncontactable 117 refused to participate with no explanation of study 15 refused to participate after explanation of study
101 allocated to intervention group 98 received intervention 3 did not receive intervention 2 died of natural causes 1 withdrew consent
59 allocated to treatment-as-usual group 59 received treatment-as-usual 0 did not receive treatment-as-usual
5 lost to follow-up 2 too unwell to interview 3 uncontactable
10 lost to follow-up 5 refused further contact 2 too unwell to interview 3 uncontactable
93 in analysis 3 did not receive intervention 5 lost to follow-up
49 in analysis 10 lost to follow-up
Enr
olm
ent
All
ocat
ion
Follo
w-u
p A
naly
sis
28
References
Ashaye,O.A., Livingston,G., & Orrell,M.W. (2003) Does standardized needs assessment improve the outcome of psychiatric day hospital care for older people? A randomized controlled trial. Aging and Mental Health, 7, 195-199.
Beecham J & Knapp,M. (2001) Costing psychiatric interventions. Measuring mental health needs (ed. by G. Thornicroft), pp. 200-224. Gaskell, London.
Bickman,L., Rosof-Williams,J., Salzer,M., Summerfelt,W., Noser,K., Wilson,S., & Karver,M. (2000) What information do clinicians value for monitoring adolescent client progress and outcomes? Professional Psychology: Research and Practice, 31, 70-74.
Bilsker,D. & Goldner,E.M. (2002) Routine outcome measurement by mental health-care providers: is it worth doing? Lancet, 360, 1689-1690.
Briggs AH (2001) Bayesian approach to stochastic cost-effectiveness analysis. International Journal of Technology Assessment in Health Care, 17, 69-82.
Campbell,J., Fitzpatrick,R., Haines,A., Kinmouth,A.L., Sandercock,P., Spiegelhalter,D., & Tyrer,P. (2000) Framework for design and evaluation of complex interventions to improve health. British Medical Journal, 321, 694-696.
campbell,M., Elbourne,D., Altman,D., & for the CONSORT Group (2004) CONSORT statement: extension to cluster randomised trials. BMJ, 328, 702-708.
Caslyn RJ, Allen G, Morse GA, & Smith R (1993) Can you trust self-report data provided by homeless mentally ill individuals? Evaluation Review, 17, 353-366.
Gilbody,S.M., House,A.O., & Sheldon,T.A. (2002a) Psychiatrists in the UK do not use outcome measures. British Journal of Psychiatry, 180, 101-103.
Gilbody,S.M., House,A.O., & Sheldon,T.A. (2002b) Routine administration of Health Related Quality of Life (HRQoL) and needs assessment instruments to improve psychological outcome – a systematic review. Psychological Medicine, 322, 406-409.
Gilbody,S.M., House,A.O., & Sheldon,T.A. (2001) Routinely administered questionnaires for depression and anxiety: systematic review. British Medical Journal, 322, 406-409.
Gilbody,S.M. & Whitty,P. (2002) Improving the delivery and organisation of mental health services: beyond the conventional randomised controlled trial. British Journal of Psychiatry, 180, 13-18.
Goldberg RW, Seybolt DC, & Lehman A (2002) Reliable self-report of health service use by individuals with serious mental illness. Psychiatric Services, 53, 879-881.
Health Research Council of New Zealand (2003) Partnerships for Evidence-Based Policy and Practice, HRCNZ, Auckland.
29
Hodges,K. & Wotring,J. (2004) The Role of Monitoring Outcomes in Initiating Implementation of Evidence-Based Treatments at the State Level. Psychiatric Services, 55, 396-400.
Iles,V. & Sutherland,K. (2001) Organisational Change, National Co-ordinating Centre for Service Development and Organisation, London.
Lambert,M.J., Hansen,N.B., & Finch,A. (2001) Patient focused research: using patient outcome data to enhance treatment effects. Journal of Consulting and Clinical Psychology, 69, 159-172.
Marshall,M., Lockwood,A., GREEN,G., AJAC-ROLES,G., Roberts,C., & Harrison,G. (2004) Systematic assessments of need and care planning in severe mental illness: Cluster randomised controlled trial. British Journal of Psychiatry, 185, 163-168.
McCabe,R., Heath C, Burns,T., & Priebe,S. (2002) Engagement of patients with psychosis in the consultation. BMJ, 325, 1148-1151.
McCabe,R., Roeder-Wanner,U.-U., Hoffman,K., & Priebe,S. (1999) Therapeutic relationships and quality of life: Association of two subjective constructs in schizophrenia patients. International Journal of Social Psychiatry, 45, 276-283.
Netten A & Curtis L (2002) Unit costs of health & social care, PSSRU, Canterbury.
Nutley,S., Percy-Smith,J., & Solesbury,W. (2003) Models of research impact, Learning and Skills Research Centre, London.
Overall,J.E. & Gorham,D.R. (1988) The Brief Psychiatric Rating Scale (BPRS): Recent Developments in Ascertainment and Scaling. Psychopharmacology Bulletin, 24, 97-99.
Priebe,S., Huxley,P., Knight,S., & Evans,S. (1999) Application and results of the Manchester Short Assessment of quality of life. International Journal of Social Psychiatry, 45, 7-12.
Slade,M. (2002a) Routine outcome assessment in mental health services. Psychological Medicine, 32, 1339-1344.
Slade,M. (2002b) What outcomes to measure in routine mental health services, and how to assess them – a systematic review. Australian and New Zealand Journal of Psychiatry, 36, 743-753.
Slade,M., Leese,M., Cahill,S., Thornicroft,G., & Kuipers,E. (2005) Meeting mental health needs causes quality of life to improve. British Journal of Psychiatry, in press.
Slade,M., Loftus,L., Phelan,M., Thornicroft,G., & Wykes,T. (1999) The Camberwell Assessment of Need, Gaskell, London.
Slade,M., Powell,R., Rosen,A., & Strathdee,G. (2000) Threshold Assessment Grid (TAG): the development of a valid and brief scale to assess the severity of mental illness. Social Psychiatry and Psychiatric Epidemiology, 35, 78-85.
StataCorp. Stata Statistical Software: Release 8. 2003. College Station, TX, StataCorp LP.
30
Ref Type: Computer Program
Thornicroft,G., Strathdee,G., Phelan,M., Holloway,F., Wykes,T., Dunn,G., McCrone,P., Leese,M., Johnson,S., & Szmukler,G. (1998) PRiSM Psychosis Study: Rationale and design. British Journal of Psychiatry, 173, 363-370.
Trauer,T. (2003) Routine outcome measurement by mental health-care providers. Lancet, 361, 1137.
Valenstein M, Mitchinson A, Ronis DL, Alexander JA, Duffy SA, Craig TJ, & Barry KL (2004) Quality Indicators and Monitoring of Mental Health Services: What Do Frontline Providers Think? American Journal of Psychiatry, 161, 146-153.
van Os,J., Altamura,A.C., Bobes,J., Owens,D.C., Gerlach,J., Hellewell,J.S.E., Kasper,S., Naber,D., & Robert,P. (2004) Evaluation of the Two-Way Communication Checklist as a clinical intervention. British Journal of Psychiatry, 184, 79-83.
Wing,J.K., Beevor,A.S., Curtis,R.H., Park,S.B., Hadden,S., & Burns,A. (1998) Health of the Nation Outcome Scales (HoNOS) – Research and Development. British Journal of Psychiatry, 172, 11-18.

31
Mike Slade PhD Health Services Research Department (Box P029), Institute of Psychiatry, King’s College London, London SE5 8AF, UK Paul McCrone PhD Health Services Research Department (Box P024), Institute of Psychiatry, King’s College London, London SE5 8AF, UK Elizabeth Kuipers PhD Department of Psychology (Box P077), Institute of Psychiatry, King’s College London, London SE5 8AF, UK Morven Leese PhD Health Services Research Department (Box P029), Institute of Psychiatry, King’s College London, London SE5 8AF, UK Sharon Cahill PhD Department of Psychology, University of East London, London E15 4LZ, UK Alberto Parabiaghi MD Health Services Research Department (Box P029), Institute of Psychiatry, King’s College London, London SE5 8AF, UK Stefan Priebe PhD Department of Psychiatry, Queen Mary, University of London, Newham Centre for Mental Health, Glen Road, London E13 8SP, UK Graham Thornicroft PhD Health Services Research Department (Box P029), Institute of Psychiatry, King’s College London, London SE5 8AF, UK Correspondence to: Dr Mike Slade, Health Services Research Department (Box P029), Institute of Psychiatry, King’s College London, London SE5 8AF, UK Tel: +44 (0) 20 7848 0795; Fax: +44 (0) 20 7277 1462; e-mail: [email protected]