Embed Size (px)
Citation preview
J.E. Raymond
Use of Stable Isotopes to Trace the Fate of Applied Nitrogen in Forest
Plantations to Evaluate Fertilizer Efficiency and Ecosystem Impacts
Jay Edwards Raymond
Dissertation submitted to the faculty of the Virginia Polytechnic Institute and State University
in partial fulfillment of the requirements for the degree of
Doctor of Philosophy
In
Forestry
Thomas R. Fox, Chair John E. Barrett
Brian D. Strahm Valerie A. Thomas February 3rd, 2016 Blacksburg, VA
Keywords: 15N; forest fertilization; nitrogen cycle; plantation forestry
Copyright 2016, Jay Edwards Raymond
J.E. Raymond
i
Use of Stable Isotopes to Trace the Fate of Applied Nitrogen in Forest Plantations to
Evaluate Fertilizer Efficiency and Ecosystem Impacts
Jay Edwards Raymond
ABSTRACT
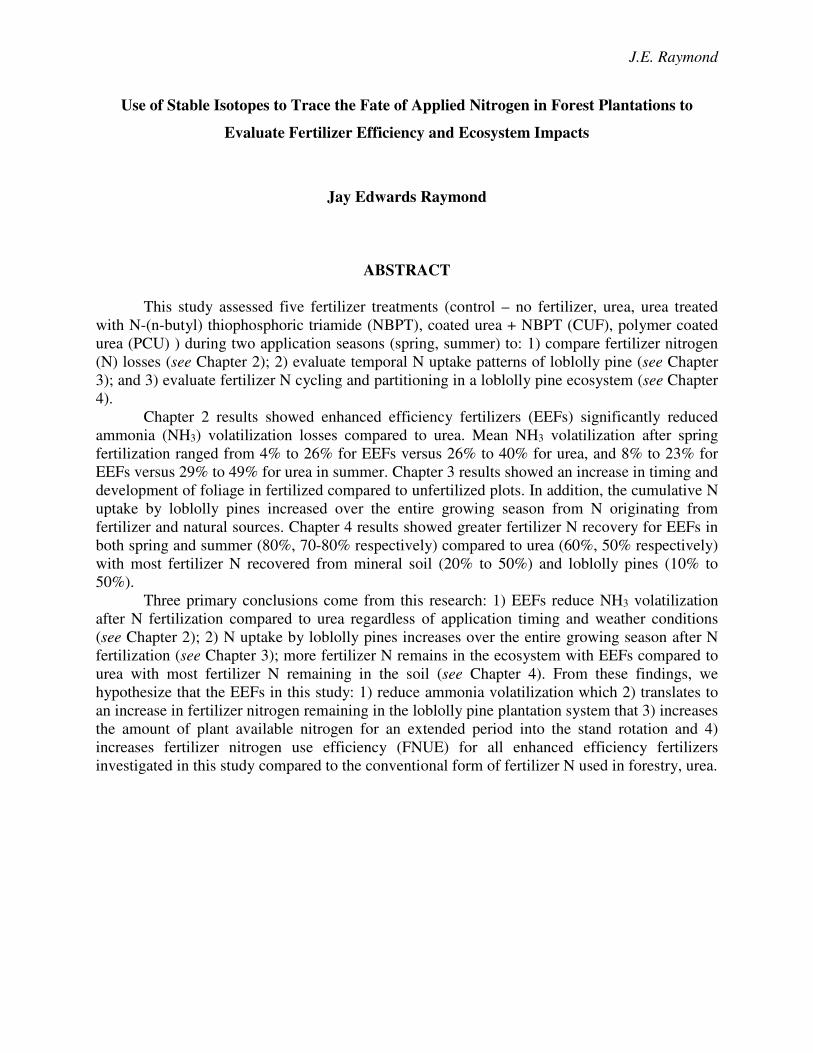
This study assessed five fertilizer treatments (control – no fertilizer, urea, urea treated with N-(n-butyl) thiophosphoric triamide (NBPT), coated urea + NBPT (CUF), polymer coated urea (PCU) ) during two application seasons (spring, summer) to: 1) compare fertilizer nitrogen (N) losses (see Chapter 2); 2) evaluate temporal N uptake patterns of loblolly pine (see Chapter 3); and 3) evaluate fertilizer N cycling and partitioning in a loblolly pine ecosystem (see Chapter 4).
Chapter 2 results showed enhanced efficiency fertilizers (EEFs) significantly reduced ammonia (NH3) volatilization losses compared to urea. Mean NH3 volatilization after spring fertilization ranged from 4% to 26% for EEFs versus 26% to 40% for urea, and 8% to 23% for EEFs versus 29% to 49% for urea in summer. Chapter 3 results showed an increase in timing and development of foliage in fertilized compared to unfertilized plots. In addition, the cumulative N uptake by loblolly pines increased over the entire growing season from N originating from fertilizer and natural sources. Chapter 4 results showed greater fertilizer N recovery for EEFs in both spring and summer (80%, 70-80% respectively) compared to urea (60%, 50% respectively) with most fertilizer N recovered from mineral soil (20% to 50%) and loblolly pines (10% to 50%).
Three primary conclusions come from this research: 1) EEFs reduce NH3 volatilization after N fertilization compared to urea regardless of application timing and weather conditions (see Chapter 2); 2) N uptake by loblolly pines increases over the entire growing season after N fertilization (see Chapter 3); more fertilizer N remains in the ecosystem with EEFs compared to urea with most fertilizer N remaining in the soil (see Chapter 4). From these findings, we hypothesize that the EEFs in this study: 1) reduce ammonia volatilization which 2) translates to an increase in fertilizer nitrogen remaining in the loblolly pine plantation system that 3) increases the amount of plant available nitrogen for an extended period into the stand rotation and 4) increases fertilizer nitrogen use efficiency (FNUE) for all enhanced efficiency fertilizers investigated in this study compared to the conventional form of fertilizer N used in forestry, urea.
J.E. Raymond
iii
Dedication
To my wife Anja Whittington.
Without her understanding, patience and support at every level,
this process would have been less enjoyable and less meaningful.
Thank you for everything you have done for me and for us over the last several years.
J.E. Raymond
iv
Acknowledgements
I would like to extend my sincerest gratitude to my advisor, Dr. Thomas R. Fox, who
provided the guidance, advice, and support during this entire process. I would like to thank my
committee member Dr. Brian D. Strahm, who also provided guidance and advice during this
process. I would like to thank my committee members, Dr. John E. Barrett and Dr. Valerie A.
Thomas, for their support and guidance during the development of my dissertation research.
I would like to thank Dave Mitchem for always making time in the laboratory to assist
me. I would like to thank Eric Carbaugh, Andy Laviner, and Kevan Minick for the numerous
conversations on the meaning of science, and their friendships during this process. I would like
to thank Dr. Ivan Fernandez for his mentoring and advice during various phases of moving
through this process. I would also like to thank Dr. Anja Whittington for her input and review
during all stages of this process.
I finally would like to thank the Forest Productivity Cooperative, the Center for
Advanced Forestry Systems, and the United States Department of Agriculture National Institute
of Food and Agriculture for their support of this research.
J.E. Raymond
v
Contributing Authorship
Chapter 2.
Chapter 2 will be submitted to Soil Biology and Biochemistry in 2016
J.E. Raymond T.R. Fox
B.D. Strahm J.L. Zerpa
Chapter 3.
Chapter 3 will be submitted to Forest Ecology and Management in 2016
J.E. Raymond T.R. Fox
B.D. Strahm J.L. Zerpa
Chapter 4.
Chapter 4 will be submitted to Ecology in 2016
J.E. Raymond T.R. Fox
B.D. Strahm J.L. Zerpa
vi
Table of Contents Abstract ........................................................................................................................................... ii Dedication ...................................................................................................................................... iii Acknowledgements ........................................................................................................................ iv Contributing Authorship ..................................................................................................................v Table of Contents ........................................................................................................................... vi List of Tables ................................................................................................................................. ix List of Figures ............................................................................................................................... xii Chapter 1. Introduction
1.1. Justification ...........................................................................................................................1 1.2. Literature Review
1.2.1. The Nitrogen Cycle in Forest Ecosystems .....................................................................4 1.2.2. Productivity of Intensively Managed Pine Plantations ..................................................6 1.2.3. Assessment Methods for Nutrient Deficiencies in Loblolly Pine ..................................7 1.2.4. Nitrogen Fertilization of Pine Plantations ......................................................................8 1.2.5. Cycling of Fertilizer Nitrogen in Pine Plantations .......................................................10 1.2.6. Enhanced Efficiency Fertilizers ...................................................................................13 1.2.7. Use of Stable Isotopes to Trace Nitrogen in Forest Ecosystems ..................................16
1.3. Objectives ............................................................................................................................20 Literature Cited ..........................................................................................................................21
Chapter 2. Ammonia volatilization following nitrogen fertilization with enhanced
efficiency fertilizers and urea in loblolly pine (Pinus taeda L.) plantations of the
southern United States
Abstract ......................................................................................................................................41 2.1. Introduction .........................................................................................................................42 2.2. Materials and Methods
2.2.1. Experimental Design ....................................................................................................46 2.2.2. Fertilizer Treatments ....................................................................................................46 2.2.3. Site Description ............................................................................................................47 2.2.4. Experimental Method ...................................................................................................47 2.2.5. Laboratory Processing ..................................................................................................48 2.2.6. Weather Data ................................................................................................................49 2.2.7. Calculations ..................................................................................................................50 2.2.8. Statistical Analysis .......................................................................................................51
2.3. Results 2.3.1. Differences in NH3 Volatilization Among Fertilizers Treatments – Spring .................52 2.3.2. Differences in NH3 Volatilization Among Fertilizers Treatments – Summer .............52 2.3.3. NH3 Volatilization Among Fertilizer Treatments – Spring + Summer ........................53 2.3.4. Correlation Between NH3 Volatilization from Urea and Weather Data ......................53
2.4. Discussion ...........................................................................................................................54
J.E. Raymond
vii
2.5. Conclusion ...........................................................................................................................62 2.6. Acknowledgements .............................................................................................................64 Literature Cited ..........................................................................................................................65
Chapter 3. Temporal patterns of foliar nitrogen after fertilization for two application
seasons in mid-rotation loblolly pine (Pinus taeda L.) plantations of the southern United
States
Abstract ......................................................................................................................................82 3.1. Introduction .........................................................................................................................83 3.2. Materials and Methods
3.2.1. Experimental Design and Site Description...................................................................86 3.2.2. Fertilizer Treatments ....................................................................................................87 3.2.3. Experimental Method – Field Sampling.......................................................................88 3.2.4. Experimental Method – Laboratory Processing ...........................................................88 3.2.5. Calculations ..................................................................................................................89 3.2.6. Statistical Analysis .......................................................................................................89
3.3. Results 3.3.1. Flush Development .......................................................................................................90 3.3.2. Individual Fascicle Mean Mass ....................................................................................91 3.3.3. Foliar N Mean Concentration .......................................................................................92 3.3.4. Individual Fascicle Mean N Content ............................................................................92 3.3.5. Foliar 15N ......................................................................................................................94 3.3.6. Individual Fascicle Fertilizer Mean N Content ............................................................94 3.3.7. Total Cumulative Individual Fascicle N Content .........................................................96 3.3.8. Total Cumulative Individual Fascicle Fertilizer N Content .........................................97
3.4. Discussion ...........................................................................................................................97 3.5. Conclusion .........................................................................................................................104 3.6. Acknowledgements ...........................................................................................................105 Literature Cited ........................................................................................................................106
Chapter 4. Understanding the fate of applied fertilizer nitrogen in mid-rotation loblolly
pine plantations (Pinus taeda L) of the southern United States using stable isotopes
Abstract ....................................................................................................................................129 4.1. Introduction .......................................................................................................................131 4.2. Materials and Methods
4.2.1. Experimental Design and Site Description.................................................................137 4.2.2. Fertilizer Treatments ..................................................................................................137 4.2.3. Experimental Method – Field Sampling – Pre-treatment ...........................................138 4.2.4. Experimental Method – Field Sampling – Post Treatment ........................................139 4.2.5. Experimental Method – Laboratory Processing .........................................................140 4.2.6. Calculation of Fertilizer Recovery .............................................................................141 4.2.7. Statistical Analysis .....................................................................................................142
4.3. Results 4.3.1. Study 1 – 2011 Application – Spring versus Summer ...............................................143 4.3.2. Study 2 – 2012 Application - Spring ..........................................................................145
4.4. Discussion .........................................................................................................................147 4.5. Conclusions .......................................................................................................................152 4.6. Acknowledgements ...........................................................................................................154
J.E. Raymond
viii
Literature Cited ........................................................................................................................155
Chapter 5. Conclusions
5.1. Introduction .......................................................................................................................182 5.2. Chapter Results and Discussion ........................................................................................185 Literature Cited ........................................................................................................................192
Appendix ......................................................................................................................................194
ix
List of Tables Table 1.1. Common types of nitrogen containing fertilizers for use in agriculture, horticulture and turf grass management. Top portion of list has general applications to forestry. Information summarized from tables specific to nitrogen containing fertilizers in Havlin et al. (2014), IPNI (2015), PSU (2015) ..................................................................................................38 Table 1.2. Common types of enhanced efficiency fertilizer products for use with nitrogen containing fertilizers in agriculture, horticulture, and turf grass management. Certain products have current applications to forestry. Information summarized from tables specific to slow and controlled release fertilizers found in Hauck (1985), Shaviv (1996), Trenkel (2010), Azeem et al. (2014), Havlin et al. (2014), IPNI (2015) and PSU (2015). Primary resource Tabe 4-23 in Havlin et al. (2014) ....................................................................................39 Table 2.1. Selected climatic and physical characteristics for sites in the southern United States selected to evaluate ammonia volatilization following fertilization with urea and enhanced efficiency fertilizers enriched with 15N ..........................................................................................74 Table 2.2. Selected climatic and physical characteristics for sites in the southern United States selected to evaluate ammonia volatilization following fertilization with urea and enhanced efficiency fertilizers enriched with 15N ..........................................................................................75 Table 2.3. Selected physical and chemical soil characteristics of loblolly pine stands in the southern United States selected to evaluate ammonia volatilization following fertilization with urea and enhanced efficiency nitrogen fertilizers ..................................................................76 Table 2.4. Mean 15N (‰) values for depth increments of microcosms 30 days after a spring and summer application of δ15N enriched fertilizer treatments (CUF, NBPT, PCU, urea) at 6 mid-rotation loblolly pine plantations across the southern United States. The nitrogen application rate was 224 kg N ha-1. Values in parentheses are the standard error of the mean .....78 Table 2.5. Results (F-values and significance) of repeated measures ANOVA testing effects of treatment (CUF, NBPT, PCU, urea), season (spring, summer), day (1, 15, 30), and the interactions of treatment*season, treatment*day, and treatment*season*day for ammonia volatilization loss as a percentage of applied 15N enriched fertilizer for sites at 6 mid-rotation loblolly pine plantations across the southern United States. The nitrogen application rate was 224 kg N ha-1 ..................................................................................................................................79 Table 2.6. P > | t | values for treatment (CUF, NBPT, PCU, urea) contrasts for mean ammonia volatilization loss for days (1, 15, 30) after application of 15N enriched fertilizers during two seasons (spring, summer) and combined (spring + summer) at 6 midrotation loblolly pine plantations in the southern United States. The nitrogen application rate was 224 kg N ha-1 ........80 Table 2.7. Correlation matrix for selected weather variables 1 day following urea application for cumulative mean volatilization loss after application of 15N enriched nitrogen fertilizers during two seasons (spring, summer) and combined seasons (spring + summer) at 6 mid-rotation loblolly pine plantations in the southern United States. Top values are the Pearson Correlation and number below in parentheses represents the associated p-value. The nitrogen application rate was 224 kg N ha-1 .................................................................................................81
J.E. Raymond
x
Table 3.1. Selected climate and physical characteristics of loblolly pine stands in the southern United States selected to evaluate temporal foliar uptake of fertilizer nitrogen following the application of urea or enhanced efficiency nitrogen fertilizers enriched with 15N ......................121 Table 3.2. Selected characteristics of loblolly pine stands in the southern United States selected to evaluate selected to evaluate temporal foliar uptake of fertilizer nitrogen following the application of urea or enhanced efficiency nitrogen fertilizers enriched with 15N. ...............122 Table 3.3. The number of study sites where flushes were observed for each treatment (control, CUF, NBPT, PCU, urea) in sampling periods after a spring and summer fertilization for loblolly pine stands in the southern United States selected to evaluate fertilizer N uptake of urea or enhanced efficiency N containing fertilizers enriched with 15N. (*) represents date of fertilization. (-) represents potential flushes not measured in the sampling period .................123 Table 3.4. The mean individual fascicle mass (g) of flushes in sampling periods after a spring and summer fertilization for loblolly pine stands in the southern United States selected to evaluate fertilizer N uptake of urea or enhanced efficiency N containing fertilizers enriched with 15N. Different letters represent significant differences at α = 0.05 among treatments in a sampling period. Numbers in parentheses are the standard error of the mean, and absent values and letters indicate post-hoc analysis not conducted due to a limited sample size. The N application rate was 224 kg N ha-1. N = 6. ...............................................................................124 Table 3.5. The mean foliar N concentration (%) of individual flushes for sampling periods after a spring and summer fertilization for loblolly pine stands in the southern United States selected to evaluate fertilizer N uptake of urea or enhanced efficiency N containing fertilizers enriched with 15N. Different letters represent significant differences at α = 0.05 among treatments in a sampling period. Numbers in parentheses are the standard error of the mean, and absent values and letters indicate post-hoc analysis not conducted due to a limited sample size. The N application rate was 224 kg N ha-1. N = 6 ................................................................125 Table 3.6. The mean individual fascicle N content (mg) of flushes per sampling periods after a spring and summer fertilization for loblolly pine stands in the southern United States selected to evaluate fertilizer N uptake of urea or enhanced efficiency N containing fertilizers enriched with 15N. Different letters represent significant differences at α = 0.05 among treatments in a sampling period. Numbers in parentheses are the standard error of the mean, and absent values and letters indicate post-hoc analysis not conducted due to a limited sample size. The N application rate was 224 kg N ha-1. N = 6 ................................................................126 Table 3.7. The mean foliar 15N (‰) of individual flushes for sampling periods after a spring and summer fertilization for loblolly pine stands in the southern United States selected to evaluate fertilizer N uptake of urea or enhanced efficiency N containing fertilizers enriched with 15N. Different letters represent significant differences at α = 0.05 among treatments in a sampling period. Numbers in parentheses are the standard error of the mean, and absent values and letters indicate post-hoc analysis not conducted due to a limited sample size. The N application rate was 224 kg N ha-1. N = 6 ................................................................................127
J.E. Raymond
xi
Table 3.8. The mean individual fascicle fertilizer N (mg) content for flushes in sampling periods of loblolly pine stands in the southern United States selected to evaluate seasonal fertilizer N uptake of urea or enhanced efficiency N containing fertilizers enriched with 15N after a spring and summer fertilization. Different letters represent significant differences at α = 0.05 among treatments in a sampling period. Numbers in parentheses are the standard error of the mean, and absent values and letters indicate post-hoc analysis not conducted due to a limited sample size. The N application rate was 224 kg N ha-1. N = 6 .......................................128 Table 4.1. Selected climate and physical characteristics of loblolly pine stands in the southern United States selected to evaluate ecosystem partitioning of fertilizer N following application of urea or enhanced efficiency N fertilizers enriched with 15N. MAP = Mean annual precipitation. MAT = Mean annual temperature .........................................................................168 Table 4.2. Characteristics of loblolly pine stands in the southern United States selected to evaluate ecosystem partitioning of fertilizer N following application of urea or enhanced efficiency N fertilizers enriched with 15N ....................................................................................170 Table 4.3. Selected physical and chemical soil characteristics of loblolly pine stands in the southern United States selected to evaluate ecosystem partitioning of fertilizer N following application of urea or enhanced efficiency N fertilizers enriched with 15N ................................171 Table 4.4. The mean 15N (‰), N (g kg-1) and fertilizer N recovery (% of fertilizer N applied) for individual ecosystem components for Study 1 (spring + summer 2011) for loblolly pine stands in the southern United States selected to evaluate ecosystem partitioning of fertilizer N for urea or enhanced efficiency N containing fertilizers enriched with 15N. Different letters represent significant differences at α = 0.05. Numbers in parentheses represent the standard error of the mean. The N application rate was 224 kg N ha-1. N = 10 .........................................173 Table 4.5. Analysis of variance for treatment differences for fertilizer N recovery (% of fertilizer N applied) for total and the primary ecosystem components for Study 1 (spring + summer 2011) at mid-rotation loblolly pine plantations in the southern United States. N application rate was 224 kg N ha-1. N = 10 .................................................................................175 Table 4.6. The mean 15N (‰), N (g kg-1) and fertilizer N recovery (% of applied fertilizer N) for individual ecosystem components for Study 2 (March-April 2012)for loblolly pine stands in the southern United States selected to evaluate ecosystem partitioning of fertilizer N for urea or enhanced efficiency N containing fertilizers enriched with 15N. Different letters represent significant differences at α = 0.05. Numbers in parentheses represent the standard error of the mean. The N application rate was 224 kg N ha-1. N = 12 for all ecosystem components except sapling/pole and shrub strata where N = 6 ...................................................177 Table 4.7. Analysis of variance for treatment differences for fertilizer N recovery (% of fertilizer N applied) for total and the primary ecosystem components for Study 2 (spring 2012) at mid-rotation loblolly pine plantations in the southern United States. N application rate was 224 kg N ha-1. N = 12 except for Understory where N = 7 ...........................................179 Table 4.8. P > | t | values for fertilizer N treatment (CUF, NBPT, PCU, urea) contrasts for total ecosystem fertilizer N recovery (% of fertilizer N applied) for Study 1 (spring + summer 2011) and Study 2 (spring 2012) at mid-rotation loblolly pine plantations in the southern United States. The N application rate was 224 kg N ha-1. N =10 ................................................181
J.E. Raymond
xii
List of Figures
Figure 1.1. The nitrogen cycle in forested ecosystems. Adapted from Fisher and Binkley (2000), Dawson et al. (2002), Sylvia et al. (2005), Groffman and Rosi-Marshall (2013) .........................35 Figure 1.2. Soil nitrogen supply and tree nitrogen demand during a typical rotation for loblolly pine in the southern United States. Adapted from Allen (1990) and Fox et al. (2007a) ...............36 Figure 1.3. The fertilizer nitrogen cycle in a coniferous forest. Adapted from Crane (1972) .......37 Figure 2.1. Location map for sites selected in the southern United States to evaluate ammonia volatilization following fertilization with urea and enhanced efficiency fertilizers enriched with 15N after a spring and summer fertilizer application ......................................................................70 Figure 2.2. Microcosm diagram for ammonia volatilization study in the southern United States selected to evaluate ammonia volatilization following fertilization with urea and enhanced efficiency fertilizers enriched with 15N after a spring and summer application ............................71 Figure 2.3. The mean percent recovery of applied 15N enriched fertilizers in microcosms, by soil depth increment, for spring and summer application after 30 days. The >30 cm increment is immediately below the microcosm. Error bars are the standard error of the mean .......................72 Figure 2.4. Cumulative mean ammonia volatilization loss from microcosms, expressed as a percent loss from nitrogen fertilizer treatments, for 6 mid-rotation loblolly pine plantations across the southern United States after a spring (A), summer (B) and spring + summer (C) application of 15N enriched fertilizer treatments (CUF, NBPT, PCU, urea). The nitrogen application rate was 224 kg N ha-1. Error bars are the standard error of the mean.......................73 Figure 3.1. Location map of loblolly pine stands in the southern United States selected to evaluate temporal foliar uptake of fertilizer nitrogen during the growing season using 15N enriched fertilizers following the application of urea or enhanced efficiency nitrogen fertilizers after a spring and summer fertilizer application ..........................................................................114 Figure 3.2. Representation of individual flush growth on a loblolly pine sampled every six weeks over the growing season after a spring fertilization in the southern United States selected to evaluate fertilizer N uptake of urea or enhanced efficiency N containing fertilizers. .................115 Figure 3.3. Cumulative individual fascicle N content (mg/fascicle) of individual flushes combined for sampling weeks (6, 12, 18, 24, 30) after spring and summer fertilization (2011) for loblolly pine stands in the southern United States selected to evaluate fertilizer N uptake of urea or enhanced efficiency N containing fertilizers enriched with 15N. The N application rate was 224 kg N ha-1. N = 6. ...................................................................................................................116
J.E. Raymond
xiii
Figure 3.4. Cumulative individual fascicle N content from fertilizer (mg) of individual flushes (0, 1, 2) combined for sampling weeks (6, 12, 18) after spring and summer fertilization (2011) for loblolly pine stands in the southern United States selected to evaluate fertilizer N uptake of urea or enhanced efficiency N containing fertilizers enriched with 15N. The N application rate was 224 kg N ha-1. N = 6. ...................................................................................................................117 Figure 4.1. Location map of loblolly pine stands in the southern United States selected to evaluate ecosystem partitioning of fertilizer N following the application of urea or enhanced efficiency N fertilizers enriched with 15N ....................................................................................164 Figure 4.2. Plot sampling schematic for loblolly pine stands in the southern United States selected to evaluate ecosystem partitioning of fertilizer N following application of urea or enhanced efficiency N fertilizers enriched with 15N. Boxes below each category (Crop Tree, Understory, Soils, Litterfall) represent portions of the ecosystem sampled ................................165 Figure 4.3. The total fertilizer N recovery (% of fertilizer N applied) of the major ecosystem components (tree - loblolly pine aboveground + belowground biomass, litterfall, and soil (O horizon + mineral soil- 0 to 30cm)) for loblolly pine stands in the southern United States selected to evaluate ecosystem partitioning of fertilizer N of urea or enhanced efficiency N fertilizers enriched with 15N. Data represents combined fertilizer application dates for Study 1 for spring (March-April 2011) and summer (June 2011). Study 1 did not have a significant Understory category as in Study 2. Different letters represent significant differences at α = 0.05. The N application rate was 224 kg N ha-1. N =10 ..................................................................................166 Figure 4.4. The total fertilizer N recovery (% of fertilizer N applied) of the major ecosystem components (Tree - loblolly pine aboveground + belowground biomass, Understory, Litterfall, and Soil (O horizon + mineral soil- 0 to 30cm)) for loblolly pine stands in the southern United States selected to evaluate ecosystem partitioning of fertilizer N of urea or enhanced efficiency N fertilizers enriched with 15N. Data represents fertilizer application dates for Study 2 for spring (March-April 2012). Different letters represent significant differences at α = 0.05. The N application rate was 224 kg N ha-1. N = 12 .................................................................................167
Figure 5.1. Implication and directions of current and future research for improving the understanding of nitrogen cycling after fertilization with N containing fertilizers in mid-rotation loblolly pine plantations across the southern United States.........................................................191
J.E. Raymond
1
Chapter 1. Introduction
1.1. Justification
Fertilizers, primarily containing nitrogen (N) and phosphorous (P), have been used for
several decades in loblolly pine (Pinus taeda L.) plantations in the southern United States to
improve productivity by ameliorating widespread nutrient deficiencies of N and P occurring in
these southern forest soils (Allen 1987, Fischer and Binkley 2000, Richter et al. 2000, Allen et
al. 2005, Fox et al. 2007a, b). Consequently, over 500,000 ha of forested plantations are fertilized
annually with N and P in the southern United States (Albaugh et al. 2004). Other nutrients, such
as potassium (K) and/or micronutrients, may also be limiting or co-limiting but are applied on a
site specific basis when these deficiencies are observed (Albaugh et al. 1998, 2004, Sampson and
Allen 1999, Jokela and Martin 2000, Vogel and Jokela 2011, Carlson et al. 2014).
Despite significant gains in forest productivity from fertilization, a large degree of
uncertainty exists in the fate of the fertilizer N in these plantation systems (Fox et al. 2007a). The
majority of fertilizer N applied in southern pine plantations is urea (CO(NH2)2) (Allen 1987).
Urea is the preferred source of N because of a high N content (46%) and overall low cost per unit
(Allen 1987, Fox et al. 2007b). However, potentially large losses of fertilizer N can occur
following fertilization with urea due to ammonia (NH3) volatilization, with losses generally
correlated with weather conditions at the time of application (Kissel et al. 2009, Zerpa and Fox
2011, Elliot and Fox 2014). Losses due to NH3 volatilization in acidic forest soils are highly
variable and range from 5% to 90% (Boomsma and Pritchett 1979, Craig and Wollum 1982,
Kissel et al. 2004, Kissel et al. 2009, Zerpa and Fox 2011, Elliot and Fox 2014).
J.E. Raymond
2
The amount of urea N lost from the system by NH3 volatilization decreases the amount of
fertilizer N potentially available to crop trees (loblolly pines) and likely contributes to low rates
of fertilizer N uptake (Elliot and Fox 2014). Additional loss pathways of fertilizer N include
denitrification (Shrestha et al. 2014) or leaching (Vitousek and Matson 1985a, Binkley et al.
1999, Meason et al. 2004, Aust and Blinn 2004). Although field experiments show crop tree
fertlizer N uptake ranges from 25% to 50% (Baker et al. 1974, Mead and Pritchett 1975,
Heilman et al. 1990, Johnson and Todd 1988, Li et al. 1991, Albaugh et al. 1998, 2004, Blazier
et al. 2006), laboratory pot studies show plant uptake of fertilizer N ranges from 50% to near
100% in lodgepole pine (Pinus contorta Dougl. ex. Loud.) (Amponsah et al. 2004), Douglas-fir
(Pseudotsuga menziesii (Mirb.) Franco) (Pang 1985), and black walnut (Juglans nigra L.) (Salifu
et al. 2009). Conversely, in a 3 year old loblolly pine plantation in Oklahoma fertilized with urea
and diammonium phosphate, fertilizer N recovery ranging from 6% to 25% (Blaizer et al. 2006).
Mead et al. (2008) found on average 14.5% of fertilizer N was recovered 10 years after
application in a 38 to 39 year old Douglas-fir stand in British Columbia. Heilman at al. (1990)
found higher N recoveries, averaging 30% in 7 to 9 year old Douglas-fir forests in Washington.
Unfortunately, none of these represent southeastern loblolly pine mid-rotation fertilization
conditions.
The remaining fertilizer N not lost from the system or taken up by the crop trees is
partitioned among other ecosystem components including the understory vegetation (competing
volunteers, deciduous trees, shrubs, vines, herbaceous species), litter, forest floor (organic
horizon), and mineral soil (Birk and Vitousek 1986, Albaugh et al. 2004). The cumulative effect
of reduced fertilizer N uptake by desired crop trees translates to lower fertilizer nitrogen use
efficiency (FNUE), defined as the ratio between the amount of fertilizer N removed with a crop
J.E. Raymond
3
and the amount of fertilizer N applied (Havlin et al. 2014). An improved understanding of the
proportion of fertilizer N lost from the system, incorporated by crop trees and partitioned in
ecosystem components is hindered by our inability to quantify the cycling of fertilizer N and its
ultimate fate in forest ecosystems.
Although many loblolly pine plantations respond positively to the application of N and/or
other nutrients, some do not (Pritchett and Smith 1975, Martin et al. 1999, Amateis et al. 2000,
Carlson et al. 2014). Some stands may not respond to N additions because large amounts are lost
from the system, immobilized in the soil by microbial communities or on exchange sites, or the
site may not be N deficient due to high rates of mineralization from decomposing organic matter.
Additionally, stands may not respond because deficiencies of elements other than N create
nutrient imbalances that limit growth (Vogel and Jokela 2011, Carlson et al. 2014) and would
respond to fertilization if the required nutrients could be properly identified and effectively
applied.
The inability to accurately determine sites specific responsive to fertilization influences
forest management decisions. Until our understanding of the mechanisms and interactions
governing the movement of fertilizer N through loblolly pine plantations on a site-specific basis
improves, the ability to accurately predict response will be limited. The goal of this research is to
enhance our fundamental understanding of the fate of fertilizer N in loblolly pine plantations to
improve the economic feasibility of fertilization and reduce potential negative environmental
impacts of fertilizer N loss from the system. This research used N containing fertilizers enriched
with the stable isotope 15N in a series of pulse-chase experiments. We compared the fate and
cycling of conventional (urea) and enhanced efficiency N containing fertilizers (coated Urea +
NBPT (CUF), urea + NBPT (N-(n-Butyl) thiophosphoric triamide) (NBPT), polymer coated urea
J.E. Raymond
4
(PCU)) in loblolly pine plantations. This research will help determine the feasibility of using
enhanced efficiency N containing fertilizers to improve fertilizer nitrogen use efficiency.
1.2. Literature Review
1.2.1. The Nitrogen Cycle in Forest Ecosystems
Nitrogen is generally the most limiting element to primary productivity in terrestrial
ecosystems because it is an essential component of key molecules such as deoxyribonucleic acid
(DNA), ribonucleic acid (RNA), amino acids, proteins, enzymes that facilitate biochemical
reactions, and photosynthesis (Miller 1981, Chapin et al. 1986, Vitousek and Howarth 1991,
Lambers et al. 2005). Reduced N availability to trees restricts leaf area production, and forest
plantations with low leaf area do not achieve optimal growth (Linder 1987).
Although terrestrial systems contain large quantities of N, only a small fraction is
generally plant available at any given time (Likens and Bormann 1995, Fisher and Binkley
2000). While the atmosphere contains the largest pool of N (~79%), it exists as unreactive
dinitrogen gas (N2) and is not available for uptake by vascular plants. The strong triple bonds of
N2 must be broken and N must then be synthesized into plant available forms in biochemical
reactions which include ammonium (NH4+), ammonia (NH3), volatile organic compounds
(VOCs), nitrate (NO3-), organic forms of nitrogen (e.g. urea), or from fertilizer production
(Galloway et al. 2004, Lambers et al. 2005). In most forests, the primary N cycling pathways are
biological fixation, mineralization, immobilization, nitrification, and denitrification (Fisher and
Binkley 2000) (Figure 1.1).
J.E. Raymond
5
Bonds of atmospheric N2 can be broken by lightning, fertilizer production, nonsymbiotic
(free living microbes) or symbiotic (microbes inside roots nodules of plants) microbial mediated
dinitrogen fixation (nitrogen fixation) (Sylvia et al. 2005). Nitrogen fixation is the conversion of
N2 to ammonia (NH3). Nonsymbiotic N fixation is low for most terrestrial ecosystems and
confined to substrates high in energy but low in N, such as coarse woody debris (Groffman and
Rosi-Marshall 2013). Conversely, symbiotic N fixation can be high where the symbiosis between
plant and N fixing soil microbes provides a competitive advantage (Vitousek et al. 2002,
Groffman and Rosi-Marshall 2013). Nitrogen fixation may decline with ecosystem succession
but can still be important for N inputs to the system over extended periods (Grant and Binkley
1987, Vitousek et al. 2002).
Nitrogen mineralization is the transformation of organic N to NH4+, and immobilization
is the incorporation of assimilation of NH4+ or NO3
- into organic components. These processes
are considered the primary sources of plant available N in most forested ecosystems (Miller et al.
1979, Likens and Bormann 1995, Groffman and Rosi-Marshall 2013). Nitrogen mineralization is
partly controlled by soil microbial requirements for carbon (C) and N during substrate utilization,
where C and N are incorporated into microbial biomass or lost through respiration. Adequate N
in substrates used by soil microbes will generally translate to an accumulation of N in the soil
that increases plant available N (Vitousek and Matson 1984, 1985b, Hart et al. 1994, Scott and
Binkley 1997, Finzi et al. 1998, Piatek and Allen 1999, Vitousek et al. 2002). Yet if N is limiting
in substrates utilized by soil microbes, N will be removed from mineral soil pools to satisfy
microbial demand and immobilized, reducing plant available N (Vitousek and Matson 1985b,
Davidson et al. 1990, Groffman et al. 1993, Scott and Binkley 1997).
J.E. Raymond
6
Nitrification, the conversion of NH4+ to nitrite (NO2
-) then nitrate (NO3-), is limited by
soil NH4+ concentrations, because nitrifying microbes (bacteria and archaea) are generally poor
competitors for NH4+ compared to heterotrophic microbes (Ward 2011, Norman and Barrett
2014, Norman et al. 2015). During nitrification N may be lost from the system due to high NO3-
mobility (leaching). Nitrification is generally greater in systems with high N availability such as
annually fertilized agriculture fields or recently disturbed ecosystems (Groffman and Rosi-
Marshall 2013). Although NO3- may be lost from upland systems by nitrification, it can be
transformed to N2 or other gaseous N compounds by denitrification in anaerobic environments
(Schimel and Bennett 2004, Ward 2011).
Denitrification is a form of anaerobic respiration utilizing N compounds along a redox
gradient and sequence of electron acceptors that produce reduced products (Sylvia et al. 2005).
Complete denitrification is the conversion of NO3- to N2 with intermediary compounds of NO2
-,
nitric oxide (NO) and nitrous oxide (N2O) (Sylvia et al. 2005). Dependent on the environmental
conditions and microbial communities, incomplete denitrification may occur with intermediary
compounds released from the system (Vitousek and Matson 1984, 1985b, Vitousek and Howarth
1991).
1.2.2. Productivity of Intensively Managed Pine Plantations
Forests provide numerous functions and services to society including clean water and air,
carbon sequestration, biodiversity, food for human consumption, commodities for economic
development, and diverse recreational opportunities (Nabuurs et al. 2007). Wood produced in
forests is a primary economic commodity serving as a raw material for industries, especially in
the southern United States (Howard 2003). Demands for both traditional forest products, such as
J.E. Raymond
7
pulp and timber, and new products for emerging markets such as the bioenergy industry, are
increasing (Howard 2003). How to balance increasing demand for wood with non-commodity
services and values produced by forests is a key question facing modern society (Fox 2000).
Most forests in the United States regenerate naturally, are extensively managed, and have
low productivity (Fox et al. 2007b). The productivity of these extensively managed forests is not
sufficient to produce the raw resources required to supply competing societal demands for forest
products, and larger areas of natural forests will be required to meet commodity demands (Sedjo
2001). Yet high growth rates of intensively managed tree plantations can supply large quantities
of wood and assist in meeting increasing demand for raw materials (Sedjo 2001, WWF 2015).
In the United States, plantation forests are primarily concentrated in the South (Oswalt et
al. 2014) occupying 12.8 million ha of mostly loblolly pine (Albaugh et al. 2007). Intensive
silvicultural management can significantly increase the productivity of these forests, from less
than 2 m3 ha-1 yr-1 to more than 10 m3 ha-1 yr-1 (Fox et al. 2007b). Although improved growth
rates have been achieved by intensive silviculture management, theoretical models and empirical
field trials indicate productivity of 20 m3 ha-1 yr-1 for 15 year rotations are possible in these
southern pine plantations (Allen et al. 2005, Fox et al. 2007b). Increases in future productivity
must include site-specific silvicultural prescriptions to ameliorate growth limiting factors in an
economically viable and environmentally responsible manner.
1.2.3. Assessment methods for nutrient deficiencies in loblolly pines
Numerous methods have been developed to assess loblolly pine nutrient status and
evaluate potential response to fertilization (Bowen and Nambier 1984, Carter 1992). The
simplest method is visual observation (Stone 1968) but is of limited value because obvious
J.E. Raymond
8
symptoms (chlorosis) can be due to multi-nutrient deficiencies (Vogel or Jokela 2011) or
pathogens (USDA 1989). Foliar analysis including nutrient concentrations, critical nutrient levels
(Tisdale et al. 1985, Havlin et al. 2014), nutrient ratios in Diagnosis of Recommendation
Integrated System (DRIS) (Hockman and Allen 1990, Sypert 2005), and graphical analysis
(Haase and Rose 1985) improve on visual assessment, but also may be of limited value if
sampling season and edaphic factors are not integrated (Carter 1992). Soil sampling and nutrient
addition experiments (Binkely and Hart 1989) also provide insight but may require large sample
sizes to address soil heterogeneity. Integrated soils research has led to the development of soil
groupings based on similar parent materials within physiographic regions that correlate well with
specific nutrient deficiencies, like the Cooperative Research in Forest Fertilization (CRIFF) soil
groupings in the southern United States (Fisher and Garbett 1980, Jokela and Long 2000,
Villanueva 2015), or groupings in the Pacific Northwest (Littke et al. 2014). Field or greenhouse
bioassays using seedlings can also be valuable, but results may be confounded by artificial
laboratory conditions and may be difficult to extrapolate to the field (Addoms 1937, Hobbs 1947,
Morrison 1974, Mead and Pritchett 1975, Birk and Vitousek 1986). The most reliable, but
expensive, assessment of nutrient deficiencies and fertilizer N response are fertilizer field trials
(Miller 1981, Carter 1992, Albaugh et al. 2004, Fox et al. 2007a).
1.2.4. Nitrogen Fertilization of Pine Plantations
Low availability of plant available soil nutrients, primarily N (Albaugh et al. 1998,
Sampson and Allen 1999, Jokela and Martin 2000, Fox et al. 2007b) and P (Pritchett and
Comerford 1982, Gent et al. 1986, Fox et al. 2007b) reduce productivity of many pine
plantations across the southern United States. Low nutrient availability reduces leaf area
J.E. Raymond
9
production and decreases photosynthetic capacity, and stands with suboptimal leaf area do not
grow at their maximum potential (Linder 1987, Fox et al. 2007b). Fertilization of these systems
can increase soil nutrient availability, translating to increased leaf area and hence improved stand
productivity. Empirical results from fertilization field trials in intensively managed loblolly pine
plantations show most nutrient limitations can be ameliorated with fertilization (Fox et al.
2007a).
Nutrient limitations for plants in most terrestrial ecosystems develop when the nutrient
demand exceeds the nutrient supply (Miller 1981, Chapin et al. 1986, Allen et al. 1990). In forest
plantations, stand N uptake progresses in a sigmoidal pattern, increasing with stand development as
plant N demand becomes unbalanced with plant N availability (Figure 1.2) (Switzer and Nelson
1972, Wells and Jorgenson 1975). Plant N availability in the soil can increase after site disturbances,
such as forest harvesting because conditions (temperature, moisture, aeration) favor decomposition
of the forest floor, coarse woody debris, and root turnover (Vitousek and Matson 1985, Fox et al.
1986). As the stand age progresses, N is increasingly immobilized in pools with varying turnover
times, and the environmental conditions conducive to high N availability decrease. The plant
available N required to maintain maximum growth gradually shifts until plant demand for N
exceeds the supply of plant available N in the soil (Miller 1981). As the stand transitions to plant
available N limitation, N fertilization is required to maintain optimal tree growth (Figure 1.2).
Fertilization studies using 224 kg ha-1 N plus 30 kg ha-1 P on loblolly pine plantations in
the southern United States show a mean fertilization growth response of 3 m3 ha-1 yr-1 over 8
years (Fox et al. 2007a) which has led to the fertilization of over 500,000 ha of these systems
annually (Albaugh et al. 2007). Despite a positive response for most pine plantations to N + P
fertilization in the South, certain sites fail to respond or respond negatively (Pritchett and Smith
J.E. Raymond
10
1975, Martin et al. 1999, Amateis et al. 2000, Carlson et al 2014). These inconsistent fertilization
results in southern pine plantations have led to a range in growth of 0 m3 ha-1 yr-1 to 10 m3 ha-1 yr-1
(Fox et al. 2007b).
Several empirical field trials indicate less than 50% of fertilizer N is taken up by loblolly
pine trees (Mead and Pritchett 1975, Albaugh et al. 1998, Blazier et al. 2006). The remaining
fertilizer N is partitioned into other ecosystem components with varying turnover timescales that
include: 1) loss from the system (ammonia (NH3) volatilization, leaching, nitrification,
denitrification); 2) understory (volunteer loblolly pine, deciduous tree/shrub/vine competition,
herbaceous species); 3) litterfall; 4) forest floor; 5) soil microbial community; and/or 6) mineral
soil (Figure 1.1 and 1.3) (Birk and Vitousek 1986, Albaugh et al. 2004). The fertilizer N
remaining in the system may become available to the loblolly pines in the future (Meason et al.
2004), but uncertainty remains concerning mechanisms controlling fertilizer N turnover from
ecosystem components. The high variability and uncertainty involved with understanding crop N
tree uptake, losses, pathways and mechanisms of fertilizer N cycling may contribute to the
variability in growth response observed in fertilizer studies.
1.2.5. Cycling of Fertilizer Nitrogen in Pine Plantations
The most common fertilizer N source used in southern loblolly pine plantations is
pelletized urea (CO(NH2)2) which is surface applied via aerial or ground broadcast methods
(Allen 1987). Urea is preferred because of a high N content (46% N) and ease of transport-
storage-application, translating to the lowest overall cost per pound of any type of fertilizer N
(Gould et al. 1986, Allen 1987, Harre and Bridges 1988, Fox et al. 2007b). Other fertilizer N
forms besides urea may be used, but their use is dependent primarily on associated costs
J.E. Raymond
11
(storage, delivery, application, etc.) and regional availability (Havlin et al. 2014, IPNI 2015, PSU
2015) (Table 1.1). Yet fertilizer N cycling in loblolly pine plantations is uncertain, and large
losses can occur following urea application which translate to reduced fertilizer nitrogen use
efficiency (Figure 1.3).
In the acidic forest soils supporting southern loblolly pine plantations, a urea granule
undergoes a series of chemical reactions (Hauck and Stephenson 1965). Urea hydrolysis is the
initial chemical reaction and is facilitated by the extracellular enzyme urease that is prevalent in
forest soil (Conrad 1942, Pettit et al. 1976, Marsh et al. 2005). This initial hydrolysis reaction
produces ammonium carbonate that dissociates to ammonium (NH4+) and bicarbonate (HCO3
-).
The bicarbonate consumes hydrogen (H+) ions near the dissolving urea granule which raises the
surrounding pH. The ammonium ions (NH4+) can be converted to NH3 from the elevated pH near
the urea granule and lost to the atmosphere by NH3 volatilization (Koelliker and Kissel 1988).
Urea N losses via NH3 volatilization in pine plantations are highly variable, but can be
rapid and significant (Nômmik 1973, Kissel et al. 2004, Cabrera et al. 2010, Zerpa and Fox 2011,
Elliot and Fox 2014). Losses from NH3 volatilization after urea fertilization range from less than
10% (Boomsma and Pritchett 1979, Craig and Wollum 1982), 10% to 40% (Nômmik 1973,
Zerpa and Fox 2011), to greater than 50% (Kissel et al. 2004, Kissel et al. 2009, Elliot and Fox
2014). Although factors influencing NH3 volatilization following urea fertilization are well
researched in agriculture (Volk 1970, Black et al. 1987, Kissel et al. 1988), less research has
focused on forests (Volk 1970, Nômmick 1973, Kissel et al. 2004, Elliot and Fox 2014). Results
from studies primarily in agroecosystems on NH3 volatilization losses are correlated with soil pH
(Ernst and Massey 1960, Cabrera et al. 1991, Kissel et al. 2009), soil moisture (Clay et al. 1990,
Kissel et al. 2004), type of mineral soil substrate (Cabrera et al. 2005, Kissel et al. 2009, Zerpa
J.E. Raymond
12
and Fox 2011), relative humidity (Cabrera et al. 2005), soil temperature (Ernst and Massey 1960,
Clay et al. 1990, Moyo et al. 1989), surficial wind speed (Watkins et al. 1972, Kissel et al. 2004),
precipitation (Craig and Wollum 1982, Kissel et al. 2004) and air temperature (Gould et al. 1973,
Craig and Wollum 1982, Koelliker and Kissel 1988). A forest floors (organic horizon), present in
forests but not agriculture systems, can also effect NH3 volatilization (Cabrera et al. 2005, Kissel
et al. 2009, Zerpa and Fox 2011) because urea N after dissolution may enter voids in
decomposing pine needles and be volatilized as environmental conditions change (Cabrera et al.
2005).
Urea N lost from after fertilization from NH3 volatilization is difficult to quantify because
fertilizer N losses are caused by the interaction among many factors. Because larger NH3
volatilization losses generally occur with higher temperatures and relative humidity (Craig and
Wollum 1982, Ferguson and Kissel 1986, Moyo et al. 1989), urea is usually applied during the
winter in the South under cooler, wetter conditions to reduce the likelihood of high NH3
volatilization losses (Ferguson and Kissel 1986, Moyo et al. 1989, Cabrera et al. 2010). Under
these conditions, urea dissolution and movement of fertilizer N into the soil increases (Black et
al. 1987, Paramasivan and Alva 1997). Large urea losses via NH3 volatilization have occurred
under even under low temperatures (Carmona and Byrnes 1990, Engel et al. 2011). For example,
Kissel et al. (2004) observed low NH3 volatilization in August when NH3 volatilization is
typically high because urea was applied on the same day as a significant precipitation event, but
high NH3 volatilization (45% to 58%) was observed during the same period under simulated,
minor precipitation events. These highly variable results for NH3 volatilization after urea
fertilization highlight the difficulty in predicting the magnitude of urea N loss from NH3
volatilization after N fertilization at any time of the year.
J.E. Raymond
13
When environmental conditions are not conducive to NH3 volatilization after urea
dissolution, NH4+ enters the soil which is enhanced by precipitation. The NH4
+ that moves into
the soil is by soils with a high H+ buffering capacity (high organic matter, clay, silt) (Fenn and
Kissel 1976, Ferguson et al. 1984). Once in the soil, NH4+ may: 1) undergo nitrification to form
nitrate (NO3-); 2) become immobilized by soil microbes; 3) taken up by plants (loblolly pines,
understory competition); or 4) be leached from the surface soil (Figure 1.1 and 1.3). Because
most pine plantations are N deficient and fertilized intermittently, fertilizer N cycling is tightly
coupled in processes 1 to 3 with 4 (leaching) a minor long term loss (Binkely et al. 1999).
1.2.6. Enhanced Efficiency Fertilizers
Urea applied during cooler, wetter months in pine plantations of the southern United
States reduces the potential for NH3 volatilization (Allen 1987, Allen et al. 2005, Fox et al.
2007a). During winter, lower mean temperatures and higher mean precipitation increases the
probability of urea dissolution and movement into the soil, hence reducing NH3 volatilization
loss. Yet conditions following winter urea fertilization in the South can still favor high rates of
NH3 volatilization (high relative humidity, temperatures, wind speeds, low precipitation).
Additionally, winter urea application may be asynchronous to seasonal plant N demand,
decreasing FNUE (Blazier et al. 2006). One alternative to urea application in cooler, wetter
conditions to minimize NH3 volatilization is the use of slow or controlled release fertilizers,
termed enhanced efficiency fertilizers (EEFs) (Hauck 1995, Azeem et al. 2014, IPNI 2015).
To improve FNUE in agroecosystems, slow release (SRN), controlled release (CRN) and
stabilized (SNF) N fertilizers were developed (Azeem et al. 2014, Fertilizer Institute 2015). CRN
is fertilizer N that is coated or encapsulated to alter the rate, pattern and duration of N release
J.E. Raymond
14
(Chien et al. 2009). SRN are N fertilizer formulations that gradually release fertilizer N slowly as
a result of microbial decomposition (Trenkel 1997). SNF is fertilizer N that is treated with
chemical compounds that inhibit rapid N transformation to less stable forms (Shaviv 1996,
2005). The SRN, CRN and SNF products can all be broadly categorized as enhanced efficiency
fertilizers (EEFs) (AAPFCO 2015). The Fertilizer Institute (2015) defines EEFs as fertilizer
products that reduce nutrient loss to the environment while increasing plant nutrient availability
by slowing nutrient release or conversion of the nutrient to forms less susceptible to losses. The
EEF N containing fertilizers are designed to: 1) increase N uptake by the crop; 2) decrease N
leaching; 3) lower toxicity; 4) provide extended N supply; 5) reduce NH3 volatilization and/or
nitrification losses of N; and 6) lower application cost (Allen 1984, Hauck 1985). Therefore,
EEFs can reduce fertilizer N loss and provide greater flexibility for fertilization under a variety
of weather conditions that enhance fertilizer N uptake by the crop (Hauck 1985, Goertz 1993,
Azeem et al. 2014). Although EEFs were developed to address FNUE issues in agroecosystems,
similar issues related to FNUE exist for southern pine plantations. Implementing EEF technology
into forest fertilization programs in southern pine plantations may improve FNUE and increase
the productivity of these systems. Table 1.2 highlights several EEFs used primarily in turf grass
management, horticulture, and high value agricultural products and was primarily adapted from
Havlin et al. (2014). If manufacturing costs of these products decreases in the future, many may
become more applicable to large scale agricultural and forestry (Trenkel 2010).
One SNF mechanism to reduce urea N loss is to add urease inhibitors to urea prior to
fertilization. Urease inhibitors are substances which temporarily inhibit the hydrolytic action on
urea by the urease enzyme, resulting in less urea N lost through NH3 volatilization (AAPFCO
2015). These products generally reduce urease activity for two to three weeks after fertilizer
J.E. Raymond
15
application (Gowariker and Krishnamurty 2009, Havlin et al. 2014) although under certain
conditions effectiveness can be longer (Engel et al. 2011). Urease is abundant in soils and
produced by numerous soil organisms and plants (Bremner and Douglas 1971, Bremner and Chai
1986, Antisari et al. 1996, Sanz-Cobena et al. 2008). When urease inhibitors are released to the
environment, they bind to the urease enzyme, and reduce the enzyme activity to provide time for
urea to dissolve and move into the soil. Once urea is in the soil, loss via NH3 volatilization is
reduced because the soil buffers the pH. Many compounds inhibit urease activity, but few of
these compounds are chemically stable when added to urea, effective when applied at low
concentrations and/or are non-toxic when applied in the environment (Hauck 1985, Azeem et al.
2014). The most widely used urease inhibitor is N-(n-Butyl) triphosphoric triamide (NBPT)
(Havlin et al. 2014). Urea impregnated with NBPT can reduce losses of fertilizer N via NH3
volatilization significantly compared to untreated urea (Engel et al. 2011, Raymond et al. 2016)
and may translate to improved productivity for desired species (Engel et al. 2011).
The CRN products generally have a urea granule base which is initially coated with a
compound (i.e. sulfur (S), boron, (B), copper (Cu)) and additionally sealed with a wax-like
substance to fill imperfections (Chien et al. 2009). Fertilizer N release from CRN depends on the
thickness and coating quality (Allen 1984). As the coating degrades in the environment, cracks
develop in the coating allowing for moisture to enter the product, and urea dissolution is
initiated. Urea N release to the environment is slowed by the coating compared to uncoated urea.
The substrate coating of CRN may reduce urease activity, and CRNs may also be impregnated
with urease or nitrification inhibitors to slow loss mechanisms as urea N is released to the
environment. Additionally, CRN products may include other nutrients in the coatings to address
additional nutrient deficiencies.
J.E. Raymond
16
An alternative CRN approach encapsulates fertilizer N (generally urea) in a semi-
permeable polymer coating. The coatings have small pores which allow water to enter the
capsules. As water enters the CRN product, urea dissolution occurs, the capsule expands, and the
resulting internal pressure of the capsule forces fertilizer N solution into the environment through
diffusion (Shaviv 2005). Because of the low mass of the polymer coatings, these products do not
significantly reduce the N percentage in the product as may occur with the aforementioned CRN
products (Chien et al. 2009). Release patterns for polymer coated CRN products are related to
the type of coating, soil moisture, temperature, relative humidity, precipitation, pH, and
microbial activity (Christianson 1988, Shoji et. al. 2001, Shaviv 2005).
1.2.7. Use of Stable Isotopes to Trace Nitrogen in Forest Ecosystems
Stable isotopes, specifically 15N, can be used to assess of nutrient deficiencies and
quantify fertilizer N uptake (Hauck 1968). Fertilizers enriched with stable isotopes (15N) can
trace the ultimate fate of applied N (Walker 1958, Hauck 1968, Powlson and Barraclough 1993)
and integrate ecosystem processes (Robinson 2001, Dawson et al. 2002, Templar et al. 2012).
Numerous 15N tracer studies were initially conducted in agroecosystems (Hauck and Bystrom
1971), but 15N tracer studies have also improved the understanding of N dynamics in natural
(Tietema et al. 1998, Currie and Nadelhoffer 1999, Dinkelmeyer et al. 2003, Nadelhoffer et al.
2004, Templar et al. 2012) and plantation (Walker 1958, Hauck 1968, Mead and Pritchett 1975,
Melin et al. 1983, Clinton and Mead 1994, Chang et al. 1996, Bubb et al. 1999, Mead et al. 2008,
Werner 2013) forests. The use of stable isotopes is often combined with other analytical methods
to improve the understanding of nutrient status and fertilizer responsiveness (Miller 1981, Birk
and Vitousek 1985, Sypert 2005).
J.E. Raymond
17
Fertilizers labeled with the stable isotope 15N can be traced through the ecosystem and
improve the understanding of the fate and cycling of N in forests (Peterson and Fry 1987,
Knowles and Blackburn 1993, Nadelhoffer and Fry 1994, Dawson et al. 2002, Weatherall 2005,
Templar et al. 2012). The productivity of most forests is limited by N despite relatively large
quantities of total N in the soil (Fisher and Binkley 2000). This is because only small amounts of
plant available N exist at any point in time in the ecosystem (Chapin et al. 1986, Vitousek and
Matson 1985, Fisher and Binkley 2000). The majority of N, ranging from 2 Mg ha-1 to 7 Mg ha-1, is
in the forest floor and mineral soil (Cole and Rapp 1981, Fahey et al. 1985, Likens and Bormann
1995, Fisher and Binkley 2000). Because of the large quantity of natural soil N, it is difficult to
distinguish between the N that occurs naturally in the soil and the N that originates from the
fertilizer (Nômmik 1990, Kiser and Fox 2012).
Response to fertilizer N is often assessed through changes in ecosystem metrics such as
foliar N concentration, leaf area index (LAI), C:N ratios, nutrient ratios, tree diameters, rooting
profiles, photosynthetic rates, soil respiration, soil solution measurements, and gross-net N
mineralization. Although these metrics provide valuable information on system responses to
fertilizer N, it can be difficult to discern pathways, mechanisms and partitioning of fertilizer N
within the ecosystem. Because of the difficulty in distinguishing N originating from the natural
environment or fertilizer, fertilizers can be enriched with stable isotopes (15N) to improve the
understanding of the effects of fertilization on ecosystem processes.
Elements naturally occurring in the environment have one or more stable isotopes with
slightly different molecular weights due to a difference in neutrons (Fry 2006). The ratio of
different isotopes in a compound is measured with an isotope ratio mass spectrometer (IRMS).
Current analytical techniques allow for the simultaneous measurement of the isotopic
J.E. Raymond
18
composition of several elements (C, N, O, H, S as examples) on an IRMS that can be coupled
with an elemental analyzer for nutrient concentration analysis on a single sample (Sulzman
2007).
During the IRMS analysis, the isotopic ratios of the compound are compared to a
standard ratio, and the difference between these ratios is expressed as the del value (δ) or per mil
(‰) (Fry 2006, Sulzman 2007) through the formula:
[1.1] δ15N = ((Rsample/Rstandard)-1) * (1000)
The Rsample is the ratio of the heavier isotope to lighter isotope of the sample, and the Rstandard is
the ratio of the heavier isotope to lighter isotope of the standard (Fry 2006, Sulzman 2007). The
standard used for N stable isotope analysis is atmospheric N2 gas which has a δ15N of 0. Samples
enriched in the heavier isotope will have positive δ value whiles samples enriched with the
lighter isotope will have negative δ values.
Two naturally occurring stable isotopes exist for N, 14N (99.63%) and 15N (0.3663%)
(Sulzman 2007). Although both isotopes behave similarly in the environment, certain kinetic and
biological reactions favor the lighter isotope (14N) in reaction products, which enriches
remaining substrate(s) in the heavier isotope (15N) in a process termed fractionation (Fry 2006).
Fractionation can create distinct isotopic signatures in ecosystem components, with δ15N values
ranging from -15 to +2, with increasingly negative values observed in vegetation and positive
values in deeper soil depths (Nadelhoffer and Fry 1994, Ben-David et al. 1998).
Nitrogen additions to ecosystems enriched with 15N improve the precision and accuracy
of tracing fertilizer N movement through the ecosystem by measuring 15N accumulation in each
ecosystem component (tree, competing vegetation, soil, etc.) (Powlson and Barrachlough 1993).
This 15N tracer technique has been used in many ecosystems to improve the understanding of N
J.E. Raymond
19
cycling including agriculture (Hauck 1973, Hauck and Bremner 1976), forests (Nadelhoffer and
Fry 1994, Templar et al. 2012), stream ecology (Simon et al. 2003), oceanography (Kline 1999),
and food webs (Ben-David et al.1998, Setälä et al. 2002). Yet due to the high expense of
producing 15N labeled substrates, their use is generally limited to smaller field and laboratory
experiments.
Two techniques using 15N as a tracer in forest ecosystem research are: 1) using small
amounts (few kg N ha-1) of heavily enriched (60-90 Atom Percent- AP) 15N labeled fertilizer; or
2) larger amounts (few hundred kg N ha-1) of lightly enriched (2.5-10 AP) 15N labeled fertilizer.
Forest ecosystem research has used both techniques, from highly enriched, low N concentration
additions (Koopmans et al. 1996, Seely and Lajtha 1997, Tietema et al. 1998, Perakis and Hedin
2001) to slightly enriched, higher N concentration additions (Currie and Nadelhoffer 1999,
Dinkelmeyer et al. 2003, Nadelhoffer et al. 2004). Perakis et al. (2005) applied a gradient of
enriched 15NH415NO3 to an ecosystem, ranging from 0.2 kg N ha-1 99 AP to 640 kg N ha-1 2.5 AP
in an attempt to optimize tracer techniques. Their results found that both slightly and highly
enriched substrates were detectable as tracers through the ecosystem and the decision of which
technique to use should be based more on the specific research question.
This study will use fertilizers enriched with 15N (0.5 AP, ~370‰) to trace the fate of
fertilizer N in intensively managed mid-rotation loblolly pine plantations across the southern
United States. The 15N enrichment is 20% greater than the natural abundance range for forest
ecosystem components, ranging from 0.3626 AP to 0.3718 AP (Nadelhoffer and Fry 1994). This
study balances the tracer technique suggested by Nadelhoffer and Fry (1994) by using moderate
enrichments of 0.5 AP and high N concentrations (urea, 46% N) while simulating the standard
operational fertilizer N application rate (224 kg N ha-1) in southern industrial pine plantations.
J.E. Raymond
20
1.3. Objectives
The objective of this study is to assess the fate of fertilizer N through the use of four
fertilizer formulations labeled with the stable isotope 15N in mid-rotation loblolly pine
plantations across the southern United States. Specific focus will be on N uptake by loblolly
pines. The four fertilizer formulations to be assessed include: 1) urea; 2) monoammonium
phosphate (MAP) coated urea + NBPT (CUF); 3) urea + NBPT (NBPT); and 4) a homogenous
polymer coated controlled release fertilizer (PCU). All fertilizer N formulations will be applied
at the industry standard of 224 kg ha-1 N combined with 28 kg ha-1 P. Two application seasons,
spring (March-April) and summer (June) will be assessed. Ammonia volatilization will be
measured following fertilization. Results from this study will provide information on the
fundamental cycling of fertilizer N in loblolly pine plantations across the southern United States
to improve fertilization techniques that will translate to improved economic efficiencies and
environmental stewardship concerning fertilization in these systems.
J.E. Raymond
21
Literature Cited AAPFCO. 2011. Association of American Plant Food Control Officials. Accessed
11/10/2015. http://www.aapfco.org/index.html. Addoms, R.M. 1937. Nutritional studies on loblolly pine. Plant Physiol. 12(1): 199–205. Albaugh, T.J., H.L. Allen, P.M. Dougherty, L.W. Kress, and J.S. King. 1998. Leaf-area and
above- and belowground growth responses of loblolly pine to nutrient and water additions. For. Sci. 44(2):317-328.
Albaugh, T.J., H. L. Allen, P. M. Dougherty, and K. H. Johnsen. 2004. Long term growth
responses of loblolly pine to optimal nutrient and water resource availability. For. Ecol. Manage. 192:3-19.
Albaugh, T.A., H.L. Allen, and T.R. Fox. 2007. Historical patterns of forest fertilization in
the southern United States from 1969 to 2004. South. J. Appl. For. 31(3):129-137. Allen, H.L. 1987. Forest fertilizers: nutrient amendment, and productivity, and environmental
impact. J. For. 85:37-46. Allen, H.L., P.M. Dougherty, and R.G. Campbell. 1990. Manipulation of water and
nutrients - practice and opportunity in southern U.S. pine forests. For. Ecol. Manage. 30:437-453.
Allen, H.L., T.R. Fox, and R.G. Campbell. 2005. What’s ahead for intensive pine plantation
silviculture in the South? South. J. Appl. For. 29(2):62-69. Allen, S.E. 1984. Slow-release nitrogen fertilizers. In Nitrogen in crop production. Ed. R.D.
Hauck. American Society of Agronomy. Madison, WI. pp. 195-206. Amateis, R. L., J. Liu, M. J. Ducey, and H. L. Allen. 2000. Modeling response to midrotation
nitrogen and phosphorus fertilization in loblolly pine plantations. South. J. Appl. For. 24:207-212.
Amponsah, I.G., V.J. Lieffers, P.G. Comeau, S.M. Landha, and S.M. Landhäusser. 2004.
Nitrogen-15 Uptake by Pinus contorta seedlings in relation to phonological stage and season. Scand. J. For. Res. 19:329-338.
Antisari, L.V., C. Marzadori, P. Gioacchini, S. Ricci, and C. Gessa. 1996. Effects of the
urease inhibitor N-(n-butyl) phosphorothioic triamide in low concentrations on ammonia volatilization and evolution of mineral nitrogen. Biol. Fert. Soils. 22:196-201.
Aust, W. M., and C. R. Blinn. 2004. Forestry best management practices for timber
harvesting and site preparation in the eastern United States: an overview of water quality and productivity research during past 20 years. Water Air and Soil Poll. Focus. 4:5-36.
J.E. Raymond
22
Azeem, B., K. KuShaari, Z.B. Man, A. Basit, and T.H. Thanh. 2014. Review on materials & methods to produce controlled release coated urea fertilizer. Journal of Controlled Release. 181:11–21.
Baker, J.B., G.L. Switzer, and L.E. Nelson. 1974. Biomass production and nitrogen recovery
after fertilization of young loblolly pines. Soil Sci. Soc. Am. Proc. 38(6):959 –961. Ben-David, M., T.A. Hanley, and D.M. Schell. 1998. Fertilization of terrestrial vegetation by
spawning Pacific salmon: the role of flooding and predator activity. Oikos. 83:47-55. Binkley, D., and S.C. Hart. 1989. The components of nitrogen availability assessments in
forest soils. Adv. Soil Sci. 10:57–112. Binkley, D. H. Burnham, and H.L. Allen. 1999. Water quality impacts of forest fertilization with
nitrogen and phosphorus. For. Ecol. Manage. 121:191-213. Birk, E.M., and P.M. Vitousek. 1986. Nitrogen availability and nitrogen use efficiency in
loblolly pine stands. Ecology. 67(1):69-79. Black, A.S., R.R. Sherlock, and N.P. Smith. 1987. Effect of timing of simulated rainfall on
ammonia volatilization from urea applied to soil of varying moisture content. J. Soil Sci. 38:679-687.
Blazier, M.A., T.C. Hennessey, P. Dougherty, R. Campbell. 2006. Nitrogen accumulation
and use by a young loblolly pine plantation in southeast Oklahoma: Effects of fertilizer formulation and date of application. South. J. Appl. For. 30:66-78.
Boomsma, D., and W. Pritchett. 1979. Nitrogen losses from urea, ammonium sulfate, and
ammonium nitrate applications to a slash pine plantation. Proc. Soil Crop Sci. Soc. Fla. 39:679–687.
Bowen, G.D., and E. K. S. Nambiar (Eds.). 1984. Nutrition of plantation forests. Academic
press, London, England. Bremner, J.M., and L.A. Douglas. 1971. Inhibition of urease activity in soils. Soil Biol.
Biochem. 3:297-307.
Bremner, J. M., and H.S. Chai. 1986. Evaluation of N-butyl phosphorothioic triamide for retardation of urea hydrolysis in soil. Commun. Soil Sci. Plant Anal. 17:337–351.
Bubb, K.A., Z.H. Xu, J.A. Simpson, and P.G. Saffingna. 1999. Growth response to
fertilization and recovery of l5N-labelled fertiliser by young hoop pine plantations of subtropical Australia. Nutrient Cycling in Agroecosystems 54:81-92.
Cabrera, M.L., D.E. Kissel, and B.R. Bock. 1991. Urea hydrolysis in soil - effects of urea
concentration and soil-pH. Soil Biol. Biochem. 23(12):1121-1124.
J.E. Raymond
23
Cabrera, M.L., D.E. Kissel, N. Vaio, J. R. Craig, J.A. Rema, and L.A. Morris. 2005. Loblolly pine needles retain urea fertilizer that can be lost as ammonia. Soil Sci. Soc. Am. J. 69(5):1525-1531.
Cabrera, M.L., D.E. Kissel, J.R. Craig, N.P. Qafoku, N. Vaio, J.A. Rema, and L.A. Morris. 2010.
Relative humidity controls ammonia loss from urea applied to loblolly pine. Soil Sci. Soc. Am. J. 74:543–549. doi:10.2136/sssaj2009.0220.
Carlson, C. A., T.R. Fox, H.L. Allen, T.J. Albaugh, R.A. Rubilar, and J.L. Stape. 2014.
Growth response of loblolly pine in the southeast united states to midrotation applications of nitrogen, phosphorus, potassium, and micronutrients. For. Sci. 60(1):157-169.
Carmona, G.C., and B.H. Byrnes. 1990. Temperature and low concentration effects of the
urease inhibitor N-(n-butyl thiophosphoric triamide (NBPT) on ammonia volatilization from urea. Soil Biol. Biochem. 22(7):933–937. doi:10.1016/0038-0717(90)90132-.
Carter, R. 1992. Diagnosis and interpretation of forest stand nutrient status. In Forest
fertilization: sustaining and improving nutrition and growth of western forests. (Eds.) H.N. Chappel, G.F. Weetman, R.E. Miller. Institute of Forest Resources, No. 73. University of Washington, Seattle, pp. 90-97.
Chang, S. X., C.M. Preston, K. McCullough, G. Weetman, and J. Barker. 1996. Effect of
understory competition on distribution and recovery of 15N applied to a western red cedar - western hemlock clear-cut site. Can. J. For. Res. 26:313-321.
Chapin, F.S., P.M. Vitousek, and K. Van Cleve. 1986. The nature of nutrient limitation in plant-
communities. Am. Nat. 127: 48–58. doi: 10.1086/284466. Chien, S.H., L. I. Prochnow, and H. Cantarella. 2009. Recent developments of fertilizer
production and use to improve nutrient efficiency and minimize environmental impacts. In Advances in Agronomy. 102. Elsevier Inc. pp. 267-322. DOI: 10.1016/S0065-2113(09)0.
Christianson, C.B. 1988. Factors affecting N release from reactive layer coated urea. Fert. Res.
16:273-284. Clay, D. E., G.L. Malzer, and J.L. Anderson. 1990. Ammonia volatilization from urea as
influenced by soil temperature, soil water content, and nitrification and hydrolysis inhibitors. Soil Sci. Soc. Am. J. 54(1): 263–266.
Clinton, P.W., and D.J. Mead. 1994. Competition for nitrogen between Pinus radiata and pasture. I. Recovery of 15N after one growing season. Can. J. For. Res. 24(5):882-888. doi 10.1139/x94-116
Cole, D.W., and M. Rapp. 1981. Elemental cycling in forest ecosystems. In: D.E. Reichle et. al.,
editors, Dynamic properties of forest ecosystems. Cambridge University Press, London, England. p. 76-408.
J.E. Raymond
24
Conard, J.P. 1942. The occurrence and origin of urease like activities in soils. Soil Sci. 54(5): 367-380.
Craig, J., and A. Wollum. 1982. Ammonia volatilization and soil nitrogen changes after urea and
ammonium nitrate fertilization of Pinus taeda L. Soil Sci. Soc. Am. J. 46:409–414. doi:10.2136/sssaj1982.03615995004600020040x.
Crane, W.J.D. 1972. Urea-nitrogen transformations, soil reactions, and elemental movement of
via leaching and volatilization, in a coniferous forest ecosystem following fertilization. Ph.D. dissertation. University of Washington.
Currie, W.S., and K.J. Nadelhoffer. 1999. Dynamic redistribution of isotopically labeled
cohorts of nitrogen inputs in two temperate forests. Ecosystems. 2:4-18. Davidson, E.A., J.M. Stark, and M.K. Firestone. 1990. Microbial production and consumption of
nitrate in an annual grassland. Ecology. 71:1968 –1975. Dawson, T.E., S. Mambelli, A.H. Plamboeck, P.H. Templer, and K.P. TuSource. 2002. Stable
isotopes in plant ecology. Annual Review of Ecology and Systematics. 33:507-559. Dinkelmeyer, H., J. Lehmann, A. Renck, L. Trujillo Jr., G. Gebauer, and K. Kaiser. 2003.
Nitrogen uptake from 15N-enriched fertilizer by four tree crops in an Amazonian agroforest. Agroforest. Syst. 57:213–224.
Elliot, J.R., and T.R. Fox. 2014. Ammonia volatilization following fertilization with urea or ureaform in a thinned loblolly pine plantation. Soil Sci. Soc. Am. J. 78:1469–1473. doi:10.2136/sssaj2013.12.0512n.
Engel, R., C. Jones, and R. Wallander. 2011. Ammonia volatilization from urea and mitigation
by NBPT following surface application to cold soils. Soil Sci. Soc. Am. J. 75:2348–2357. doi:10.2136/sssaj2011.0229.
Ernst, J.W., and H.F. Massey. 1960. The effect of several factors on volatilization of ammonia
formed from urea in the soil. Soil Sci. Soc. Am. Proc. 24(2):87–90. Fahey T.J., J.B. Yavitt, J.A. Pearson, and D.H. Knight. 1985. The nitrogen cycle in lodgepole
pine forests, Southeastern Wyoming. Biogeochemistry 1:257-275. Fenn, L.B., and D.E. Kissel. 1976. The influence of cation exchange capacity and depth of
incorporation on ammonia volatilization from ammonium compounds applied to calcareous soils. Soil Sci. Soc. Am. J. 40(3):394-398.
Ferguson, R.B., D.E. Kissel, J.K. Koelliker, and W.S. Basel. 1984. Ammonia volatilization from
surface applied urea: effect of hydrogen ion buffering capacity. Soi Sci. Soc. Am. J. 48:578-582.
J.E. Raymond
25
Ferguson, R., and D. Kissel. 1986. Effects of drying on ammonia volatilization from surface- applied urea. Soil Sci. Soc. Am. J. 50(2):485–490.
Fertilizer Institute. Accessed 11/10/2015.
https://www.tfi.org/introduction-fertilizer/nutrient-science/enhanced-efficiency-fertilizers.
Finzi A.C., N. Van Breemenm, and C.D. Canham. 1998. Canopy tree-soil interactions within
temperate forests: Species effects on soil carbon and nitrogen. Ecol. Appl. 8:440–446. Fisher, R. F.; Garbett, W.S. 1980. Response of semi-mature slash and loblolly pine plantations to
fertilization with nitrogen and phosphorus. Soil Sci. Soc. Am. J. 44: 850-854. Fisher, R.F., and D. Binkley. 2000. Ecology and management of forest soils. John Wiley &
Sons, New York, NY. Fox, T.R., J.A. Burger, and R.E. Kreh. 1986. Effects of site preparation on nitrogen dynamics in the southern Piedmont. For. Ecol. Manage. 15:241-256. Fox, T.R. 2000. Sustained productivity in intensively managed forest plantations. For. Ecol.
Manage. 138:187–202. Fox, T.R., H. L. Allen, T. J. Albaugh, R. Rubilar, and C.A. Carlson. 2007a. Tree nutrition and
forest fertilization of pine plantations in the southern United States. South. J. Appl. For. 31(1):5-11.
Fox, T.R., E.J. Jokela, H.L. Allen. 2007b. The development of pine plantation silviculture in
the southern United States. J. For. 105(5):337-347. Fry, B. 2006. Stable isotope ecology. Springer, New York, NY. Galloway, J.N., F. J. Dentener, D. G. Capone, E. W. Boyer, R. W. Howarth, S. P. Seitzinger, G.
P. Asner, C. C. Cleveland, P. A. Green, E. A. Holland, D. M. Karl, A. F. Michaels, J. H. Porter, A. R. Townsend, and C. J. Vörösmarty. 2004. Nitrogen cycles: past, present, and future. Biogeochemistry. 70(2):153-226.
Gent, J.A., H.L.Allen, R.G. Campbell, and C.G. Wells. 1986. Magnitude, duration, and
economic analysis of loblolly pine growth response following bedding and phosphorus fertilization. South. J. Appl. For. 10:124–128.
Goertz, H.M. 1993. Controlled Release Technology. Kirk-Othmer Encyclopedia of
Chemical Technology, Vol.7. p. 251-274. Controlled Release Technology (Agricultural). Gould, W.D., F.D. Cook, and R.G. Webster. 1973. Factors affecting urea hydrolysis in several
Alberta soils. Plant Soil. 38(2):393–401.
J.E. Raymond
26
Gould, W. D., C. Hagedorn, and R.G.L. McCready. 1986. Urea transformation and fertilizer efficiency in soil. Adv. Agron. 40:209–238.
Gowariker, V., V.N. Krishnamurthy, S. Gowariker, M. Dhanorkar, K. Paranjape. 2009. The
fertilizer encyclopedia. John Wiley & Sons, Inc., Hoboken, NJ. Grant, D. and D. Binkley. 1987. Rates of free living nitrogen fixation in some Piedmont forest
types. For. Sci. 33:548-55. Groffman, P.M., D.R. Zak, S. Christensen, A.R. Mosier, and J.M. Tiedje. 1993. Early spring
nitrogen dynamics in a temperate forest landscape. Ecology. 74:1579-1585. Groffman, P.M., and E.J. Rosi-Marshall. 2013. The nitrogen cycle. In: K.C. Weathers, D.L.
Strayer, G.E. Likens editors, Fundamentals of ecosystem science. Elsevier. Boston, MA. Gurlevik N., D.L. Kelting, H.L. Allen. 2004. Nitrogen mineralization following vegetation
control and fertilization in a 14-year-old loblolly pine plantation. Soil Sci Soc Am J 68:272–281.
Hart, S.C., J.M. Stark, E.A. Davidson, and M.K. Firestone. 1994. Nitrogen mineralization,
immobilization, and nitrification. In: R.L. Weaver et al. editors, Methods of soil analysis, Part 2. Soil Sci. Soc. Am. Madison, WI.
Harre, E.A., and J.D. Bridges. 1988. Importance of urea fertilizers. In: B.R. Bock and
D.E. Kissel, editors, Ammonia volatilization from urea fertilizers. Bull. Y-206. National Fertilizer Development Center, Tennessee Valley Authority, Muscle Shoals, AL. p. 1-15.
Hauck, R.D., and H.F. Stephenson. 1965. Nitrification of nitrogen fertilizers. Effect of
nitrogen source, size, and pH of the granule, and concentration. J. Agr. Food Chem. 13(6): 486-492.
Hauck, R.D. 1968. Nitrogen source requirements in different soil-plant systems. p. 47-57. In
Forest fertilization: theory and practice. Muscle Shoals, Alabama: TVA National Fertilizer Development Center.
Hauck, R.D., and M. Bystrom. 1971. 15N- A selected bibliography for agricultural scientists.
The Iowa State University Press, Ames, Iowa. p. 206. Hauck, R.D. 1973. Nitrogen tracers in nitrogen cycle studies-past and future needs. J. Environ.
Qual. 3:317–327. Hauck, R.D., and J.M. Bremner. 1976. Use of tracers for soil and fertilizer research. Adv. Agron.
28:219:266. Hauck, R.D. 1985. Slow release and bio-inhibitor-amended nitrogen fertilizers. In: O.P.
Engelstad, editor, Fertilizer technology and use, 3rd Ed. p. 293-322.
J.E. Raymond
27
Havlin, J.L., S.L. Tisdale, W.L. Nelson, J.D. Beaton. 2014. Soil fertility and fertilizers- an introduction to nutrient management. 8th Ed. Pearson. Boston, MA. p. 516.
Hobbs, C.H. 1944. Studies on mineral deficiency in pine. Plant Physiol. 19(4):590-602. Hockman, J.N., and H.L. Allen. 1990. Nutritional diagnoses in loblolly pine stands using a
DRIS approach. In: Gessel, S.P et. al. (eds.). Sustained productivity of forest soils. Procedings of the 7th N. American Forest Soils Conference. University of B.C., Faculty of Forestry Publication. Vancouver, B.C. 525 p.
Howard, J.L. 2003. U.S. timber production, trade, consumption, and price statistics 1965 to
2002. Res. Pap. FPL-RP-615. U.S. Department of Agriculture, Forest Service, Forest Products Laboratory, Madison, WI.
IPNI. 2015. Nutrient source specifics. International Plant Nutrition Institute. Accessed Web Site
on 9/1/2015. https://www.ipni.net/specifics-en. Jokela, E.J. and A.J. Long. 2000. Using soils to guide fertilizer requirements for southern
pines. Circular No. 1230. Florida Cooperative Extension Service, Institute of Food and Agricultural Sciences, University of Fla.
Jokela, E.J., and T.A Martin. 2000. Effects of ontogeny and soil nutrient supply on production,
allocation, and leaf area efficiency in loblolly and slash pine stands. Can. J. For. Res. 30:1511-1524.
Johnson, D.W. and D.E. Todd. 1988. Nitrogen fertilization of young yellow poplar and loblolly
pine plantations at differing frequencies. Soil Sci. Soc. Am. J. 52(5):1468 –1477. Kissel, D.E., and M.L. Cabrera. 1988. Factors affecting urea hydrolysis. In: B.R. Bock and D.E.
Kissel, editors, Ammonia volatilization from urea fertilizers. National Fertilizer Development Center Bull. Y-206. Tennessee Valley Authority. Muscle Shoals, AL. p. 53-66.
Kissel, D., M. Cabrera, N. Vaio, J. Craig, J. Rema, and L. A. Morris. 2004. Rainfall timing and
ammonia loss from urea in a loblolly pine plantation. Soil Sci. Soc. Am. J. 68:1744–1750. doi:10.2136/sssaj2004.1744.
Kissel, D., M.L. Cabrera, N. Vaio, J.R. Craig, J.A. Rema, and L.A. Morris. 2009. Forest floor
composition and ammonia loss from urea in a loblolly pine plantation. Soil Sci. Soc. Am. J. 73(2):630–637. doi:10.2136/sssaj2007.0377.
Kiser, L.C. and T.R. Fox. 2012. Soil accumulation of nitrogen and phosphorus following
annual fertilization of loblolly pine and sweetgum on sandy sites. Soil Sci. Soc. Am. J. 76:2278-2288.
J.E. Raymond
28
Kline, T.C. Temporal and spatial variability of 13C/12C and 15N/14N in pelagic biota of Prince William Sound, Alaska. 1999. Can. J. Fisheries and Aquatic Science. 56:94-117.
Knowles, R., and T.H. Blackburn. 1993. Nitrogen isotope techniques. Academic Press, Inc, New
York, NY. Koelliker, J.K. and D.E. Kissel. 1988. Chemical equilibria affecting ammonia volatilization. In:
B.R. Bock and D.E. Kissel, editors, Ammonia volatilization from urea fertilizers. Bull. Y206 National Fertilizer Development Center. Tennessee Valley Authority. Muscle Shoals, AL. p. 37-52.
Koopmans, C.J., A. Tietema, and A.W. Boxman. 1996. The fate of 15N enriched throughfall in
two coniferous forest stands at different nitrogen deposition levels. Biogeochemistry. 34:19-44.
Lambers, H., F.S. Chapin, and T. L. Pons. 2008. Plant physiological ecology 2nd Ed. Springer.
New York, NY. Li, B., S.E. Mckeand, and H.L. Allen. 1991. Genetic variation in nitrogen use efficiency of
loblolly pine seedlings. For. Sci. 37(2):613– 626. Likens, G.E. and F.H. Bormann. 1995. Biogeochemistry of a forested ecosystem 2nd Ed. Springer-Verlag, New York, NY. Linder, S. 1987. Responses to water and nutrients in coniferous ecosystems. In: E.D. Schulze and
H.Z. Wolfer, editors. Potentials and limitations of ecosystems analysis, Ecol. Studies 61. Springer-Verlag. New York, NY. p. 180-202.
Littke, K.M., R.B. Harrison, D. Zabowski, D.G. Briggs, and D.A. Maguire. 2014. Effects of
geoclimatic factors on soil water, nitrogen, and foliar properties of Douglas-fir plantations in the Pacific Northwest. For. Sci. 60(6): 1118-1130. doi: http://dx.doi.org/10.5849/forsci.13-141.
Mahendrappa, M.K. 1975. Ammonia volatilization from some forest floor materials following urea fertilization. Can. J. For. Res. 5(2):210-216. Marsh, K.L., G.K. Sims, and R.L. Mulvaney. 2005. Availability of urea to autotrophic ammonia-
oxidizing bacteria as related to the fate of 14C and 15N labeled urea added to soil. Biol Fertil Soils. 42:137-145. DOI 10.1007/s00374-005-0004-2.
Martin, S.W., R.L. Bailey, and E.J. Jokela. 1999. Growth and yield predictions for lower Coastal Plain slash pine plantations fertilized at mid-rotation. South. J. Appl. For. 23:39-45. Mead, D.J., and W. L. Pritchett. 1975. Fertilizer movement in a slash pine ecosystem. 1. Uptake
of N and P and N movement in the soil. Plant Soil. 43:451-465.
J.E. Raymond
29
Mead, D.J., Chang, S.X. and Preston, C.M. 2008. Recovery of 15N-urea 10 years after application to a Douglas-fir pole stand in coastal British Columbia. For. Ecol. Man. 256:694-701.
Meason D.F., D. Markewitz D., and R.E. Will. 2004. Annual fertilization and interspecific
competition control: effects on in situ forest floor nitrogen fluxes of different-aged Pinus taeda stands in southeast Georgia, USA. Can. J. For. Res. 34(9):1802-1818.
Melin J., H. NÔmmik, U. Lohm, and J. Flower-Ellis J. 1983. Fertilizer nitrogen budget in a
Scots pine ecosystem attained by using root-isolated plots and 15N tracer technique. Plant Soil 74:249–263.
Miller, H.G., J.M. Cooper, J.D. Miller, O.J.L. Pauline. 1979. Nutrient cycles in pine and
their adaptation to poor soils. Can. J. For. Res. 9:19–26. Miller, H.G. 1981. Forest fertilization: Some guiding concepts. Forestry. 54(2):157-157. Morrison, I.K. 1974. Mineral nutrition of conifers with special reference to nutrient status
interpretation: a review of literature. Canadian Forest Service, Department of the Environment. Pub. No. 1343. pp. 74.
Moyo, C.C., D. Kissel, M.L. Cabrera. 1989. Temperature effects on soil urease activity. Soil
Biol. Biochem. 21:935–938. doi:10.1016/0038-0717(89)90083-7. Nabuurs, G.J., O. Masera, K. Andrasko, P. Benitez-Ponce, R. Boer, M. Dutschke, E. Elsiddig, J.
Ford-Robertson, P. Frumhoff, T. Karjalainen, O. Krankina, W.A. Kurz, M. Matsumoto, W. Oyhantcabal, N.H. Ravindranath, M.J. Sanz Sanchez, and X. Zhang. 2007. Climate Change 2007: Mitigation. Contribution of Working Group III to the Fourth Assessment Report of the Intergovernmental Panel on Climate Change [B. Metz, O.R. Davidson, P.R. Bosch, R. Dave, L.A. Meyer (eds)], Cambridge University Press, Cambridge, United Kingdom and New York, NY, USA.
Nadelhoffer, K.J., and B. Fry. 1994. Nitrogen isotope studies in forest ecosystems. In: K. Lajtha and R.H. Michener, editors, Stable isotopes in ecology and environmental science. Blackwell Scientific Publications, New York, NY. p. 22-44.
Nadelhoffer, K.J., B.P. Colman, W.S. Currie, A. Magill, J.D. Aber. 2004. Decadal-scale fates of
15N tracers added to oak and pine stands under ambient and elevated N inputs at the Harvard Forest (USA). For. Ecol. Manage. 196:89-107.
Nômmik, H. 1973. The effect of pellet size on the ammonia loss from urea applied to forest soil.
Plant Soil. 39:309–318. doi:10.1007/BF00014798.
J.E. Raymond
30
Nômmik, H. 1990. Application of 15N as a tracer in studying fertilizer nitrogen transformations and recovery in coniferous ecosystems. In: A.P. Harrison et al., editors, Nutrient cycling in terrestrial ecosystems: field methods, application and interpretation. Elsevier Applied Science, New York, NY. p. 277-291.
Norman, J.S., J.E. Barrett. 2014. Substrate and nutrient limitation of ammonia-oxidizing bacteria
and archaea in temperate forest soil. Soil Biol. Biochem. 69:141-146. Norman, J. S., L. Lin, and J. E. Barrett. 2015. Paired carbon and nitrogen metabolism by
ammonia-oxidizing bacteria and archaea in temperate forest soils. Ecosphere 6(10):176. http://dx.doi.org/10.1890/ES14-00299.1
Oswalt, S.N., W.B. Smith, W.P.D. Miles, and S.A. Pugh. 2014. Forest Resources of the United
States, 2012: a technical document supporting the Forest Service 2015 update of the RPA Assessment. Gen. Tech. Rep. WO-91. U.S. Department of Agriculture, Forest Service, Washington DC.
Pang, P.C.K. 1985. Distribution and recovery of 15N after fertilization of Douglas-fir saplings
with different nitrogen sources. Plant Soil. 84:167-174. Paramasivam, S., and A.K. Alva. 1997. Leaching of nitrogen forms from controlled release
fertilizers. Commun. Soil Sci. Plant Anal. 28(17-18):1663-1674. Perakis, S. S., and L. O. Hedin. 2001. Fluxes and fates of nitrogen in soil of an unpolluted old-
growth temperate forest, southern Chile. Ecology. 82(8):2245–2260. Perakis, S.S., J.E. Compton, and L.O.Hedin. 2005. Nitrogen retention across a gradient of N
additions to an unpolluted temperate forest soil in Chile. Ecology. 86(1):96-105. Peterson, B.J., and B. Fry. 1987. Stable isotopes in ecosystem studies. Ann. Rev. Ecol. Syst.
18:293-320. Pettit, N.M., A.R.J. Smith, R.B. Freedman, and R.G. Burns. 1976. Soil urease: Activity, stability
and kinetic properties. Soil Biol. Biochem. 8(6):479–484. Piatek, K. B., and H.L. Allen. 1999. Nitrogen mineralization in a pine plantation fifteen years
after harvesting and site preparation. Soil Sci. Soc. Amer. J. 63(4):990-998. Powlson, D.S., and D. Barraclough. 1993. Mineralization and assimilation in soil-plant systems.
In: R. Knolwes et al., editors, Nitrogen isotope techniques. Academic Press, Inc., New York., NY. p. 209-242.
Pritchett, W.L., and W.H. Smith. 1975. Forest fertilization in the US Southeast. In: Forest
soils and forest land management. Proc. of the Fourth North American Forest Soils Conference. Laval University Press, Quebec, QC, Canada. p. 467-476.
J.E. Raymond
31
Pritchett, W.L., and N.B. Comerford. 1982. Long term response to phosphorus fertilization on selected Southeastern Coastal Plain soils. Soil Sci. Soc. Am. J. 46:640–644.
PSU. 2015. The agronomy guide 2015-2016. Penn State University. Accessed web site on 9/1/2015. http://extension.psu.edu/agronomy-guide/extension_publication_file. Raymond, J.E., T.R. Fox, B. Strahm, J. Zerpa. 2016. Ammonia volatilization following
nitrogen fertilization with enhanced efficiency fertilizers and urea in loblolly pine plantations of the southern United States. In Review.
Richter D.D., D. Markewitz, P.R. Heine, J. Vin, J. Raides, K. Tian, and C.G. Wells. 2000.
Legacies of agriculture and forest regrowth in the nitrogen of old-field soils. For. Ecol. Manage. 138(1/3):233-248.
Robinson, D. 2001. δ15N as integrator of the nitrogen cycle. Trends Ecol. Evol. 16:153–162. Salifu K.F., M.A. Islam, and D.F. Jacobs. 2009. Retranslocation, plant and soil recovery of
nitrogen-15 applied tobareroot black walnut seedling. Commun. Soil Sci. Plant Anal. 40:1408–1417.
Sampson, D.A., and H.L. Allen. 1999. Regional influences of soil available water and climate, and leaf area index on simulated loblolly pine productivity. For. Ecol. Manage. 124:1-12. Sanz-Cobena, A., T.H. Misselbrook, A. Arce, J.I. Mingot, J.A. Diez, and A. Vallejo. 2008. An
inhibitor of urease activity effectively reduces ammonia emissions from soil treated with urea under Mediterranean conditions. Agric. Ecosyst. Environ. 126:243–249.
Scott, N.A., and D. Binkley. 1997. Foliage litter quality and annual N mineralization:
comparison across North American forest sites. Oecologia. 111:151-159. Schimel, J.P. and J. Bennett. 2004. Nitrogen mineralization: challenges of a changing paradigm.
Ecology. 85(3):591-602. Sedjo, R.A. 2001. From foraging to cropping: the transition to plantation forestry, and
implications for wood supply and demand. Unasylva 52 (2001/1) No. 204. URL:http://www.fao.org/DOCREP/003/X8820E/x8820e06.htm#P0_0.
Seely, B., and K. Lajtha. 1997. Application of a 15N tracer to simulate and track the fate of
atmosphericallydeposited N in the coastal forests of the Waquoit Baywatershed, Cape Cod, Massachusetts. Oecologia. 112:393–402.
Setälä, H., and T. Aarnio. 2002. Vertical stratification and trophic interactions among other
organisms of a decomposer food web – a field experiment using 15N as a tool. Europe. J. Soil Biol. 38:29-34.
J.E. Raymond
32
Shaviv, A. 1996. Plant response and environmental aspects as affected by rate and pattern of nitrogen release from controlled release N fertilizers. In: V. Clempt et al., editors, Progress in nitrogen cycling studies. Kluwer, Netherlands. p. 285-291.
Shoji, S., J. Delgado, A. Mosier, and Y. Miura. 2001. Use of controlled release fertilizers and
nitrification inhibitors to increase nitrogen use efficiency and to conserve air and water quality. Comm. Soil Sci. Plant Anal. 32(7-8):1051-1070. doi:10.1081/CSS-100104103
Shrestha, R., B.D. Strahm, and E.B. Sucre. 2014. Nitrous oxide fluxes in fertilized Pinus taeda
plantations across a gradient of soil drainage classes. J. Envir. Qual. 43:1823–1832. Simon, K.S., E. F. Benfield, and S. A. Macko. 2003. Food web structure and the role of epilithic
biofilms in cave streams. Ecology. 84:2395–2406. Stone, E. L. 1968. Microelement nutrition of forest trees: a review. pp. 132-175. In G. W.
Bengtson (Ed.). Forest fertilization- theory and practice. Tennessee Valley Authority, Muscle Shoals, AL. pp. 306.
Sulzman, E.W. 2007. Stable isotope chemistry and measurement: a primer. In: R. Michener et
al., editors, Stable isotopes in ecology and environmental science, 2nd Ed. Blackwell Publishing, Malden, MA. p. 1-21.
Switzer, C.L. and L.E. Nelson. 1972. Nutrient accumulation and cycling in loblolly pine (Pinus
taeda L.) plantation ecosystems: the first 20 years. Soil Sci. Soc. Am. Proc. 36: 143-147. Sypert, R.H. 2005. Diagnosis of loblolly pine (Pinus taeda L.) nutrient deficiencies by foliar
methods. M.S. Thesis. Virginia Tech. Sylvia, D.M., J.J. Fuhrmann, P.G. Hartel, and D.A. Zuberer. 2005. Principles and applications of
soil microbioloby. 2nd Ed. Pearson-Prentice Hall, Saddle Ridge, NJ. Templer, P.H., M.C. Mack, F.S. Chapin III, L.M. Christenson, J.E. Compton, H.D. Crook, W.S.
Currie, C.J. Curtis, D.B. Dail, C.M. D’Antonio, B.A. Emmett, H.E. Epstein, C.L. Goodale, P.Gundersen, S.E. Hobbie, K.Holland, D.U. Hooper, B.A. Hungate, S.Lamontagne, K.J. Nadelhoffer, C.W. Osenberg, S.S. Perakis, P.Schleppi, J.Schimel, I.K. Schmidt, M. Sommerkorn, J.S. Poelstra, A.Tietema, W.W. Wessel, D.R. Zak. 2012. Sinks for nitrogen inputs in terrestrial ecosystems: a meta-analysis of 15N tracer field studies. Ecology. 93(8):1816–1829.
Tietema, A., B.A. Emmett, P. Gundersen, O.J. Kjonaas, and C.J. Koopmans. 1998. The fate of
15N-labelled nitrogen deposition in coniferous forest ecosystems. For. Ecol. Manage. 101:19-27.
Tisdale, S.L., W.L. Nelson, and J.D. Beaton. 1985. Soil and fertilizer potassium. In Soil
fertility and fertilizers – 4th Ed. S.L. Tisdale, W.L. Nelson, and J.D. Beaton (Eds). Macmillan, New York. 249-291.
J.E. Raymond
33
Trenkel, M.E. 2010. Slow-and controlled-release and stabilized fertilizers: an option for enhancing nutrient use efficiency in agriculture. IFA. International fertilizer industry association.
United States Department of Agriculture (USDA), Forest Service Southern Region. 1989.
Insects and diseases of trees in the South. R8-PR16. 98 p. Villanueva, A.T. 2016. Impacts of fertilization on soil properties in loblolly pine plantations
in the southeastern United States. M.S. thesis. Virginia Polytechnic Institute and State Univ., VA. p. 79.
Vitousek, P.M. and P.A. Matson. 1984. Mechanisms of nitrogen retention in forest ecosystems:
A field experiment. Science. 225:51-52. Vitousek, P.M., and P.A. Matson. 1985a. Nitrate losses from disturbed forests: causes of
delayed nitrate production in two Indiana forests. For. Sci. 31:122-131. Vitousek, P.M., and P. A. Matson. 1985b. Intensive harvesting and site preparation decrease soil
nitrogen availability in young plantations. South. J. Appl. For. 9:120-125. Vitousek, P. M., and R. W. Howarth. 1991. Nitrogen limitation on land and in the sea - how can
it occur? Biogeochemistry. 13:87–115. Vitousek, P.M, K. Cassman, C. Cleveland, T. Crews, C.B. Field, N.B. Grimm, R.W.Howarth, R.
Marino, L. Martinelli, E.B. Rastetter, and J.I. Sprent. 2002. Towards an ecological understanding of biological nitrogen fixation. Biogeochemistry. 57/58. 1–45.
Vogel, J.G., and E.J. Jokela. 2011. Micronutrient limitations in two managed southern pine
stands planted on Florida spodosols. Soil Sci. Soc. Am. J. 75(3):1117-1124. Volk, G.M. 1970. Gaseous loss of ammonia from prilled urea applied to slash pine. Soil Sci. Soc.
Am. J. 34:513-516. Walker, L. C. 1958. Isotope tracer methods in tree nutrition. In: First North American Forest
Soils Conference. Ed. Agr. Exp. Sta. Mich. State Univ. East Lansing, MI. 25-30. Ward, B.B. 2011. Measurement and Distribution of Nitrification Rates in the Oceans. In: M.G.
Klotz, editor, Methods in Enzymology, Vol. 486. Academic Press, Burlington, VT. Academic Press. p. 307-323.
Watkins, S. H, R. F. Strand, D.S. DeBell, and J. Esch. 1972. Factors influencing ammonia losses
from urea applied to Northwestern forest soils. Soil Sci. Soc. Am. Proc. 36(2):354-357. Weatherall, A. 2005. Use of stable isotopes to study nutrient dynamics in forests. Ph.D. Thesis.
University of Aberdeen. Aberdeen, Scotland.
J.E. Raymond
34
Wells, C.G. and J.R. Jorgensen. 1979. Effect of intensive harvesting on nutrient supply and sustained productivity. In: A.L. Leaf, editor, Proceedings of the impacts of intensive harvesting on forest nutrient cycling. State University of New York, Syracuse, NY. p. 212-230.
Werner, A.T. 2013. Nitrogen release, tree uptake, and ecosystem retention in a mid-rotation
loblolly pine plantation following fertilization with 15N-enriched enhanced efficiency fertilizers. M.S. Thesis. Virginia Tech.
Whitehurst, G.B., and B.M. Whitehurst. 2004. Volatility-inhibited urea fertilizers. Application
10/214,751. Patent 6830,603. Whitehurst Associates, Inc. New Bern, NC. WWF. 2015. Forests for a living forests report. Chapter 5: Saving forests at Risk. WWF.
Gland, Switzerland. Zerpa, J. L. and T.R. Fox. 2011. Controls of volatile NH3 losses from loblolly pine plantations
fertilized with urea in the southeast US. Soil Sci. Soc. Am. J. 75:257-266.
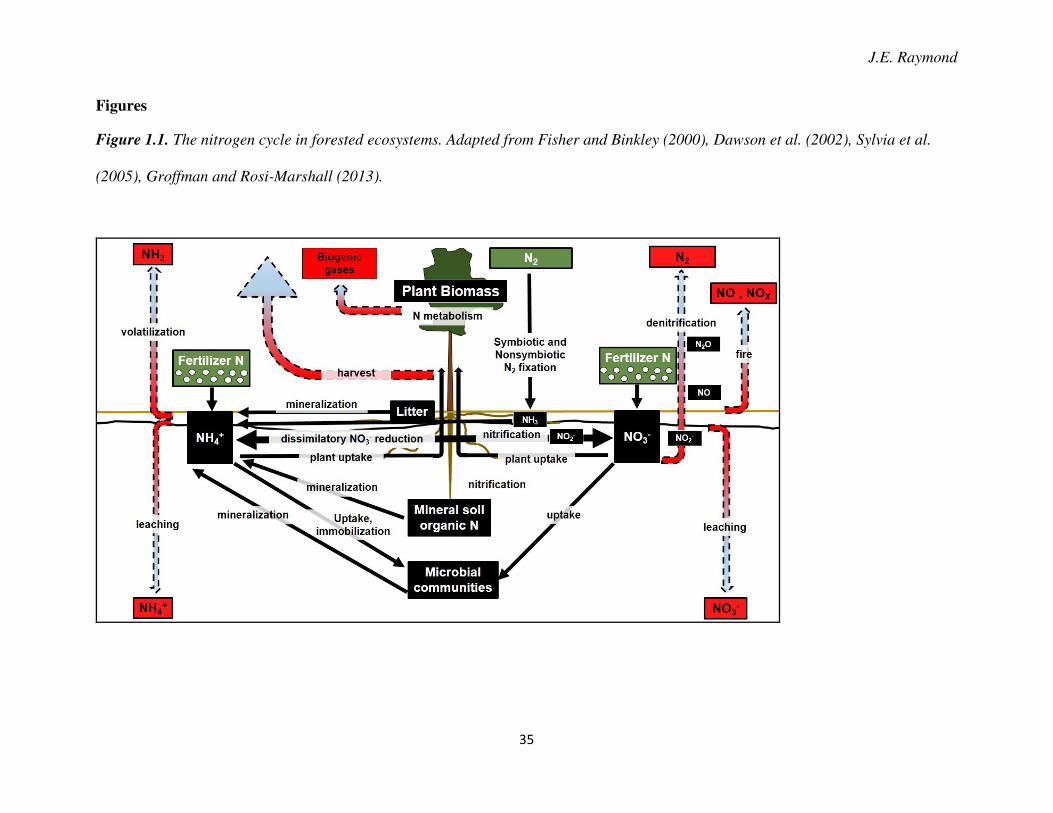
J.E. Raymond
35
Figures
Figure 1.1. The nitrogen cycle in forested ecosystems. Adapted from Fisher and Binkley (2000), Dawson et al. (2002), Sylvia et al.
(2005), Groffman and Rosi-Marshall (2013).
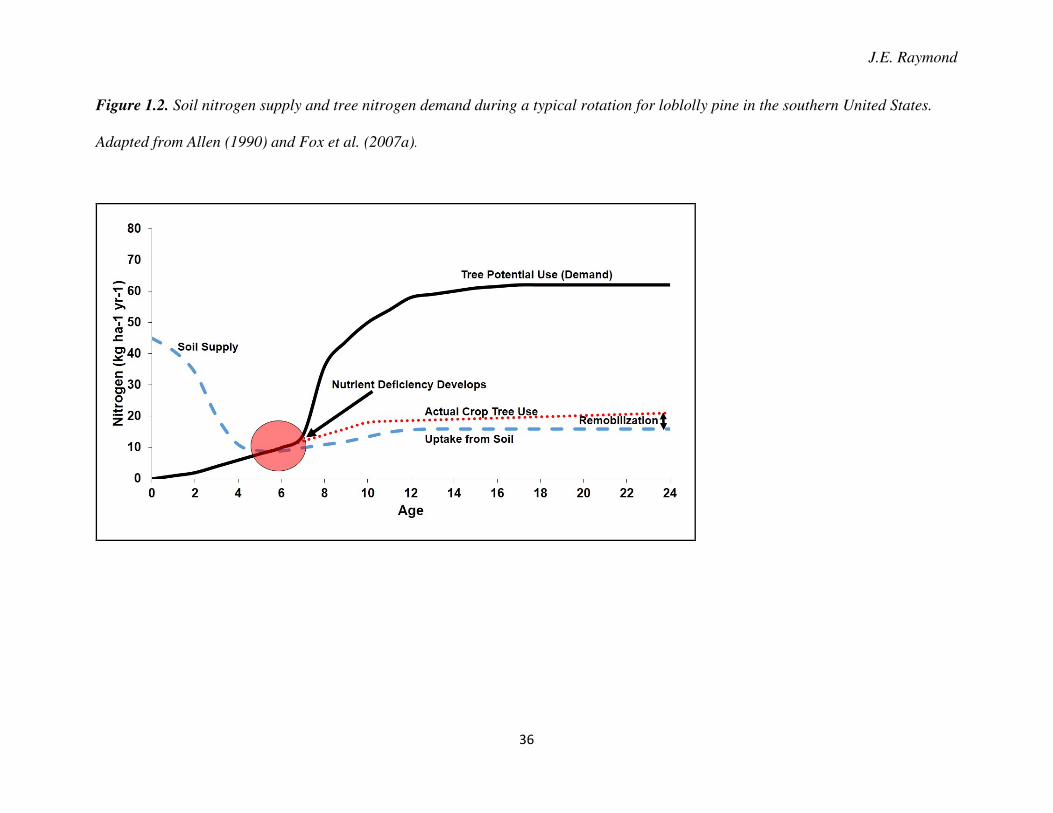
J.E. Raymond
36
Figure 1.2. Soil nitrogen supply and tree nitrogen demand during a typical rotation for loblolly pine in the southern United States.
Adapted from Allen (1990) and Fox et al. (2007a).
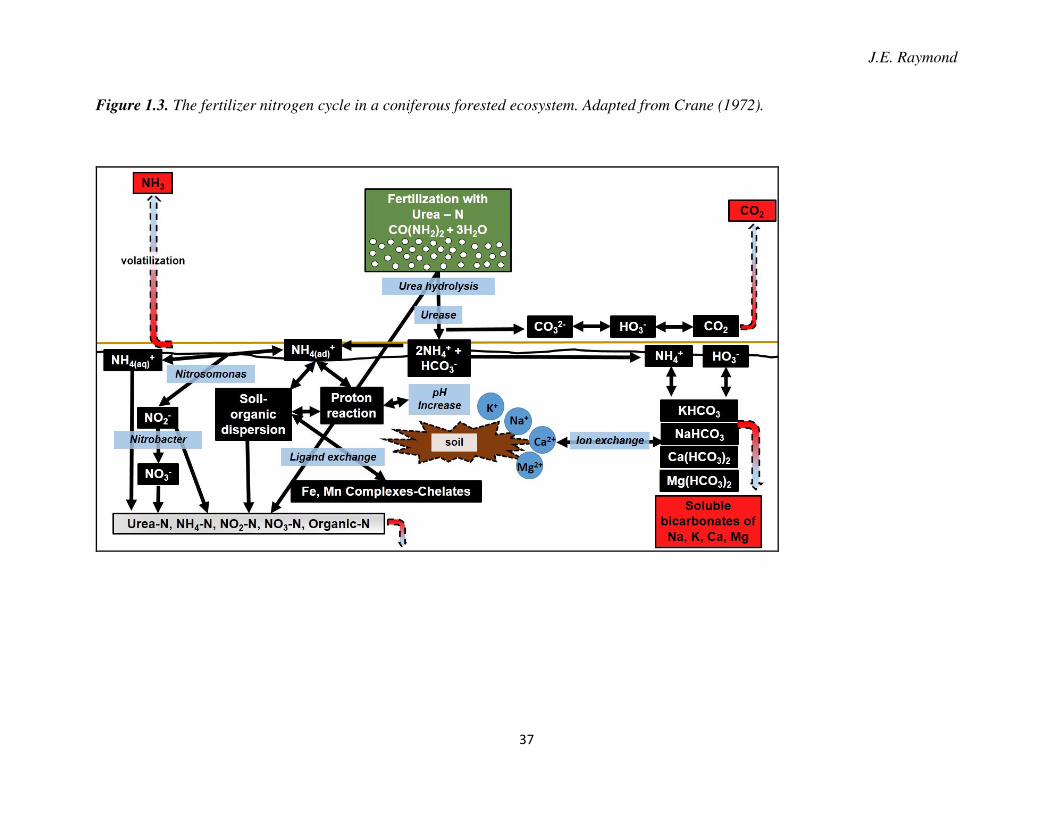
J.E. Raymond
37
Figure 1.3. The fertilizer nitrogen cycle in a coniferous forested ecosystem. Adapted from Crane (1972).
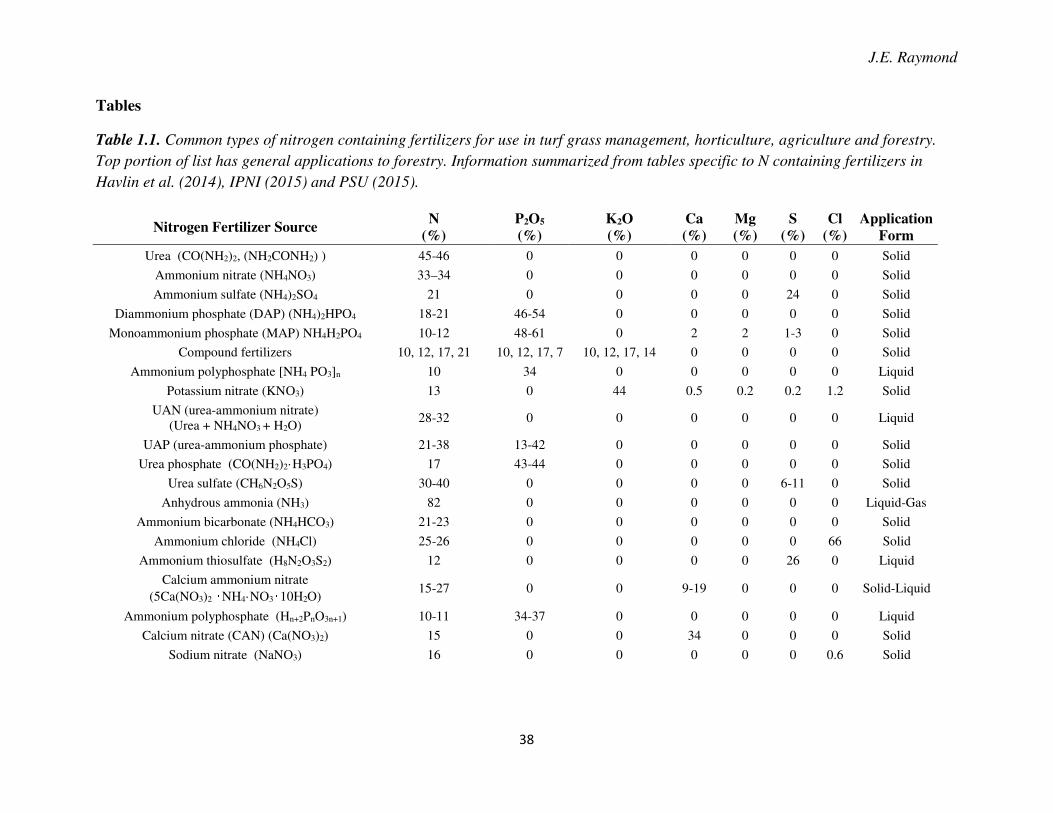
J.E. Raymond
38
Tables
Table 1.1. Common types of nitrogen containing fertilizers for use in turf grass management, horticulture, agriculture and forestry.
Top portion of list has general applications to forestry. Information summarized from tables specific to N containing fertilizers in
Havlin et al. (2014), IPNI (2015) and PSU (2015).
Nitrogen Fertilizer Source N
(%)
P2O5
(%)
K2O
(%)
Ca
(%)
Mg
(%)
S
(%)
Cl
(%)
Application
Form
Urea (CO(NH2)2, (NH2CONH2) ) 45-46 0 0 0 0 0 0 Solid
Ammonium nitrate (NH4NO3) 33–34 0 0 0 0 0 0 Solid
Ammonium sulfate (NH4)2SO4 21 0 0 0 0 24 0 Solid
Diammonium phosphate (DAP) (NH4)2HPO4 18-21 46-54 0 0 0 0 0 Solid
Monoammonium phosphate (MAP) NH4H2PO4 10-12 48-61 0 2 2 1-3 0 Solid
Compound fertilizers 10, 12, 17, 21 10, 12, 17, 7 10, 12, 17, 14 0 0 0 0 Solid
Ammonium polyphosphate [NH4 PO3]n 10 34 0 0 0 0 0 Liquid
Potassium nitrate (KNO3) 13 0 44 0.5 0.2 0.2 1.2 Solid
UAN (urea-ammonium nitrate) (Urea + NH4NO3 + H2O)
28-32 0 0 0 0 0 0 Liquid
UAP (urea-ammonium phosphate) 21-38 13-42 0 0 0 0 0 Solid
Urea phosphate (CO(NH2)2·H3PO4) 17 43-44 0 0 0 0 0 Solid
Urea sulfate (CH6N2O5S) 30-40 0 0 0 0 6-11 0 Solid
Anhydrous ammonia (NH3) 82 0 0 0 0 0 0 Liquid-Gas
Ammonium bicarbonate (NH4HCO3) 21-23 0 0 0 0 0 0 Solid
Ammonium chloride (NH4Cl) 25-26 0 0 0 0 0 66 Solid
Ammonium thiosulfate (H8N2O3S2) 12 0 0 0 0 26 0 Liquid
Calcium ammonium nitrate (5Ca(NO3)2 ‧NH4·NO3‧10H2O)
15-27 0 0 9-19 0 0 0 Solid-Liquid
Ammonium polyphosphate (Hn+2PnO3n+1) 10-11 34-37 0 0 0 0 0 Liquid
Calcium nitrate (CAN) (Ca(NO3)2) 15 0 0 34 0 0 0 Solid
Sodium nitrate (NaNO3) 16 0 0 0 0 0 0.6 Solid
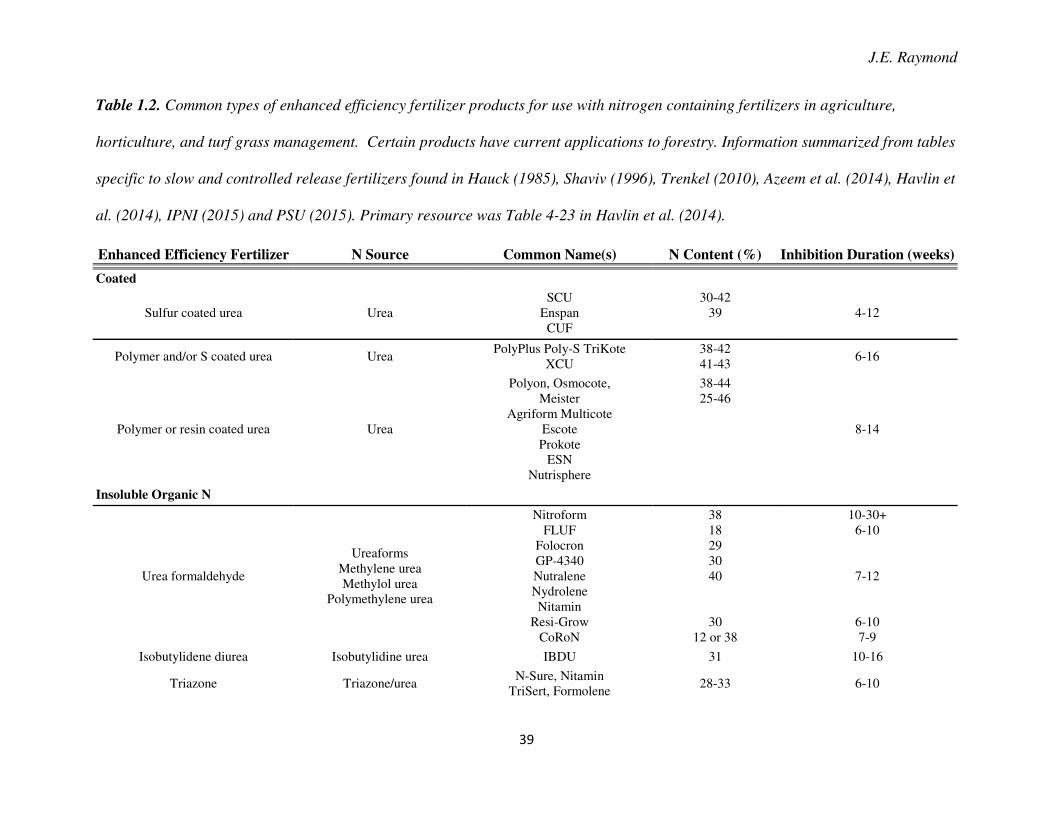
J.E. Raymond
39
Table 1.2. Common types of enhanced efficiency fertilizer products for use with nitrogen containing fertilizers in agriculture,
horticulture, and turf grass management. Certain products have current applications to forestry. Information summarized from tables
specific to slow and controlled release fertilizers found in Hauck (1985), Shaviv (1996), Trenkel (2010), Azeem et al. (2014), Havlin et
al. (2014), IPNI (2015) and PSU (2015). Primary resource was Table 4-23 in Havlin et al. (2014).
Enhanced Efficiency Fertilizer N Source Common Name(s) N Content (%) Inhibition Duration (weeks)
Coated
Sulfur coated urea Urea SCU
Enspan CUF
30-42 39
4-12
Polymer and/or S coated urea Urea PolyPlus Poly-S TriKote
XCU 38-42 41-43
6-16
Polymer or resin coated urea Urea
Polyon, Osmocote, Meister
Agriform Multicote Escote Prokote
ESN Nutrisphere
38-44 25-46
8-14
Insoluble Organic N
Urea formaldehyde
Ureaforms Methylene urea Methylol urea
Polymethylene urea
Nitroform FLUF
Folocron GP-4340 Nutralene Nydrolene Nitamin
Resi-Grow CoRoN
38 18 29 30 40
30 12 or 38
10-30+ 6-10
7-12
6-10 7-9
Isobutylidene diurea Isobutylidine urea IBDU 31 10-16
Triazone Triazone/urea N-Sure, Nitamin
TriSert, Formolene 28-33 6-10
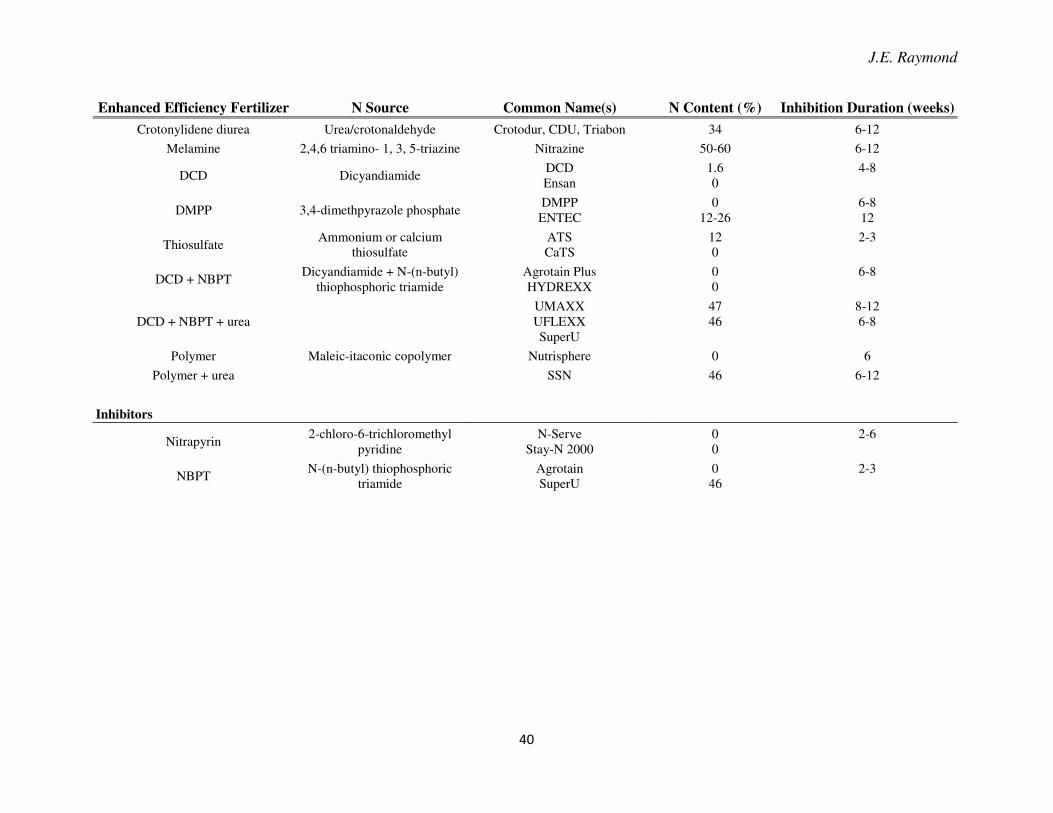
J.E. Raymond
40
Enhanced Efficiency Fertilizer N Source Common Name(s) N Content (%) Inhibition Duration (weeks)
Crotonylidene diurea Urea/crotonaldehyde Crotodur, CDU, Triabon 34 6-12
Melamine 2,4,6 triamino- 1, 3, 5-triazine Nitrazine 50-60 6-12
DCD Dicyandiamide DCD Ensan
1.6 0
4-8
DMPP 3,4-dimethpyrazole phosphate DMPP ENTEC
0 12-26
6-8 12
Thiosulfate Ammonium or calcium
thiosulfate ATS CaTS
12 0
2-3
DCD + NBPT Dicyandiamide + N-(n-butyl)
thiophosphoric triamide Agrotain Plus HYDREXX
0 0
6-8
DCD + NBPT + urea UMAXX UFLEXX SuperU
47 46
8-12 6-8
Polymer Maleic-itaconic copolymer Nutrisphere 0 6
Polymer + urea SSN 46 6-12
Inhibitors
Nitrapyrin 2-chloro-6-trichloromethyl
pyridine N-Serve
Stay-N 2000 0 0
2-6
NBPT N-(n-butyl) thiophosphoric
triamide Agrotain SuperU
0 46
2-3
J.E. Raymond
41
Chapter 2. Ammonia volatilization following nitrogen fertilization with
enhanced efficiency fertilizers and urea in loblolly pine (Pinus taeda L.) plantations of the
southern United States
Abstract
Ammonia (NH3) volatilization losses following surface application of urea and three
enhanced efficiency nitrogen (N) containing fertilizers (EEFs) were compared in six
thinned mid-rotation loblolly pine stands (Pinus taeda L.) across the southern United
States. All fertilizer treatments were labeled with 15N (~370 permil, 0.5 AP) and applied
during two different seasons (spring, summer) in 2011 to open chamber microcosms.
Individual microcosms were sampled 1, 15 and 30 days after fertilization to estimate
remaining 15N. Losses of fertilizer N were determined using a mass balance calculation.
Significantly less N loss occurred following fertilization with EEFs compared to urea after
all sampling days for both seasons. Because root uptake was eliminated in the microcosms
and there was no leaching of 15N below the microcosms, the most likely loss pathway of
the 15N from the microcosms was NH3 volatilization. There were generally no differences
among the individual EEFs. Following spring application, the mean NH3 volatilization
during the 30 day experiment ranged from 4% to 26% for the EEFs compared to 26% to
40% for urea. In summer, mean NH3 volatilization for EEFs ranged from 8% to 23%
compared to 29% to 49% for urea. This research highlights the potential of EEFs to reduce
loss of fertilizer N in forest systems, potentially increasing fertilizer N use efficiency in
these pine plantations.
J.E. Raymond
42
2.1. Introduction
The productivity of many loblolly pine (Pinus taeda L.) plantations in the southern
United States is limited by low levels of plant available soil nutrients, especially nitrogen (N) and
phosphorous (P) (Allen 1987). These N deficiencies are common because N is required in larger
quantities compared to other nutrients for the formation of foliar tissue and photosynthetic
enzymes of cellular structure (Miller 1981, Chapin et al. 1986). Nitrogen deficiencies can
generally be ameliorated through fertilization (Fox et al. 2007a, Carlson et al. 2014). In the
South, loblolly pine plantations generally respond positively to a mid-rotation fertilization with a
mean growth increase of 3 m3 ha-1 over 8 years following the application of 224 kg ha-1 N plus
30 kg ha-1 of P (Fox et al. 2007a). Consequently, fertilization has become an important
silvicultural tool to improve forest productivity (Allen 1987, Fox et al. 2007b). Despite these
systems being N deficient, less than 50% of applied N fertilizer is usually utilized by loblolly
pines, with some studies indicating a much lower percentage (Baker et al. 1974, Mead and
Pritchett 1975, Johnson and Todd 1988, Li et al. 1991, Albaugh et al. 1998, 2004, Blazier et al.
2006).
The most common N fertilizer used in loblolly pine plantations in the South is pelletized
urea (CO(NH2)2) which is usually surface applied via aerial or ground broadcast methods (Allen
1987). Urea is used because of its high N content (46% N) and ease of transport-storage-
application, translating to the lowest overall cost per pound of applied N (Gould et al. 1986,
Allen 1987, Harre and Bridges 1988, Fox et al. 2007b). In the acidic forest soils of the South that
support loblolly pine plantations, urea undergoes a series of chemical reactions that can lead to
ammonia (NH3) volatilization losses (Hauck and Stephenson 1965).
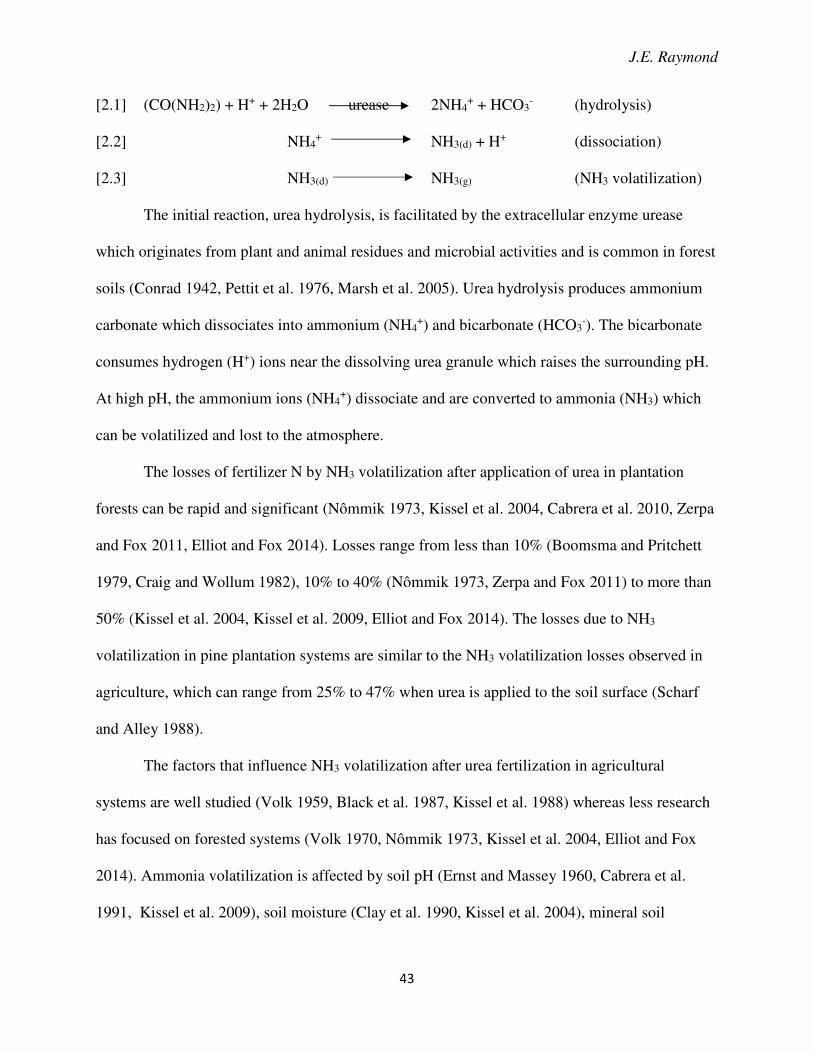
J.E. Raymond
43
[2.1] (CO(NH2)2) + H+ + 2H2O urease 2NH4+ + HCO3
- (hydrolysis)
[2.2] NH4+ NH3(d) + H+ (dissociation)
[2.3] NH3(d) NH3(g) (NH3 volatilization)
The initial reaction, urea hydrolysis, is facilitated by the extracellular enzyme urease
which originates from plant and animal residues and microbial activities and is common in forest
soils (Conrad 1942, Pettit et al. 1976, Marsh et al. 2005). Urea hydrolysis produces ammonium
carbonate which dissociates into ammonium (NH4+) and bicarbonate (HCO3
-). The bicarbonate
consumes hydrogen (H+) ions near the dissolving urea granule which raises the surrounding pH.
At high pH, the ammonium ions (NH4+) dissociate and are converted to ammonia (NH3) which
can be volatilized and lost to the atmosphere.
The losses of fertilizer N by NH3 volatilization after application of urea in plantation
forests can be rapid and significant (Nômmik 1973, Kissel et al. 2004, Cabrera et al. 2010, Zerpa
and Fox 2011, Elliot and Fox 2014). Losses range from less than 10% (Boomsma and Pritchett
1979, Craig and Wollum 1982), 10% to 40% (Nômmik 1973, Zerpa and Fox 2011) to more than
50% (Kissel et al. 2004, Kissel et al. 2009, Elliot and Fox 2014). The losses due to NH3
volatilization in pine plantation systems are similar to the NH3 volatilization losses observed in
agriculture, which can range from 25% to 47% when urea is applied to the soil surface (Scharf
and Alley 1988).
The factors that influence NH3 volatilization after urea fertilization in agricultural
systems are well studied (Volk 1959, Black et al. 1987, Kissel et al. 1988) whereas less research
has focused on forested systems (Volk 1970, Nômmik 1973, Kissel et al. 2004, Elliot and Fox
2014). Ammonia volatilization is affected by soil pH (Ernst and Massey 1960, Cabrera et al.
1991, Kissel et al. 2009), soil moisture (Clay et al. 1990, Kissel et al. 2004), mineral soil
J.E. Raymond
44
substrate (Cabrera et al. 2005, Kissel et al. 2009, Zerpa and Fox 2011), relative humidity
(Cabrera et al. 2005), soil temperature (Ernst and Massey 1960, Clay et al. 1990, Moyo et al.
1989), surficial wind speed (Watkins et al. 1972, Kissel et al. 2004), precipitation (Craig and
Wollum 1982, Kissel et al. 2004) and air temperature (Gould et al. 1973, Craig and Wollum
1982, Koelliker and Kissel, 1988). The organic (O) horizon (forest floor) in forest soils can also
have a significant effect on NH3 volatilization (Cabrera et al. 2005, Kissel et al. 2009, Zerpa and
Fox 2011). Soils with a high H+ buffering capacity (high organic matter, clay, silt) generally
have lower NH3 volatilization losses of fertilizer N compared to those soils with a lower
buffering capacity (sand) (Fenn and Kissel 1976, Ferguson et al. 1984).
Urea applied under cooler, wetter conditions generally has low NH3 volatilization losses
(Ferguson and Kissel 1986, Moyo et al. 1989, Cabrera et al. 2010) due to rapid urea dissolution
and movement into the soil (Black et al. 1987, Paramasivan and Alva 1997). Higher
temperatures and relative humidity stimulate urease activity and increase NH3 volatilization
(Craig and Wollum 1982, Ferguson and Kissel 1986, Moyo et al. 1989). Elevated wind near the
soil boundary layer (Kissel et al. 2004) can also exacerbate losses. Higher rates of NH3
volatilization also occur with higher pH values (Koelliker and Kissel 1988). The ammonium ions
may enter the soil if a precipitation event occurs soon after fertilization which decreases NH3
volatilization losses (Kissel et al. 2004). The amount of urea N lost from the system due to NH3
volatilization is difficult to accurately predict because the loss of fertilizer N is driven by the
interaction among many of these factors. Large losses of fertilizer N through NH3 volatilization
have occurred even under low temperatures (Carmona and Byrnes 1990, Engel et al. 2011).
Conversely, Kissel et al. (2004) observed low NH3 volatilization during August when urea was
J.E. Raymond
45
applied on a day with significant precipitation but high NH3 volatilization (45% to 58%) under
simulated, minor precipitation events.
Enhanced efficiency fertilizers (EEFs) have been developed to minimize losses through
NH3 volatilization (Hauck 1985, Goertz 1993, Azeem et al. 2014). Enhanced efficiency
fertilizers that reduce NH3 volatilization can be divided into two broad categories (Azeem et al.
2014). In the first, a chemical additive, such as N-(n-butyl) thiophosphoric triamide (NBPT)
impregnates the urea granule which reduces urease activity near the urea granule (Bremner and
Douglas 1971, Bremner and Chai 1986, Antisari et al. 1996, Sanz-Cobena et al. 2008). Reducing
urease activity allows the urea granule to dissociate and slowly move into the soil, thus reducing
NH3 volatilization losses (Bremner and Douglas 1971). A second EEF method is to coat urea
granules with a physical barrier, as with a sulfur (S) or a polymer coating. This approach slows
dissolution of the urea granule so that it is released to the environment in a more constant,
gradual rate. This may reduce NH3 volatilization losses and create release rates more
synchronous with plant demand during the year (Shaviv 1996, Blazier et al. 2006).
The primary objective of this research was to determine the effectiveness of three
enhanced efficiency fertilizers compared to urea in reducing fertilizer N volatilization losses in
mid-rotation loblolly pine plantation systems in the South. We compared NH3 volatilization
losses following fertilization in two different seasons (spring, summer). Two statistical
hypotheses were tested in this experiment:
HO1: There are no differences in NH3 volatilization between urea and enhanced efficiency
fertilizers.
HO2: There are no differences in NH3 volatilization for treatments between seasonal applications
(spring, summer).
J.E. Raymond
46
2.2. Materials and Methods
2.2.1. Experimental Design
The experiment used a split plot complete block design to test differences in NH3
volatilization losses. Four fertilizer treatments (main plots) were applied at two different seasons,
spring versus summer (split plot) following fertilization in mid-rotation loblolly pine plantations.
The fertilizer treatments were the main plots with a single replication of each treatment
combination (fertilizer source and season of application) at each individual site. The six sites
served as blocks and provided replication. The split plot was the application date (spring,
summer).
2.2.2. Fertilizer Treatments
The four fertilizer treatments were: 1) urea; 2) urea impregnated with N-(n-Butyl)
thiophosphoric triamide (NBPT); 3) urea impregnated with N-(n-Butyl) thiophosphoric triamide
and coated with monoammonium phosphate and a proprietary binder (CUF); and 4) polymer
coated urea (PCU). Urea (46-0-0) was the conventional N fertilizer used because of its common
use in southern forests. The enhanced efficiency fertilizers (EEFs) tested in this study were
developed to reduce NH3 volatilization and release fertilizer N slowly to the environment. In the
NBPT treatment, urea (46-0-0) granules were impregnated with N-(n-butyl) thiophosphoric
triamide at a rate of 26.7% by weight to inhibit urease activity. In the CUF treatment (39-9-0),
urea granules were impregnated with NBPT and coated with an aqueous binder containing a
boron and copper sulfate solution to slow the release of N to the environment. A coating of
monoammonium phosphate was then added to provide P. The PCU (44-0-0) treatment had a
J.E. Raymond
47
polymer coating covering urea granules with pore openings designed to slowly release N (~80%)
over a 120 day period. The application rate for all treatments was equivalent to 224 kg N ha-1.
Because the CUF treatment contained P in the monoammonium phosphate coating, P was added
to the other fertilizer treatment at the equivalent rate of 28 kg P ha-1 using triple superphosphate
(TSP). The urea for all treatments was enriched with the stable isotope 15N (~370‰, 0.5 AP)
(Nadelhoffer and Frye 1994). All individual fertilizer treatments for both studies were applied by
hand to individual microcosms.
2.2.3. Site Descriptions
Six sites were selected adjacent to plots in an existing network of forest thinning and
fertilization studies in mid-rotation loblolly pine plantations across the South (Figure 2.1).
Selected site characteristics are detailed in Tables 2.1 and 2.2 with selected soil chemical and
physical data in Table 2.3. Daily mean weather data for study sites was obtained from the Oak
Ridge National Laboratory (ORNL) DAYMET website (http://daymet.ornl.gov/) and nearest
weather stations from the Weather Underground website (http://www.wunderground.com/).
2.2.4. Experimental Method
Ammonia volatilization losses were determined using an open chamber microcosm
methodology detailed by Marshall and Debell (1980) and May and Carlyle (2005). Each
microcosm was constructed from a white Schedule 40 polyvinyl chloride pipe (PVC) with an
inner diameter of 15.24 cm (Figure 2.2). Each microcosm was inserted vertically into the soil
through the entire organic (O) horizon (Oi + Oe + Oa) into the mineral soil to a depth of 30 cm
J.E. Raymond
48
which severed roots. A 2.5 cm portion of the microcosm remained above the O horizon. The O
and mineral soil horizons inside the microcosm were minimally disturbed during insertion.
Immediately prior to each treatment application to individual microcosms, two fertilizer
granules were randomly sampled and placed in labeled scintillation vials for 15N analysis that
was used in the overall mass balance calculation for each individual treatment determination of
total 15N recovery. The four fertilizer treatments were applied to the surface of the O horizon in
each microcosm. The fertilizer N treatments were applied to randomly selected microcosms on
two separate dates. All fertilizer applications in a specific season were made on a single day at
individual sites. The spring application dates ranged from March 26 to April 8, 2011, and the
summer application dates ranged from June 18 to June 30, 2011. At each site one microcosm for
each fertilizer treatment was randomly selected and removed without disturbing the soil inside
the microcosm on 1, 15 or 30 days after fertilizer application. An additional mineral soil sample
was taken immediately below the microcosm at each sampling date to determine if fertilizer 15N
had leached below the microcosm. After removal, a plastic cover was secured to the top of the
microcosm and plastic wrap to the bottom, and the intact microcosms were placed on ice in a
cooler and transported to the laboratory for processing.
2.2.5. Laboratory Processing
All microcosms were stored in a walk-in freezer with a constant temperature of -20.0°C
until processed. Upon removal from the freezer, microcosms were thawed and the soil was
divided into four depth increments: O horizon (Oi + Oe + Oa) and the mineral soil increments of
0-10 cm, 10-20 cm, and 20-30 cm. Each depth increment from each microcosm was wet sieved,
placed in a labeled double paper bag and dried in a forced air walk-in oven with a constant
J.E. Raymond
49
temperature of 60°C for 1 week. After drying, O horizon samples were sieved through a 6 mm
sieve whereas mineral soil samples were sieved through a 2 mm sieve. All sieved O horizon and
mineral sieved solid soil samples were ground to a fine powder in a ball mill (Retsch® Mixer
Mill MM 200, Haan, Germany) for 2 minutes at 25 rps to ensure proper homogenization.
Between 40 mg to 45 mg of the ball milled samples were weighed in a tin capsule on a Mettler-
Toledo© MX5 microbalance (Mettler-Toledo, Inc., Columbus, OH, USA). The 15N/14N isotopic
ratio and total N of individual samples were analyzed on a coupled elemental analysis-isotope
ratio mass spectrometer (IsoPrime 100 EA-IRMS, Isoprime© Ltd., Manchester, UK). All
instruments prior to isotopic-elemental analysis were cleaned with an ethanol solution and
allowed to dry after each sample was processed to reduce potential contamination. The quantity
of fertilizer N recovered in each depth increment was determined from the 15N/14N isotope ratio
and total N using the method discussed by Nadelhoffer and Fry (1994). Fertilizer recovered in
each depth increment in the microcosm was summed to determine the total recovery in the
microcosm. The fertilizer N not recovered was attributed to NH3 volatilization loss, and
expressed as a percentage of the applied fertilizer N.
2.2.6. Weather Data
Daily weather data, including mean daily temperature and total daily precipitation during
the first 15 days of the experiment was downloaded from the nearest weather station to each site
through the Oak Ridge National Laboratory DAYMET website (http://daymet.ornl.gov/) and the
Weather Underground (http://wunderground.com).
J.E. Raymond
50
2.2.7. Calculations
The individual total fertilizer N recovery for each depth increment in each microcosm
was determined as detailed below, and all depth increments for each individual microcosm was
summed to obtain a total fertilizer recovery for each individual microcosm. The individual depth
increment in each microcosm was calculated using individual soil depth mass, N concentration,
and 15N (‰) adapted from Powlson and Barraclough (1993), Nadelhoffer and Fry (1994) and
Nadelhoffer et al. (1995). Equation [3.1] calculated the ratio of fertilizer 15N to natural
abundance 15N:
Equation [3.1] was used to calculate the individual soil depth increment component N percent
that originated from the fertilizer N:
[3.1] %N from fertilizer in individual soil depth increment =
((δ15Nfinal - δ15Ninitial) / (δ15Nlabeled - δ15Ninitial)) * (100)
Equations [3.2] to [3.5] determined the percent recovery of fertilizer N in individual soil depth
increments:
[3.2] % 15N from labeled treatment in individual soil depth increment =
((δ15Ncomponent - δ15Npretreatment) / (δ15Nfertlizer - δ15Npretreatment)) * (100)
[3.3] Total N (g) = (Individual soil depth increment component dry weight * %N) / (100)
[3.4] N originated from fertilizer (g) in individual soil depth increment component =
( (Total N * %15N originated from fertilizer) / (100) )
[3.5] % N originated from fertilizer in individual soil depth increment =
[(N from fertilizer (g) in individual soil depth increment)/(15N fertilizer (g) ) ] * (100)
J.E. Raymond
51
2.2.8. Statistical Analysis
Ammonia volatilization loss (%), expressed as a percentage of fertilizer N not recovered
from an individual microcosm, was analyzed using a repeated measure analysis of variance
(ANOVA) using PROC MIXED in SAS® 9.4 (SAS Institute, Cary, NC). Several alternative
spatial covariate structures were tested, and the optimal structure was the unstructured covariate
structure based on Akaike’s Information Criteria (AIC). Percent data were arcsin transformed
prior to analysis (Gomez and Gomez 1984). Ammonia volatilization loss (%) was the response
variable for the model, day (1, 15, 30) was the repeated measure, fertilizer treatment (CUF,
NBPT, PCU, Urea) and season (spring, summer) were fixed effects, and site (VA, ALN, AR,
ALS, SC, NC) was a random effect. (Littell et al. 2006). Levels of significance were set at α =
0.05 and the P > |t| values for the treatment means for each day and season were tested using the
SLICE function in PROC MIXED. The post-hoc analysis used was Tukey’s HSD.
Pearson’s correlations were conducted between treatments and weather variables to
assess relationships with NH3 volatilization loss. Maximum daily relative humidity and mean
daily relative humidity were calculated from dewpoint and temperature data (Iduchov and
Eskridge 1996), mean daily critical relative humidity (CRH) for urea dissolution was calculated
using the procedure in Elliot and Fox (2014). The number of days when mean daily relative
humidity was greater than the CRH for each sampling interval (1, 15, 30 days after fertilization)
were determined. Pearson’s correlation coefficients were calculated for mean NH3 volatilization
from urea and the selected weather data 1 day and 15 consecutive days after fertilization for
spring, summer and spring + summer application seasons combined to assess relationships
between NH3 volatilization from urea and weather variables. Strong correlations were defined as
0.5 < |r|, moderate correlations as 0.3 < |r| < 0.5, and small correlations as 0.1 < |r| < 0.3.
J.E. Raymond
52
2.3. Results
2.3.1. Differences in NH3 Volatilization Among Fertilizer Treatments – Spring
Mean NH3 volatilization losses following urea application in the spring were greater than
losses from the EEFs after 1, 15 and 30 days after fertilizer application (Table 2.6; Figure 2.4).
There were no significant differences among the individual EEFs 1 and 15 days after
fertilization, but mean NH3 volatilization losses following CUF application were less than mean
NH3 volatilization losses from NBPT and PCU after 30 days. Mean NH3 volatilization losses,
expressed as a percent of the fertilizer N added, after 1 day were 3.9% for CUF, 9.6% for NBPT,
8.2% for PCU and 25.9% for urea. Fifteen days after fertilization, the mean NH3 volatilization
was 13.7% for CUF, 20.0% for NBPT, 15.3% for PCU, and 35.2% for urea. Thirty days after
fertilization, the mean NH3 volatilization was 15.2% for CUF, 23.5% for NBPT, 21.5% for PCU
and 40.0% for urea.
2.3.2 Differences in NH3 Volatilization Among Fertilizer Treatments – Summer
Mean NH3 volatilization losses following urea fertilization in the summer were
significantly greater after 1, 15 and 30 days then mean NH3 volatilization losses from the EEFs
(CUF, NBPT, PCU) except after 1 day, where there was no difference between CUF and urea
(Table 2.6; Figure 2.4). There were no significant differences in mean NH3 volatilization among
the individual EEFs after 1 and 15 days, but after 30 days losses from PCU were less than CUF.
Mean NH3 volatilization losses, expressed as a percent of fertilizer N added, were 18.8% for
CUF, 6.7% for NBPT, 11.0% for PCU and 28.5% for urea after 1 day. After 15 days, the mean
NH3 volatilization was 16.6% for CUF, 14.2% for NBPT, 11.4% for PCU, and 45.4% for urea.
J.E. Raymond
53
After 30 days, the mean NH3 volatilization was 23.3% for CUF, 21.4% for NBPT, 11.8% for
PCU and 48.7% for urea.
2.3.3. NH3 Volatilization Among Fertilizer Treatments – Spring + Summer
When the data was combined for the spring and summer application (spring + summer),
mean NH3 volatilization losses were significantly greater following fertilization with urea than
the EEFs after 1, 15 and 30 days (Table 2.6; Figure 2.4). There were no significant differences
among the individual EEFs 1 and 15 days after fertilization, but mean NH3 volatilization losses
were greater following fertilization with NBPT than PCU after 30 days. Mean NH3 volatilization
losses, expressed as a percent of fertilizer N added, were 11.3% for CUF, 8.7% for NBPT, 9.6%
for PCU and 27.3% for urea after 1 day. The mean NH3 volatilization was 15.2% for CUF,
17.1% for NBPT, 13.9% for PCU, and 40.3% for urea after 15 days. After 30 days, the mean
NH3 volatilization was 19.2% for CUF, 22.4% for NBPT, 16.7% for PCU and 44.4% for urea.
2.3.4 Correlation Between NH3 Volatilization From Urea and Weather Data
Correlations between weather data and cumulative mean NH3 volatilization loss,
expressed as a percentage of N applied, following fertilization with urea for spring, summer and
spring + summer data were generally poor (Table 2.7, Appendix Figure A.2.1.). After the spring
fertilization, a strong negative correlation occurred with total daily precipitation (-0.512),
moderate positive correlations with maximum daily temperature (0.312) and mean daily
temperature (0.303), and a moderate negative correlation when the critical relative humidity
exceeded the relative humidity (-0.303). After the summer fertilization, strong positive
correlation occurred with mean daily relative humidity, and moderate positive correlations with
maximum daily relative humidity (0.375) and minimum daily relative humidity (0.375). When
J.E. Raymond
54
the spring and summer data was combined, only a moderate negative correlation occurred with
total daily precipitation (-0.311).
Ammonia volatilization losses from urea 15 days following the spring application were
strongly correlated with maximum daily temperature (0.579), mean daily temperature (0.808)
and cumulative days when daily mean relative humidity exceeded critical relative humidity
(0.697). Moderate negative correlations occurred with maximum daily relative humidity
(-0.406), and a positive correlation with mean daily relative humidity (0.470). Following summer
application, no strong correlations were observed. Moderate positive correlations existed with
maximum daily relative humidity (0.403) and mean daily relative humidity (0.322). When data
for mean NH3 volatilization losses after 15 days following spring and summer applications were
combined, a strong positive correlation existed with the cumulative days when mean daily
relative humidity was greater than the critical relative humidity (0.573), and moderate positive
correlations existed with maximum daily temperature (0.406) and cumulative precipitation
(0.386).
2.4. Discussion
Our study focused on assessing NH3 volatilization following N fertilization with urea and
enhanced efficiency N containing fertilizers in loblolly pine plantations in the southern United
States. We correlated weather variables associated with NH3 volatilization loss of the fertilizer N
(Ernst and Massey 1960, Craig and Wollum 1982, Cabrera et al. 2005). By installing a study
across the entire region where loblolly pine plantations are operationally grown, we hoped to
improve the understanding of the magnitude of fertilizer N loss across the region rather than
J.E. Raymond
55
focus on a detailed study in a single location or smaller area as done by others (Volk 1970,
Nômmik 1973, Kissel et al. 2004, Elliot and Fox 2014). This study tested two primary
hypotheses: 1) whether differences existed in NH3 volatilization between urea and enhanced
efficiency fertilizers; and 2) whether differences existed in NH3 volatilization among treatments
between application seasons.
Because tree roots were severed when the microcosms were inserted into the soil, N
uptake by the trees was eliminated. Therefore, we assume that the primary loss mechanism for
the applied N from the open chamber microcosm was NH3 volatilization to the atmosphere
(Figure 2.2). However, the two additional potential loss pathways that could occur from the
microcosms are leaching and denitrification. We tested for potential leaching loss of fertilizer N
by sampling soil directly below each microcosm on each date and analyzing the sample for 15N.
If this loss pathway was important, samples immediately below the bottom of the microcosm
(>30 cm soil increment) should have had elevated 15N signatures. The 15N signature (‰) for the
>30 cm increment was similar to the natural abundance background 15N values at each site
(Table 2.4). We were unable to detect any of the fertilizer 15N in the >30 cm depth increment
after any sampling date (1, 15, 30) following the spring or summer fertilization with any
fertilizer (CUF, NBPT, PCU, urea). This result indicates that leaching was an undetectable loss
pathway in this study (Figure 2.3).
We did not directly measure denitrification losses in this study. Recent work examining
denitrification on similar sites used in this study found that denitrification losses were relative
low during spring and summer months (Shrestha et al. 2014). Denitrification occurs in anaerobic
environments when nitrate functions as the terminal electron acceptor during the oxidation of
soil organic matter. Microcosms in this study were all located in aerobic soil. Even at the sites
J.E. Raymond
56
with poorly drained soils, microcosms were located on top of the beds where soils were aerobic
(Kelting et al. 1998, Shrestha et al. 2014). We compared N losses on well versus poorly drained
soils in our study and found no differences in percent recovery of fertilizer N due to soil drainage
class. Since losses were similar on both types of soil, denitrification was a minor loss mechanism
in this study. Although a small amount of fertilizer N loss may have occurred through both
denitrification and leaching, we concluded that NH3 volatilization was the primary loss pathway
for N in our microcosm systems.
Our first hypothesis that no differences in NH3 volatilization existed between urea and
enhanced efficiency fertilizers was rejected. Ammonia volatilization losses were significantly
lower for enhanced efficiency fertilizers (CUF, NBPT, PCU) compared to urea following both a
spring and summer application. Significantly less NH3 volatilization occurred with all enhanced
efficiency fertilizers, and when differences were present among individual enhanced efficiency
fertilizers they were small. Yet with urea, NH3 volatilization losses were large following
fertilization in both spring and summer, ranging from 25% to 30% of fertilizer N lost after a
single day. Losses following fertilization with EEFs were much less compared to urea. Ammonia
volatilization losses continued to increase through time for all fertilizers. The incremental
additional loss through 15 days and 30 days after fertilization were greater for urea than the
EEFs. The result for these fertilizer treatments agree with those of other studies which have
generally found the largest losses for NH3 volatilization for urea occurring between 1 day and 7
days after application (Craig and Wollum 1982, Clay et al. 1990, Kissel et al. 2009, Elliot and
Fox 2014).
The major loss pathway of the fertilizer N for this study was assumed to be through NH3
volatilization. Urea hydrolysis, facilitated by urease, produces ammonium carbonate which
J.E. Raymond
57
dissociates into ammonium (NH4+) and bicarbonate (HCO3
-). The bicarbonate consumes
hydrogen (H+) ions near the dissolving urea granule which raises the surrounding pH (Hauck and
Stevenson 1965). In this situation the ammonium ions (NH4+) can be converted to ammonia
(NH3) which can be lost to the atmosphere. Higher rates of precipitation immediately following
fertilization with urea, in excess of 1.27 cm, can dissolve the urea and move it into the soil,
reducing NH3 volatilization (Kissel et al. 2004). Sites for this study had minor (less than 12 mm)
or no precipitation events within the first few days following fertilization. Minor precipitation
events coinciding with warm temperatures following urea fertilization can exacerbate losses
through the NH3 volatilization pathway (Kissel et al. 2004) which occurred in our study and
likely caused large losses for urea. Conversely, studies have shown large precipitation events
after fertilization with urea can move fertilizer N into the soil profile rapidly (Kissel et al. 2004).
Once the fertilizer N moves into the soil profile, it becomes more difficult for NH4+ conversion
to NH3 due to the soil buffering capacity (Ferguson et al. 1984) and mass flow of NH3(g) to the
atmosphere. Two enhanced efficiency fertilizers we used in this study, CUF and NBPT, were
developed to reduce urease activity for a short period (approximately 2 weeks), allowing time for
precipitation to move the urea into the soil and thereby reducing losses from NH3 volatilization.
For the PCU treatment, water from the minor precipitation events may have been moving into
the PCU granules, or N release may have just been initiated from the granule with incomplete
dissolution of the urea granule occurring at the time of the analysis.
We rejected our second hypothesis that there were no differences in NH3 volatilization
between application seasons (spring versus summer). There was a significant interaction effect
between treatment and season indicating larger NH3 volatilization losses following the summer
application (Table 2.5). Losses from urea were greater in the summer compared to spring. Sites
J.E. Raymond
58
generally experienced higher temperatures, more days when relative humidity exceeded critical
relative humidity, and few large precipitation events. As previously discussed, these weather
conditions increase the chances for NH3 volatilization from urea because the rate of urease
activity increases (Koelliker and Kissel 1988, Moyo et al. 1989, Kissel et al. 2004). When there
is insufficient precipitation to move dissolved urea into the soil, NH3 can be lost to the
atmosphere, or losses may be exacerbated by minor precipitation events (Kissel et al. 2004).
Differences among the EEFs were small and somewhat variable. For day 1 in the
summer, losses from the CUF treatment were greater compared to spring, but similar after 15
days and 30 days. For the NBPT and PCU treatments, losses were less each day for the summer
compared to the spring. When reviewing site specific data, there were more frequent, smaller
precipitation events during the summer compared to the spring at most sites. Although this can
increase NH3 volatilization from urea (Kissel et al. 2004), this may assist in gradually moving
the EEFs into the soil due to their release mechanisms. The CUF and NBPT treatments generally
have a two week effectiveness period for minimizing urease activity (Shaviv 1996). The PCU
treatment is formulated to allow moisture into the polymer coating which permits gradual urea
dissolution. As moisture enters the PCU granule, it expands and dissolved urea-N is forced
through the polymer coating, gradually releasing fertilizer N to the environment. For the summer
application period, more frequent, smaller precipitation events may have increased in the release
and movement of N into the soil for PCU.
An additional question for this research was the effect of weather on NH3 volatilization
for urea. Similar to others (Cabrera et al. 2005, Cabrera et al. 2010, Elliot and Fox 2014) we
found a strong correlation between NH3 volatilization from urea and the number of days which
relative humidity exceeded the calculated critical relative humidity during the first days
J.E. Raymond
59
following fertilization (Elliot and Fox 2014). When relative humidity exceeds the threshold of
critical relative humidity, urea hydrolysis occurs and can lead to NH3 volatilization (Cabrera et
al. 2005).
The amount of urea N lost from the system due to NH3 volatilization is difficult to
accurately predict because the loss of fertilizer N is affected by many factors. High surficial wind
speed (Watkins et al. 1972, Kissel et al. 2004), low precipitation (Craig and Wollum 1982, Kissel
et al. 2004) and high air temperature (Gould et al. 1973, Craig and Wollum 1982, Koelliker and
Kissel 1988) increase NH3 volatilization. Urea applied under wetter, cooler periods tends to
reduce NH3 volatilization losses (Ferguson and Kissel 1986, Moyo et al. 1989, Cabrera et al.
2010) due to rapid urea dissolution (Black et al. 1987, Paramasivan and Alva 1997) which moves
N into the soil compared to urea remaining on the soil surface. This is a primary reason why urea
is applied during winter months in loblolly pine plantations in the South. However, large losses
of fertilizer N through NH3 volatilization have occurred even under low temperatures (Carmona
and Byrnes 1990, Engel et al. 2011). High temperatures and high relative humidity can stimulate
urease activity increasing NH3 volatilization (Craig and Wollum 1982, Ferguson and Kissel
1986, Moyo et al. 1989). Conversely, Kissel et al. (2004) observed low NH3 volatilization during
August when urea was applied on the same day as a significant precipitation event, but high
volatilization (45% to 58%) under simulated, minor precipitation events. These weather variables
were also positively correlated with large NH3 volatilization losses in our study.
Interactions of weather variables with edaphic factors may also increase NH3
volatilization and can include increases with soil pH (Ernst and Massey 1960, Koelliker and
Kissel 1988, Cabrera et al. 1991, Kissel et al. 2009), soil moisture (Clay et al. 1990, Kissel et al.
2004), type of mineral soil substrate (Cabrera et al. 2005, Kissel et al. 2009, Zerpa and Fox
J.E. Raymond
60
2011), low soil buffering capacity as in sand or soils with low organic matter (Fenn and Kissel
1976, Ferguson et al. 1984), and soil temperature (Ernst and Massey 1960, Clay et al. 1990,
Moyo et al. 1989, He et al 1999). Although similarities exist between agriculture and forest
systems, important differences occur which may also affect NH3 volatilization losses between
the two systems. One important difference is the presence of an organic (O) horizon (forest floor)
in forest soils which can have a significant effect on NH3 volatilization (Cabrera et al. 2005,
Kissel et al. 2009, Zerpa and Fox 2011). Although we did not measure many of these factors,
future research should continue to investigate their interactions to refine our understanding of
NH3 volatilization losses of urea from forest ecosystems.
Based on our findings, the primary fertilizer N loss pathway in this study was from NH3
volatilization. In acidic, aerobic forest soils, denitrification is considered to be a minor loss
pathway for N (Bowden et al. 1990) except in anaerobic soils. Although anaerobic conditions
may have existed in the interbed areas of three of our sites, all the microcosms were installed in
the bedded areas which were likely aerobic (Kelting et al. 1998). Interbed areas of a site can have
extended periods of anaerobic conditions, and the pathway of fertilizer N loss may increasingly
shift towards denitrification (Shrestha et al. 2014). Because fertilizers are generally applied
through surface broadcast methods, and in essence 50% of the site may be comprised of
interbeds, understanding loss mechanisms of fertilizer N in these areas is important.
Additionally, the organic horizon is generally thicker in the interbed compared to the bed, and
this potentially influences the amount of fertilizer N loss that can occur (Cabrera et al. 2005).
Our analysis of fertilizer N loss based on the grouping of well drained (aerobic) compared to
poorly drained soils did not find any differences, indicating soil drainage classification for the
bedded areas of the sites were not a controlling variable for fertilizer N loss. If losses were
J.E. Raymond
61
different between these two soil groupings, losses of fertilizer N by denitrification in the poorly
drained sites would need to be considered.
The remaining potential loss pathway from the microcosms was leaching. Measurements
immediately adjacent and outside the bottom opening of the microcosm found no detectable
increase in the 15N values in the soil depth of >30 cm compared to natural abundance values of a
control. From these findings, we conclude the majority of fertilizer N loss was by the NH3
volatilization pathway. If other losses did occur from the system, they were below the detectable
limits of our methods. We did not measure NH3 volatilization from unfertilized control plots for
a comparison with treatment plots due to traditionally low observed values in forest ecosystems
by others (Marshall and DeBell 1980, Kissel and Cabrera 1988, Elliot and Fox 2014).
A primary benefit of this study is the results are drawn from an extensive geographic
area, encompassing the entire region where loblolly pine plantations are operationally fertilized.
Because this study does encompass such an extensive region, and hence large range of climatic
and edaphic variables, a synthesis of significant factors helps to support the results specific to
NH3 volatilization after N fertilization of other studies in forest ecosystems that are an
assessment of a single or smaller regional sites. Additionally, the open chamber system design of
the microcosm does not have the potential limitations of closed chamber systems that can
manipulate pressure, temperature or wind speed, although the results of this study still should be
viewed as an index and not absolute values. This study provides continued evidence that
although weather conditions can be important in determining NH3 volatilization losses from
urea, they do not translate to the same losses for enhanced efficiency fertilizers. These results
provide evidence to forest managers that enhanced efficiency fertilizers can significantly reduce
NH3 volatilization losses of fertilizer N across the entire range of southern loblolly plantations,
J.E. Raymond
62
regardless of the season of application. The use of enhanced efficiency N containing fertilizers
may translate to improved forest productivity and fertilizer N use efficiency in southern loblolly
pine plantations in the future.
2.5. Conclusions
The primary results for this research were that significantly lower NH3 volatilization
losses occurred between all forms of N containing enhanced efficiency fertilizers (CUF, NBPT,
PCU) over extensive ecophysiographic regions of the southern United States in mid-rotation
loblolly pine stands compared to the conventional current standard of forest fertilization, urea.
These results indicate that enhanced efficiency N containing fertilizers can reduce NH3
volatilization losses over a significant range of weather and edaphic factors compared to urea.
These findings may translate to improved fertilizer N use efficiency in southern loblolly pine
plantation systems by retaining more fertilizer N in the system, with the possibility of reducing
application rates of N in the future. These findings are important to the continued direction of
improving productivity in southern loblolly pine plantations. Using enhanced efficiency
fertilizers may also provide the ability for forest managers to apply fertilizer N in a more
synchronous manner to plant demand under conditions where large NH3 volatilization losses
occur with urea, continuing to improve fertilizer N use efficiency in these systems. Viewed
collectively, these results indicate that NH3 volatilization can be decreased significantly using
any of the enhanced efficiency fertilizers in this study (CUF, NBPT, PCU) when compared to
urea under a diverse range of climatic and site variables for pine plantations in the southern
United States. These results provide forest managers a level of certainty that if NH3

J.E. Raymond
63
volatilization is a concern at the site, enhanced efficiency N containing fertilizers may assist in
retaining more fertilizer N in the system, translating to a potentially higher fertilizer N use
efficiency over the rotation of the stand.
J.E. Raymond
64
Acknowledgments
This research was primarily supported by the Forest Productivity Cooperative (FPC), the
National Science Foundation Center for Advanced Forest Systems (CAFS) and the United States
Department of Agriculture National Institute of Food and Agriculture McIntire-Stennis Capacity
Grant. We thank David Mitchem for assistance in the laboratory, Andy Laviner and Eric
Carbaugh for field assistance, and the numerous work study and seasonal student employees for
both field and laboratory assistance.
J.E. Raymond
65
Literature Cited Albaugh, T.J., H.L. Allen, P.M. Dougherty, L.W. Kress, and J.S. King. 1998. Leaf-area and
above- and belowground growth responses of loblolly pine to nutrient and water additions. For. Sci. 44:317-328.
Albaugh, T.J., H. L. Allen, P. M. Dougherty, and K. H. Johnsen. 2004. Long term growth
responses of loblolly pine to optimal nutrient and water resource availability. For. Ecol. Manage. 192:3-19.
Allen, H.L. 1987. Forest fertilizers: nutrient amendment, and productivity, and environmental
impact. J. For. 85:37-46. Antisari, L.V., C. Marzadori, P. Gioacchini, S. Ricci, and C. Gessa. 1996. Effects of the urease
inhibitor N-(n-butyl) phosphorothioic triamide in low concentrations on ammonia volatilization and evolution of mineral nitrogen. Biol. Fert. Soils. 22:196-201.
Azeem, B., K. KuShaari, Z.B. Man, A. Basit, and T.H. Thanh. 2014. Review on materials &
methods to produce controlled release coated urea fertilizer. Journal of Controlled Release. 181: 11–21.
Baker, J.B., G.L. Switzer, and L.E. Nelson. 1974. Biomass production and nitrogen recovery
after fertilization of young loblolly pines. Soil Sci. Soc. Am. Proc. 38(6):959 –961. Black, A.S., R.R. Sherlock, and N.P. Smith. 1987. Effect of timing of simulated rainfall on
ammonia volatilization from urea applied to soil of varying moisture content. J. Soil Sci. 38:679-687.
Blazier, M.A., T.C. Hennessey, P. Dougherty, and R. Campbell. 2006. Nitrogen accumulation
and use by a young loblolly pine plantation in southeast Oklahoma: Effects of fertilizer formulation and date of application. South. J. Appl. For. 30:66-78.
Boomsma, D. and W. Pritchett. 1979. Nitrogen losses from urea, ammonium sulfate, and
ammonium nitrate applications to a slash pine plantation. Proc. Soil Crop Sci. Soc. Fla. 39:679–687.
Bowden, R.D., P.A. Steudler, J.M. Melillo, and J.D. Aber. 1990. Annual nitrous oxide fluxes from temperate forest soils in the Northeastern United States. J. Geophys Res 95:13997-14005.
Bremner, J.M., and L.A. Douglas. 1971. Inhibition of urease activity in soils. Soil Biol. and
Bio. 3(4):297-307.
Bremner, J. M., and H.S. Chai. 1986. Evaluation of N-butyl phosphorothioic triamide for retardation of urea hydrolysis in soil. Commun. Soil Sci. Plant Anal. 17(3):337–351.
J.E. Raymond
66
Cabrera, M.L., D.E. Kissel, and B.R. Bock. 1991. Urea hydrolysis in soil - effects of urea concentration and soil-pH. Soil Biol. Biochem. 23(12):1121-1124.
Cabrera, M.L., D.E. Kissel, N. Vaio, J. R. Craig, J.A. Rema, and L.A. Morris. 2005. Loblolly pine needles retain urea fertilizer that can be lost as ammonia. Soil Sci. Soc. Am. J. 69(5):1525-1531.
Cabrera, M.L., D.E. Kissel, J.R. Craig, N.P. Qafoku, N. Vaio, J.A. Rema, and L.A. Morris. 2010. Relative humidity controls ammonia loss from urea applied to loblolly pine. Soil Sci. Soc. Am. J. 74:543–549. doi:10.2136/sssaj2009.0220.
Carlson, C. A., T.R. Fox, H.L. Allen, T.J. Albaugh, R.A. Rubilar, and J.L. Stape. 2014.
Growth responses of loblolly pine in the southeast united states to midrotation applications of nitrogen, phosphorus, potassium, and micronutrients. For. Sci. 60(1):157-169.
Carmona, G.C,. and B.H. Byrnes. 1990. Temperature and low concentration effects of the
urease inhibitor N-(n-butyl thiophosphoric triamide (NBPT) on ammonia volatilization from urea. Soil Biol. Biochem. 22(7):933–937. doi:10.1016/0038-0717(90)90132-.
Chapin, F.S., P.M. Vitousek, and K. Van Cleve. 1986. The nature of nutrient limitation in plant- communities. Am Nat 127:48–58. doi:10.1086/284466.
Clay, D. E., G.L. Malzer, and J.L. Anderson. 1990. Ammonia volatilization from urea as
influenced by soil temperature, soil water content, and nitrification and hydrolysis inhibitors. Soil Sci. Soc. Am. J. 54(1):263–266.
Conard, J.P. 1942. The occurrence and origin of urease like activities in soils. Soil Sci. 54(5):
367-380. Craig, J., and A. Wollum. 1982. Ammonia volatilization and soil nitrogen changes after urea and
ammonium nitrate fertilization of Pinus taeda L. Soil Sci. Soc. Am. J. 46:409–414. doi:10.2136/sssaj1982.03615995004600020040x.
Elliot, J.R., and T.R. Fox. 2014. Ammonia volatilization following fertilization with urea or
ureaform in a thinned loblolly pine plantation. Soil Sci. Soc. Am. J. 78:1469–1473. doi:10.2136/sssaj2013.12.0512n.
Engel, R., C. Jones, and R. Wallander. 2011. Ammonia volatilization from urea and mitigation
by NBPT following surface application to cold soils. Soil Sci. Soc. Am. J. 75:2348–2357. doi:10.2136/sssaj2011.0229.
Ernst, J.W., and H.F. Massey. 1960. The effect of several factors on volatilization of ammonia
formed from urea in the soil. Soil Sci. Soc. Am. Proc. 24(2):87–90.
J.E. Raymond
67
Fenn, L.B., and D.E. Kissel. 1976. The influence of cation exchange capacity and depth of incorporation on ammonia volatilization from ammonium compounds applied to calcareous soils. Soil Sci. Soc. Am. J. 40(3):394-398.
Ferguson, R.B. D.E. Kissel, J.K. Koelliker, and W.S. Basel. 1984. Ammonia volatilization from
surface applied urea: effect of hydrogen ion buffering capacity. Soi Sci. Soc. Am. J. 48:578-582.
Ferguson, R., and D. Kissel. 1986. Effects of drying on ammonia volatilization from surface-
applied urea. Soil Sci. Soc. Am. J. 50(2):485–490. Fox, T.R., H. L. Allen, T. J. Albaugh, R. Rubilar, and C.A. Carlson. 2007a. Tree nutrition and
forest fertilization of pine plantations in the southern United States. South. J. Appl. For. 31(1):5-11.
Fox, T.R., E.J. Jokela, and H.L. Allen. 2007b. The development of pine plantation silviculture in
the southern United States. J. For. 105(5):337-347. Goertz, H.M. 1993. Controlled Release Technology. Kirk-Othmer Encyclopedia of chemical
technology, Vol.7. Controlled Release Technology (Agricultural). p. 251-274. Gomez, K.A., and A.A. Gomez. 1984. Statistical procedures for agricultural research. John
Wiley & Sons. New York, NY. Gould, W.D., F.D. Cook, and R.G. Webster. 1973. Factors affecting urea hydrolysis in several
Alberta soils. Plant Soil 38(2): 393–401 Harre, E.A. and J.D. Bridges. 1988. Importance of urea fertilizers. In: B.R. Bock et al. editors,
Ammonia volatilization from urea fertilizers. Bull. Y- 206. National Fertilizer Development Center, Tennessee Valley Authority. Muscle Shoals, AL. p. 1–15.
Hauck, R.D., and H.F. Stephenson. 1965. Nitrification of nitrogen fertilizers. Effect of nitrogen
source, size, and pH of the granule, and concentration. J. Agr. Food Chem. 13(6):486-492.
Hauck, R.D. 1985. Slow release and bio-inhibitor-amended nitrogen fertilizers. pp. 293-322. In
Fertilizer technology and use. O.P. Engelstad (Ed.). 3rd Ed. He, Z.L., A.K. Alva, D.V. Calvert, and D.J. Banks. 1999. Ammonia volatilization from different
nitrogen fertilizers and effects of temperature and soil pH. Soil Sci. 164(10):750–758. lduchov, O. A., and R. E. Eskridge. 1996. Improved Magnus' form approximation of saturation vapor pressure. J. Appl. Meteor. 35:601–609. Johnson, D.W., and D.E. Todd. 1988. Nitrogen fertilization of young yellow poplar and loblolly
pine plantations at differing frequencies. Soil Sci. Soc. Am. J. 52(5):1468 –1477.
J.E. Raymond
68
Kelting, D.L., J. A. Burger, and G. S. Edwards. 1998. Estimating root respiration, microbial respiration in the rhizosphere, and root-free soil respiration in forest soils. Soil Biol. and Bioch. 30(7):961–968.
Kissel, D.E., and M.L. Cabrera. 1988. Factors affecting urea hydrolysis. In: B.R. Bock et al.
editors, Ammonia volatilization from urea fertilizers. Bull. Y- 206. National Fertilizer Development Center, Tennessee Valley Authority. Muscle Shoals, AL. p. 53-66.
Kissel, D., M. Cabrera, N. Vaio, J. Craig, J. Rema, and L. Morris. 2004. Rainfall timing and
ammonia loss from urea in a loblolly pine plantation. Soil Sci. Soc. Am. J. 68:1744–1750. doi:10.2136/sssaj2004.1744.
Kissel, D., M.L. Cabrera, N. Vaio, J.R. Craig, J.A. Rema, and L.A. Morris. 2009. Forest floor
composition and ammonia loss from urea in a loblolly pine plantation. Soil Sci. Soc. Am. J. 73(2):630–637. doi:10.2136/sssaj2007.0377.
Koelliker, J.K. and D.E. Kissel. 1988. Chemical equilibria affecting ammonia volatilization. In:
B.R. Bock et al. editors, Ammonia volatilization from urea fertilizers. Bull. Y- 206. National Fertilizer Development Center, Tennessee Valley Authority. Muscle Shoals, AL. p. 37-52.
Li, B., S.E. Mckeand, and H.L. Allen. 1991. Genetic variation in nitrogen use efficiency of
loblolly pine seedlings. For. Sci. 37(2):613– 626. Littell, R.C., G.A. Milliken, W.W. Stroup, R.D. Wolfinger, and O. Schabenberger. 2006. SAS
for Mixed Models, 2nd ed., SAS Institute Inc, Cary NC. Marsh, K.L., G.K. Sims, and R.L. Mulvaney. 2005. Availability of urea to autotrophic ammonia-
oxidizing bacteria as related to the fate of 14C and 15N labeled urea added to soil. Biol Fertil Soils. 42:137-145. DOI 10.1007/s00374-005-0004-2.
Marshall, V., and D. Debell. 1980. Comparison of four methods of measuring volatilization
losses of nitrogen following urea fertilization of forest soils. Can. J. Soil Sci. 60:549-563. May, B.M. and C.J. Carlyle. 2005. Nitrogen volatilization from urea fertilizer in mid-rotation
Pinus radiate plantations in south-eastern Australia. Australian Forestry. 68(1): 20-26. doi:10.1080/00049158.2005.10676222.
Mead, D.J., and W. L. Pritchett. 1975. Fertilizer movement in a slash pine ecosystem. 1. Uptake
of N and P and N movement in the soil. Plant Soil 43:451-465. Miller, H.G. 1981. Forest fertilization: some guiding concepts. Forestry. 54(2):157-157. Moyo, C.C., D. Kissel, and M.L. Cabrera. 1989. Temperature effects on soil urease activity. Soil
Biol. Biochem. 21:935–938. doi:10.1016/0038-0717(89)90083-7.
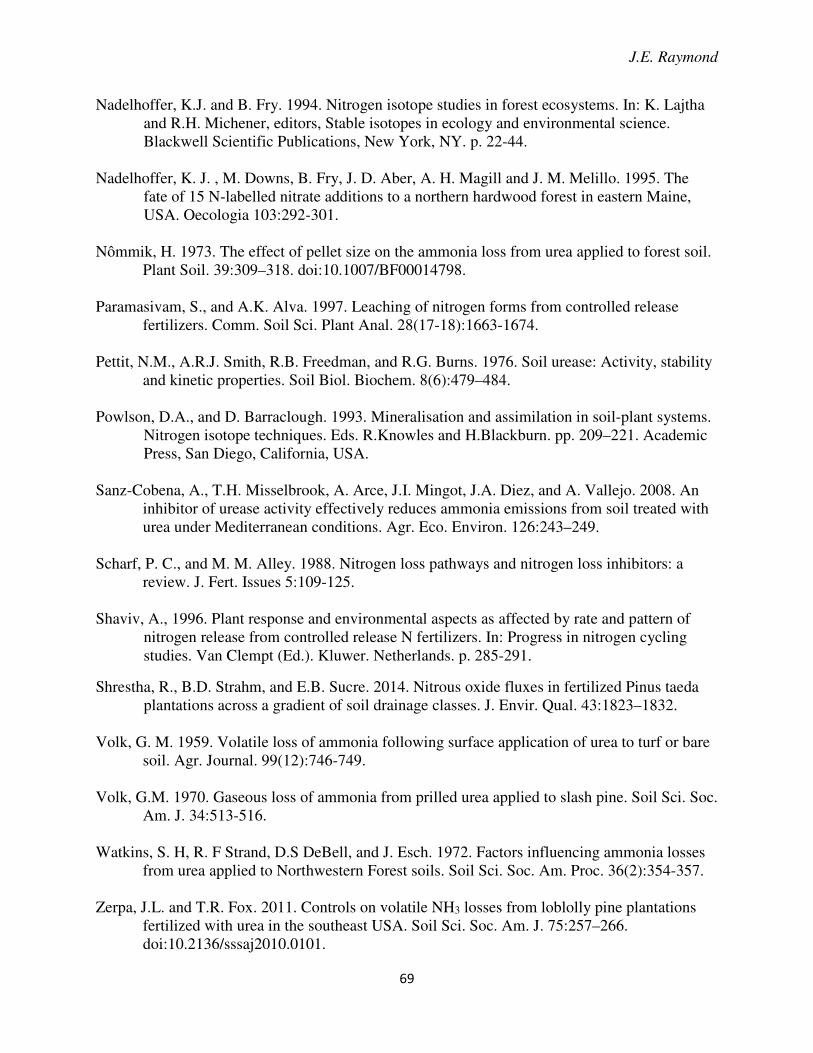
J.E. Raymond
69
Nadelhoffer, K.J. and B. Fry. 1994. Nitrogen isotope studies in forest ecosystems. In: K. Lajtha and R.H. Michener, editors, Stable isotopes in ecology and environmental science. Blackwell Scientific Publications, New York, NY. p. 22-44.
Nadelhoffer, K. J. , M. Downs, B. Fry, J. D. Aber, A. H. Magill and J. M. Melillo. 1995. The
fate of 15 N-labelled nitrate additions to a northern hardwood forest in eastern Maine, USA. Oecologia 103:292-301.
Nômmik, H. 1973. The effect of pellet size on the ammonia loss from urea applied to forest soil.
Plant Soil. 39:309–318. doi:10.1007/BF00014798. Paramasivam, S., and A.K. Alva. 1997. Leaching of nitrogen forms from controlled release
fertilizers. Comm. Soil Sci. Plant Anal. 28(17-18):1663-1674.
Pettit, N.M., A.R.J. Smith, R.B. Freedman, and R.G. Burns. 1976. Soil urease: Activity, stability and kinetic properties. Soil Biol. Biochem. 8(6):479–484.
Powlson, D.A., and D. Barraclough. 1993. Mineralisation and assimilation in soil-plant systems. Nitrogen isotope techniques. Eds. R.Knowles and H.Blackburn. pp. 209–221. Academic Press, San Diego, California, USA.
Sanz-Cobena, A., T.H. Misselbrook, A. Arce, J.I. Mingot, J.A. Diez, and A. Vallejo. 2008. An
inhibitor of urease activity effectively reduces ammonia emissions from soil treated with urea under Mediterranean conditions. Agr. Eco. Environ. 126:243–249.
Scharf, P. C., and M. M. Alley. 1988. Nitrogen loss pathways and nitrogen loss inhibitors: a review. J. Fert. Issues 5:109-125.
Shaviv, A., 1996. Plant response and environmental aspects as affected by rate and pattern of
nitrogen release from controlled release N fertilizers. In: Progress in nitrogen cycling studies. Van Clempt (Ed.). Kluwer. Netherlands. p. 285-291.
Shrestha, R., B.D. Strahm, and E.B. Sucre. 2014. Nitrous oxide fluxes in fertilized Pinus taeda plantations across a gradient of soil drainage classes. J. Envir. Qual. 43:1823–1832.
Volk, G. M. 1959. Volatile loss of ammonia following surface application of urea to turf or bare
soil. Agr. Journal. 99(12):746-749. Volk, G.M. 1970. Gaseous loss of ammonia from prilled urea applied to slash pine. Soil Sci. Soc.
Am. J. 34:513-516. Watkins, S. H, R. F Strand, D.S DeBell, and J. Esch. 1972. Factors influencing ammonia losses
from urea applied to Northwestern Forest soils. Soil Sci. Soc. Am. Proc. 36(2):354-357. Zerpa, J.L. and T.R. Fox. 2011. Controls on volatile NH3 losses from loblolly pine plantations
fertilized with urea in the southeast USA. Soil Sci. Soc. Am. J. 75:257–266. doi:10.2136/sssaj2010.0101.
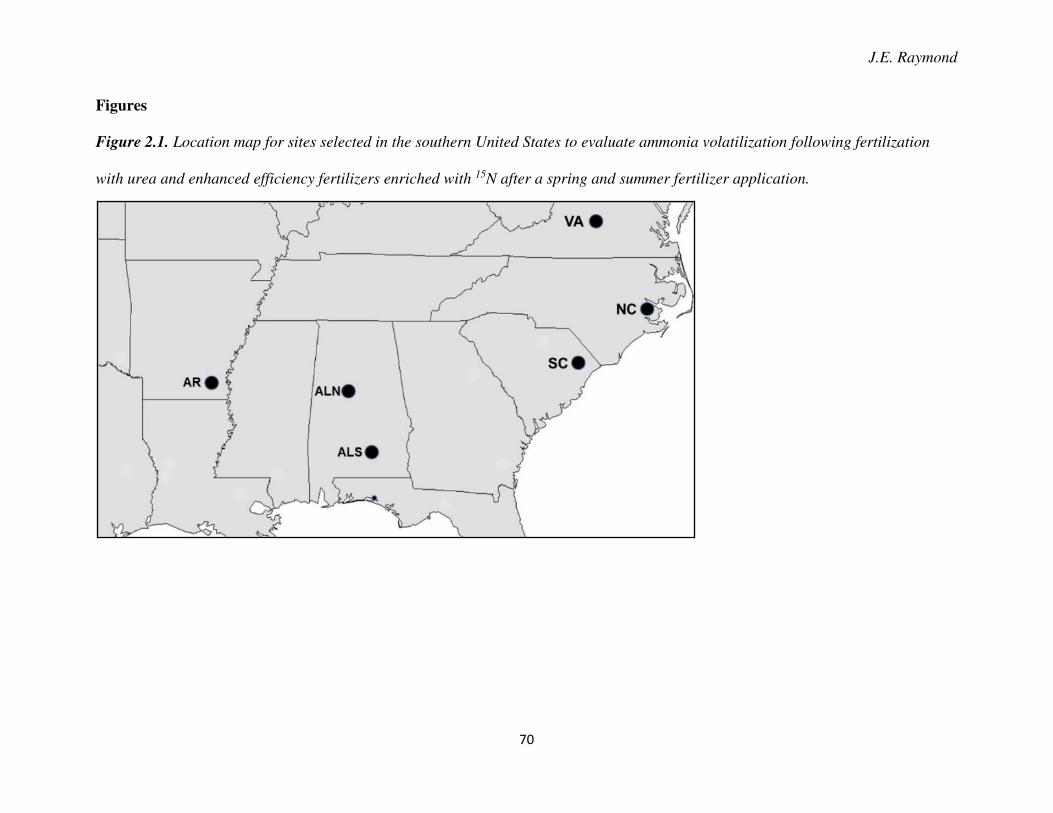
J.E. Raymond
70
Figures
Figure 2.1. Location map for sites selected in the southern United States to evaluate ammonia volatilization following fertilization
with urea and enhanced efficiency fertilizers enriched with 15N after a spring and summer fertilizer application.
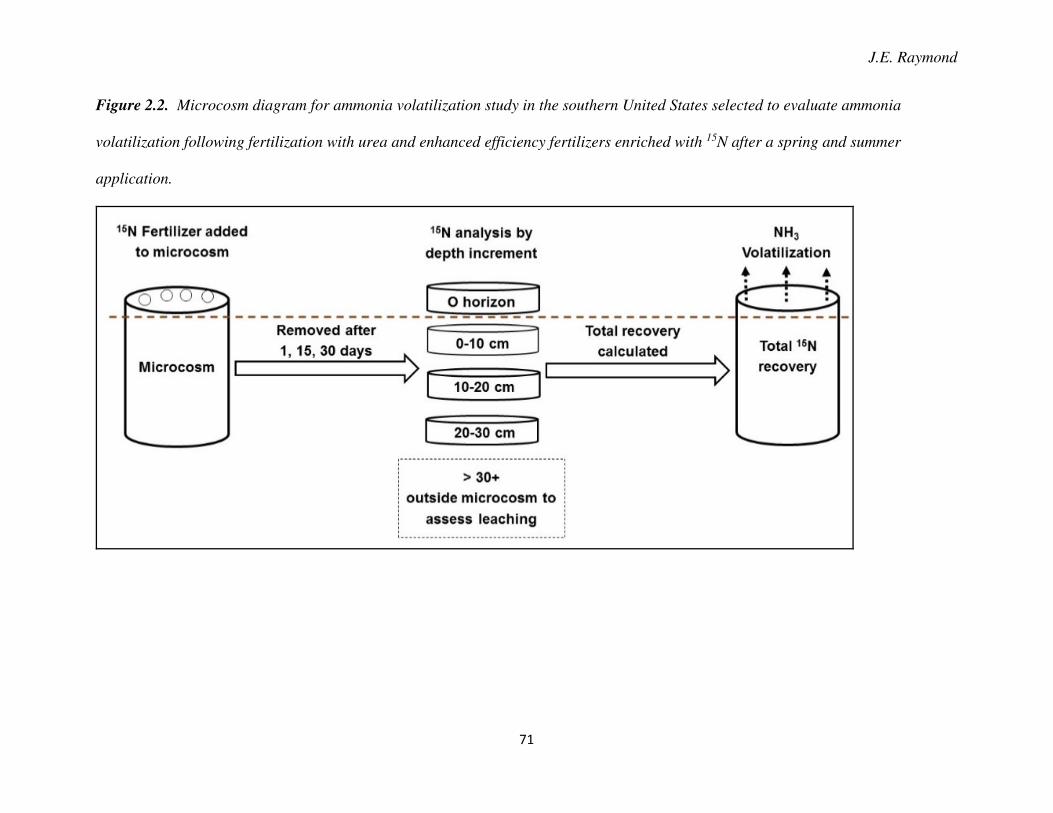
J.E. Raymond
71
Figure 2.2. Microcosm diagram for ammonia volatilization study in the southern United States selected to evaluate ammonia
volatilization following fertilization with urea and enhanced efficiency fertilizers enriched with 15N after a spring and summer
application.
J.E. Raymond
72
Figure 2.3. The mean percent recovery of applied 15N enriched fertilizers in microcosms, by soil depth increment, for spring and
summer application after 30 days. The >30 cm increment is immediately below the microcosm. Error bars are the standard error of
the mean.
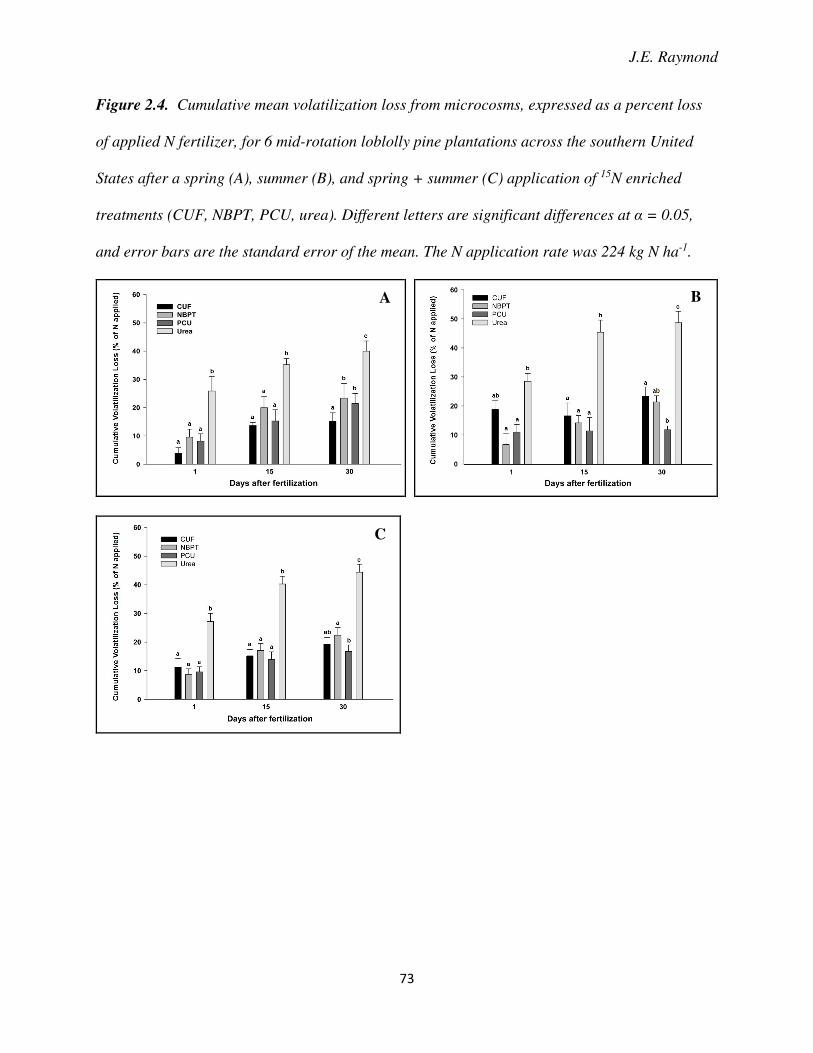
J.E. Raymond
73
Figure 2.4. Cumulative mean volatilization loss from microcosms, expressed as a percent loss
of applied N fertilizer, for 6 mid-rotation loblolly pine plantations across the southern United
States after a spring (A), summer (B), and spring + summer (C) application of 15N enriched
treatments (CUF, NBPT, PCU, urea). Different letters are significant differences at α = 0.05,
and error bars are the standard error of the mean. The N application rate was 224 kg N ha-1.
A
C
B
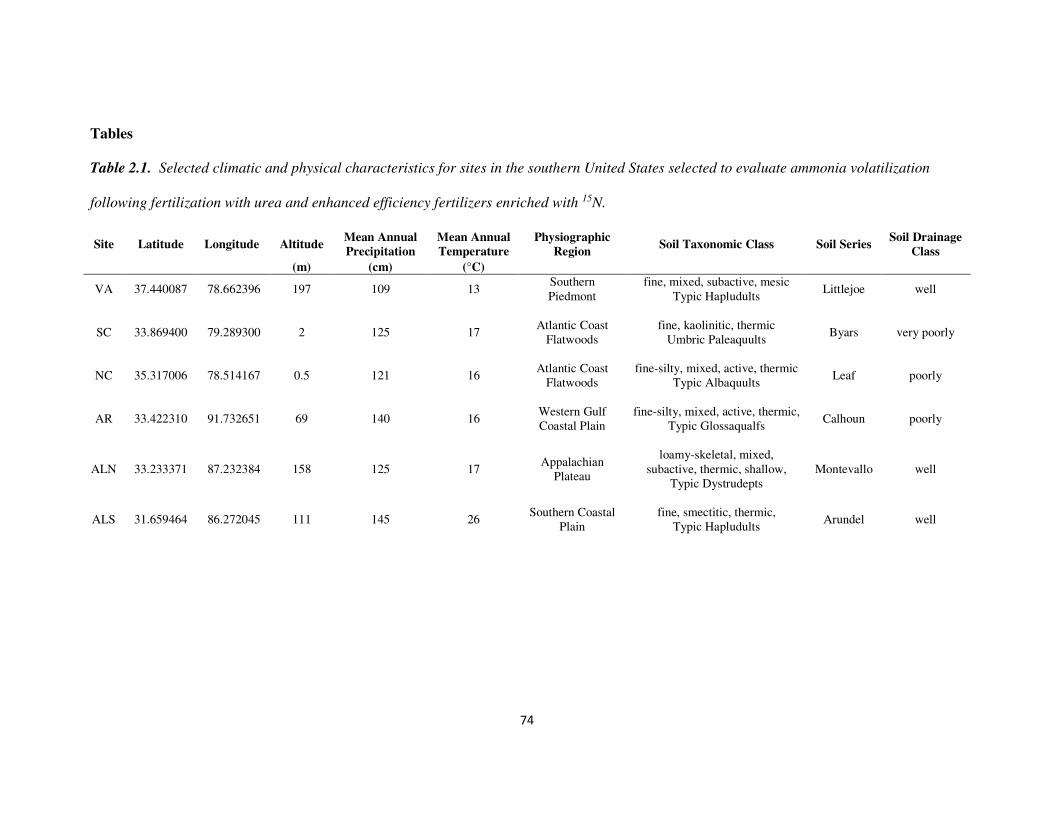
74
Tables
Table 2.1. Selected climatic and physical characteristics for sites in the southern United States selected to evaluate ammonia volatilization
following fertilization with urea and enhanced efficiency fertilizers enriched with 15N.
Site Latitude Longitude Altitude Mean Annual
Precipitation
Mean Annual
Temperature
Physiographic
Region Soil Taxonomic Class Soil Series
Soil Drainage
Class
(m) (cm) (°C)
VA 37.440087 78.662396 197 109 13 Southern Piedmont
fine, mixed, subactive, mesic Typic Hapludults
Littlejoe well
SC 33.869400 79.289300 2 125 17 Atlantic Coast
Flatwoods fine, kaolinitic, thermic
Umbric Paleaquults Byars very poorly
NC 35.317006 78.514167 0.5 121 16 Atlantic Coast
Flatwoods fine-silty, mixed, active, thermic
Typic Albaquults Leaf poorly
AR 33.422310 91.732651 69 140 16 Western Gulf Coastal Plain
fine-silty, mixed, active, thermic, Typic Glossaqualfs
Calhoun poorly
ALN 33.233371 87.232384 158 125 17 Appalachian
Plateau
loamy-skeletal, mixed, subactive, thermic, shallow,
Typic Dystrudepts Montevallo well
ALS 31.659464 86.272045 111 145 26 Southern Coastal
Plain fine, smectitic, thermic,
Typic Hapludults Arundel well
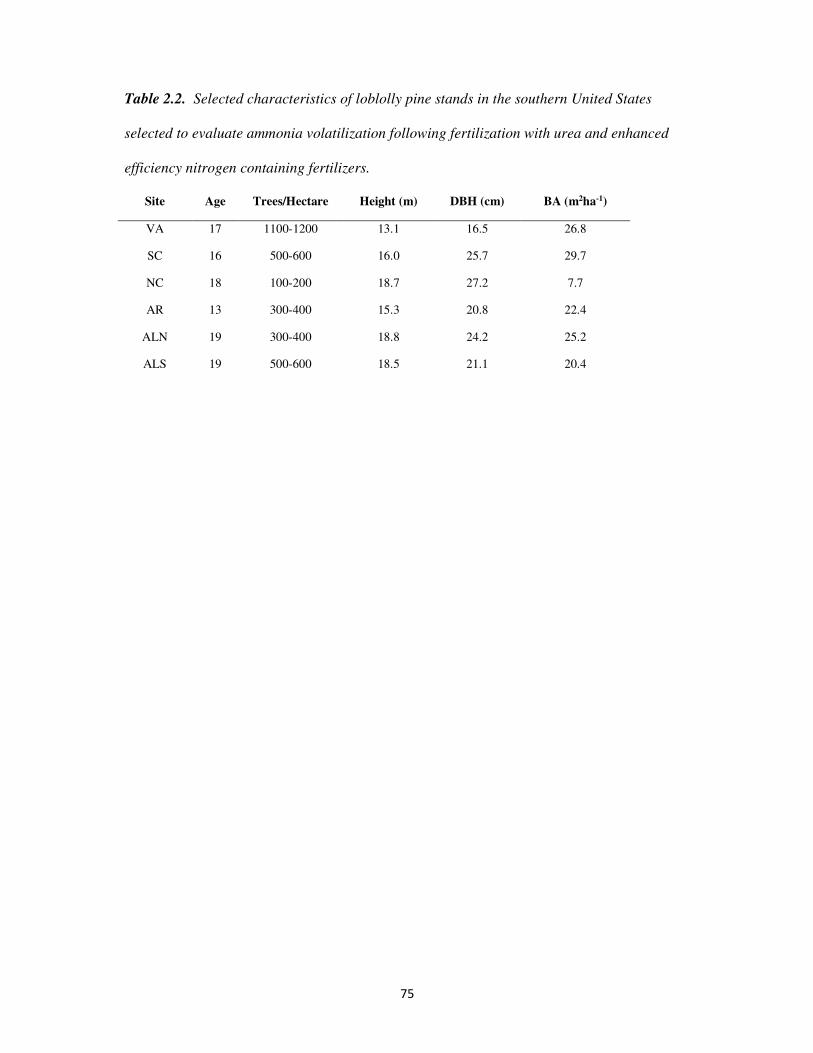
75
Table 2.2. Selected characteristics of loblolly pine stands in the southern United States
selected to evaluate ammonia volatilization following fertilization with urea and enhanced
efficiency nitrogen containing fertilizers.
Site Age Trees/Hectare Height (m) DBH (cm) BA (m2ha-1)
VA 17 1100-1200 13.1 16.5 26.8
SC 16 500-600 16.0 25.7 29.7
NC 18 100-200 18.7 27.2 7.7
AR 13 300-400 15.3 20.8 22.4
ALN 19 300-400 18.8 24.2 25.2
ALS 19 500-600 18.5 21.1 20.4
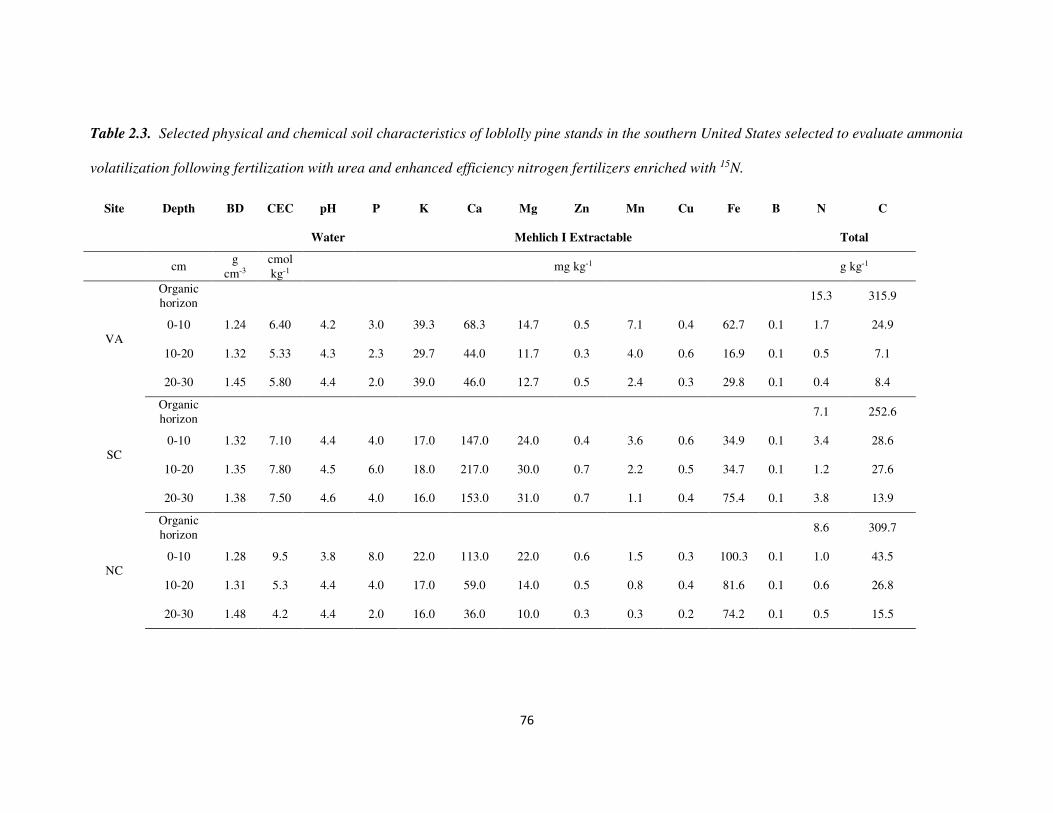
76
Table 2.3. Selected physical and chemical soil characteristics of loblolly pine stands in the southern United States selected to evaluate ammonia
volatilization following fertilization with urea and enhanced efficiency nitrogen fertilizers enriched with 15N.
Site Depth BD CEC pH P K Ca Mg Zn Mn Cu Fe B N C
Water Mehlich I Extractable Total
cm g
cm-3 cmol kg-1
mg kg-1 g kg-1
VA
Organic horizon
15.3 315.9
0-10 1.24 6.40 4.2 3.0 39.3 68.3 14.7 0.5 7.1 0.4 62.7 0.1 1.7 24.9
10-20 1.32 5.33 4.3 2.3 29.7 44.0 11.7 0.3 4.0 0.6 16.9 0.1 0.5 7.1
20-30 1.45 5.80 4.4 2.0 39.0 46.0 12.7 0.5 2.4 0.3 29.8 0.1 0.4 8.4
SC
Organic horizon
7.1 252.6
0-10 1.32 7.10 4.4 4.0 17.0 147.0 24.0 0.4 3.6 0.6 34.9 0.1 3.4 28.6
10-20 1.35 7.80 4.5 6.0 18.0 217.0 30.0 0.7 2.2 0.5 34.7 0.1 1.2 27.6
20-30 1.38 7.50 4.6 4.0 16.0 153.0 31.0 0.7 1.1 0.4 75.4 0.1 3.8 13.9
NC
Organic horizon
8.6 309.7
0-10 1.28 9.5 3.8 8.0 22.0 113.0 22.0 0.6 1.5 0.3 100.3 0.1 1.0 43.5
10-20 1.31 5.3 4.4 4.0 17.0 59.0 14.0 0.5 0.8 0.4 81.6 0.1 0.6 26.8
20-30 1.48 4.2 4.4 2.0 16.0 36.0 10.0 0.3 0.3 0.2 74.2 0.1 0.5 15.5
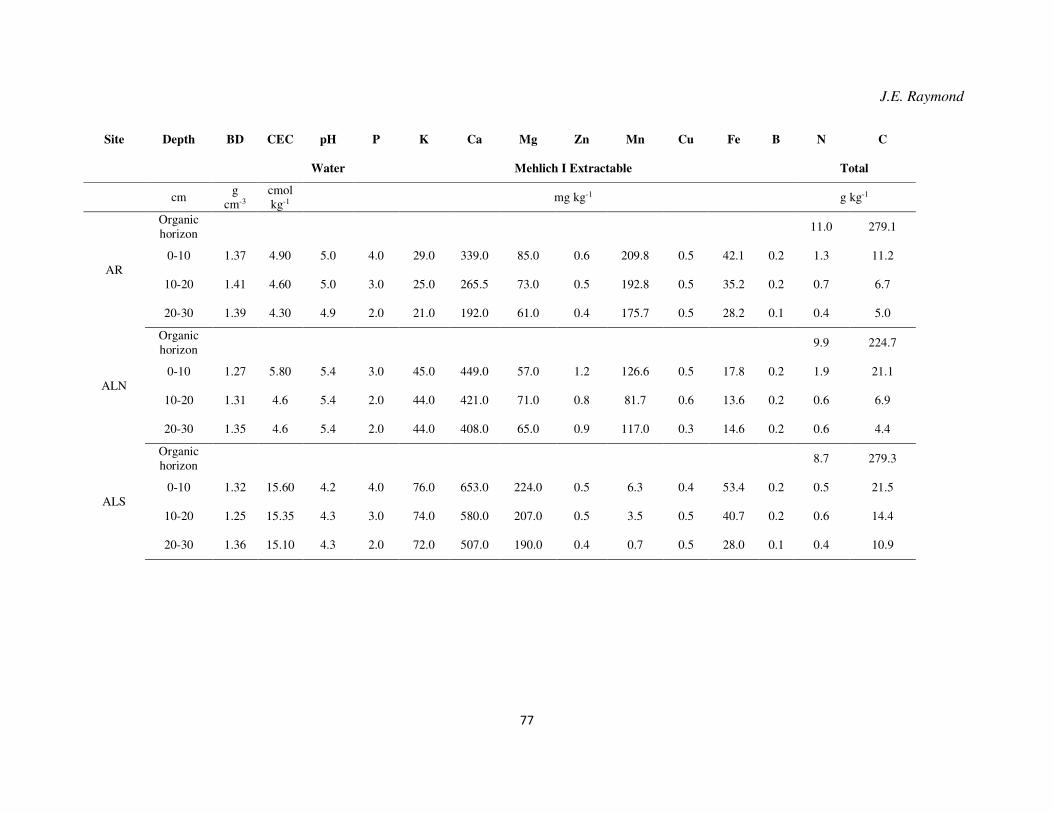
J.E. Raymond
77
Site Depth BD CEC pH P K Ca Mg Zn Mn Cu Fe B N C
Water Mehlich I Extractable Total
cm g
cm-3 cmol kg-1
mg kg-1 g kg-1
AR
Organic horizon
11.0 279.1
0-10 1.37 4.90 5.0 4.0 29.0 339.0 85.0 0.6 209.8 0.5 42.1 0.2 1.3 11.2
10-20 1.41 4.60 5.0 3.0 25.0 265.5 73.0 0.5 192.8 0.5 35.2 0.2 0.7 6.7
20-30 1.39 4.30 4.9 2.0 21.0 192.0 61.0 0.4 175.7 0.5 28.2 0.1 0.4 5.0
ALN
Organic horizon
9.9 224.7
0-10 1.27 5.80 5.4 3.0 45.0 449.0 57.0 1.2 126.6 0.5 17.8 0.2 1.9 21.1
10-20 1.31 4.6 5.4 2.0 44.0 421.0 71.0 0.8 81.7 0.6 13.6 0.2 0.6 6.9
20-30 1.35 4.6 5.4 2.0 44.0 408.0 65.0 0.9 117.0 0.3 14.6 0.2 0.6 4.4
ALS
Organic horizon
8.7 279.3
0-10 1.32 15.60 4.2 4.0 76.0 653.0 224.0 0.5 6.3 0.4 53.4 0.2 0.5 21.5
10-20 1.25 15.35 4.3 3.0 74.0 580.0 207.0 0.5 3.5 0.5 40.7 0.2 0.6 14.4
20-30 1.36 15.10 4.3 2.0 72.0 507.0 190.0 0.4 0.7 0.5 28.0 0.1 0.4 10.9
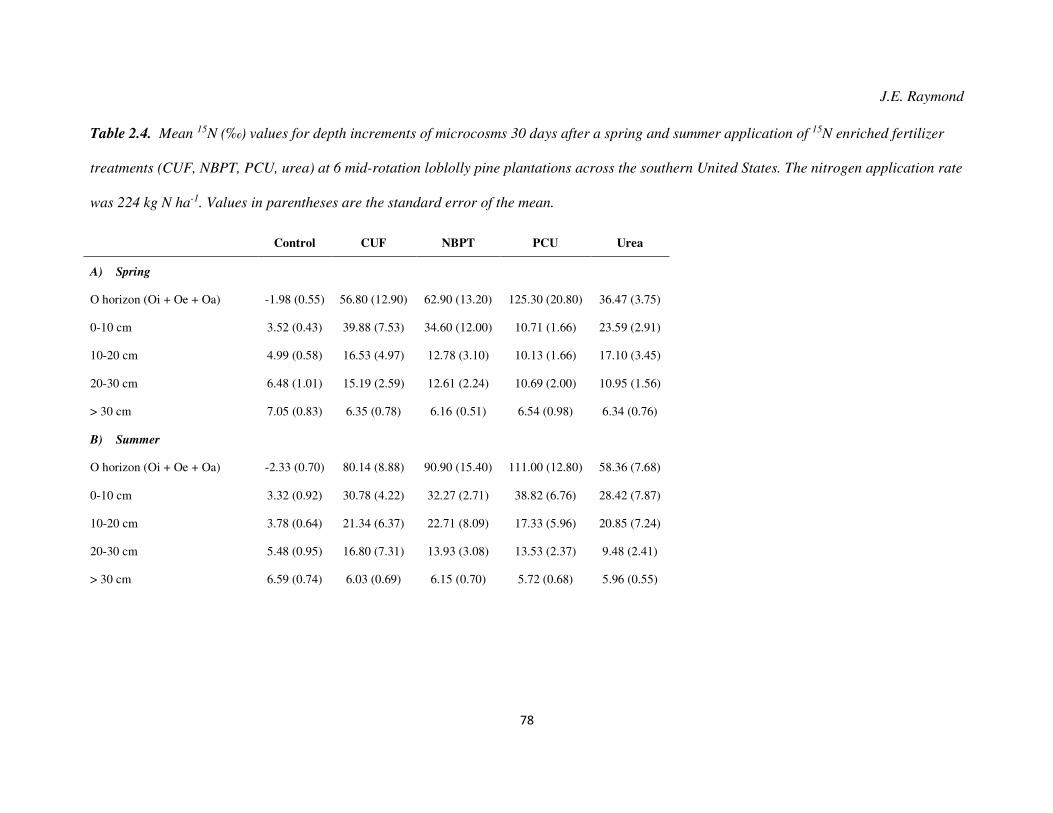
J.E. Raymond
78
Table 2.4. Mean 15N (‰) values for depth increments of microcosms 30 days after a spring and summer application of 15N enriched fertilizer
treatments (CUF, NBPT, PCU, urea) at 6 mid-rotation loblolly pine plantations across the southern United States. The nitrogen application rate
was 224 kg N ha-1. Values in parentheses are the standard error of the mean.
Control CUF NBPT PCU Urea
A) Spring
O horizon (Oi + Oe + Oa) -1.98 (0.55) 56.80 (12.90) 62.90 (13.20) 125.30 (20.80) 36.47 (3.75)
0-10 cm 3.52 (0.43) 39.88 (7.53) 34.60 (12.00) 10.71 (1.66) 23.59 (2.91)
10-20 cm 4.99 (0.58) 16.53 (4.97) 12.78 (3.10) 10.13 (1.66) 17.10 (3.45)
20-30 cm 6.48 (1.01) 15.19 (2.59) 12.61 (2.24) 10.69 (2.00) 10.95 (1.56)
> 30 cm 7.05 (0.83) 6.35 (0.78) 6.16 (0.51) 6.54 (0.98) 6.34 (0.76)
B) Summer
O horizon (Oi + Oe + Oa) -2.33 (0.70) 80.14 (8.88) 90.90 (15.40) 111.00 (12.80) 58.36 (7.68)
0-10 cm 3.32 (0.92) 30.78 (4.22) 32.27 (2.71) 38.82 (6.76) 28.42 (7.87)
10-20 cm 3.78 (0.64) 21.34 (6.37) 22.71 (8.09) 17.33 (5.96) 20.85 (7.24)
20-30 cm 5.48 (0.95) 16.80 (7.31) 13.93 (3.08) 13.53 (2.37) 9.48 (2.41)
> 30 cm 6.59 (0.74) 6.03 (0.69) 6.15 (0.70) 5.72 (0.68) 5.96 (0.55)
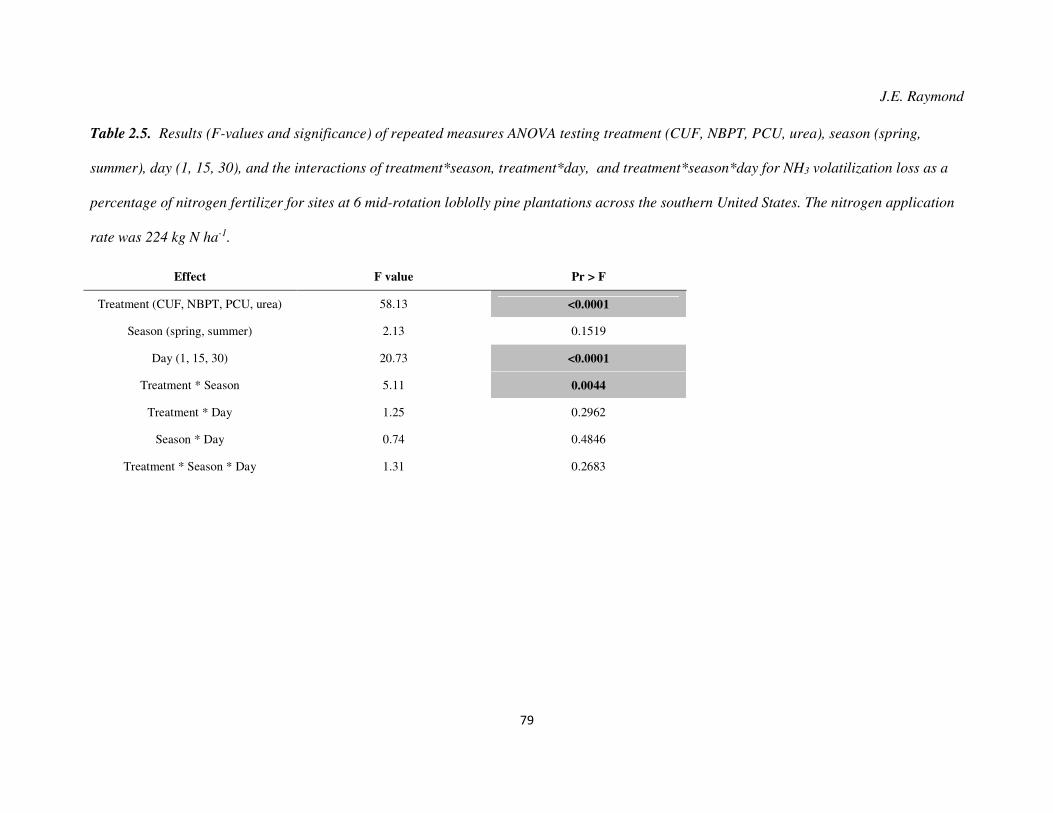
J.E. Raymond
79
Table 2.5. Results (F-values and significance) of repeated measures ANOVA testing treatment (CUF, NBPT, PCU, urea), season (spring,
summer), day (1, 15, 30), and the interactions of treatment*season, treatment*day, and treatment*season*day for NH3 volatilization loss as a
percentage of nitrogen fertilizer for sites at 6 mid-rotation loblolly pine plantations across the southern United States. The nitrogen application
rate was 224 kg N ha-1.
Effect F value Pr > F
Treatment (CUF, NBPT, PCU, urea) 58.13 <0.0001
Season (spring, summer) 2.13 0.1519
Day (1, 15, 30) 20.73 <0.0001
Treatment * Season 5.11 0.0044
Treatment * Day 1.25 0.2962
Season * Day 0.74 0.4846
Treatment * Season * Day 1.31 0.2683
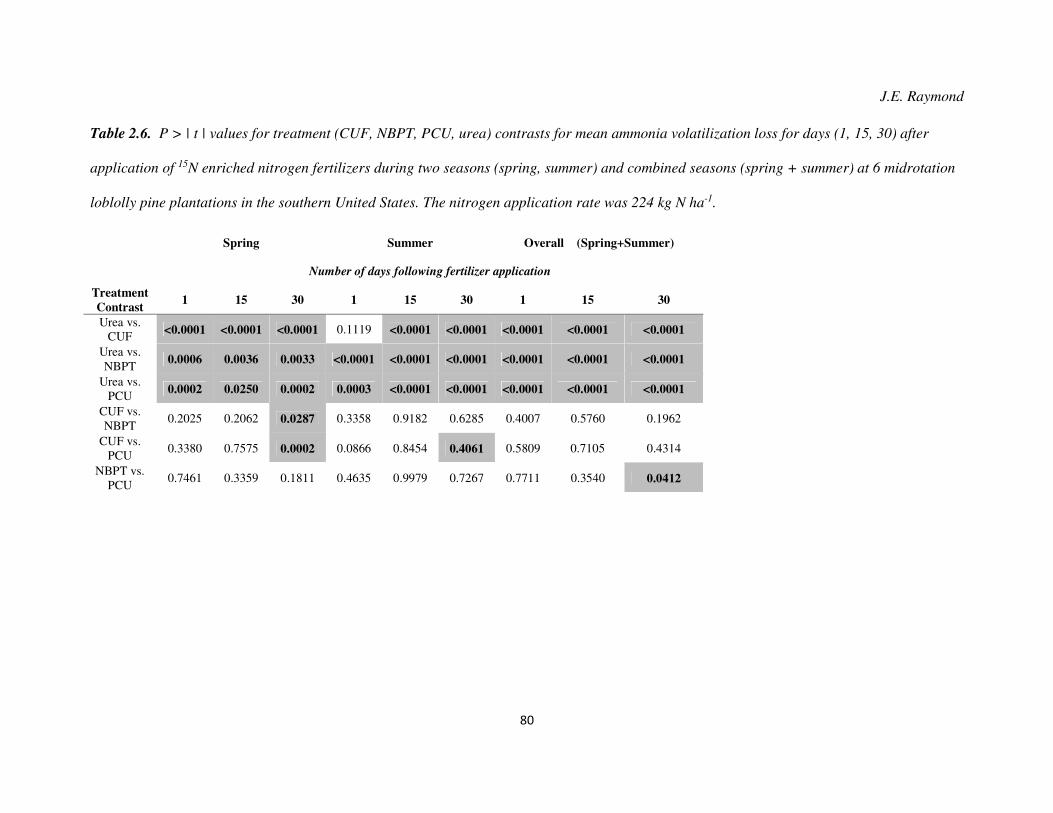
J.E. Raymond
80
Table 2.6. P > | t | values for treatment (CUF, NBPT, PCU, urea) contrasts for mean ammonia volatilization loss for days (1, 15, 30) after
application of 15N enriched nitrogen fertilizers during two seasons (spring, summer) and combined seasons (spring + summer) at 6 midrotation
loblolly pine plantations in the southern United States. The nitrogen application rate was 224 kg N ha-1.
Spring Summer Overall (Spring+Summer)
Number of days following fertilizer application
Treatment
Contrast 1 15 30 1 15 30 1 15 30
Urea vs. CUF <0.0001 <0.0001 <0.0001 0.1119 <0.0001 <0.0001 <0.0001 <0.0001 <0.0001
Urea vs. NBPT
0.0006 0.0036 0.0033 <0.0001 <0.0001 <0.0001 <0.0001 <0.0001 <0.0001
Urea vs. PCU 0.0002 0.0250 0.0002 0.0003 <0.0001 <0.0001 <0.0001 <0.0001 <0.0001
CUF vs. NBPT
0.2025 0.2062 0.0287 0.3358 0.9182 0.6285 0.4007 0.5760 0.1962
CUF vs. PCU
0.3380 0.7575 0.0002 0.0866 0.8454 0.4061 0.5809 0.7105 0.4314
NBPT vs. PCU
0.7461 0.3359 0.1811 0.4635 0.9979 0.7267 0.7711 0.3540 0.0412
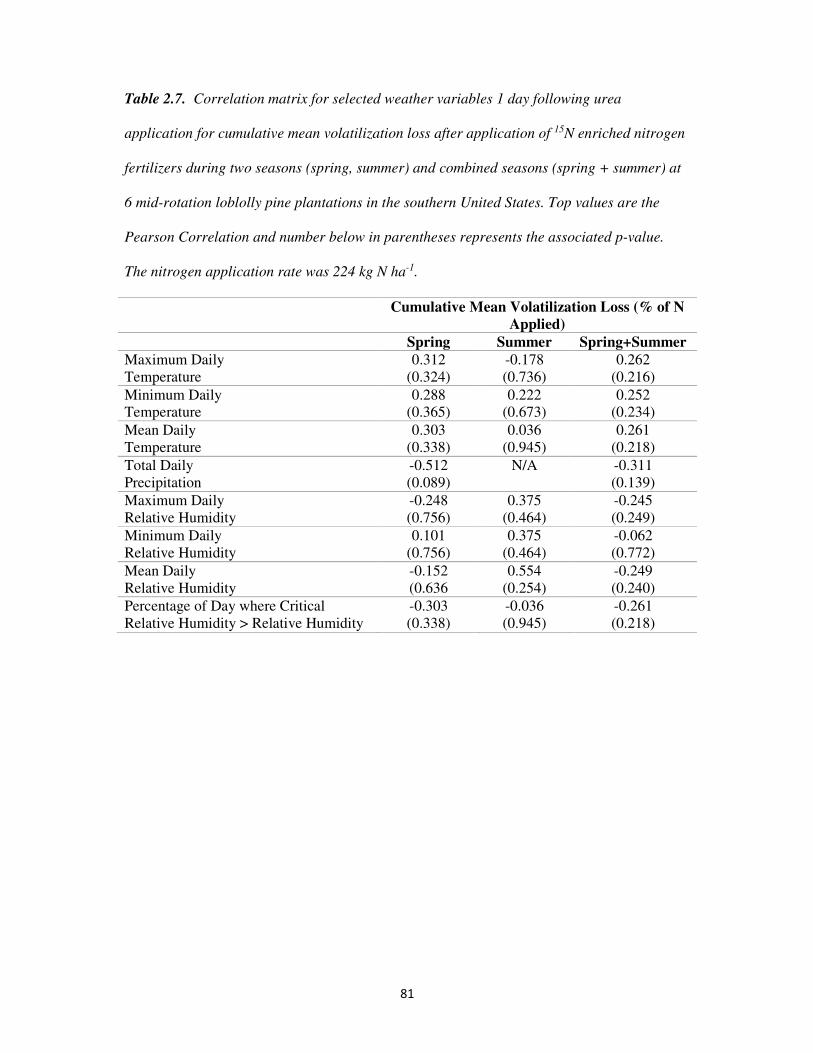
81
Table 2.7. Correlation matrix for selected weather variables 1 day following urea
application for cumulative mean volatilization loss after application of 15N enriched nitrogen
fertilizers during two seasons (spring, summer) and combined seasons (spring + summer) at
6 mid-rotation loblolly pine plantations in the southern United States. Top values are the
Pearson Correlation and number below in parentheses represents the associated p-value.
The nitrogen application rate was 224 kg N ha-1.
Cumulative Mean Volatilization Loss (% of N
Applied)
Spring Summer Spring+Summer
Maximum Daily Temperature
0.312 (0.324)
-0.178 (0.736)
0.262 (0.216)
Minimum Daily Temperature
0.288 (0.365)
0.222 (0.673)
0.252 (0.234)
Mean Daily Temperature
0.303 (0.338)
0.036 (0.945)
0.261 (0.218)
Total Daily Precipitation
-0.512 (0.089)
N/A -0.311 (0.139)
Maximum Daily Relative Humidity
-0.248 (0.756)
0.375 (0.464)
-0.245 (0.249)
Minimum Daily Relative Humidity
0.101 (0.756)
0.375 (0.464)
-0.062 (0.772)
Mean Daily Relative Humidity
-0.152 (0.636
0.554 (0.254)
-0.249 (0.240)
Percentage of Day where Critical Relative Humidity > Relative Humidity
-0.303 (0.338)
-0.036 (0.945)
-0.261 (0.218)
82
Chapter 3. Temporal Patterns of Foliar Nitrogen after Fertilization for Two Application
Seasons in Mid-Rotation Loblolly Pine Plantations (Pinus taeda L) of the
Southern United States
Abstract
The nitrogen (N) uptake of loblolly pines was determined following the surface
application of urea and three enhanced efficiency N containing fertilizers (EEFs) at six
thinned mid-rotation loblolly pine stands (Pinus taeda L.) across the southern United States.
All fertilizer treatments were labeled with 15N (~370 permil, 0.5 AP) and applied during two
different seasons (spring, summer) in 2011 to individual 100 m2 circular plots. Loblolly pine
foliage was sampled every six weeks following N fertilization over a single growing season
to assess foliar N uptake. Nitrogen fertilization increased the number of flushes and
significantly increased the individual fascicle mean mass compared to unfertilized plots over
the growing season. Nitrogen fertilization slightly increased foliar mean N concentrations
(not significant), and significantly increased individual fascicle mean N content and foliar
mean 15N (‰) over the growing season after both a spring and summer fertilization. The
proportion of individual fascicle mean fertilizer N also increased over the growing season,
with individual treatment differences gradually dissipating towards the middle to end of the
growing season. Both the cumulative N content and cumulative fertilizer N content gradually
increased across the growing season after both a spring and summer fertilization, with more
fertilizer N content in individual fascicles for the spring compared to a summer fertilization.
This research indicates N fertilization improves growth directly through N addition, but may
also make N existing naturally more readily available for plant uptake in these mid-rotation
loblolly pine plantation systems.
J.E. Raymond
83
3.1. Introduction
Soil nutrient deficiencies limiting the growth of forest plantations can be ameliorated
through fertilization (Ballard 1984). The amelioration of nitrogen (N) deficiencies in forest
plantations is particularly important because N is required in large quantities for foliar tissue
development, photosynthesis, and numerous biochemical processes, all which are critical to
growth (Miller 1981, Linder 1987). For example, a mid-rotation fertilization of loblolly pine
(Pinus taeda L.) plantations in the southern United States with 224 kg ha-1 N and 28 kg ha-1
phosphorous (P) have a mean growth increase of 3 m3 ha-1 over 8 years (Allen 1987, Fox et
al. 2007a). Despite fertilization improving loblolly pine growth, field trials generally show
low tree fertilizer N uptake (Mead and Pritchett 1975, Johnson and Todd 1988, Albaugh et al.
2004). In addition, some sites have no or a negative fertilizer response (Pritchett and Smith
1972, Martin et al. 1999, Amateis et al. 2000, Carlson et al. 2014) leading to a growth response
ranging from 0 m3 ha-1 yr-1 to 10 m3 ha-1 yr-1 in loblolly pine fertilizer trials (Rojas 2005, Fox et
al. 2007a). Conversely, laboratory studies for certain tree species show fertilizer N uptake
ranging from 40% to 95% (Pang 1985, Salifu and Timmer 2003, Amponsah et al. 2004).
Clearly an improved understanding of tree fertilizer N uptake and fertilizer N cycling in
forest plantations is required to properly identify sites that are responsive to fertilization.
There are several explanations for differences in tree fertilizer N uptake among studies.
Fertilizer N loss after application, primarily by ammonia (NH3) volatilization (Raymond et al.
2016), denitrification (Shrestha et al. 2014) or leaching (Binkely et al. 1995, Aust and Blinn
2004) reduces total fertilizer N entering and remaining in the system, and may reduce fertilizer
N availability for tree N uptake. Fertilizer N immobilization in ecosystem components with
varying turnover rates can make fertilizer N unavailable to crop trees for extended periods
during the rotation (Birk and Vitousek 1985, Albaugh et al. 2004, Meeks 2015). Sites
J.E. Raymond
84
unresponsive to N fertilization may simply have adequate plant available soil N due to high rates
of soil organic matter mineralization (Fox et al. 2007a). Finally, soil nutrient deficiencies other
than N may limit productivity (Vogel and Jokela 2011). These factors and their interactions may
explain the observed variability in fertilizer trials in southern loblolly pine systems. Addressing
these points through an improved understanding of the fertilizer N allocated to ecosystem
components, pathways and rates of fertilizer N cycling, and fertilizer N uptake in forest
plantations will improve fertilizer nitrogen use efficiency (FNUE) in these systems.
To improve fertilizer N uptake after fertilization, slow release (SRN), controlled
release (CRN) and stabilized (SNF) N fertilizers were developed (Azeem et al. 2014,
Fertilizer Institute 2015). The SRN, CRN and SNF are all enhanced efficiency fertilizers
(EEFs) (AAPFCO 2015), defined as fertilizer products that reduce nutrient loss to the
environment while increasing plant nutrient availability by slowing nutrient release or
conversion of the nutrient to forms less susceptible to losses (The Fertilizer Institute 2015).
The EEFs were developed to reduce the mechanisms of fertilizer N loss and provide a more
flexible fertilizer N application and supply with seasonal plant demand (Hauck 1985, Goertz
1993, Azeem et al. 2014). The CRN is fertilizer N that is coated or encapsulated to provide
specific rate, pattern and release durations (Chien et al. 2009). Fertilizer N in SRN is
gradually released by microbial decomposition (Trenkel 2010). Fertilizer N in SNF is treated
with inhibitors to avoid rapid N transformation to less environmentally stable forms (Shaviv
1996). Effective fertilizer N containing EEFs should have: 1) improved FNUE; 2) less N
leaching; 3) low toxicity; 4) longer N supply; 5) reduced NH3 volatilization or nitrification;
and 6) lower application cost (Allen 1984, Hauck 1985). Although EEFs were developed to
improve FNUE in agroecosystems, similar FNUE issues exist for pine plantations.
Implementing EEF technology for fertilizer N application in southern pine plantations may
improve FNUE and continue to increase the productivity of these systems. An increase in
J.E. Raymond
85
ecosystem fertilizer N retention may translate to an increase in N uptake over the growing
season for loblolly pine trees.
Numerous methods have been developed to assess loblolly pine nutrient status and
evaluate potential response to fertilization (Bowen and Nambier 1984, Carter 1992). The
simplest method is visual observation (Stone 1968), but is limited because obvious symptoms
(chlorosis) can be due to multi-nutrient deficiencies (Vogel or Jokela 2011) or pathogens
(USDA 1989). Foliar analysis, including nutrient concentrations, critical nutrient levels
(Tisdale et al. 1985, Havlin et al. 2014), nutrient ratios in Diagnosis of Recommendation
Integrated System (DRIS) (Hockman and Allen 1990, Sypert 2005), and graphical analysis
(Haase and Rose 1985) improve on visual assessment, but may be of limited value if
sampling season and edaphic factors are not integrated (Carter 1992). Soil sampling and
nutrient addition experiments also provide insight but may require large sample sizes to
address soil heterogeneity (Binkely and Hart 1989). Integrated soils research has led to the
development of soil groupings based on similar parent materials within physiographic regions
that correlate with specific nutrient deficiencies, like the Cooperative Research in Forest
Fertilization (CRIFF) soil groupings in the southern United States (Jokela and Long 2000), or
groupings in the Pacific Northwest (Littke et al. 2014). Field or greenhouse bioassays using
seedlings can also be valuable, but results may be confounded by artificial laboratory
conditions and may be difficult to extrapolate to the field (Addoms 1937, Hobbs 1947,
Morrison 1974, Mead and Pritchett 1975, Birk and Vitousek 1986). The most reliable, but
expensive, assessment of nutrient deficiencies and fertilizer N uptake are fertilizer field trials
(Miller 1981, Carter 1992, Albaugh et al. 2004, Fox et al. 2007a). Stable isotopes, as with
15N, can be used to assess nutrient deficiencies and quantify fertilizer N uptake (Hauck 1968).
Fertilizers enriched with stable isotopes (15N) can trace the ultimate fate of applied N (Walker
1958, Hauck 1968, Powlson and Barraclough 1993) and be used to integrate ecosystem
J.E. Raymond
86
processes (Robinson 2001, Dawson et al. 2002, Templar et al. 2012). Numerous 15N tracer
studies were initially conducted in agroecosystems (Hauck and Bystrom 1971), but 15N tracer
studies have also improved the understanding of N dynamics in natural (Tietema et al. 1998,
Currie and Nadelhoffer 1999, Dinkelmeyer et al. 2003, Nadelhoffer et al. 2004, Templar et al.
2012) and plantation (Walker 1958, Hauck 1968, Mead and Pritchett 1975, Melin et al. 1983,
Chang et al. 1996, Bubb et al. 1999, Mead et al. 2008, Werner 2013) forests. Often several
methods need to be combined at sites to improve the understanding of nutrient status and
fertilizer responsiveness (Miller 1981, Birk and Vitousek 1985, Sypert 2005).
All fertilizer N in this study, both urea and EEFs, were enriched with 15N (~370‰, 0.5
AP) to improve the understanding of N uptake of loblolly pines in the southern United States
over the course of a single growing season. The statistical hypotheses for this research are:
HO1: There are no differences in foliar growth among treatments.
HO2: There are no differences in foliar N uptake among treatments.
HO3: There are no differences in foliar fertilizer N uptake among treatments.
3.2. Methods and Materials
3.2.1. Experimental Design and Site Description
This experiment used a split plot complete block design to test temporal differences in
fertilizer N uptake of loblolly pine. Five fertilizer treatments (main plots) were applied at two
different seasons, spring versus summer (split plot) in mid-rotation loblolly pine plantations.
The fertilizer treatments were the main plots with a single replication of each treatment
combination (fertilizer source and season of application) at each individual site. The six sites
served as blocks and provided replication. The split plot was the application date (spring,
summer). The six sites were selected from an existing network of forest thinning and
J.E. Raymond
87
fertilization studies in mid-rotation loblolly pine plantations across the South (Figure 3.1).
Selected site characteristics are detailed in Table 3.1 and Table 3.2.
Twelve 100 m2 circular plots were installed at the six sites in early March 2011. At
each plot center were two co-dominant loblolly pine trees with similar height (HT) and
diameter (DBH). Six plots were used for the spring treatments and the other six plots were
used for the summer treatment. Prior to treatments, the DBH and HT were measured for all
trees within plots after installation but prior to treatment application.
3.2.2. Fertilizer Treatments
Five fertilizer treatments were applied at the two application times: 1) urea; 2) urea
impregnated with N-(n-Butyl) thiophosphoric triamide (NBPT); 3) urea impregnated with
NBPT and coated with monoammonium phosphate (CUF); 4) urea coated with a polymer
(PCU); and a 5) control treatment where no fertilizer N was added. Urea (46-0-0) was used
because it is the most commonly applied fertilizer N source used in southern forests (Fox et
al. 2007a). The enhanced efficiency fertilizers (EEFs) tested in this study were developed to
reduce NH3 volatilization and release N gradually to the environment. For the NBPT
treatment, urea (46-0-0) granules were impregnated with N-(N-butyl) thiophosphoric triamide
at 26.7% by weight to inhibit urease activity. For the CUF treatment (39-9-0), urea granules
were impregnated with NBPT and then coated with an aqueous boron and copper sulfate
binder solution to slow N release to the environment. A monoammonium phosphate coating
was then added for P. The PCU (44-0-0) treatment had polymer coatings covering urea
granules with pores in the coating to slowly release N (~80%) over 120 days. The application
rate for all treatments was 224 kg N ha-1. Because CUF contained P, P was added to the other
fertilizer treatment at the equivalent rate of 28 kg P ha-1 using triple superphosphate (TSP).
The urea used as the base for all treatments was enriched with the stable isotope 15N (~370‰,
J.E. Raymond
88
0.5 AP) (Nadelhoffer and Frye 1994). All fertilizer treatments were broadcast applied by
hand to the forest floor in individual 100m2 circular plots described above. Individual
fertilizer N treatments were applied to the individual 100m2 circular plots on a single day for
each application season at each individual site.
3.2.3. Experimental Method- Field Sampling
Foliage was sampled from the upper 1/3rd of the canopy from both central trees
immediately prior to individual fertilizer N treatment application and represented “week 0”.
The spring application date was from March 26 to April 8 2011, and the summer application
was from June 18 to June 30 2011. Sampling of foliage from the upper 1/3rd of the canopy
from both central trees for all individual plots occurred every 6 weeks after the fertilizer
treatments were applied until the dormant season. There were 6 sampling periods (week 0, 6,
12, 18, 24, 30) for spring fertilization and 4 sampling periods (week 0, 6, 12, 18) for summer
fertilization at each site. Foliage was separated by each successive individual vegetative
development over the growing season, termed flush, for each sampling period (Figure 3.2).
3.2.4. Experimental Method - Laboratory Processing
The foliage samples were oven dried in a forced air oven with a constant temperature
of 60°C for 7 days. After oven drying, 25 intact and undamaged foliar fascicles were
weighed. After weighing, the 25 fascicles from the sample were ground to a fine powder in a
ball mill (Retsch® Mixer Mill MM 200, Haan, Germany) for 1 minute at 25 revolutions per
second (rps). The ball mill was cleaned with an ethanol solution and allowed to dry to reduce
contamination after the processing of each sample. Two milligrams (+0.20) of ground foliage
were weighted on a Mettler-Toledo© MX5 microbalance (Mettler-Toledo, Inc., Columbus,
OH, USA) and placed in separate tin capsules. Samples were analyzed to determine the
J.E. Raymond
89
15N/14N isotope ratio and total N of the sample on a coupled elemental analysis-isotope ratio
mass spectrometer (IsoPrime 100 EA-IRMS, Isoprime© Ltd., Manchester, UK) at the Forest
Soils and Plant Nutrition Laboratory at Virginia Polytechnic Institute and State University.
3.2.5. Calculations
Individual fascicle N content was calculated by multiplying individual fascicle mass (g) by N
concentration (Equation 3.3). Individual fascicle fertilizer N content (Equation 3.1 to
Equations 3.5) was calculated using individual fascicle mass, N concentration, and 15N (‰)
(Powlson and Barraclough 1993, Nadelhoffer and Fry 1994, Nadelhoffer et al. 1995). The
uptake of N from sources existing in the system not originating from the fertilizer was
calculated in Equation 3.6.
[3.1] %Fertilizer N in individual fascicles: ((δ15Nfinal-δ15Ninitial)/(δ15Nlabeled-δ15Ninitial))*(100)
[3.2] %15N in individual fascicles from labeled treatment: ((δ15Ncomponent-δ15Npretreatment) /
(δ15Nfertlizer- δ15Npretreatment)) * (100)
[3.3] Total N (g) = (Individual fascicle dry weight * %N) / (100)
[3.4] Fertilizer N (g) in individual fascicle = (Total N * %15N from fertilizer) / (100) )
[3.5] %N originated from fertilizer in individual fascicle =
[(N originated from fertilizer (g) in individual fascicle) / (15N fertilizer (g) ) ] * (100)
[3.6] %N originated from native N sources in individual fascicle =
(Total N in individual fascicle) – (%N originated from fertilizer in individual fascicle)
3.2.6. Statistical Analysis
Individual fascicle mean mass, foliar N mean concentration, individual fascicle mean N
content, mean foliar 15N, and individual fascicle mean fertilizer N content was analyzed using
a repeated measure analysis of variance (ANOVA) using PROC MIXED in SAS® 9.4 (SAS
J.E. Raymond
90
Institute, Cary, NC). Several alternative spatial covariate structures were tested, and the
optimal structure was the unstructured (UN) covariate structure based on Akaike’s
Information Criteria (AIC). Individual fascicle mean mass, mean foliar N concentration,
individual fascicle mean N content, mean foliar 15N, and individual fascicle mean fertilizer N
content were the response variables for the model, sampling period (weeks 0, 6, 12, 18, 24,
30) and flush (0, 1, 2, 3) were repeated measures, fertilizer treatment (CUF, NBPT, PCU,
urea, control) and season (spring, summer) were fixed effects, and site (VA, ALN, AR, ALS,
SC, NC) was a random effect. (Littell et al. 2006). Levels of significance were set at α = 0.05
and the P > |t| values for the treatment means were tested using the SLICE function in PROC
MIXED. The post-hoc analysis used was Tukey’s HSD.
3.3. Results
3.3.1. Flush Development
As the growing season progressed, a larger number of flushes occurred in fertilized
plots compared to control plots after both the spring and summer fertilization (Table 3.3).
Twelve weeks after the spring fertilization, all fertilized treatments had developed a
2nd flush (flush 2) at all 6 study sites while the control treatment had a single site with a flush
2. At the end of the growing season, 30 weeks after the spring fertilizer application, all
fertilized plots had developed a 3rd flush (flush 3) at all 6 study sites while the control
treatment had a single study site with a flush 3.
A similar trend occurred following the summer fertilizer application (Table 3.3.) At
the end of the growing season, 18 weeks after the summer fertilizer application, fertilizer
treatments at three of the study sites had produced a flush 3 but only one site had produced a
flush 3 for the control treatment.
J.E. Raymond
91
3.3.2. Individual Fascicle Mass
Eighteen weeks after a spring fertilization and 6 weeks after a summer fertilization,
most individual fertilizer treatments had a greater mean individual fascicle mass (g)
compared to the control for flush 1 and flush 2 (Table 3.4). Differences did not exist for the
mean individual fascicle mass for flush 0 or flush 3 after either a spring or summer
fertilization.
After a spring fertilization, the mean individual fascicle mass (g) for flush 0 and flush
1 in week 6 and week 12 for the control ranged from 0.14 g to 0.19 g, compared to the range
of individual fertilizer treatments which ranged from 0.14 g to 0.21 g (ns). The mean
individual fascicle mass for flush 1 in week 18 for all fertilizer treatments was 0.24 g
compared to the 0.17 g for the control, and in flush 2 both CUF and urea (0.22 g) were
greater than the control (0.17 g). By week 24 the mean individual fascicle mass for flush 1
was greater for both CUF (0.25 g) and PCU (0.23 g) compared to the control (0.18 g) while in
flush 2 both CUF (0.21 g) and NBPT (0.21 g) were greater than the control (0.15 g). At the
end of the growing season the mean individual fascicle mass for flush 1 for CUF (0.23 g),
NBPT (0.25 g), PCU (0.24 g), and urea (0.24 g) was greater than the control (0.17 g), and in
flush 2 CUF (0.25 g), NBPT (0.22 g) and urea (0.23 g) were greater than the control (0.17 g)
while CUF was greater than PCU (0.19 g).
For the summer fertilization, mean individual fascicle mass (g) for flush 0 for all
sampling periods ranged from 0.18 g to 0.20 g for the control and 0.17 g to 0.24 g for all
individual fertilizer treatments (ns) (Table 3.4). The mean individual fascicle mass in week 6
for flush 1 and flush 2 was greater for NBPT (0.25 g, 0.23 g respectively), PCU (0.23 g, 0.20
g respectively), urea (0.24 g, 0.20 g respectively), and for CUF (0.22 g) only in flush 2,
compared to the control (0.20 g, 0.16 g respectively). In week 12, the mean individual
fascicle mass was greater for flush 1 and flush 2 for NBPT (0.23 g, 0.23 g respectively) and
J.E. Raymond
92
urea (0.24 g, 0.23 g respectively) compared to the control (0.18 g, 0.17 g respectively). By the
end of the growing season, mean individual fascicle mass for flush 1 was greater for CUF
(0.24 g), PCU (0.24 g) and urea (0.26 g) compared to the control (0.20 g), and both NBPT
(0.24 g) and urea (0.25 g) were greater than the control (0.18 g) in flush 2.
3.3.3. Foliar N Concentration
The mean foliar N concentration (g kg-1) increased slightly following both a spring
and summer fertilization for all individual fertilizer treatments compared to the control,
although most differences were not significant (ns) (Table 3.5; In Appendix: Figure A.3.1.,
Table A.3.1, Table A.3.3, Table A.3.5., Table A.3.8.).
Eighteen weeks after the spring fertilization, there was a significant increase in the
mean foliar N concentration of flush 2 between NBPT (16.0 g kg-1) and the control (11.4 g
kg-1). By week 30, the mean foliar N concentration of both NBPT (13.0 g kg-1) and urea (12.6
g kg-1) were greater than the control (8.6 g kg-1) in flush 0.
Twelve weeks after summer fertilizer application, urea (14.2 g kg-1) was greater than
the control (10.4 g kg-1) in flush 2. All other treatment differences for mean foliar N
concentrations for individual flushes during each sampling period were not significant (ns).
3.3.4. Individual Fascicle N Content
The mean individual fascicle N content (mg N fascicle-1) was greater for most
individual treatments compared to the control 18 weeks after a spring fertilization and 6
weeks after the summer fertilization (Table 3.6; In Appendix: Table A.3.6., Table A.3.9.).
After the spring fertilization, the mean individual fascicle N content (mg) for all
flushes in week 6 and week 12 ranged from 0.67 mg to 1.95 mg for the control compared to
1.43 mg to 2.38 mg for all individual fertilizer treatments (ns) (Table 3.6). There were no
J.E. Raymond
93
differences in mean individual fascicle N content in flush 0 among treatments for any
sampling period except in week 30 where NBPT (2.72 mg) was greater than the control (1.74
mg). By week 18, differences occurred between individual fertilizer treatments and the
control for the mean individual fascicle N content, where CUF (3.35 mg), NBPT (3.57 mg),
PCU (3.43 mg) and urea (3.44 mg) were greater than the control (1.93 mg) in flush 1, and
CUF (2.84 mg), NBPT (3.29 mg) and urea (3.08 mg) were greater than the control (1.82 mg)
in flush 2. In week 24, all individual fertilizer treatments were greater in flush 1 (range: 2.86
mg to 3.45 mg) and in flush 2 (range: 2.43 mg to 3.00 mg) than the control (2.02 mg, 1.59 mg
respectively). By week 30, all individual fertilizer treatments were greater than the control for
both flush 1 and flush 2, but NBPT (3.62 mg) was greater than CUF (2.72 mg) in flush 1 and
CUF (3.51 mg) was greater than PCU (2.75 mg) in flush 2.
For the summer fertilization, mean individual fascicle N content (mg) for flush 0 in
week 6 and week 12 was greater for NBPT (2.58 mg, 2.64 respectively) compared to the
control (1.99 mg, 1.98 mg respectively) (Table 3.6). Six weeks after the summer fertilization,
all fertilizer treatments had a greater mean individual fascicle N content in both flush 1
(range: 2.94 mg to 3.45 mg) and flush 2 (range: 2.39 mg to 3.11 mg) than the control (2.25
mg, 1.78 mg respectively), and both CUF (2.98 mg) and NBPT (3.11 mg) were greater than
PCU (2.39 mg) in flush 2. By week 12, all fertilizer treatments were greater in flush 1 (range:
2.68 mg to 3.26 mg) and flush 2 (range: 2.71 mg to 3.23 mg) than the control (1.77 mg, 1.18
mg respectively) with no differences among individual treatments. At the end of the growing
season, CUF (3.19 mg) and urea (3.46 mg) were greater than the control (2.15 mg) in flush 1,
all fertilizer treatments were greater in flush 2 (range: 2.46 mg to 3.46 mg) than the control
(2.11 mg), and both PCU (2.78 mg) and urea (3.46 mg) greater than CUF (2.46 mg) in flush
2.
J.E. Raymond
94
3.3.5. Foliar 15N
The mean foliar 15N (‰) was different for most fertilizer treatments for flush 0 and
flush 1, and all fertilizer treatments for flush 2, compared to the control for all sampling
periods after a spring fertilization (Table 3.7). After the summer fertilization, all individual
fertilizer treatments were different compared to the control for all flushes during each
sampling period beginning 12 weeks after a summer fertilization (Table 3.7; In Appendix
Figure A.3.2., Table A.3.2., Table A.3.4., Table A.3.5., Table A.3.8.).
Across the entire growing season after a spring fertilization, the control mean foliar
15N ranged from -3.43‰ to -1.56‰ for all flushes (Table 3.7). There were differences in
flush 0 between the control and CUF (58.8‰) in week 12, in week 18 and week 24 between
the control (-3.43‰, -3.38‰ respectively) and CUF (69.9‰, 56.7‰ respectively), NBPT
(57.7‰. 56.3‰ respectively) and urea (60.4‰, 65.9‰ respectively), and the control (-
2.50‰) and all individual fertilizer treatments (range: 53.5‰ to 80.1‰) by week 30. In week
6 and week 12, only PCU (17.8‰, 40.9‰ respectively) was not different from the control in
flush 1. After 18 weeks, mean foliar 15N (‰) of all individual fertilizer treatments for flushes
1, 2, and 3 ranged 73.8‰ to 134.2‰.
Six weeks after the summer fertilization there were differences in the mean foliar 15N
(‰) between the control (-2.90‰ to -2.10‰) and all fertilizer treatments (range: 52.1‰ to
72.8‰) except in flush 1 and flush 2 for PCU (22.9‰, 28.6‰ respectively). Twelve weeks
after the summer fertilization, there were differences between the control (range: -3.04‰ to -
2.55‰) and all individual fertilizer treatments (range: 40.5‰ to 102.6‰).
3.3.6. Individual Fascicle Fertilizer N Content
The mean individual fascicle fertilizer N content (mg N fascicle-1) generally increased
in all flushes across the entire growing season for all individual fertilizer treatments after both
J.E. Raymond
95
the spring and summer fertilization (Table 3.8; In Appendix Table A.3.6., Table A.3.9.).
Because no fertilizer was applied to the control treatment, the value for all flushes for all
sampling periods was 0.00 mg of fertilizer N.
Six weeks after the spring fertilization, the mean individual fascicle fertilizer N
content of flush 0 for all treatments ranged from 0.00 mg to 0.19 mg (Table 3.8). In flush 1 of
week 6, CUF (0.29 mg), NBPT (0.57 mg) and urea (0.33 mg) were greater than both the
control and PCU (0.07 mg), and NBPT was greater than both CUF and urea. In week 12,
CUF (0.25 mg) was greater than PCU (0.11 mg) in flush 0, while both NBPT (0.43 mg) and
urea (0.39 mg) were greater than PCU (0.11 mg) in flush 1. In week 18 no differences
occurred among individual fertilizer treatments for any flush, and mean individual fascicle
fertilizer N content ranged from 0.25 mg to 0.90 mg. By week 24, the mean individual
fascicle fertilizer N content for NBPT (0.87 mg) was greater than PCU (0.49 mg) in flush 2.
At the end of the growing season NBPT (0.84 mg) was greater than PCU (0.54 mg) in flush
1, with no other differences among individual fertilizer treatments for mean individual
fascicle fertilizer N content.
After the summer fertilization, the mean individual fascicle fertilizer N content for
individual fertilizer treatments increased for all flushes for all sampling periods until the end
of the growing season (Table 3.8). In week 6 for flush 2, CUF, NBPT and urea (range: 0.44
mg to 0.50 mg) were greater than PCU (0.16 mg). In week 12, the mean individual fascicle
fertilizer N content increased for all treatments and ranged from 0.21 mg to 0.78 mg in
flushes 0, 1, and 2. Both NBPT (0.78 mg) and urea (0.65 mg) also had greater mean
individual fascicle fertilizer N content than both CUF (0.45 mg) and PCU (0.43 mg) in flush
2 of week 12. By week 30, the mean individual fascicle fertilizer N content was greater for
urea (0.65 mg) than CUF (0.32 mg), NBPT (0.35 mg) and PCU (0.19 mg) in flush 0. The
mean individual fascicle fertilizer N content for both urea (0.57 mg) and CUF (0.54 mg) were
J.E. Raymond
96
greater than PCU (0.33) in flush 1, and in flush 2 CUF (0.58 mg), NBPT (0.74 mg) and urea
(0.70 mg) were all greater than PCU (0.40 mg).
3.3.7. Cumulative Individual Fascicle N Content
The cumulative individual fascicle N content (N mg fascicle-1) increased for all
treatments across the growing season, with differences between all individual fertilizer
treatments and the control occurring by week 18 after the spring fertilization and week 6 after
a summer fertilization (Figure 3.3; In Appendix Table A.3.6., Table A.3.9.).
After the spring fertilization, the cumulative individual fascicle foliar N content was
similar in week 6 and week 12 between the control (3.34 mg, 4.11 mg respectively) and all
individual fertilizer treatments (range: 4.17 mg to 4.88 mg, 4.11 mg to 5.07 mg respectively)
(Figure 3.3). By week 18 the cumulative individual fascicle foliar N content for all individual
fertilizer treatments (range: 8.04 mg to 9.33 mg) was greater than the control (5.77 mg).
Differences for the cumulative individual fascicle foliar N content continued through the
remainder of the growing season with individual fertilizer treatments (range: 10.50 mg to
12.48 mg) consistently greater than the control (range: 7.47 mg to 7.54 mg).
For the summer fertilization, with the cumulative individual fascicle foliar N content
for all individual fertilizer treatments (range: 7.86 mg to 9.14 mg) was greater compared to
the control (6.02 mg) 6 weeks after fertilization. By week 12, the cumulative individual
fascicle foliar N content for individual fertilizer treatments increased to a range of 9.65 mg to
11.48 mg compared to 5.93 mg for the control which decreased from the previous sampling
period. By the end of the growing season, the cumulative individual fascicle foliar N content
of the control had increased to 8.52 mg but was still lower compared to all individual
fertilizer treatments (range: 10.19 mg to 12.95 mg).
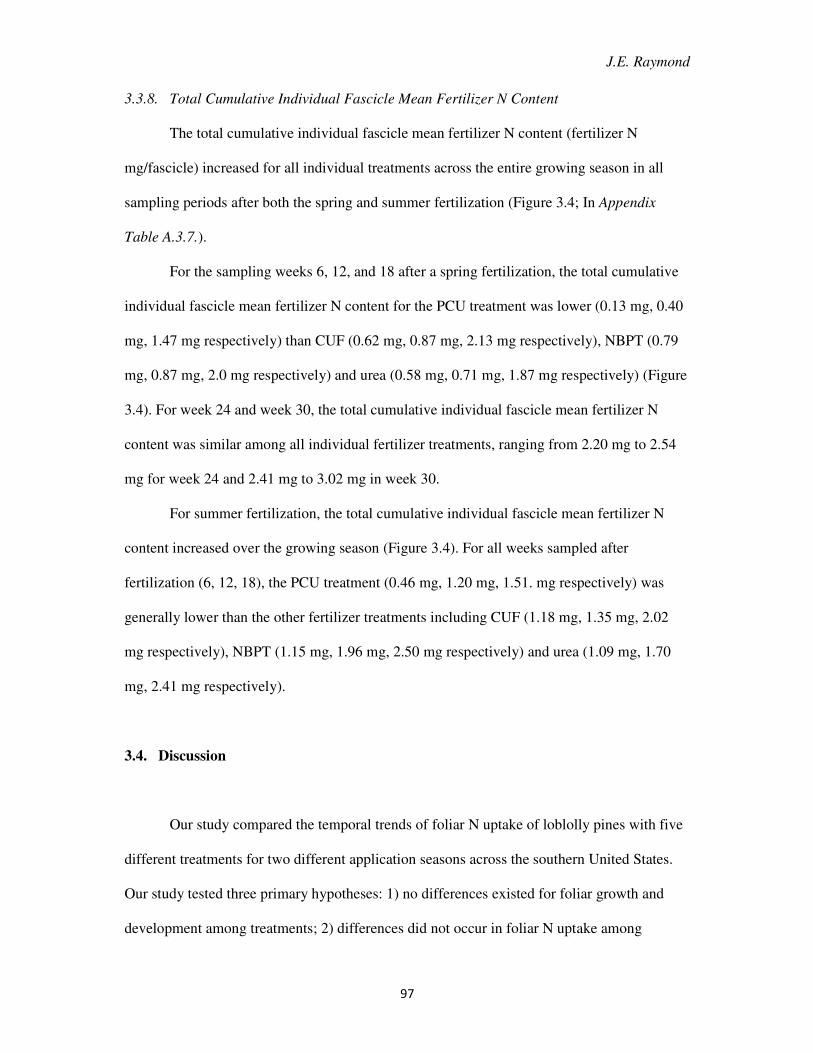
J.E. Raymond
97
3.3.8. Total Cumulative Individual Fascicle Mean Fertilizer N Content
The total cumulative individual fascicle mean fertilizer N content (fertilizer N
mg/fascicle) increased for all individual treatments across the entire growing season in all
sampling periods after both the spring and summer fertilization (Figure 3.4; In Appendix
Table A.3.7.).
For the sampling weeks 6, 12, and 18 after a spring fertilization, the total cumulative
individual fascicle mean fertilizer N content for the PCU treatment was lower (0.13 mg, 0.40
mg, 1.47 mg respectively) than CUF (0.62 mg, 0.87 mg, 2.13 mg respectively), NBPT (0.79
mg, 0.87 mg, 2.0 mg respectively) and urea (0.58 mg, 0.71 mg, 1.87 mg respectively) (Figure
3.4). For week 24 and week 30, the total cumulative individual fascicle mean fertilizer N
content was similar among all individual fertilizer treatments, ranging from 2.20 mg to 2.54
mg for week 24 and 2.41 mg to 3.02 mg in week 30.
For summer fertilization, the total cumulative individual fascicle mean fertilizer N
content increased over the growing season (Figure 3.4). For all weeks sampled after
fertilization (6, 12, 18), the PCU treatment (0.46 mg, 1.20 mg, 1.51. mg respectively) was
generally lower than the other fertilizer treatments including CUF (1.18 mg, 1.35 mg, 2.02
mg respectively), NBPT (1.15 mg, 1.96 mg, 2.50 mg respectively) and urea (1.09 mg, 1.70
mg, 2.41 mg respectively).
3.4. Discussion
Our study compared the temporal trends of foliar N uptake of loblolly pines with five
different treatments for two different application seasons across the southern United States.
Our study tested three primary hypotheses: 1) no differences existed for foliar growth and
development among treatments; 2) differences did not occur in foliar N uptake among
J.E. Raymond
98
treatments; and 3) that there were no differences in foliar fertilizer N uptake among fertilizer
treatments.
Our first hypothesis that differences did not exist in foliar growth and development
among treatments (control, CUF, NBPT, PCU, urea) was rejected. Differences in foliar
growth, assessed by differences in the development and frequency of flushes and individual
fascicle mass, occurred for all individual fertilizer treatments compared to the control after
both a spring and summer fertilization. Loblolly pine shoot and foliar development, termed
flushes or cohorts (Figure 3.2), are episodic growth events that increase in frequency under
favorable conditions (Miller 1966, Shultz 1997). The first flush of the growing season, flush
1, generally has the largest shoot elongation, individual fascicle mass, needle length and
foliar N of any flush during the growing season (Griffing and Elam 1971, Boyer and South
1989, Zhang et al. 1997). Improving soil nutrition through the application of N + P fertilizers
generally increases flush development and individual fascicle mass (Adams and Allen 1985,
Valentine and Allen 1990, Zhang et al. 1997, Albaugh et al. 1998, 2004, Tang et al. 1999,
Carlson et al. 2014) for loblolly pines.
In our study, fertilizer treatments increased the frequency and development of both
flushes and individual fascicle mass when compared to the control, although differences
among treatments were difficult to distinguish. For the spring fertilization, all fertilizer plots
at all research sites developed a 3rd flush, compared to one control plot at one site in SC. The
SC site was one of the more productive sites in this study due to high amounts of
decomposing soil organic matter and this site is likely not N limited. Additionally, flush
development in this study was more rapid over the growing season compared to the control.
Although an increase in flushes after the summer fertilization also occurred, differences in
flush frequency were not as great as with the spring fertilization. For the summer fertilization,
only the control site at SC had developed a 3rd flush. Additional flushes and increased
J.E. Raymond
99
cumulative foliar mass in the fertilized plots leads to expansion of leaf area (Miller 1981,
Vose and Allen 1988, Albaugh et al. 1998, Fox et al. 2007a) increases light interception, and
directly improves stand productivity (Russell et al. 1989, Cannell 1989).
Our second hypothesis that foliar N uptake among treatments did not differ was also
rejected. Although foliar N concentrations were generally not significantly different between
the control and individual fertilizer treatments for the spring or summer fertilization, there
was an increasing trend for all fertilizer treatments compared to the control through the
growing season and is similar to the findings of others (Switzer et al. 1966, Wells et al. 1975,
Zhang and Allen 1996, Albaugh et al. 1998, Gough et al. 2004, Carlson et al. 2014).
Significant differences in foliar N concentration can be muted due to dilution effects from
increased biomass production in fertilized plots (Jose et al. 2003) but can be accounted for
through calculating the individual fascicle N content. Once individual fascicle N content was
calculated, there were significant differences between most fertilizer treatments and the
control and was similar to the findings of others (Smith et al. 1970, 1971, Switzer et al. 1972,
Murthy et al. 1996, Albaugh et al. 2004, Choi et al. 2005, Carlson et al. 2014). Additionally,
more cumulative individual fascicle N uptake occurred with all fertilizer treatments compared
to unfertilized treatments.
One additional point is the foliar N concentrations in flush 0 (foliage produced in the
previous growing season) for the control was consistently low and gradually decreased
through the growing season for both spring and summer sampling compared to fertilized
treatments, indicating retranslocation of N prior to senescence. Photosynthesis is greatly
reduced when foliar N concentrations go below 0.8% (Gough et al. 2004), a value approached
for in flush 0 of the control treatments. Conversely, the flush 0 for all individual fertilizer
treatments remained at or significantly above 1.00% for the entire growing season for both
the spring and summer fertilization. This finding indicates a potential for flush 0 to extend
J.E. Raymond
100
photosynthesis for a period of time near the end of the growing season for fertilized sites,
possibly increasing productivity.
The third hypothesis that the foliar fertilizer N uptake was the same among individual
fertilizer N treatments was also rejected. Using N containing fertilizers enriched with the
stable isotope 15N can improve the understanding of the fate of applied N in forest systems
and distinguish fertilizer N uptake in trees compared to the uptake of the N natural existing in
the system (Walker 1958, Pritchett and Smith 1972, Nadelhoffer and Fry 1994, Templar et al.
2012). Our study found consistent increases in the foliar 15N (‰) signature for all fertilizer
treatments across the entire growing season after both a spring and summer fertilization
which continued across the entire growing season for all fertilizer N treatments. There were
also slight differences among fertilizer treatments for certain sampling weeks following both
a spring and summer fertilization. Specifically, CUF, NBPT and urea all had greater foliar
15N values compared to both the control and PCU earlier in the sampling period, although the
differences between foliar 15N values among all fertilizer treatments generally dissipated near
the middle of the growing season. One explanation for this finding relates to the release
mechanisms and patterns for of each fertilizer treatment.
The EEF treatments used in this study had inhibitors, coatings or a combination to
reduce fertilizer N losses through ammonia (NH3) volatilization and provide a more gradual,
constant release of fertilizer N over the growing season (Hauck 1985, Goertz 1993, Azeem et
al. 2014, Havlin et al. 2014). Large fertilizer N losses can occur via the ammonia (NH3)
volatilization pathway immediately following urea fertilization, with losses highly dependent
on the interaction of environmental and edaphic factors (Cabrera et al. 2005, Zerpa and Fox
2011, Elliot and Fox 2014, Raymond et al. 2016). Coatings or chemical additives applied to
fertilizer N (urea) may require degradation that are dependent on the interaction of weather
and edaphic factors prior to the fertilizer N becoming plant available, creating a lag period
J.E. Raymond
101
between fertilizer N application and plant N availability. This release lag extends the period
when fertilizer N is plant available further into the growing season compared to urea,
providing a potentially more synchronous N supply to plant N demand.
Urea, the most commonly applied form of fertilizer N in southern forestry due to its
lowest expense per unit N (Allen 1987, Fox et al. 2007a), rapidly degrades (urea dissolution)
after application and provides N immediately to plants and soil microbes (Hauck and
Bremner 1965). Both urea and urea treated with NBPT likely had the quickest fertilizer N
release because there were no coatings to degrade. Evidence is provided in this study where
certain flushes for both urea and NBPT have significantly greater individual fascicle mean
fertilizer N compared to CUF, but more frequently with PCU. The CUF treatment had urea
granules impregnated with NBPT to reduce urease activity with an exterior water soluble
coating requiring degradation prior to fertilizer N release to the environment. The combined
technologies in CUF assist in reducing NH3 volatilization compared to urea (Raymond et al.
2016) and provide a more gradual release of fertilizer N to the environment. A lag in fertilizer
N release for CUF is supported in this study by the foliar 15N data where CUF, specifically
earlier in the growing season for certain flushes, had lower foliar 15N values compared to both
NBPT and urea. Yet most of these differences disappeared as the growing season progressed.
Research in agriculture systems has shown it can take 2 days to 21 days for complete
hydrolysis of soluble fertilizers (NBPT, CUF and urea) and is highly dependent on
environmental variables during this period such as relative humidity, precipitation, and
temperature (Gould et al. 1973, Bayrakli 1990, Shaviv 1996, Azeem et al. 2014, Havlin et al.
2014).
Conversely, the PCU technology is a semi-permeable coating surrounding urea
granules which requires water to enter the granule, urea dissolution to occur, and a threshold
internal pressure in the granule to force the fertilizer N in solution out of the granule and into
J.E. Raymond
102
the environment. This technology likely provides the most extended, gradual release of
fertilizer N to the environment with estimates of fertilizer N release ranging from 3 months to
6 months, or potentially longer, and dependent primarily on moisture and temperature
(Shaviv 1996, Azeem 2014). Foliar 15N data from this study again supports this statement,
with PCU generally having the lowest foliar 15N values compared to all other individual
treatments early in the growing season.
Although fertilizer release patterns have been shown to be generally dependent on a
complex interaction of environmental variables in agriculture, less is known about release
patterns of EEFs and how this translates to fertilizer N uptake for trees in forested systems.
One of the few studies examining EEF release patterns in loblolly pine plantation systems for
these same products is by Werner (2013). Werner (2013) observed an increase in NH4+ using
ion exchange resins (IER) 14 days after a fall application for CUF, NBPT and urea with no
differences among these treatments, compared to an increase in NH4+ for PCU at 49 days
after application. Werner (2013) also found a higher percentage of labeled 15N fertilizer in
certain components of the tree for CUF, NBPT and urea when compared to PCU, indicating a
correlation between release patterns and fertilizer N uptake by loblolly pines. Results from
our study indicate similar trends for the respective fertilizer treatments for both a spring and
summer fertilizer application. Few differences occurred among fertilizer treatments early in
the growing season, these differences gradually fade. Additional research will be needed to
understand release patterns in forested systems, and how much of these products remain in
the soil to extend potential plant N availability for successive growing seasons.
A final point of this research is the overall foliar N uptake of the loblolly pines.
Although it is evident that fertilizer N additions increase overall foliar N uptake, it does not
account for all of the additional foliar N uptake. If fertilizer N uptake had accounted for all
the additional N in the foliage for the fertilizer treatments, the sum of the cumulative fertilizer
J.E. Raymond
103
N for individual treatments in fascicles and the control (unfertilized) individual fascicle N
would equal the cumulative individual fascicle N content for each fertilizer treatment- but this
did not occur. For example, at the end of the growing season the individual fascicle mean
fertilizer N content was approximately 3.00 mg (CUF = 2.78 mg, NBPT = 3.02 mg, PCU =
2.41 mg, urea = 2.98 mg). Yet when the cumulative individual fascicle N content for the
control plot (7.47 mg) is added to individual fascicle mean fertilizer N content values for the
individual fertilizer treatments, there is a discrepancy of approximately 2.50 mg (CUF =
12.26 mg, NBPT = 12.48 mg, PCU = 11.48 mg) for the EEFs and less than 0.50 mg for urea
(10.77 mg). Additional research will be required to understand the mechanisms behind this
process, but one hypothesis is that the enhanced efficiency fertilizers specifically retain more
fertilizer N in the soil compared to urea (Raymond et al. 2016). This would translate to an
increase in fertilizer N availability to the loblolly pines and also an increase in the availability
of naturally existing N.
Fertilization research in southern loblolly pine plantations has improved the
productivity of these systems (Albaugh et al. 1998, Vogel and Jokela 2011, Carlson et al.
2014), but understanding mechanisms that quantify the proportion of fertilizer N taken up by
loblolly pines is generally hampered by the inability to distinguish the origins of natural
versus fertilizer N. Fertilizer use efficiency is usually assessed through ecosystem
productivity metrics such as foliar N concentrations, foliar nutrient ratios, diameter and
height measurements, leaf area index, root to shoot ratios, or various other metrics. By using
fertilizers enriched with the stable isotope 15N, this research has been able to improve the
understanding of plant uptake and integrate processes, mechanisms and pathways of the
fertilizer N cycle in southern loblolly pine plantations.
This research has refined the understanding of foliar N uptake over the course of a
growing season after a spring and summer N application in mid-rotation loblolly pines
J.E. Raymond
104
through the use of fertilizers enriched with the stable isotopes 15N. Representative sites were
chosen across an extensive geographic region where loblolly pine plantations are
operationally fertilized and intensively managed to integrate the range of climatic and
edaphic variables occurring in the southern United States. The synthesis of significant factors
from this study help support and add to the knowledge obtained from the numerous other
studies in forest ecosystems focused on smaller regions. The results from this study will
continue to improve our ability to assess loblolly pine fertilizer N response through the
refinement of fertilizer use efficiency for these high production systems.
3.5. Conclusions
The primary results from this research specific to loblolly pines were: 1) significantly
more foliar growth occurs at a faster rate after N fertilization; 2) N fertilization increases N
uptake in all stages of foliar development, including older foliage, which increases the N
concentration of individual fascicles and increases photosynthetic potential of older foliage;
and 3) significantly more foliar N uptake occurs after N fertilization of both fertilizer and
naturally existing N. In a companion study, Raymond et al. (2016) found NH3 volatilization
was reduced with the same EEFs used in this study to assess foliar N uptake. Additional
research will be required to determine if the additional fertilizer N remaining in the soil from
the EEFs will translate into additional plant available N in successive seasons and continue to
increase fertilizer N use efficiency. Results from this research can be applied through the
southern United States where mid-rotation loblolly pine are intensively managed and should
assist in improving forest managers goals of increasing N use efficiency to increase
productivity.
105
Acknowledgments
This research was primarily supported by the Forest Productivity Cooperative (FPC), the
National Science Foundation Center for Advanced Forest Systems (CAFS) and the United
States Department of Agriculture National Institute of Food and Agriculture McIntire-Stennis
Capacity Grant. We thank David Mitchem for assistance in the laboratory, Andy Laviner for
field assistance and the numerous work study and seasonal student employees for both field
and laboratory assistance.
106
Literature Cited AAPFCO. 2011. Association of American Plant Food Control Officials. Accessed
11/10/2015. http://www.aapfco.org/index.html. Adams, M.B., and H.L. Allen. 1985. Nutrient proportions in foliage of semi-mature loblolly
pine. Plant and Soil. 86(1):27-34. Addoms, R.M. 1937. Nutritional studies on loblolly pine. Plant Physiol. 12(1): 199–205. Albaugh, T.J., H.L. Allen, P.M. Dougherty, L.W. Kress, and J.S. King. 1998. Leaf area and
above- and belowground growth response of loblolly pine to nutrient and water additions. For. Sci. 44:317-328.
Albaugh, T.J., H. L. Allen, P. M. Dougherty, and K. H. Johnsen. 2004. Long term growth
responses of loblolly pine to optimal nutrient and water resource availability. For. Ecol. Manage. 192:3-19.
Albaugh, T.J., L.C. Kiser, T.R. Fox, H.L. Allen, R.A. Rubilar, and J.L. Stape. 2014.
Ecosystem nutrient retention after fertilization of Pinus taeda. For. Sci. 60(6):1131-1139. http://dx.doi.org/10.5849/forsci.13-159
Allen, S.E. 1984. Slow-release nitrogen fertilizers. In Nitrogen in crop production. Ed. R.D.
Hauck. American Society of Agronomy. Madison, WI. pp. 195-206. Allen, H.L. 1987. Forest fertilizers: nutrient amendment, and productivity, and environmental
impact. Journal of Forestry. 85: 37-46 Amateis, R. L., J. Liu, M. J. Ducey and H. L. Allen. 2000. Modeling response to midrotation
nitrogen and phosphorus fertilization in loblolly pine plantations. South. J. Appl. For. 24:207-212.
Amponsah, I.G., V.J. Lieffers, P.G. Comeau, S.M. Landha, and S.M. Landhäusser. 2004.
Nitrogen-15 Uptake by Pinus contorta seedlings in relation to phonological stage and season. Scand. J. For. Res. 19:329-338.
Aust, W.M, and C.R. Blinn. 2004. Forestry Best Management Practices for timber harvesting
and site preparation in the eastern United States: an overview of water quality and productivity research during the past 20 years (1982-2002). Water, Air, & Soil Pollution: Focus. 4:5-36.
Azeem, B., K. KuShaari, Z.B. Man, A. Basit, and T.H. Thanh. 2014. Review on materials &
methods to produce controlled release coated urea fertilizer. Journal of Controlled Release. 181: 11–21.
Ballard, R. 1984. Fertilization of plantations. In Nutrition of plantation forests. (Eds) G.D.
Bowen and E.K.S. Nambiar. Academic, London, pp 327–360.
J.E. Raymond
107
Barron-Gafford, G.A., R.E. Will, E.C. Burkes, B. Shiver, R.O. Teske. 2003. Nutrient concentrations and contents, and their relation to stem growth, of intensively managed Pinus taeda and Pinus elliottii stands of different planting densities. For. Sci. 49(2):291-300.
Bayrakli, F. 1990. Ammonia volatilization losses from different fertilizers and effect of
several urease inhibitors, CaCl2 and phosphogypsum on losses from urea. Fert. Res. 23:147–150. doi:10.1007/BF01073430.
Binkley, D., and S.C. Hart. 1989. The components of nitrogen availability assessments in
forest soils. Adv. Soil Sci. 10:57–112. Binkley, D., R. Carter, H.L. Allen. 1995. Nitrogen fertilization practices in forestry. In: P.
Bacon (Ed.). Nitrogen fertilization and the environment. Marcel Dekker. New York. p. 421-441.
Birk, E.M., and P.M. Vitousek. 1986. Nitrogen availability and nitrogen use efficiency in
loblolly pine stands. Ecology. 67(1):69-79. Bowen, G.D., and E. K. S. Nambiar (Eds.). 1984. Nutrition of plantation forests. Academic
press, London, England.
Boyer, J.N., and D.B. South. 1989. Seasonal changes in intensity of bud dormancy in loblolly pine seedlings. Tree Physiology. 5(3):379-385.
Bubb, K.A., Z.H. Xu, J.A. Simpson, and P.G. Saffingna. 1999. Growth response to
fertilization and recovery of l5N-labelled fertiliser by young hoop pine plantations of subtropical Australia. Nutrient Cycling in Agroecosystems 54:81-92.
Cabrera, M.L., D.E. Kissel, N. Vaio, J. R. Craig, J.A. Rema, and L.A. Morris. 2005. Loblolly
pine needles retain urea fertilizer that can be lost as ammonia. Soil Sci. Soc. Am. J. 69(5):1525-1531.
Cannell, M.G.R. 1989. Physiological basis of wood production: A review. Scand. J. For. Res.
4(1-4):459-490. Carlson, C. A., T.R. Fox, H.L. Allen, T.J. Albaugh, R.A. Rubilar, and J.L. Stape. 2014.
Growth responses of loblolly pine in the southeast united states to midrotation applications of nitrogen, phosphorus, potassium, and micronutrients. For. Sci. 60(1):157-169.
Carter, R. 1992. Diagnosis and interpretation of forest stand nutrient status. In Forest
fertilization: sustaining and improving nutrition and growth of western forests. (Eds.) H.N. Chappel, G.F. Weetman, R.E. Miller. Institute of Forest Resources, No. 73. University of Washington, Seattle, pp. 90-97.
Chang, S. X., C.M. Preston, K. McCullough, G. Weetman, and J. Barker. 1996. Effect of
understory competition on distribution and recovery of 15N applied to a western red cedar - western hemlock clear-cut site. Can. J. For. Res. 26:313-321.
J.E. Raymond
108
Chien, S.H., L. I. Prochnow, and H. Cantarella. 2009. Recent developments of fertilizer production and use to improve nutrient efficiency and minimize environmental impacts. In Advances in Agronomy. 102. Elsevier Inc. pp. 267-322. DOI: 10.1016/S0065-2113(09)0.
Choi, W.J., S.X. Chang, H.L. Allen, D.L. Kelting, H.M Ro. 2005. Irrigation and fertilization
effects on foliar and soil carbon and nitrogen isotope ratios in a loblolly pine stand. For Ecol Man. 213:90–101.
Currie, W.S., and K.J. Nadelhoffer. 1999. Dynamic redistribution of isotopically labeled
cohorts of nitrogen inputs in two temperate forests. Ecosystems. 2:4-18. Dawson, T.E., S. Mambelli, A.H. Plamboeck, P.H. Templer, and K.P. TuSource. 2002. Stable
isotopes in plant ecology. Ann. Rev. Ecol. System. 33:507-559. Dinkelmeyer, H., J. Lehmann, A. Renck, L. Trujillo, J. Pereira da Silva Jr., G. Gebauer, and
K. Kaiser. 2003. Nitrogen uptake from 15N-enriched fertilizer by four tree crops in an Amazonian agroforest. Agrofor. Syst. 57:213-224.
Fertilizer Institute. Accessed 11/10/2015.
https://www.tfi.org/introduction-fertilizer/nutrient-science/enhanced-efficiency-fertilizers.
Fox, T.R., E.J. Jokela, and H.L. Allen. 2007a. The development of pine plantation silviculture
in the southern United States. J. For. 105(5):337-347. Fox, T.R. H. L. Allen, T. J. Albaugh, R. Rubilar, and C.A. Carlson. 2007b. Tree nutrition and
forest fertilization of pine plantations in the southern United States. South. J. Appl. For. 31(1): 5-11.
Goertz, H.M. 1993. Controlled Release Technology. Kirk-Othmer Encyclopedia of Chemical
Technology, Vol.7 Controlled Release Technology (Agricultural), pp. 251-274. Gould, W.D., F.D. Cook, and R.G. Webster. 1973. Factors affecting urea hydrolysis in
several Alberta soils. Plant Soil 38(2):393–401. Gough, C.M., J.R. Seiler, and C.A. Maier. 2004. Short-term effects of fertilization on loblolly
pine (Pinus taeda L.) physiology. Plant, Cell and Environment. 27:876-886. Griffing, C.G., and W.W. Elam. 1971. Height growth patterns of loblolly pine saplings.
For. Sci. 17(1):52-54. Haase, D.L., and Rose, R. 1995. Vector analysis and its use for interpreting plant nutrient
shifts in response to silvicultural treatments. For. Sci. 41:1:54-56. Hauck, R.D., and H.F. Stephenson. 1965. Nitrification of nitrogen fertilizers. Effect of
nitrogen source, size, and pH of the granule, and concentration. J. Agr. Food Chem. 13(6):486-492.
J.E. Raymond
109
Hauck, R.D. 1968. Nitrogen source requirements in different soil-plant systems. p. 47-57. In Forest fertilization: theory and practice. Muscle Shoals, Alabama: TVA National Fertilizer Development Center.
Hauck, R.D., and M. Bystrom. 1971. 15N- A selected bibliography for agricultural scientists.
The Iowa State University Press, Ames, Iowa. p. 206. Hauck, R.D. 1985. Slow release and bio-inhibitor-amended nitrogen fertilizers. In: Fertilizer
technology and use. O.P. Engelstad (ed.) 3rd Ed. pp. 293-322. Havlin, J.L., S.L. Tisdale, W.L. Nelson, J.D. Beaton. 2014. Soil fertility and fertilizers- an
introduction to nutrient management. 8th Ed. Pearson. Boston, MA. p. 516. Hobbs, C.H. 1944. Studies on mineral deficiency in pine. Plant Physiol. 19(4):590-602. Hockman, J.N., and H.L. Allen. 1990. Nutritional diagnoses in loblolly pine stands using a
DRIS approach. In: Gessel, S.P et. al. (eds.). Sustained productivity of forest soils. Procedings of the 7th N. American Forest Soils Conference. University of B.C., Faculty of Forestry Publication. Vancouver, B.C. 525 p.
Johnson, D.W., and D.E. Todd. 1988. Nitrogen fertilization of young yellow poplar and
loblolly pine plantations at differing frequencies. Soil Sci. Soc. Am. J. 52(5):1468 –1477.
Jokela, E.J. and A.J. Long. 2000. Using soils to guide fertilizer requirements for southern
pines. Circular No. 1230. Florida Cooperative Extension Service, Institute of Food and Agricultural Sciences, University of Fla.
Jose, S., S. Merritt, and C.L. Ramsey. 2003. Growth, nutrition, photosynthesis and
transpiration responses of longleaf pine seedlings to light, water and nitrogen. For. Ecol. Manage. 180: 335-344.
Linder, S. 1987. Responses to water and nutrients in coniferous ecosystems. pp. 180–202 in
Potentials and limitations of ecosystems analysis. Ecol. Studies 61, Schulze, E.D., and H.Z. Wolfer (eds.). Springer-Verlag, New York.
Littell, R.C., G.A. Milliken, W.W. Stroup, R.D. Wolfinger, and O. Schabenberger. 2006.
SAS for Mixed Models, 2nd ed., SAS Institute Inc, Cary NC. Littke, K.M., R.B. Harrison, D. Zabowski, D.G. Briggs, and D.A. Maguire. 2014. Effects of
geoclimatic factors on soil water, nitrogen, and foliar properties of Douglas-fir plantations in the Pacific Northwest. For. Sci. 60(6): 1118-1130. doi: http://dx.doi.org/10.5849/forsci.13-141.
Martin, S.W., R.L. Bailey, and E.J. Jokela. 1999. Growth and yield predictions for lower
Coastal Plain slash pine plantations fertilized at mid-rotation. South. J. Appl. For. 23:39-45.
Mead, D.J., and W. L. Pritchett. 1975. Fertilizer movement in a slash pine ecosystem. 1.
Uptake of N and P and N movement in the soil. Plant Soil 43:451-465.
J.E. Raymond
110
Mead, D.J., Chang, S.X. and Preston, C.M. 2008. Recovery of 15N-urea 10 years after application to a Douglas-fir pole stand in coastal British Columbia. For. Ecol. Man. 256:694-701.
Meeks, A.L. 2015. Understory competing vegetation characterization and assessment in mid-
rotation loblolly pine (Pinus taeda L.) stands at the Hofmann Forest, N.C. Ph.D. Dissertation. pp. 125.
Melin J., H. NÔmmik, U. Lohm, and J. Flower-Ellis J. 1983. Fertilizer nitrogen budget in a
Scots pine ecosystem attained by using root-isolated plots and 15N tracer technique. Plant Soil 74:249–263.
Miller, WF. 1966. Annual changes in foliar nitrogen, phosphorus, and potassium levels of
loblolly pine with site, and weather factors. Plant and Soil 24(3):369-378. Miller, H.G. 1981. Forest fertilization: Some guiding concepts. Forestry. 54(2):157-157. Morrison, I.K. 1974. Mineral nutrition of conifers with special reference to nutrient status
interpretation: a review of literature. Canadian Forest Service, Department of the Environment. Pub. No. 1343. pp. 74.
Murthy, R., P.M. Dougherty, S.J. Zarnoch, and H.L. Allen. 1996. Effects of carbon dioxide,
fertilization, and irrigation on photosynthetic capacity of loblolly pine trees. Tree Physiol. 16:537-546.
Nadelhoffer, K.J., B.P. Colman, W.S. Currie, A. Magill, and J.D. Aber. 2004. Decadal-scale
fates of 15N tracers added to oak and pine stands under ambient and elevated N inputs at the Harvard Forest (USA). For. Ecol. Manage. 196:89-107.
Nadelhoffer, K.J. and B. Fry. 1994. Nitrogen isotope studies in forest ecosystems. p. 22-44.
In K. Lajtha and R.H. Michener (ed.). Stable Isotopes in Ecology and Environmental Science. Blackwell Scientific Publications, New York.
Nadelhoffer, K. J. , M. Downs, B. Fry, J. D. Aber, A. H. Magill and J. M. Melillo. 1995. The
fate of 15 N-labelled nitrate additions to a northern hardwood forest in eastern Maine, USA. Oecologia 103:292-301.
Pang, P.C.K. 1985. Distribution and recovery of 15N after fertilization of Douglas-fir
saplings with different nitrogen sources. Plant Soil. 84:167-174. Powlson, D.S., and D. Barraclough. 1993. Mineralization and assimilitation in soil-plant
systems. In Nitrogen isotope techniques. p. 209-242. R. Knowles T.H. Blackburn (Eds.) Academic Press, London, UK.
Pritchett, W.L., and W.H. Smith. 1972. Fertilizer response in young slash pine stands. Soil
Sci. Soc. Amer. J. 36(4): 660–663. Rathfon, R.A., J.E. Johnson, J.A. Burger, R.E. Kreh, and P.P. Feret. 1993. Temporal
variation in foliar nutrient concentrations of pitch pine, loblolly pine and the pitch × loblolly hybrid. For. Ecol. Manage. 58:137-151.
J.E. Raymond
111
Raymond, J.E., T.R. Fox, B. Strahm, and J. Zerpa. 2016. Ammonia volatilization following nitrogen fertilization with enhanced efficiency fertilizers and urea in loblolly pine plantations of the southern United States. In Review.
Robinson, D. 2001. δ15N as integrator of the nitrogen cycle. Trends Ecol. Evol. 16:153-162. Rojas, J.C. 2005. Factors influencing responses of loblolly pine stands to fertilization. PhD
dissertation, North Carolina State Univ., Raleigh, NC. 147 p. Russell, G., P.G. Jarvis, and J.L. Monteith. 1989. Absorption of radiation by canopies and
stand growth. In: Russell, G.,Marshall, B., Jarvis, P. (Eds.), Plant Canopies: their growth, form, and function. Cambridge Univ. Press, Cambridge, UK, pp. 21-39.
Salifu, K.F., and V.R. Timmer. 2003. Nitrogen retranslocation response of young Picea
mariana to nitrogen-15 supply. Soil Sci. Soc. Am. J. 67:309–317. Schultz, R.P. 1997. The Ecology and Culture of Loblolly Pine (Pinus taeda L.). Agriculture
Handbook #713, USDA Forest Service, Washington, DC, p. 493. Shaviv, A. 1996. Plant response and environmental aspects as affected by rate and pattern of
nitrogen release from controlled release N fertilizers. In Progress in nitrogen cycling studies. Van Clempt (ed.). p. 285-291. Kluwer, Netherlands.
Shrestha, R., B.D. Strahm, and E.B. Sucre. 2014. Nitrous oxide fluxes in fertilized Pinus taeda plantations across a gradient of soil drainage classes. J. Envir. Qual. 43:1823–1832.
Smith, W.H., G.L. Switzer, and L.E. Nelson. 1970. Development of the shoot system of
young loblolly pine: 1. Apical growth and nitrogen concentration. For. Sci. 16(4): 483-490.
Smith, W.H., L.E. Nelson, and G.L. Switzer. 1971. Development of the shoot system of
young loblolly pine: 2. Dry matter and nitrogen accumulation. For. Sci. 17(1): 55-62. Stone, E. L. 1968. Microelement nutrition of forest trees: a review. pp. 132-175. In G. W.
Bengtson (Ed.). Forest fertilization- theory and practice. Tennessee Valley Authority, Muscle Shoals, AL. pp. 306.
Sypert, R.H. 2005. Diagnosis of loblolly pine (Pinus taeda L.) nutrient deficiencies by foliar
methods. M.S. Thesis. Virginia Tech. Switzer, C.L., and L.E. Nelson. 1972. Nutrient accumulation and cycling in loblolly pine
(Pinus taeda L.) plantation ecosystems: the first 20 years. Soil Sci. Soc. Am. Proc. 36: 143-147.
Sword, M.A., D.A. Gravatt, P.L. Faulkner, and J.L. Chambers. 1996. Seasonal branch and
fine root growth of juvenile loblolly pine five growing seasons after fertilization. Tree Physiol. 16: 899-904.
J.E. Raymond
112
Tang, Z., J.L. Chambers, S.Guddanti, and J.P. Barnett. 1999. Seasonal shoot and needle growth of loblolly pine responds to thinning, fertilization, and crown positions. For. Ecol. Manag. 120(1-3):117-130. doi:10.1016/S0378-1127(98)00533-7.
Templer, P.H., M.C. Mack, F.S. Chapin III, L.M. Christenson, J.E. Compton, H.D. Crook,
W.S. Currie, C.J. Curtis, D.B. Dail, C.M. D’Antonio, B.A. Emmett, H.E. Epstein, C.L. Goodale, P.Gundersen, S.E. Hobbie, K.Holland, D.U. Hooper, B.A. Hungate, S.Lamontagne, K.J. Nadelhoffer, C.W. Osenberg, S.S. Perakis, P.Schleppi, J.Schimel, I.K. Schmidt, M. Sommerkorn, J.S. Poelstra, A.Tietema, W.W. Wessel, D.R. Zak. 2012. Sinks for nitrogen inputs in terrestrial ecosystems: a meta-analysis of 15N tracer field studies. Ecology. 93(8): 1816–1829.
Tietema, A., B.A. Emmett, P. Gundersen, O.J. Kjonaas, and C.J. Koopmans. 1998. The fate
of 15N-labelled nitrogen deposition in coniferous forest ecosystems. For. Ecol. Manage. 101:19-27.
Timmer, V.R., and E.L. Stone. 1978. Comparative foliar analysis of young balsam fir
fertilized with nitrogen, phosphorous, potassium, and lime. Soil Sci. Soc. Am. J. 42: 125-130.
Tisdale, S.L., W.L. Nelson, and J.D. Beaton. 1985. Soil and fertilizer potassium. In Soil
fertility and fertilizers – 4th Ed. S.L. Tisdale, W.L. Nelson, and J.D. Beaton (Eds). Macmillan, New York. 249-291.
Trenkel, M.E. 2010. Slow-and controlled-release and stabilized fertilizers: an option for
enhancing nutrient use efficiency in agriculture. IFA. International fertilizer industry association.
United States Department of Agriculture (USDA), Forest Service Southern Region. 1989.
Insects and diseases of trees in the South. R8-PR16. 98 p. Valentine D.W. and H.L. Allen. 1990. Foliar responses to fertilization identify nutrient
limitation in loblolly pine. Can. J. For. Res. 20: 144-151. Vogel, J.G. and E.J. Jokela. 2011. Micronutrient limitations in two managed southern pine
stands planted on Florida spodosols. Soil Sci. Soc. Am. J. 75(3):1117-1124. Vose, J.M. 1988. Patterns of leaf area distribution within crowns of nitrogen and phosphorus
fertilized loblolly pine trees. For. Sci. 34:564-573. Vose, J.M., and H.L. Allen. 1988. Leaf area, stemwood growth and nutritional relationships
in loblolly pine. For. Sci. 34:547-563. Walker, L. C. 1958. Isotope tracer methods in tree nutrition. In: First North American Forest
Soils Conference. Ed. Agr. Exp. Sta. Mich. State Univ. East Lansing, MI. 25-30. Wells, C.G., and L.J. Metz. 1963. Variation in nutrient content of loblolly pine needles with
season, age, soil and position in crown. Soil Sci. Soc. Am. Proc. 27(1):90-93.
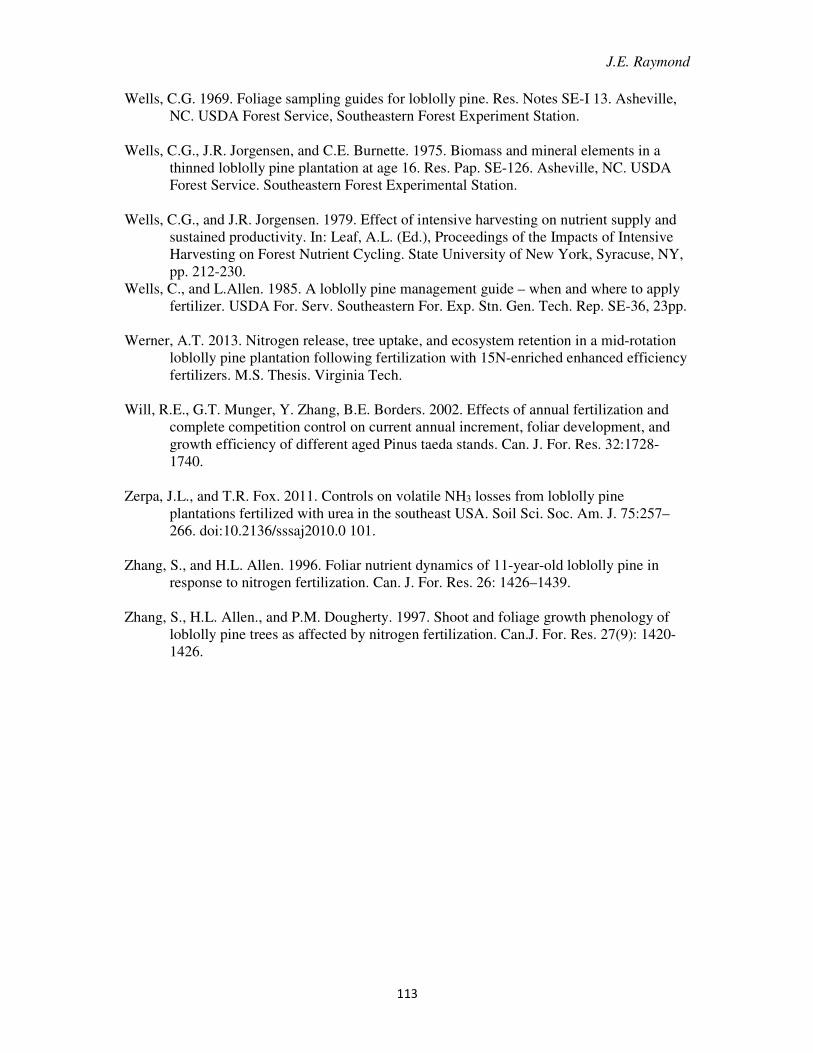
J.E. Raymond
113
Wells, C.G. 1969. Foliage sampling guides for loblolly pine. Res. Notes SE-I 13. Asheville, NC. USDA Forest Service, Southeastern Forest Experiment Station.
Wells, C.G., J.R. Jorgensen, and C.E. Burnette. 1975. Biomass and mineral elements in a
thinned loblolly pine plantation at age 16. Res. Pap. SE-126. Asheville, NC. USDA Forest Service. Southeastern Forest Experimental Station.
Wells, C.G., and J.R. Jorgensen. 1979. Effect of intensive harvesting on nutrient supply and
sustained productivity. In: Leaf, A.L. (Ed.), Proceedings of the Impacts of Intensive Harvesting on Forest Nutrient Cycling. State University of New York, Syracuse, NY, pp. 212-230.
Wells, C., and L.Allen. 1985. A loblolly pine management guide – when and where to apply fertilizer. USDA For. Serv. Southeastern For. Exp. Stn. Gen. Tech. Rep. SE-36, 23pp.
Werner, A.T. 2013. Nitrogen release, tree uptake, and ecosystem retention in a mid-rotation
loblolly pine plantation following fertilization with 15N-enriched enhanced efficiency fertilizers. M.S. Thesis. Virginia Tech.
Will, R.E., G.T. Munger, Y. Zhang, B.E. Borders. 2002. Effects of annual fertilization and
complete competition control on current annual increment, foliar development, and growth efficiency of different aged Pinus taeda stands. Can. J. For. Res. 32:1728-1740.
Zerpa, J.L., and T.R. Fox. 2011. Controls on volatile NH3 losses from loblolly pine
plantations fertilized with urea in the southeast USA. Soil Sci. Soc. Am. J. 75:257–266. doi:10.2136/sssaj2010.0 101.
Zhang, S., and H.L. Allen. 1996. Foliar nutrient dynamics of 11-year-old loblolly pine in response to nitrogen fertilization. Can. J. For. Res. 26: 1426–1439.
Zhang, S., H.L. Allen., and P.M. Dougherty. 1997. Shoot and foliage growth phenology of
loblolly pine trees as affected by nitrogen fertilization. Can.J. For. Res. 27(9): 1420- 1426.
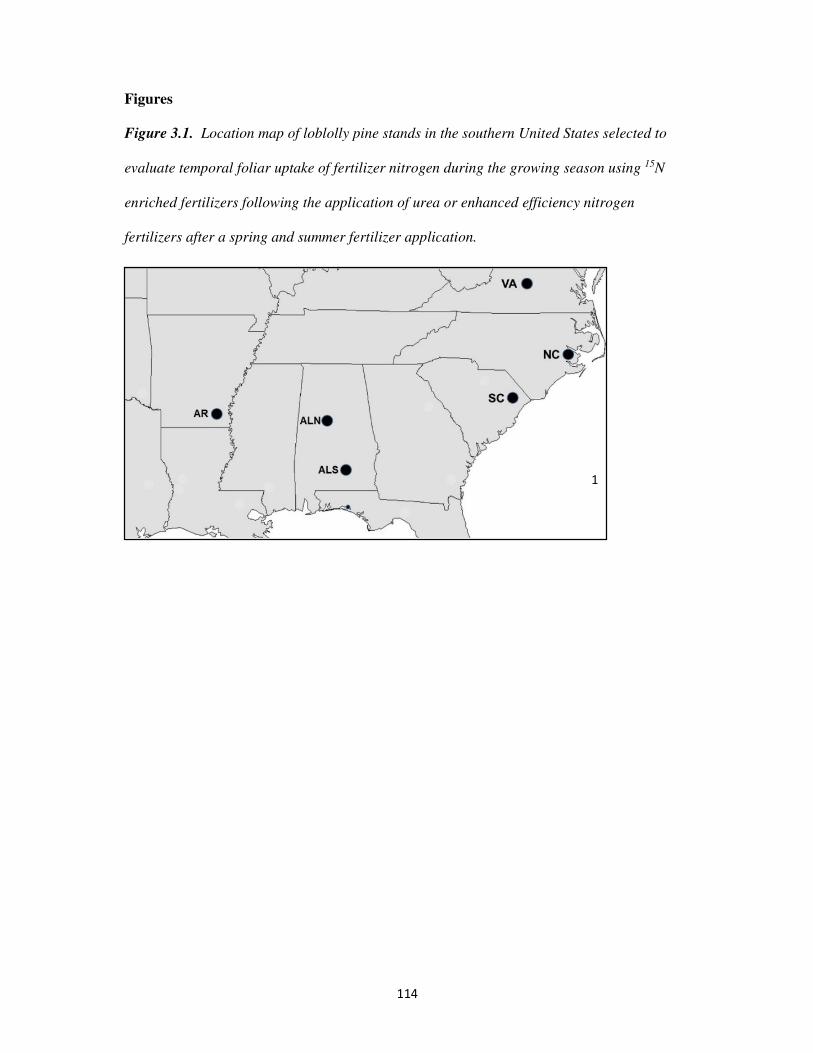
114
Figures
Figure 3.1. Location map of loblolly pine stands in the southern United States selected to
evaluate temporal foliar uptake of fertilizer nitrogen during the growing season using 15N
enriched fertilizers following the application of urea or enhanced efficiency nitrogen
fertilizers after a spring and summer fertilizer application.
1
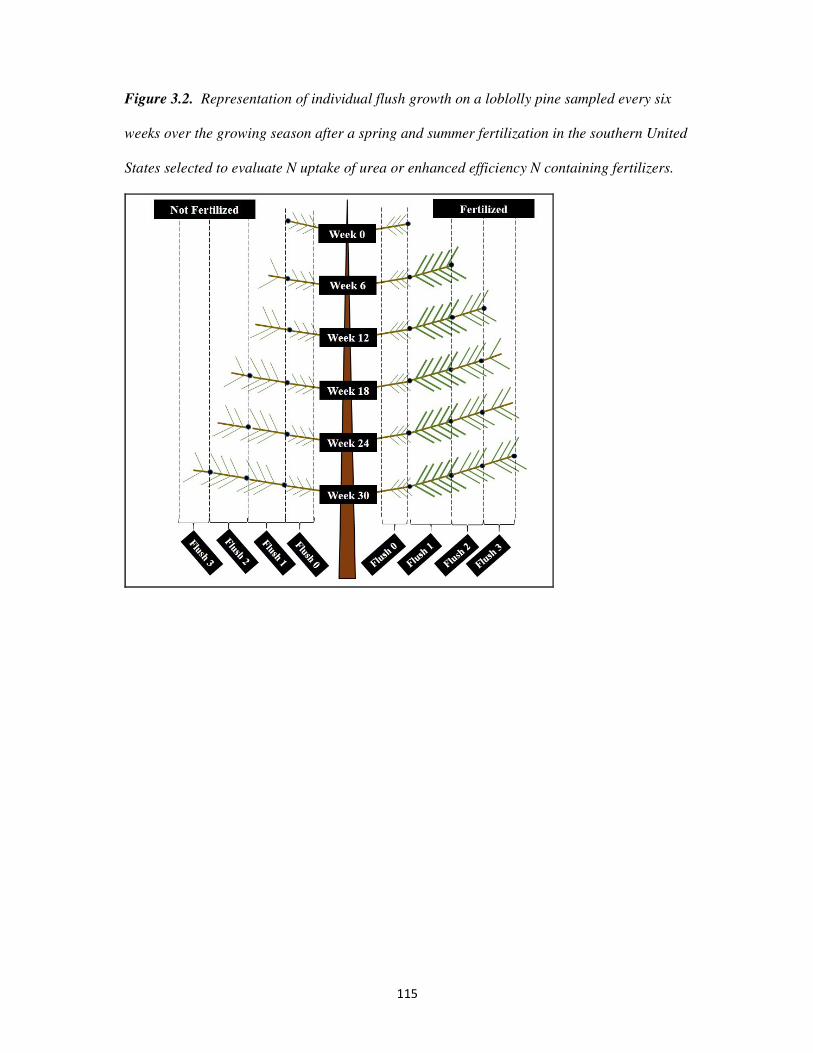
115
Figure 3.2. Representation of individual flush growth on a loblolly pine sampled every six
weeks over the growing season after a spring and summer fertilization in the southern United
States selected to evaluate N uptake of urea or enhanced efficiency N containing fertilizers.
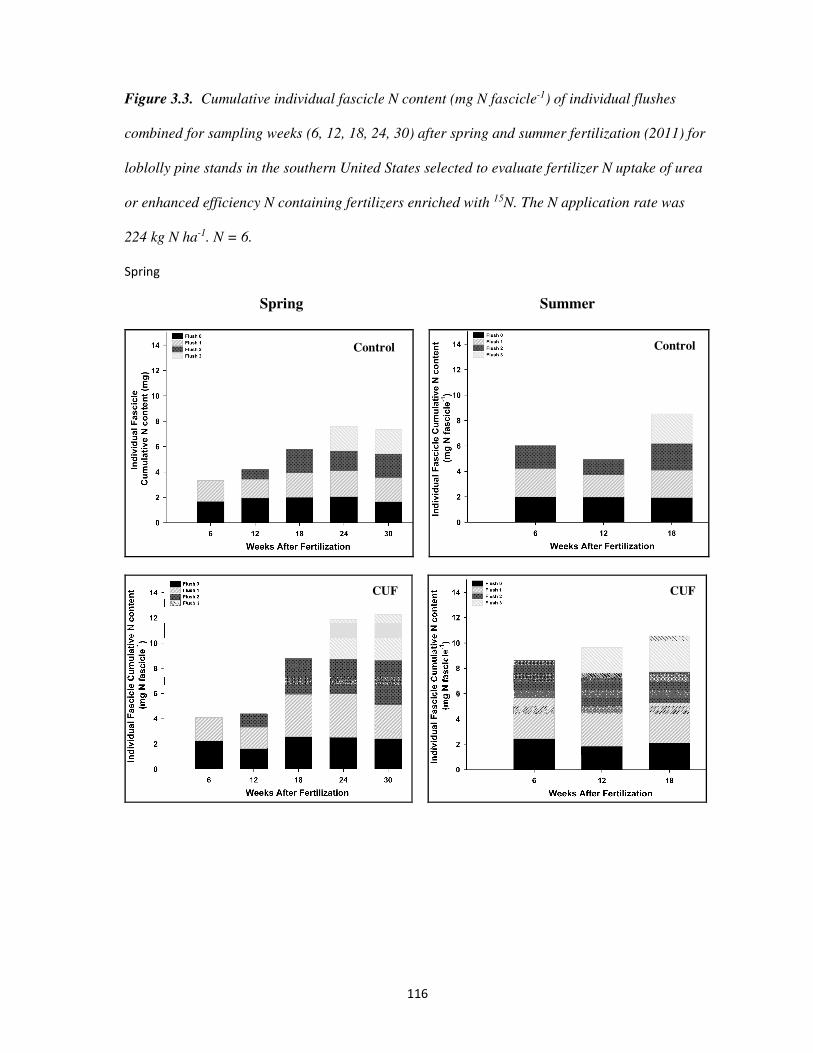
116
Figure 3.3. Cumulative individual fascicle N content (mg N fascicle-1) of individual flushes
combined for sampling weeks (6, 12, 18, 24, 30) after spring and summer fertilization (2011) for
loblolly pine stands in the southern United States selected to evaluate fertilizer N uptake of urea
or enhanced efficiency N containing fertilizers enriched with 15N. The N application rate was
224 kg N ha-1. N = 6.
Spring
Spring Summer
Control Control
CUF CUF
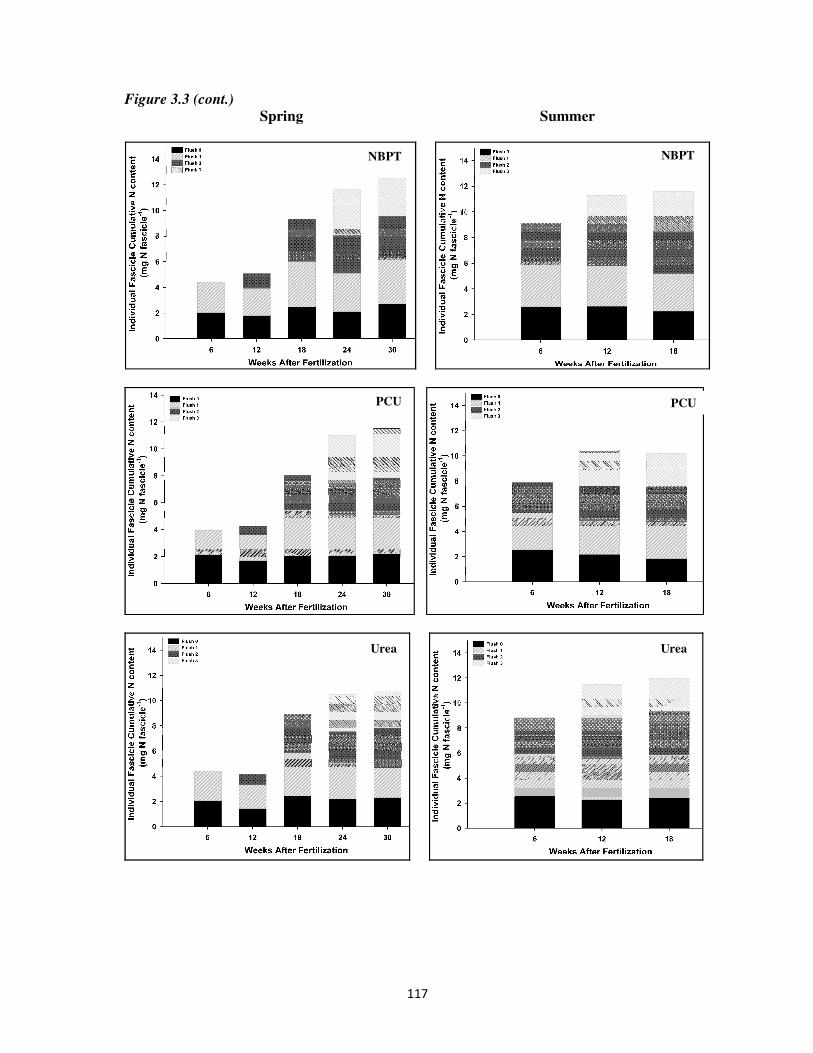
117
Figure 3.3 (cont.)
Spring Summer
PCU PCU
NBPT NBPT
Urea Urea
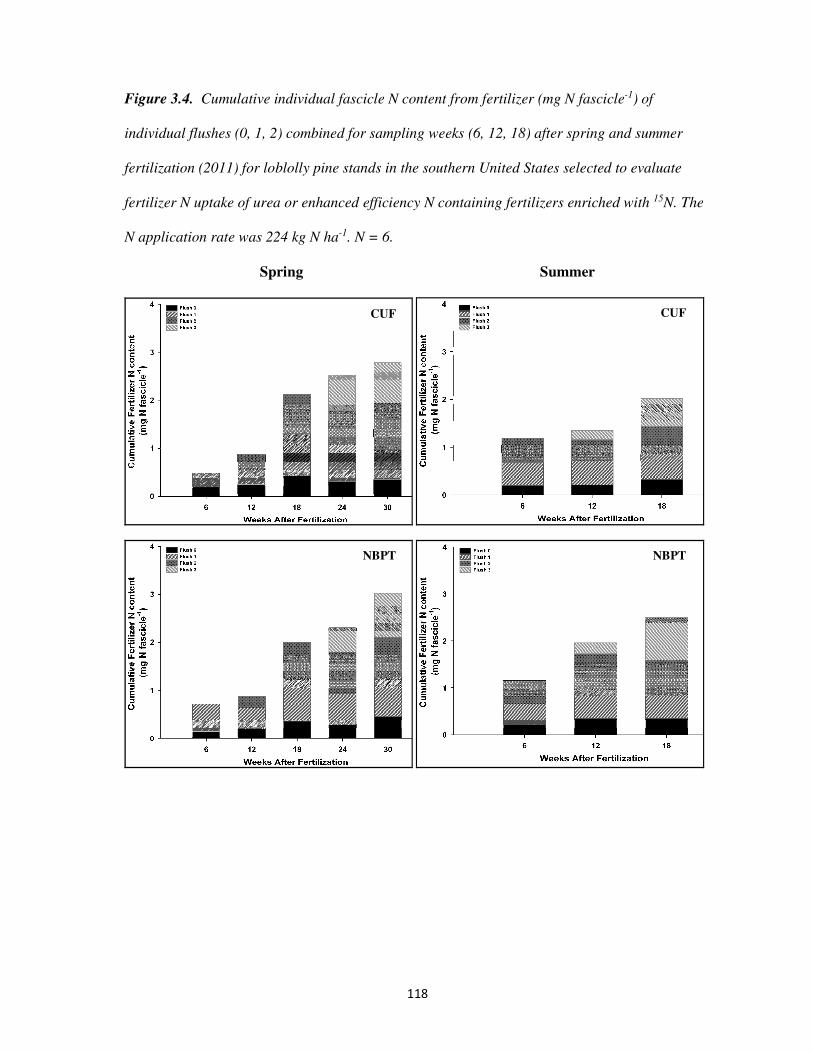
118
Figure 3.4. Cumulative individual fascicle N content from fertilizer (mg N fascicle-1) of
individual flushes (0, 1, 2) combined for sampling weeks (6, 12, 18) after spring and summer
fertilization (2011) for loblolly pine stands in the southern United States selected to evaluate
fertilizer N uptake of urea or enhanced efficiency N containing fertilizers enriched with 15N. The
N application rate was 224 kg N ha-1. N = 6.
Spring Summer
CUF CUF
NBPT NBPT
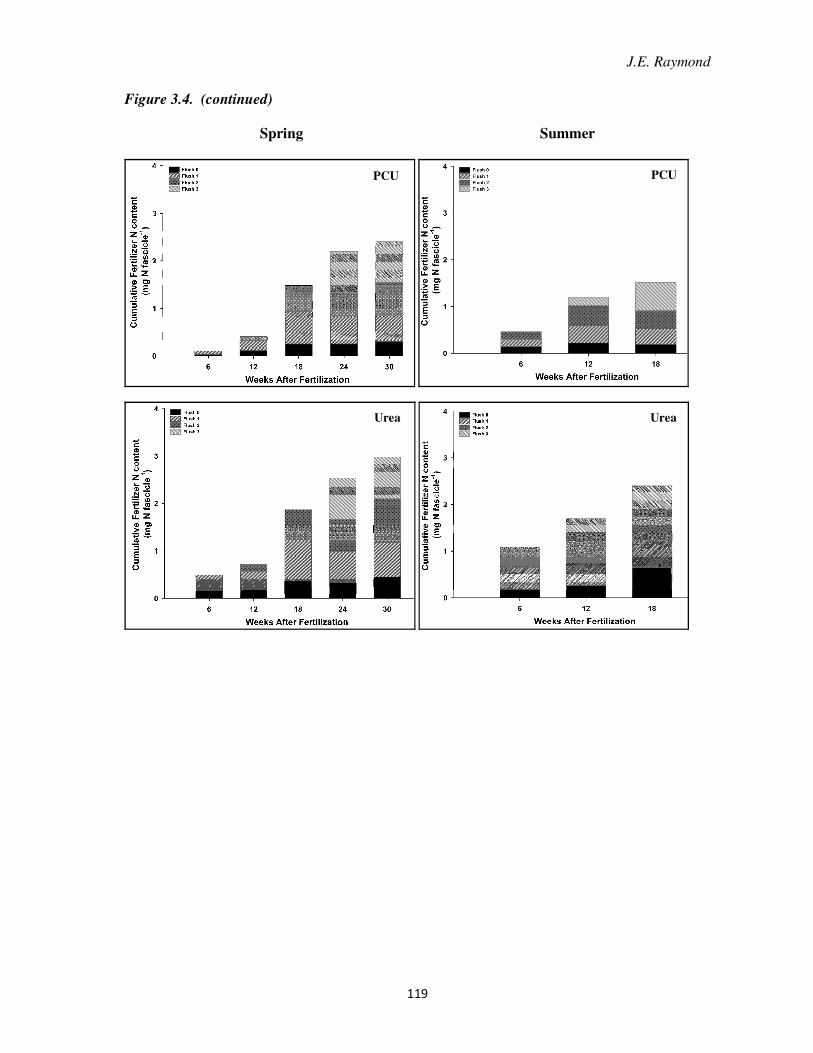
J.E. Raymond
119
Figure 3.4. (continued)
Spring Summer
PCU PCU
Urea Urea

120
1
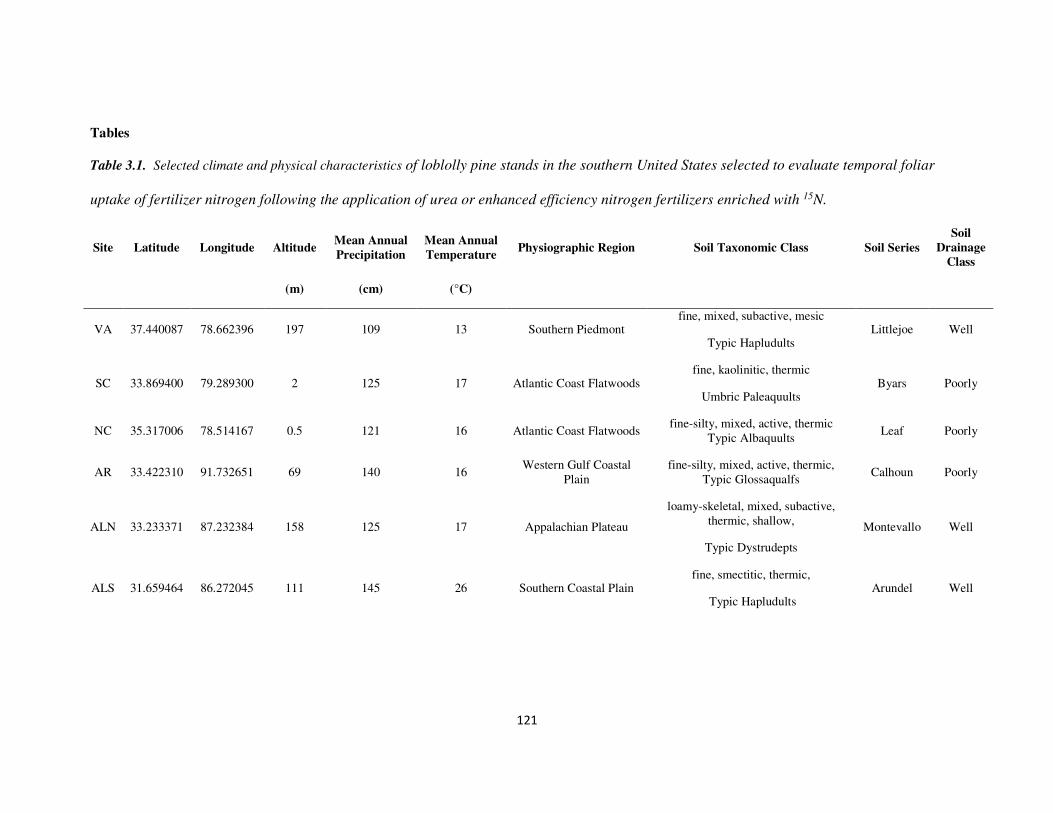
121
Tables
Table 3.1. Selected climate and physical characteristics of loblolly pine stands in the southern United States selected to evaluate temporal foliar
uptake of fertilizer nitrogen following the application of urea or enhanced efficiency nitrogen fertilizers enriched with 15N.
Site Latitude Longitude Altitude Mean Annual
Precipitation
Mean Annual
Temperature Physiographic Region Soil Taxonomic Class Soil Series
Soil
Drainage
Class
(m) (cm) (°C)
VA 37.440087 78.662396 197 109 13 Southern Piedmont fine, mixed, subactive, mesic
Typic Hapludults Littlejoe Well
SC 33.869400 79.289300 2 125 17 Atlantic Coast Flatwoods fine, kaolinitic, thermic
Umbric Paleaquults Byars Poorly
NC 35.317006 78.514167 0.5 121 16 Atlantic Coast Flatwoods fine-silty, mixed, active, thermic
Typic Albaquults Leaf Poorly
AR 33.422310 91.732651 69 140 16 Western Gulf Coastal
Plain fine-silty, mixed, active, thermic,
Typic Glossaqualfs Calhoun Poorly
ALN 33.233371 87.232384 158 125 17 Appalachian Plateau
loamy-skeletal, mixed, subactive, thermic, shallow,
Typic Dystrudepts
Montevallo Well
ALS 31.659464 86.272045 111 145 26 Southern Coastal Plain fine, smectitic, thermic,
Typic Hapludults Arundel Well
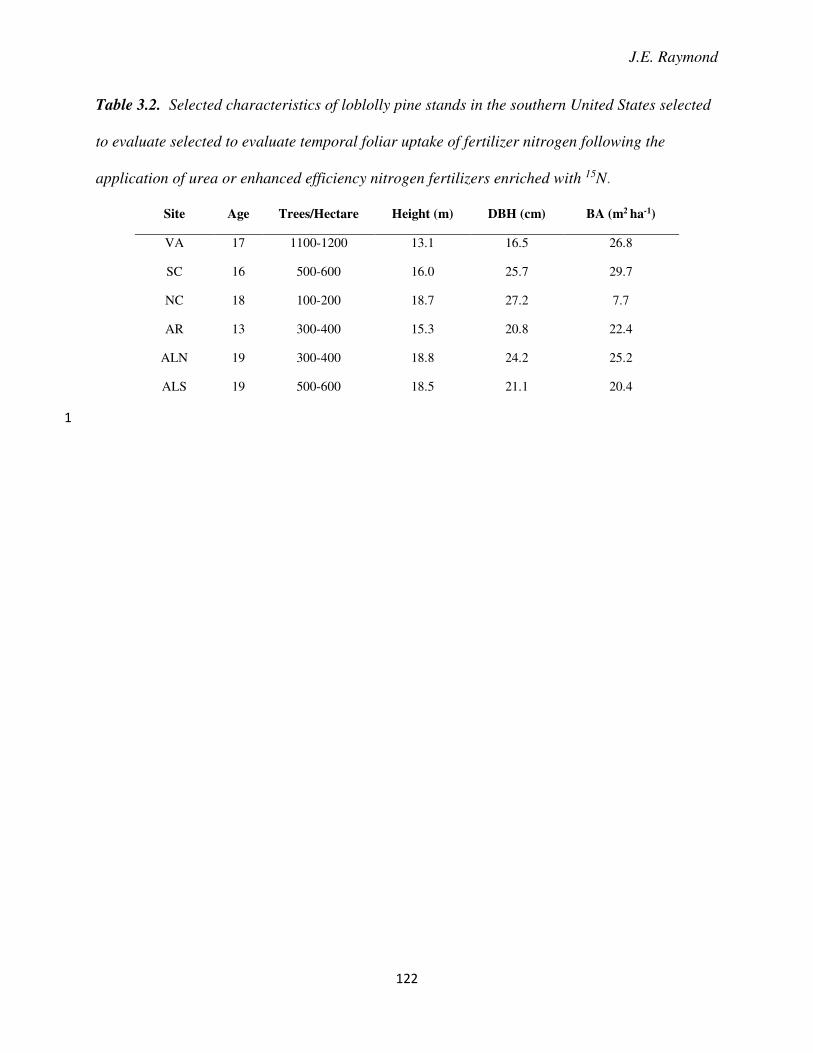
J.E. Raymond
122
Table 3.2. Selected characteristics of loblolly pine stands in the southern United States selected
to evaluate selected to evaluate temporal foliar uptake of fertilizer nitrogen following the
application of urea or enhanced efficiency nitrogen fertilizers enriched with 15N.
Site Age Trees/Hectare Height (m) DBH (cm) BA (m2 ha-1)
VA 17 1100-1200 13.1 16.5 26.8
SC 16 500-600 16.0 25.7 29.7
NC 18 100-200 18.7 27.2 7.7
AR 13 300-400 15.3 20.8 22.4
ALN 19 300-400 18.8 24.2 25.2
ALS 19 500-600 18.5 21.1 20.4
1
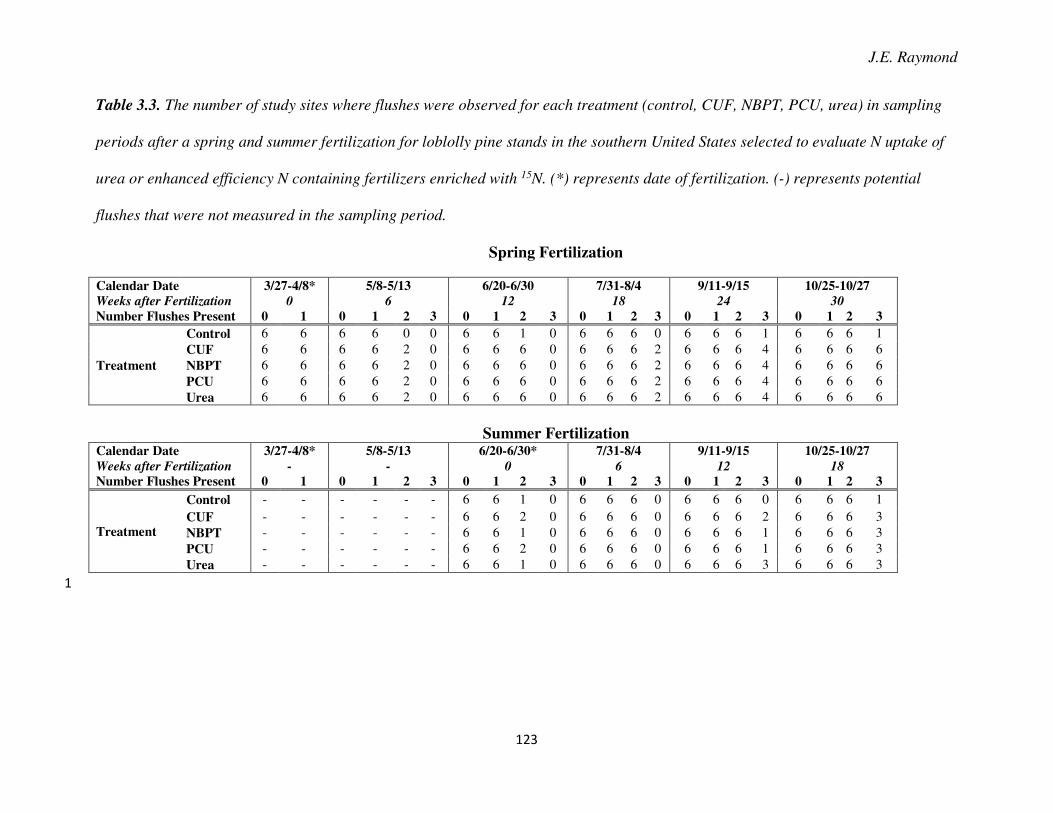
J.E. Raymond
123
Table 3.3. The number of study sites where flushes were observed for each treatment (control, CUF, NBPT, PCU, urea) in sampling
periods after a spring and summer fertilization for loblolly pine stands in the southern United States selected to evaluate N uptake of
urea or enhanced efficiency N containing fertilizers enriched with 15N. (*) represents date of fertilization. (-) represents potential
flushes that were not measured in the sampling period.
Spring Fertilization
Calendar Date 3/27-4/8* 5/8-5/13 6/20-6/30 7/31-8/4 9/11-9/15 10/25-10/27
Weeks after Fertilization 0 6 12 18 24 30
Number Flushes Present 0 1 0 1 2 3 0 1 2 3 0 1 2 3 0 1 2 3 0 1 2 3
Treatment
Control 6 6 6 6 0 0 6 6 1 0 6 6 6 0 6 6 6 1 6 6 6 1 CUF 6 6 6 6 2 0 6 6 6 0 6 6 6 2 6 6 6 4 6 6 6 6 NBPT 6 6 6 6 2 0 6 6 6 0 6 6 6 2 6 6 6 4 6 6 6 6 PCU 6 6 6 6 2 0 6 6 6 0 6 6 6 2 6 6 6 4 6 6 6 6 Urea 6 6 6 6 2 0 6 6 6 0 6 6 6 2 6 6 6 4 6 6 6 6
Summer Fertilization Calendar Date 3/27-4/8* 5/8-5/13 6/20-6/30* 7/31-8/4 9/11-9/15 10/25-10/27
Weeks after Fertilization - - 0 6 12 18
Number Flushes Present 0 1 0 1 2 3 0 1 2 3 0 1 2 3 0 1 2 3 0 1 2 3
Treatment
Control - - - - - - 6 6 1 0 6 6 6 0 6 6 6 0 6 6 6 1 CUF - - - - - - 6 6 2 0 6 6 6 0 6 6 6 2 6 6 6 3 NBPT - - - - - - 6 6 1 0 6 6 6 0 6 6 6 1 6 6 6 3 PCU - - - - - - 6 6 2 0 6 6 6 0 6 6 6 1 6 6 6 3 Urea - - - - - - 6 6 1 0 6 6 6 0 6 6 6 3 6 6 6 3
1
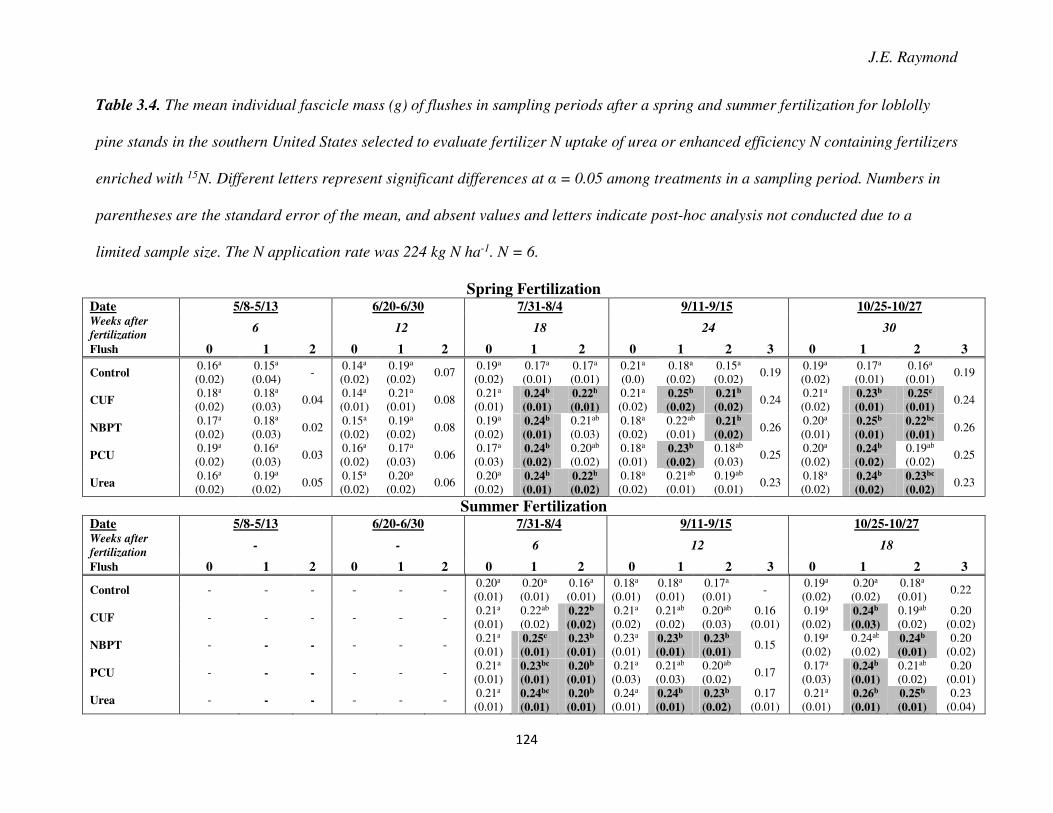
J.E. Raymond
124
Table 3.4. The mean individual fascicle mass (g) of flushes in sampling periods after a spring and summer fertilization for loblolly
pine stands in the southern United States selected to evaluate fertilizer N uptake of urea or enhanced efficiency N containing fertilizers
enriched with 15N. Different letters represent significant differences at α = 0.05 among treatments in a sampling period. Numbers in
parentheses are the standard error of the mean, and absent values and letters indicate post-hoc analysis not conducted due to a
limited sample size. The N application rate was 224 kg N ha-1. N = 6.
Spring Fertilization Date 5/8-5/13 6/20-6/30 7/31-8/4 9/11-9/15 10/25-10/27 Weeks after
fertilization 6 12 18 24 30
Flush 0 1 2 0 1 2 0 1 2 0 1 2 3 0 1 2 3
Control 0.16a (0.02)
0.15a (0.04)
- 0.14a (0.02)
0.19a (0.02)
0.07 0.19a (0.02)
0.17a (0.01)
0.17a (0.01)
0.21a (0.0)
0.18a
(0.02) 0.15a (0.02)
0.19 0.19a (0.02)
0.17a (0.01)
0.16a (0.01)
0.19
CUF 0.18a (0.02)
0.18a (0.03)
0.04 0.14a (0.01)
0.21a (0.01)
0.08 0.21a (0.01)
0.24b
(0.01)
0.22b
(0.01)
0.21a (0.02)
0.25b
(0.02)
0.21b
(0.02) 0.24
0.21a (0.02)
0.23b
(0.01)
0.25c
(0.01) 0.24
NBPT 0.17a (0.02)
0.18a (0.03)
0.02 0.15a (0.02)
0.19a (0.02)
0.08 0.19a (0.02)
0.24b
(0.01)
0.21ab (0.03)
0.18a (0.02)
0.22ab (0.01)
0.21b
(0.02) 0.26
0.20a (0.01)
0.25b
(0.01)
0.22bc
(0.01) 0.26
PCU 0.19a (0.02)
0.16a (0.03)
0.03 0.16a (0.02)
0.17a (0.03)
0.06 0.17a (0.03)
0.24b
(0.02)
0.20ab (0.02)
0.18a (0.01)
0.23b
(0.02)
0.18ab (0.03)
0.25 0.20a (0.02)
0.24b
(0.02)
0.19ab (0.02)
0.25
Urea 0.16a (0.02)
0.19a (0.02)
0.05 0.15a (0.02)
0.20a (0.02)
0.06 0.20a (0.02)
0.24b
(0.01)
0.22b
(0.02)
0.18a (0.02)
0.21ab (0.01)
0.19ab (0.01)
0.23 0.18a (0.02)
0.24b
(0.02)
0.23bc
(0.02) 0.23
Summer Fertilization
Date 5/8-5/13 6/20-6/30 7/31-8/4 9/11-9/15 10/25-10/27 Weeks after
fertilization - - 6 12 18
Flush 0 1 2 0 1 2 0 1 2 0 1 2 3 0 1 2 3
Control - - - - - - 0.20a (0.01)
0.20a (0.01)
0.16a (0.01)
0.18a (0.01)
0.18a (0.01)
0.17a (0.01)
- 0.19a (0.02)
0.20a (0.02)
0.18a (0.01)
0.22
CUF - - - - - - 0.21a (0.01)
0.22ab (0.02)
0.22b
(0.02)
0.21a (0.02)
0.21ab (0.02)
0.20ab (0.03)
0.16 (0.01)
0.19a (0.02)
0.24b
(0.03) 0.19ab (0.02)
0.20 (0.02)
NBPT - - - - - - 0.21a (0.01)
0.25c
(0.01)
0.23b
(0.01)
0.23a (0.01)
0.23b
(0.01)
0.23b
(0.01) 0.15
0.19a (0.02)
0.24ab (0.02)
0.24b
(0.01)
0.20 (0.02)
PCU - - - - - - 0.21a (0.01)
0.23bc
(0.01)
0.20b
(0.01)
0.21a (0.03)
0.21ab (0.03)
0.20ab (0.02)
0.17 0.17a (0.03)
0.24b
(0.01) 0.21ab (0.02)
0.20 (0.01)
Urea - - - - - - 0.21a (0.01)
0.24bc
(0.01)
0.20b
(0.01)
0.24a (0.01)
0.24b
(0.01)
0.23b
(0.02)
0.17 (0.01)
0.21a (0.01)
0.26b
(0.01)
0.25b
(0.01) 0.23
(0.04)
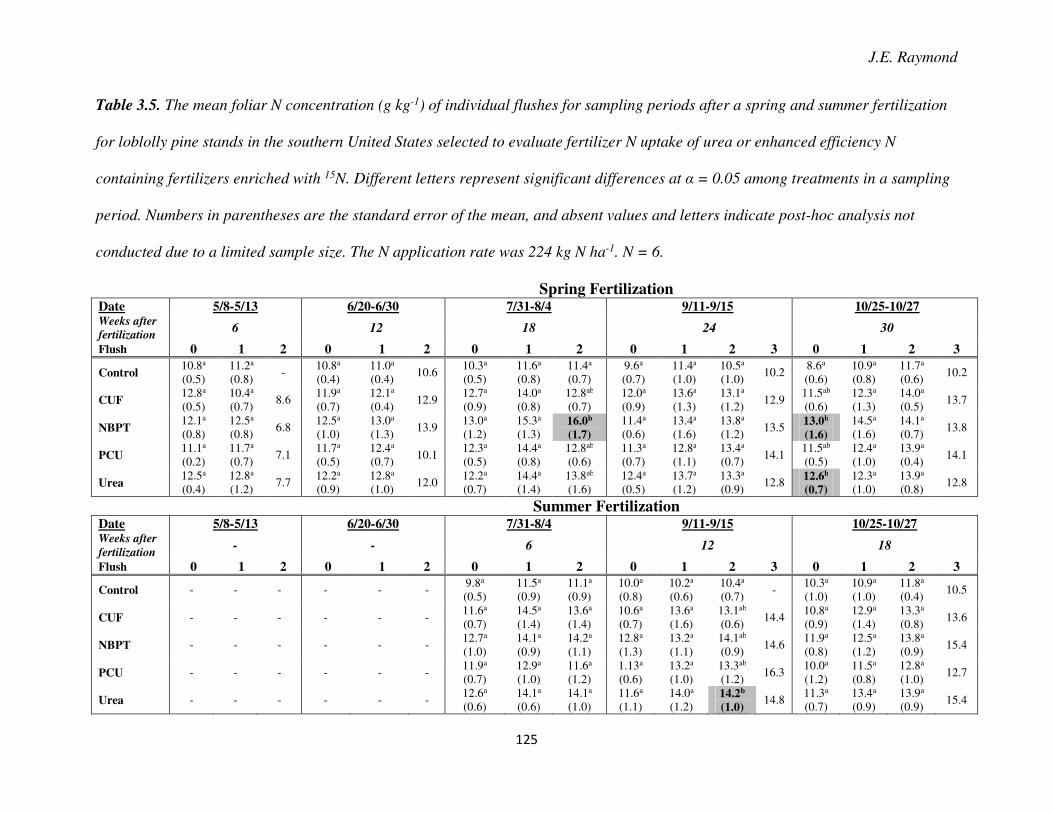
J.E. Raymond
125
Table 3.5. The mean foliar N concentration (g kg-1) of individual flushes for sampling periods after a spring and summer fertilization
for loblolly pine stands in the southern United States selected to evaluate fertilizer N uptake of urea or enhanced efficiency N
containing fertilizers enriched with 15N. Different letters represent significant differences at α = 0.05 among treatments in a sampling
period. Numbers in parentheses are the standard error of the mean, and absent values and letters indicate post-hoc analysis not
conducted due to a limited sample size. The N application rate was 224 kg N ha-1. N = 6.
Spring Fertilization Date 5/8-5/13 6/20-6/30 7/31-8/4 9/11-9/15 10/25-10/27 Weeks after
fertilization 6 12 18 24 30
Flush 0 1 2 0 1 2 0 1 2 0 1 2 3 0 1 2 3
Control 10.8a (0.5)
11.2a (0.8)
- 10.8a (0.4)
11.0a (0.4)
10.6 10.3a (0.5)
11.6a (0.8)
11.4a (0.7)
9.6a (0.7)
11.4a (1.0)
10.5a (1.0)
10.2 8.6a (0.6)
10.9a (0.8)
11.7a (0.6)
10.2
CUF 12.8a (0.5)
10.4a (0.7)
8.6 11.9a (0.7)
12.1a (0.4)
12.9 12.7a (0.9)
14.0a (0.8)
12.8ab (0.7)
12.0a (0.9)
13.6a (1.3)
13.1a (1.2)
12.9 11.5ab (0.6)
12.3a (1.3)
14.0a (0.5)
13.7
NBPT 12.1a (0.8)
12.5a (0.8)
6.8 12.5a (1.0)
13.0a (1.3)
13.9 13.0a (1.2)
15.3a (1.3)
16.0b
(1.7)
11.4a (0.6)
13.4a (1.6)
13.8a (1.2)
13.5 13.0b
(1.6)
14.5a (1.6)
14.1a (0.7)
13.8
PCU 11.1a (0.2)
11.7a (0.7)
7.1 11.7a (0.5)
12.4a (0.7)
10.1 12.3a (0.5)
14.4a (0.8)
12.8ab (0.6)
11.3a (0.7)
12.8a (1.1)
13.4a (0.7)
14.1 11.5ab (0.5)
12.4a (1.0)
13.9a (0.4)
14.1
Urea 12.5a (0.4)
12.8a (1.2)
7.7 12.2a (0.9)
12.8a (1.0)
12.0 12.2a (0.7)
14.4a (1.4)
13.8ab (1.6)
12.4a (0.5)
13.7a (1.2)
13.3a (0.9)
12.8 12.6b
(0.7)
12.3a (1.0)
13.9a (0.8)
12.8
Summer Fertilization Date 5/8-5/13 6/20-6/30 7/31-8/4 9/11-9/15 10/25-10/27 Weeks after
fertilization - - 6 12 18
Flush 0 1 2 0 1 2 0 1 2 0 1 2 3 0 1 2 3
Control - - - - - - 9.8a (0.5)
11.5a (0.9)
11.1a (0.9)
10.0a (0.8)
10.2a (0.6)
10.4a (0.7)
- 10.3a (1.0)
10.9a (1.0)
11.8a (0.4)
10.5
CUF - - - - - - 11.6a (0.7)
14.5a (1.4)
13.6a (1.4)
10.6a (0.7)
13.6a (1.6)
13.1ab (0.6)
14.4 10.8a (0.9)
12.9a
(1.4) 13.3a (0.8)
13.6
NBPT - - - - - - 12.7a (1.0)
14.1a (0.9)
14.2a (1.1)
12.8a (1.3)
13.2a (1.1)
14.1ab (0.9)
14.6 11.9a (0.8)
12.5a (1.2)
13.8a (0.9)
15.4
PCU - - - - - - 11.9a (0.7)
12.9a (1.0)
11.6a (1.2)
1.13a (0.6)
13.2a (1.0)
13.3ab (1.2)
16.3 10.0a (1.2)
11.5a (0.8)
12.8a (1.0)
12.7
Urea - - - - - - 12.6a (0.6)
14.1a (0.6)
14.1a (1.0)
11.6a (1.1)
14.0a (1.2)
14.2b
(1.0) 14.8
11.3a (0.7)
13.4a (0.9)
13.9a (0.9)
15.4
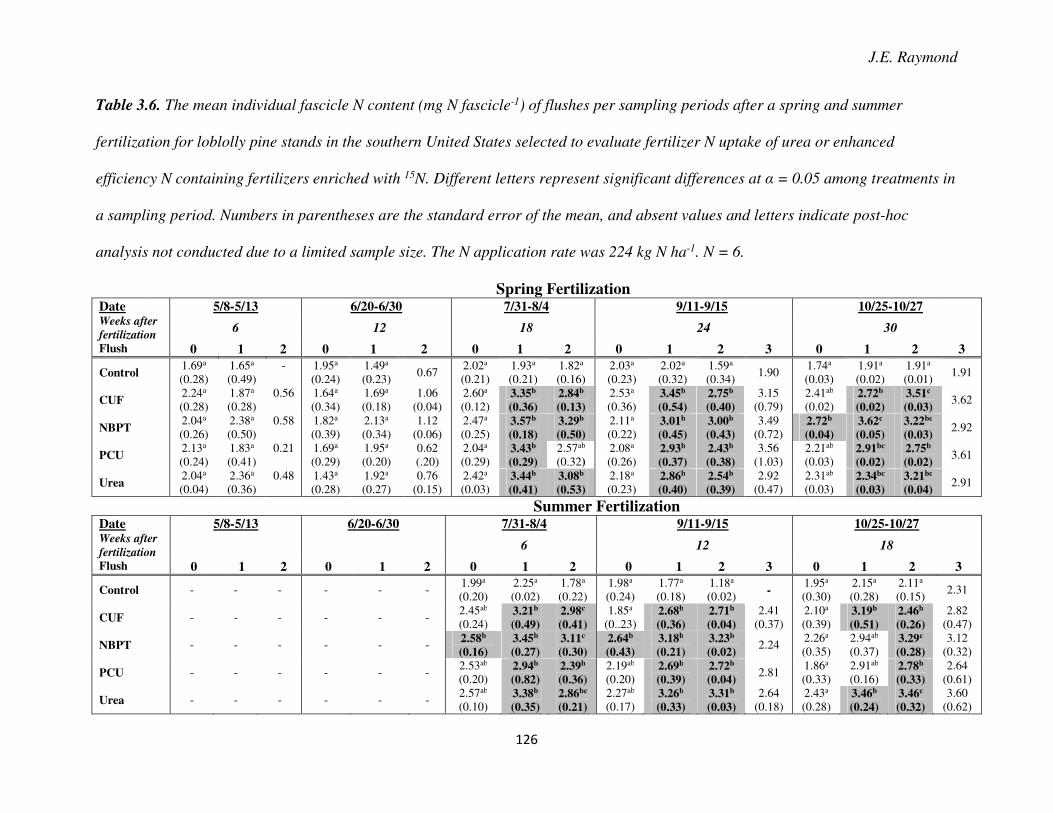
J.E. Raymond
126
Table 3.6. The mean individual fascicle N content (mg N fascicle-1) of flushes per sampling periods after a spring and summer
fertilization for loblolly pine stands in the southern United States selected to evaluate fertilizer N uptake of urea or enhanced
efficiency N containing fertilizers enriched with 15N. Different letters represent significant differences at α = 0.05 among treatments in
a sampling period. Numbers in parentheses are the standard error of the mean, and absent values and letters indicate post-hoc
analysis not conducted due to a limited sample size. The N application rate was 224 kg N ha-1. N = 6.
Spring Fertilization Date 5/8-5/13 6/20-6/30 7/31-8/4 9/11-9/15 10/25-10/27 Weeks after
fertilization 6 12 18 24 30
Flush 0 1 2 0 1 2 0 1 2 0 1 2 3 0 1 2 3
Control 1.69a (0.28)
1.65a (0.49)
- 1.95a (0.24)
1.49a (0.23)
0.67 2.02a (0.21)
1.93a (0.21)
1.82a (0.16)
2.03a (0.23)
2.02a (0.32)
1.59a (0.34)
1.90 1.74a (0.03)
1.91a (0.02)
1.91a (0.01)
1.91
CUF 2.24a (0.28)
1.87a (0.28)
0.56 1.64a (0.34)
1.69a (0.18)
1.06 (0.04)
2.60a (0.12)
3.35b
(0.36)
2.84b
(0.13)
2.53a (0.36)
3.45b
(0.54)
2.75b
(0.40)
3.15 (0.79)
2.41ab (0.02)
2.72b
(0.02)
3.51c
(0.03) 3.62
NBPT 2.04a (0.26)
2.38a (0.50)
0.58 1.82a (0.39)
2.13a (0.34)
1.12 (0.06)
2.47a (0.25)
3.57b
(0.18)
3.29b
(0.50)
2.11a (0.22)
3.01b
(0.45)
3.00b
(0.43)
3.49 (0.72)
2.72b
(0.04)
3.62c
(0.05)
3.22bc
(0.03) 2.92
PCU 2.13a (0.24)
1.83a (0.41)
0.21 1.69a (0.29)
1.95a (0.20)
0.62 (.20)
2.04a (0.29)
3.43b
(0.29)
2.57ab (0.32)
2.08a (0.26)
2.93b
(0.37)
2.43b
(0.38)
3.56 (1.03)
2.21ab (0.03)
2.91bc
(0.02)
2.75b
(0.02) 3.61
Urea 2.04a (0.04)
2.36a (0.36)
0.48 1.43a (0.28)
1.92a (0.27)
0.76 (0.15)
2.42a (0.03)
3.44b
(0.41)
3.08b
(0.53)
2.18a (0.23)
2.86b
(0.40)
2.54b
(0.39)
2.92 (0.47)
2.31ab (0.03)
2.34bc
(0.03)
3.21bc
(0.04) 2.91
Summer Fertilization Date 5/8-5/13 6/20-6/30 7/31-8/4 9/11-9/15 10/25-10/27 Weeks after
fertilization 6 12 18
Flush 0 1 2 0 1 2 0 1 2 0 1 2 3 0 1 2 3
Control - - - - - - 1.99a (0.20)
2.25a (0.02)
1.78a (0.22)
1.98a (0.24)
1.77a (0.18)
1.18a (0.02) -
1.95a (0.30)
2.15a (0.28)
2.11a (0.15)
2.31
CUF - - - - - - 2.45ab (0.24)
3.21b
(0.49)
2.98c
(0.41)
1.85a (0..23)
2.68b
(0.36)
2.71b
(0.04)
2.41 (0.37)
2.10a (0.39)
3.19b
(0.51)
2.46b
(0.26)
2.82 (0.47)
NBPT - - - - - - 2.58b
(0.16)
3.45b
(0.27)
3.11c
(0.30)
2.64b
(0.43)
3.18b
(0.21)
3.23b
(0.02) 2.24
2.26a (0.35)
2.94ab (0.37)
3.29c
(0.28)
3.12 (0.32)
PCU - - - - - - 2.53ab (0.20)
2.94b
(0.82)
2.39b
(0.36)
2.19ab (0.20)
2.69b
(0.39)
2.72b
(0.04) 2.81
1.86a (0.33)
2.91ab (0.16)
2.78b
(0.33)
2.64 (0.61)
Urea - - - - - - 2.57ab (0.10)
3.38b
(0.35)
2.86bc
(0.21)
2.27ab (0.17)
3.26b
(0.33)
3.31b
(0.03)
2.64 (0.18)
2.43a (0.28)
3.46b
(0.24)
3.46c
(0.32)
3.60 (0.62)
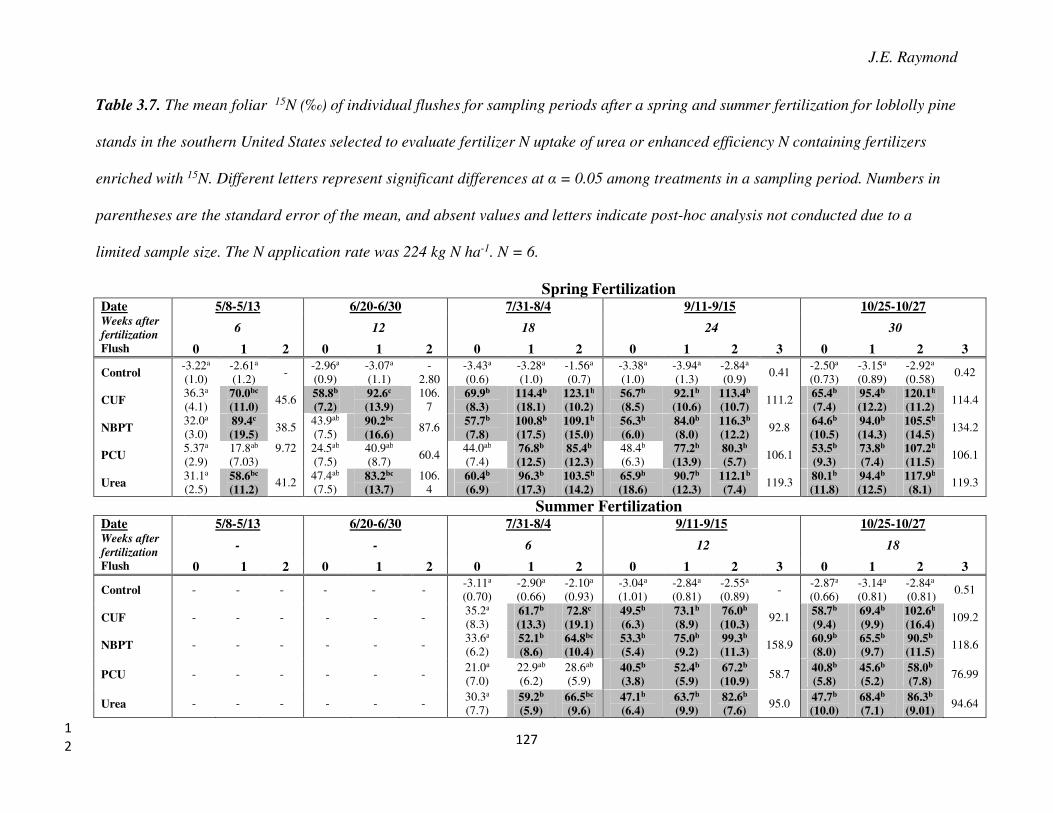
J.E. Raymond
127
Table 3.7. The mean foliar 15N (‰) of individual flushes for sampling periods after a spring and summer fertilization for loblolly pine
stands in the southern United States selected to evaluate fertilizer N uptake of urea or enhanced efficiency N containing fertilizers
enriched with 15N. Different letters represent significant differences at α = 0.05 among treatments in a sampling period. Numbers in
parentheses are the standard error of the mean, and absent values and letters indicate post-hoc analysis not conducted due to a
limited sample size. The N application rate was 224 kg N ha-1. N = 6.
Spring Fertilization Date 5/8-5/13 6/20-6/30 7/31-8/4 9/11-9/15 10/25-10/27 Weeks after
fertilization 6 12 18 24 30
Flush 0 1 2 0 1 2 0 1 2 0 1 2 3 0 1 2 3
Control -3.22a (1.0)
-2.61a (1.2)
- -2.96a (0.9)
-3.07a (1.1)
-2.80
-3.43a (0.6)
-3.28a (1.0)
-1.56a (0.7)
-3.38a (1.0)
-3.94a (1.3)
-2.84a (0.9)
0.41 -2.50a (0.73)
-3.15a (0.89)
-2.92a (0.58)
0.42
CUF 36.3a (4.1)
70.0bc
(11.0) 45.6 58.8b
(7.2)
92.6c
(13.9)
106.7
69.9b
(8.3)
114.4b
(18.1)
123.1b
(10.2)
56.7b
(8.5)
92.1b
(10.6)
113.4b
(10.7) 111.2 65.4b
(7.4)
95.4b
(12.2)
120.1b
(11.2) 114.4
NBPT 32.0a (3.0)
89.4c
(19.5) 38.5
43.9ab (7.5)
90.2bc
(16.6) 87.6 57.7b
(7.8)
100.8b
(17.5)
109.1b
(15.0)
56.3b
(6.0)
84.0b
(8.0)
116.3b
(12.2) 92.8 64.6b
(10.5)
94.0b
(14.3)
105.5b
(14.5) 134.2
PCU 5.37a (2.9)
17.8ab (7.03)
9.72
24.5ab (7.5)
40.9ab (8.7)
60.4 44.0ab (7.4)
76.8b
(12.5)
85.4b
(12.3)
48.4b (6.3)
77.2b
(13.9)
80.3b
(5.7) 106.1 53.5b
(9.3)
73.8b
(7.4)
107.2b
(11.5) 106.1
Urea 31.1a (2.5)
58.6bc
(11.2) 41.2
47.4ab (7.5)
83.2bc
(13.7)
106.4
60.4b
(6.9)
96.3b
(17.3)
103.5b
(14.2)
65.9b
(18.6)
90.7b
(12.3)
112.1b
(7.4) 119.3 80.1b
(11.8)
94.4b
(12.5)
117.9b
(8.1) 119.3
Summer Fertilization Date 5/8-5/13 6/20-6/30 7/31-8/4 9/11-9/15 10/25-10/27 Weeks after
fertilization - - 6 12 18
Flush 0 1 2 0 1 2 0 1 2 0 1 2 3 0 1 2 3
Control - - - - - - -3.11a (0.70)
-2.90a (0.66)
-2.10a (0.93)
-3.04a (1.01)
-2.84a (0.81)
-2.55a (0.89)
- -2.87a (0.66)
-3.14a (0.81)
-2.84a (0.81)
0.51
CUF - - - - - - 35.2a (8.3)
61.7b
(13.3) 72.8c
(19.1)
49.5b
(6.3)
73.1b
(8.9)
76.0b
(10.3) 92.1 58.7b
(9.4)
69.4b
(9.9)
102.6b
(16.4) 109.2
NBPT - - - - - - 33.6a (6.2)
52.1b
(8.6) 64.8bc
(10.4)
53.3b
(5.4)
75.0b
(9.2)
99.3b
(11.3) 158.9 60.9b
(8.0)
65.5b
(9.7)
90.5b
(11.5) 118.6
PCU - - - - - - 21.0a (7.0)
22.9ab (6.2)
28.6ab (5.9)
40.5b
(3.8)
52.4b
(5.9)
67.2b
(10.9) 58.7 40.8b
(5.8)
45.6b
(5.2)
58.0b
(7.8) 76.99
Urea - - - - - - 30.3a (7.7)
59.2b
(5.9) 66.5bc
(9.6)
47.1b
(6.4)
63.7b
(9.9)
82.6b
(7.6) 95.0 47.7b
(10.0)
68.4b
(7.1)
86.3b
(9.01) 94.64
1
2
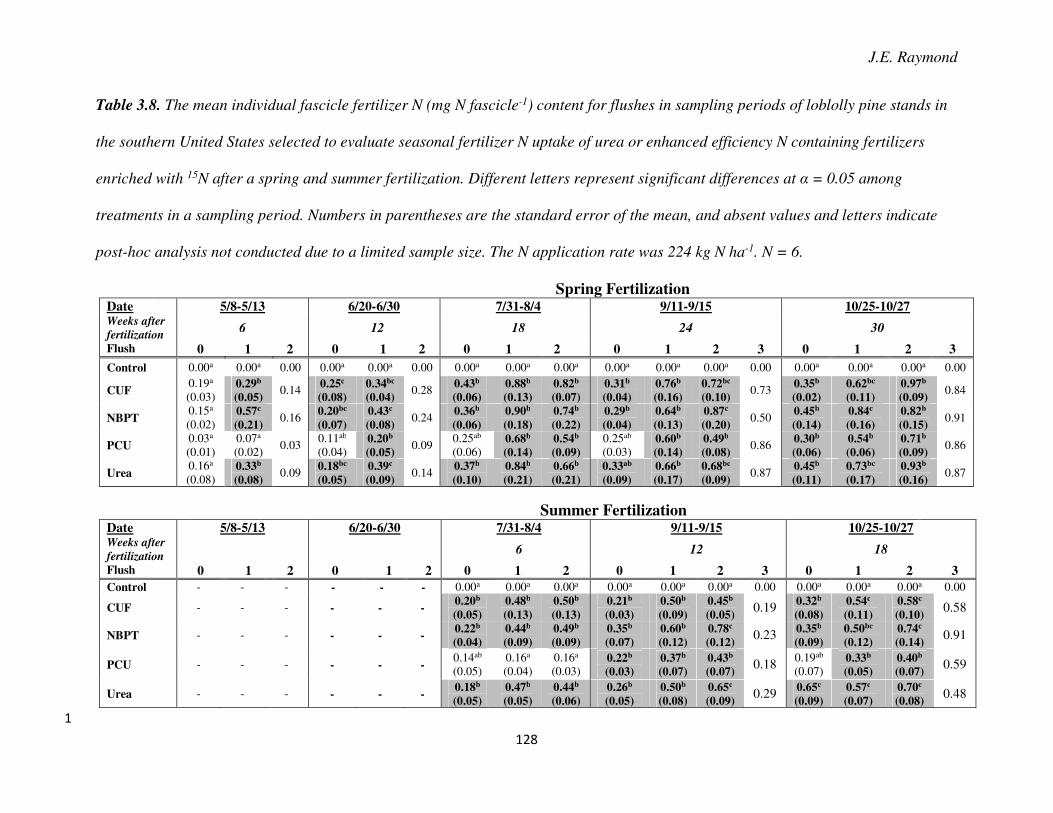
J.E. Raymond
128
Table 3.8. The mean individual fascicle fertilizer N (mg N fascicle-1) content for flushes in sampling periods of loblolly pine stands in
the southern United States selected to evaluate seasonal fertilizer N uptake of urea or enhanced efficiency N containing fertilizers
enriched with 15N after a spring and summer fertilization. Different letters represent significant differences at α = 0.05 among
treatments in a sampling period. Numbers in parentheses are the standard error of the mean, and absent values and letters indicate
post-hoc analysis not conducted due to a limited sample size. The N application rate was 224 kg N ha-1. N = 6.
Spring Fertilization Date 5/8-5/13 6/20-6/30 7/31-8/4 9/11-9/15 10/25-10/27 Weeks after
fertilization 6 12 18 24 30
Flush 0 1 2 0 1 2 0 1 2 0 1 2 3 0 1 2 3
Control 0.00a 0.00a 0.00 0.00a 0.00a 0.00 0.00a 0.00a 0.00a 0.00a 0.00a 0.00a 0.00 0.00a 0.00a 0.00a 0.00
CUF 0.19a (0.03)
0.29b
(0.05) 0.14 0.25c
(0.08)
0.34bc
(0.04) 0.28 0.43b
(0.06)
0.88b
(0.13)
0.82b
(0.07)
0.31b
(0.04)
0.76b
(0.16)
0.72bc
(0.10) 0.73 0.35b
(0.02)
0.62bc
(0.11)
0.97b
(0.09) 0.84
NBPT 0.15a (0.02)
0.57c
(0.21) 0.16
0.20bc
(0.07)
0.43c
(0.08) 0.24
0.36b
(0.06)
0.90b
(0.18)
0.74b
(0.22)
0.29b
(0.04)
0.64b
(0.13)
0.87c
(0.20) 0.50
0.45b
(0.14)
0.84c
(0.16)
0.82b
(0.15) 0.91
PCU 0.03a (0.01)
0.07a (0.02)
0.03 0.11ab (0.04)
0.20b
(0.05) 0.09
0.25ab (0.06)
0.68b
(0.14)
0.54b
(0.09)
0.25ab (0.03)
0.60b
(0.14)
0.49b
(0.08) 0.86 0.30b
(0.06)
0.54b
(0.06)
0.71b
(0.09) 0.86
Urea 0.16a (0.08)
0.33b
(0.08) 0.09
0.18bc
(0.05)
0.39c
(0.09) 0.14
0.37b
(0.10)
0.84b
(0.21)
0.66b
(0.21)
0.33ab
(0.09)
0.66b
(0.17)
0.68bc
(0.09) 0.87
0.45b
(0.11)
0.73bc
(0.17)
0.93b
(0.16) 0.87
Summer Fertilization
Date 5/8-5/13 6/20-6/30 7/31-8/4 9/11-9/15 10/25-10/27 Weeks after
fertilization 6 12 18
Flush 0 1 2 0 1 2 0 1 2 0 1 2 3 0 1 2 3
Control - - - - - - 0.00a 0.00a 0.00a 0.00a 0.00a 0.00a 0.00 0.00a 0.00a 0.00a 0.00
CUF - - - - - - 0.20b
(0.05)
0.48b
(0.13)
0.50b
(0.13)
0.21b
(0.03) 0.50b
(0.09)
0.45b
(0.05) 0.19 0.32b
(0.08)
0.54c
(0.11)
0.58c
(0.10) 0.58
NBPT - - - - - - 0.22b
(0.04)
0.44b
(0.09) 0.49b
(0.09) 0.35b
(0.07) 0.60b
(0.12) 0.78c
(0.12) 0.23 0.35b
(0.09)
0.50bc
(0.12)
0.74c
(0.14) 0.91
PCU - - - - - - 0.14ab (0.05)
0.16a (0.04)
0.16a (0.03)
0.22b
(0.03) 0.37b
(0.07) 0.43b
(0.07) 0.18 0.19ab
(0.07) 0.33b
(0.05) 0.40b
(0.07) 0.59
Urea - - - - - - 0.18b
(0.05)
0.47b
(0.05)
0.44b
(0.06) 0.26b
(0.05) 0.50b
(0.08) 0.65c
(0.09) 0.29 0.65c
(0.09)
0.57c
(0.07) 0.70c
(0.08) 0.48
1
J.E. Raymond
129
Chapter 4. Understanding the fate of applied fertilizer nitrogen in mid-rotation
loblolly pine plantations (Pinus taeda L) of the southern United States using stable isotopes
Abstract
The recovery of applied fertilizer nitrogen (N) following surface application of urea and
three enhanced efficiency N containing fertilizers (EEFs) were compared in two studies (Study 1,
Study 2) at eighteen thinned mid-rotation loblolly pine stands (Pinus taeda L.) across the
southern United States. All fertilizer treatments were labeled with 15N (~370 permil, 0.5 AP) and
applied during two different seasons (spring, summer) in Study 1 in 2011, and a single season
(spring) in Study 2 in 2012 to 100 m2 circular plots. After N fertilization, all ecosystem
components were sampled at the end of a single growing season to determine the ecosystem
partitioning of fertilizer N. Total fertilizer N recovery for each treatment was determined using a
mass balance calculation for individual ecosystem components. Significantly more fertilizer N
was recovered for all EEFs compared to urea for both Study 1 and Study 2, although there were
no differences among EEFs. There were no differences in fertilizer N recovery between the
season of application for Study 1. For Study 1, total fertilizer N recovery ranged from 78.8% to
82.1% for EEFs compared to 64.6% for urea, and for Study 2 total fertilizer N recovery ranged
from 77.1% to 79.5% for EEFs compared to 55.5% for urea. Most of the fertilizer N recovered
for all treatments was in the loblolly pines or soil. Recovery in loblolly pine for urea was 34.8%
for Study 1 and 33.8% for Study 2. For the EEFs, fertilizer N recovery in loblolly pines for Study
1 ranged from 38.5% to 49.9%, and in Study 2 ranged from 33.2% to 42.1%. There was an
increasing amount of fertilizer N recovered with EEFs in the soil for both studies (Study 1 =

J.E. Raymond
130
30.5% to 38.7%, Study 2 = 35.5% to 42.5%) compared to urea (Study 1 = 28.4%, Study 2 =
20.5%). This research highlights increased fertilizer N recovery and ecosystem partitioning of
fertilizer N for EEFs compared to urea in southern loblolly pine plantations, potentially
increasing fertilizer N use efficiency in these pine plantations.
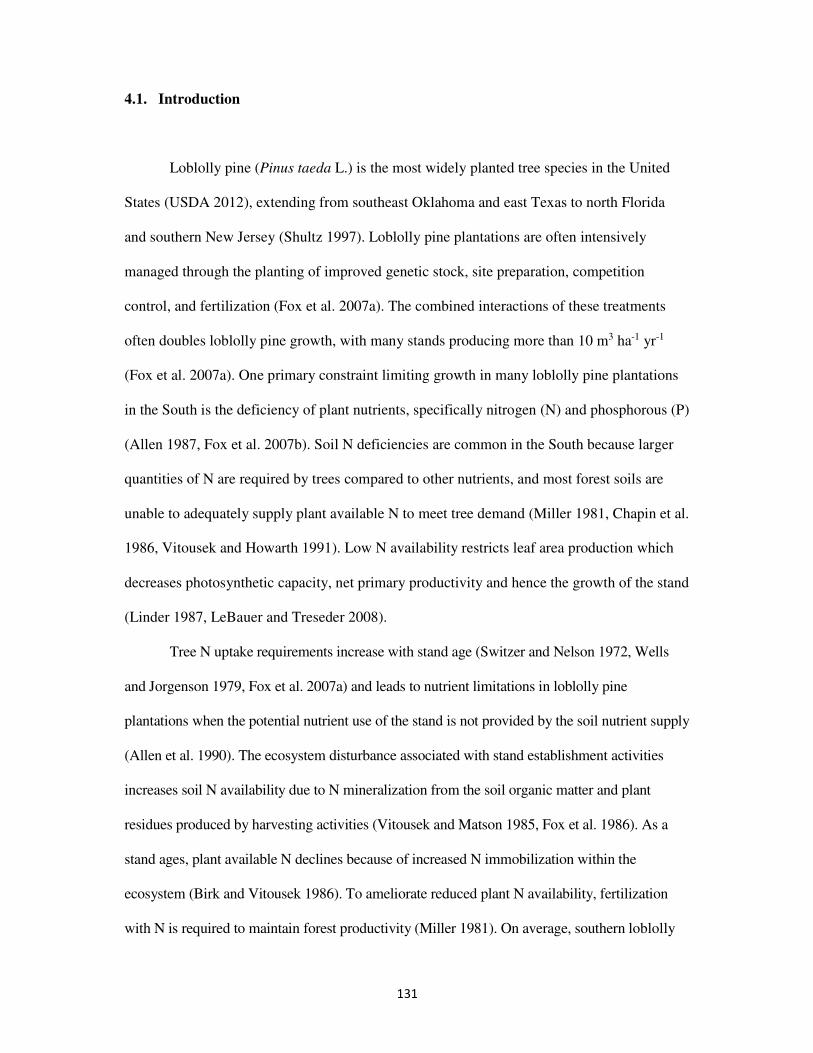
131
4.1. Introduction
Loblolly pine (Pinus taeda L.) is the most widely planted tree species in the United
States (USDA 2012), extending from southeast Oklahoma and east Texas to north Florida
and southern New Jersey (Shultz 1997). Loblolly pine plantations are often intensively
managed through the planting of improved genetic stock, site preparation, competition
control, and fertilization (Fox et al. 2007a). The combined interactions of these treatments
often doubles loblolly pine growth, with many stands producing more than 10 m3 ha-1 yr-1
(Fox et al. 2007a). One primary constraint limiting growth in many loblolly pine plantations
in the South is the deficiency of plant nutrients, specifically nitrogen (N) and phosphorous (P)
(Allen 1987, Fox et al. 2007b). Soil N deficiencies are common in the South because larger
quantities of N are required by trees compared to other nutrients, and most forest soils are
unable to adequately supply plant available N to meet tree demand (Miller 1981, Chapin et al.
1986, Vitousek and Howarth 1991). Low N availability restricts leaf area production which
decreases photosynthetic capacity, net primary productivity and hence the growth of the stand
(Linder 1987, LeBauer and Treseder 2008).
Tree N uptake requirements increase with stand age (Switzer and Nelson 1972, Wells
and Jorgenson 1979, Fox et al. 2007a) and leads to nutrient limitations in loblolly pine
plantations when the potential nutrient use of the stand is not provided by the soil nutrient supply
(Allen et al. 1990). The ecosystem disturbance associated with stand establishment activities
increases soil N availability due to N mineralization from the soil organic matter and plant
residues produced by harvesting activities (Vitousek and Matson 1985, Fox et al. 1986). As a
stand ages, plant available N declines because of increased N immobilization within the
ecosystem (Birk and Vitousek 1986). To ameliorate reduced plant N availability, fertilization
with N is required to maintain forest productivity (Miller 1981). On average, southern loblolly
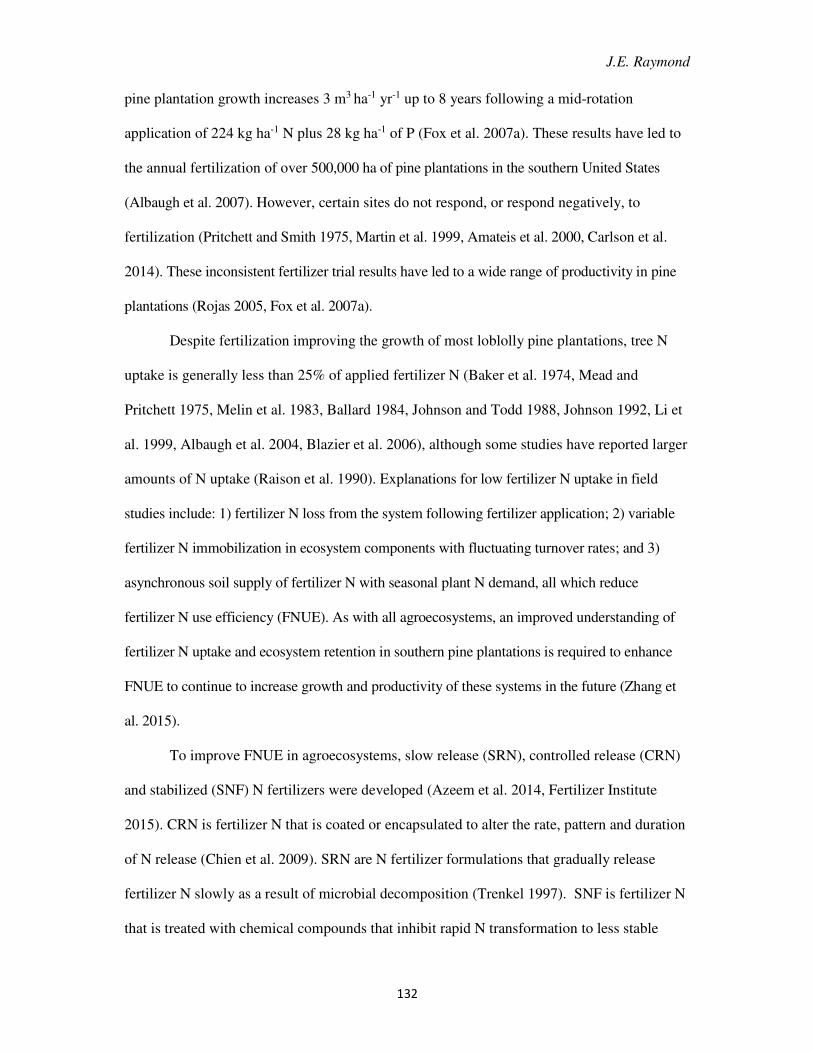
J.E. Raymond
132
pine plantation growth increases 3 m3 ha-1 yr-1 up to 8 years following a mid-rotation
application of 224 kg ha-1 N plus 28 kg ha-1 of P (Fox et al. 2007a). These results have led to
the annual fertilization of over 500,000 ha of pine plantations in the southern United States
(Albaugh et al. 2007). However, certain sites do not respond, or respond negatively, to
fertilization (Pritchett and Smith 1975, Martin et al. 1999, Amateis et al. 2000, Carlson et al.
2014). These inconsistent fertilizer trial results have led to a wide range of productivity in pine
plantations (Rojas 2005, Fox et al. 2007a).
Despite fertilization improving the growth of most loblolly pine plantations, tree N
uptake is generally less than 25% of applied fertilizer N (Baker et al. 1974, Mead and
Pritchett 1975, Melin et al. 1983, Ballard 1984, Johnson and Todd 1988, Johnson 1992, Li et
al. 1999, Albaugh et al. 2004, Blazier et al. 2006), although some studies have reported larger
amounts of N uptake (Raison et al. 1990). Explanations for low fertilizer N uptake in field
studies include: 1) fertilizer N loss from the system following fertilizer application; 2) variable
fertilizer N immobilization in ecosystem components with fluctuating turnover rates; and 3)
asynchronous soil supply of fertilizer N with seasonal plant N demand, all which reduce
fertilizer N use efficiency (FNUE). As with all agroecosystems, an improved understanding of
fertilizer N uptake and ecosystem retention in southern pine plantations is required to enhance
FNUE to continue to increase growth and productivity of these systems in the future (Zhang et
al. 2015).
To improve FNUE in agroecosystems, slow release (SRN), controlled release (CRN)
and stabilized (SNF) N fertilizers were developed (Azeem et al. 2014, Fertilizer Institute
2015). CRN is fertilizer N that is coated or encapsulated to alter the rate, pattern and duration
of N release (Chien et al. 2009). SRN are N fertilizer formulations that gradually release
fertilizer N slowly as a result of microbial decomposition (Trenkel 1997). SNF is fertilizer N
that is treated with chemical compounds that inhibit rapid N transformation to less stable
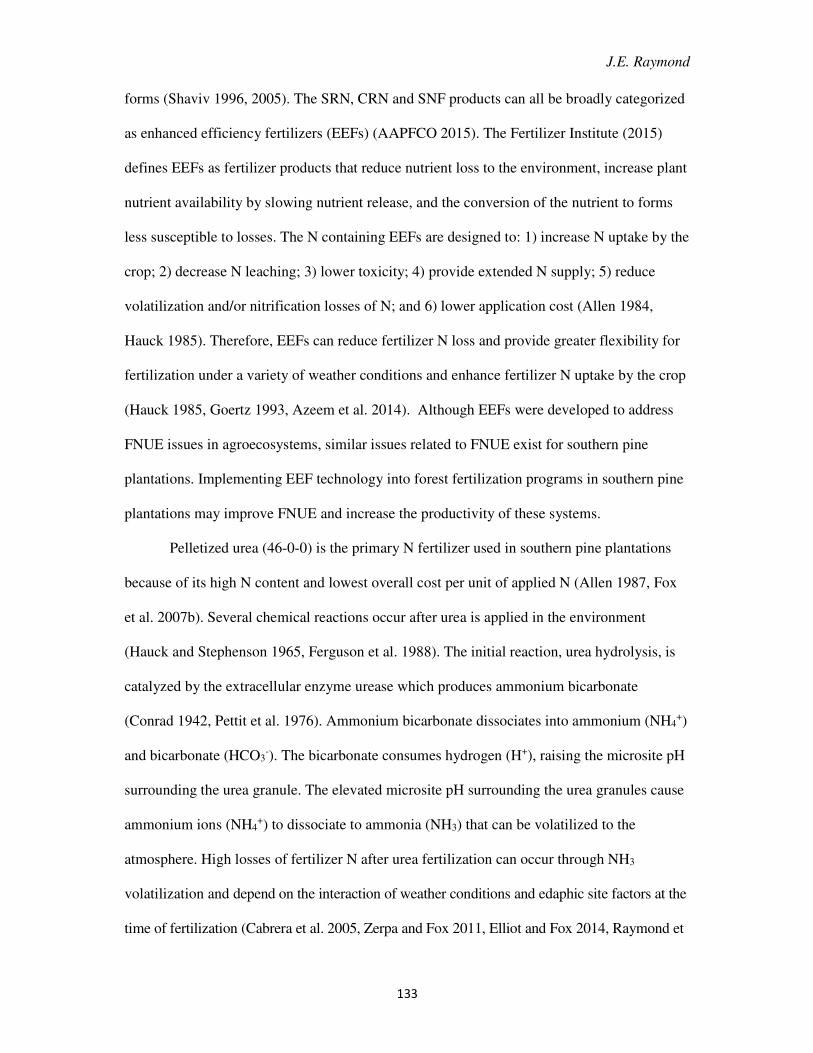
J.E. Raymond
133
forms (Shaviv 1996, 2005). The SRN, CRN and SNF products can all be broadly categorized
as enhanced efficiency fertilizers (EEFs) (AAPFCO 2015). The Fertilizer Institute (2015)
defines EEFs as fertilizer products that reduce nutrient loss to the environment, increase plant
nutrient availability by slowing nutrient release, and the conversion of the nutrient to forms
less susceptible to losses. The N containing EEFs are designed to: 1) increase N uptake by the
crop; 2) decrease N leaching; 3) lower toxicity; 4) provide extended N supply; 5) reduce
volatilization and/or nitrification losses of N; and 6) lower application cost (Allen 1984,
Hauck 1985). Therefore, EEFs can reduce fertilizer N loss and provide greater flexibility for
fertilization under a variety of weather conditions and enhance fertilizer N uptake by the crop
(Hauck 1985, Goertz 1993, Azeem et al. 2014). Although EEFs were developed to address
FNUE issues in agroecosystems, similar issues related to FNUE exist for southern pine
plantations. Implementing EEF technology into forest fertilization programs in southern pine
plantations may improve FNUE and increase the productivity of these systems.
Pelletized urea (46-0-0) is the primary N fertilizer used in southern pine plantations
because of its high N content and lowest overall cost per unit of applied N (Allen 1987, Fox
et al. 2007b). Several chemical reactions occur after urea is applied in the environment
(Hauck and Stephenson 1965, Ferguson et al. 1988). The initial reaction, urea hydrolysis, is
catalyzed by the extracellular enzyme urease which produces ammonium bicarbonate
(Conrad 1942, Pettit et al. 1976). Ammonium bicarbonate dissociates into ammonium (NH4+)
and bicarbonate (HCO3-). The bicarbonate consumes hydrogen (H+), raising the microsite pH
surrounding the urea granule. The elevated microsite pH surrounding the urea granules cause
ammonium ions (NH4+) to dissociate to ammonia (NH3) that can be volatilized to the
atmosphere. High losses of fertilizer N after urea fertilization can occur through NH3
volatilization and depend on the interaction of weather conditions and edaphic site factors at the
time of fertilization (Cabrera et al. 2005, Zerpa and Fox 2011, Elliot and Fox 2014, Raymond et
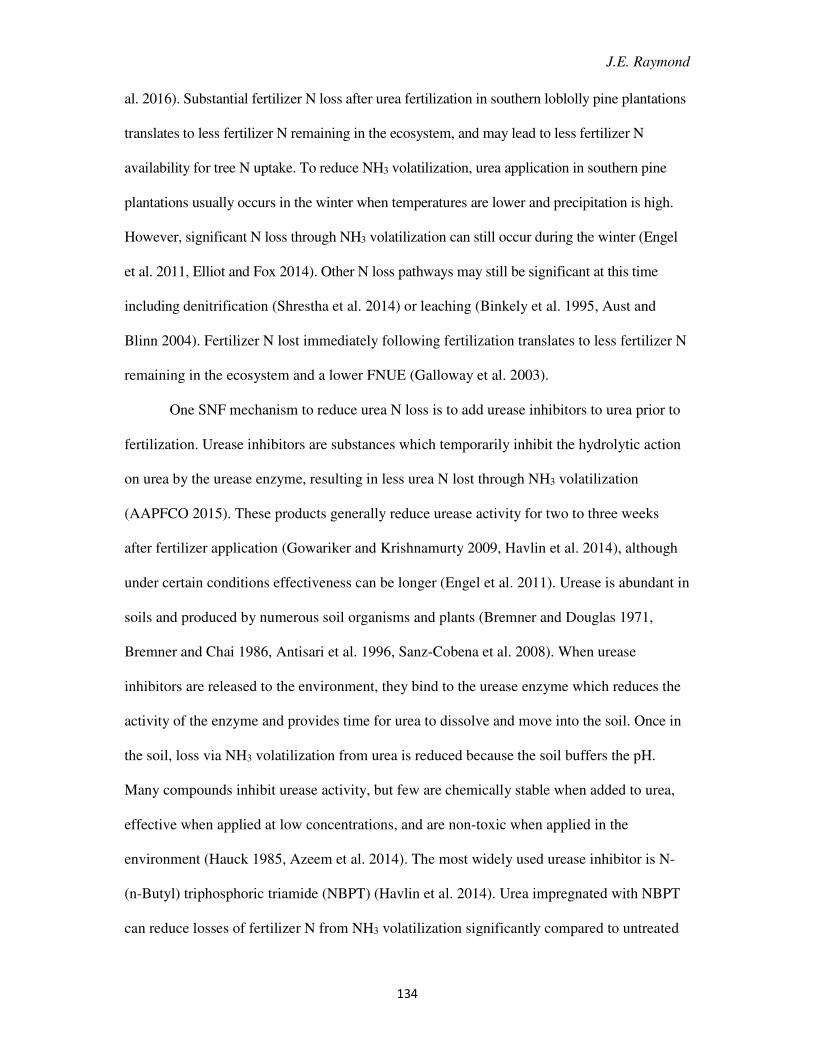
J.E. Raymond
134
al. 2016). Substantial fertilizer N loss after urea fertilization in southern loblolly pine plantations
translates to less fertilizer N remaining in the ecosystem, and may lead to less fertilizer N
availability for tree N uptake. To reduce NH3 volatilization, urea application in southern pine
plantations usually occurs in the winter when temperatures are lower and precipitation is high.
However, significant N loss through NH3 volatilization can still occur during the winter (Engel
et al. 2011, Elliot and Fox 2014). Other N loss pathways may still be significant at this time
including denitrification (Shrestha et al. 2014) or leaching (Binkely et al. 1995, Aust and
Blinn 2004). Fertilizer N lost immediately following fertilization translates to less fertilizer N
remaining in the ecosystem and a lower FNUE (Galloway et al. 2003).
One SNF mechanism to reduce urea N loss is to add urease inhibitors to urea prior to
fertilization. Urease inhibitors are substances which temporarily inhibit the hydrolytic action
on urea by the urease enzyme, resulting in less urea N lost through NH3 volatilization
(AAPFCO 2015). These products generally reduce urease activity for two to three weeks
after fertilizer application (Gowariker and Krishnamurty 2009, Havlin et al. 2014), although
under certain conditions effectiveness can be longer (Engel et al. 2011). Urease is abundant in
soils and produced by numerous soil organisms and plants (Bremner and Douglas 1971,
Bremner and Chai 1986, Antisari et al. 1996, Sanz-Cobena et al. 2008). When urease
inhibitors are released to the environment, they bind to the urease enzyme which reduces the
activity of the enzyme and provides time for urea to dissolve and move into the soil. Once in
the soil, loss via NH3 volatilization from urea is reduced because the soil buffers the pH.
Many compounds inhibit urease activity, but few are chemically stable when added to urea,
effective when applied at low concentrations, and are non-toxic when applied in the
environment (Hauck 1985, Azeem et al. 2014). The most widely used urease inhibitor is N-
(n-Butyl) triphosphoric triamide (NBPT) (Havlin et al. 2014). Urea impregnated with NBPT
can reduce losses of fertilizer N from NH3 volatilization significantly compared to untreated
J.E. Raymond
135
urea (Engel et al. 2011, Raymond et al. 2016) and may translate to improved productivity for
desired species (Engel et al. 2011).
The CRN products generally have a urea granule base which is initially coated with a
compound (i.e. sulfur (S), boron, (B), copper (Cu)) and additionally sealed with a wax-like
substance to fill imperfections (Chien et al. 2009). Fertilizer N release from CRN depends on
the thickness and coating quality (Allen 1984). As the coating degrades in the environment,
cracks develop in the coating allowing moisture to enter the product, and urea dissolution is
initiated. Urea N release to the environment is slowed by the coating compared to uncoated
urea. The substrate coating of CRN may reduce urease activity, and CRNs may also be
impregnated with urease or nitrification inhibitors to slow loss mechanisms as urea N is
released to the environment. Additionally, CRN products may include other nutrients in the
coatings to address additional nutrient deficiencies.
An alternative CRN approach encapsulates fertilizer N (generally urea) in a semi-
permeable polymer coating. The coatings have small pores which allow water to enter the
capsules. As water enters the CRN product, urea dissolution occurs, the capsule expands and
the resulting internal pressure of the capsule forces fertilizer N solution into the environment
through diffusion (Shaviv 2005). Because of the low mass of the polymer coatings, these
products do not significantly reduce the N percentage in the product as may occur with the
aforementioned CRN products (Chien et al. 2009). Release patters for polymer coated CRN
products are related to the type of coating, soil moisture, temperature, relative humidity,
precipitation, pH, and microbial activity (Christianson 1988, Shoji et. al. 2001, Shaviv 2005).
Although tree growth is often N limited, forest soils contain large quantities of N,
most of which is unavailable for plant uptake (Fisher and Binkley 2000). Because of the large
amount of N present in forest soils, ranging from 2 to 7 Mg ha-1, it is difficult to distinguish
changes in soil N following a single or multiple applications of fertilizer N, which typically
J.E. Raymond
136
adds only 150 kg ha-1 to 250 kg ha-1 of N (Fisher and Binkley 2000, Flint 2007, Kiser and Fox
2014). However, fertilizers enriched with the stable isotope 15N can be used to trace the fate
of fertilizer N in the ecosystem to improve our understanding of mechanisms and cycling of
applied N (Knowles and Blackburn 1993, Nadelhoffer and Fry 1994, Robinson 2001,
Dawson et al. 2002).
Numerous 15N tracer studies have been conducted in agroecosystems to improve our
understanding of fertilizer N cycling in crop systems (Hauck and Bystrom 1971). Although
research using 15N to trace the fate of fertilizer N has been conducted in forest, most recent
work with 15N in forest ecosystems has focused on the natural cycling of N (Currie and
Nadelhoffer 1999, Dinkelmeyer et al. 2003, Nadelhoffer et al. 2004) and/or the potential
negative effects of increased N deposition from industrialization (Tietema et al. 1998,
Templar et al. 2012) in natural systems. Research using 15N enriched fertilizers to study
FNUE in intensively managed forest plantations have been surprisingly limited (Hauck 1968,
Mead and Pritchett 1975, Melin et al. 1983, Chang et al. 1996, Bubb et al. 1999, Werner
2014).
Using 15N enriched fertilizers to study fertilizer N uptake and ecosystem fate in
southern pine plantations will improve our fundamental understanding of the fate of fertilizer
N in these systems. Combined with enhanced efficiency fertilizer technology, this improved
understanding will increase FNUE efficiency in southern pine plantations into the future. The
statistical hypotheses for this research are:
HO1: There are no differences in the total fertilizer N recovery between urea and the
enhanced efficiency N containing fertilizers.
HO2: There are no differences in total fertilizer N recovery between urea and the enhanced
efficiency N containing fertilizers between a spring and summer fertilizer application.
J.E. Raymond
137
HO3: There are no differences in the total fertilizer N recovery between urea and the
enhanced efficiency N containing fertilizers for each primary ecosystem component.
4.2. Methods
4.2.1. Experimental Design and Site Description
Two separate experiments (Study 1, Study 2) were designed to test differences of total
fertilizer N recovery among fertilizer treatments using urea and three EEFs in southern
loblolly pine plantations. Study 1 (2011) used a split plot complete block design to test
differences between five fertilizer treatments (main plots) at two different application seasons
(split plot). Five treatments (CUF, NBPT, PCU, urea, control) were applied at six sites during
2011 in two separate seasons (spring: March-April; summer: June) in mid-rotation loblolly
pine plantations across the southern United States (Figure 4.1). The five fertilizer treatments
were the main plots with single replication at each individual site. Each individual site served
as a block. The split plot was the application season (spring vs. summer). Study 2 (2012)
expanded the geographic scope of Study 1 and evaluated the same five treatments at 12
additional sites in one application season (spring) (Figure 4.1). Study 2 was a complete block
design where fertilizer treatments served as the treatment plots with single replication at each
individual site, and each individual site served as a block. Selected physical site
characteristics of the sites used in Study 1 and Study 2 are described in Tables 4.1 and 4.2,
and selected soil chemical and physical data is detailed in Table 4.3.
4.2.2. Fertilizer Treatments
The five treatments were used in both Study 1 and Study 2. The five treatments were:
1) urea; 2) urea impregnated with N-(n-Butyl) thiophosphoric triamide (NBPT); 3) urea
J.E. Raymond
138
impregnated with NBPT and coated with monoammonium phosphate (CUF); 4) urea coated
with a polymer (PCU); and 5) a control treatment where no fertilizer N was added. Urea (46-
0-0) was the conventional N fertilizer used because of its common use in southern forests.
The enhanced efficiency fertilizers (EEFs) tested in this study were developed to reduce NH3
volatilization and release fertilizer N slowly to the environment. In the NBPT treatment, urea
(46-0-0) granules were impregnated with N-(n-butyl) thiophosphoric triamide at a rate of
26.7% by weight to inhibit urease activity. In the CUF treatment (39-9-0), urea granules were
impregnated with NBPT and coated with an aqueous binder containing a boron and copper
sulfate solution to slow the release of N to the environment. A coating of monoammonium
phosphate was then added to provide P. The PCU (44-0-0) treatment had a polymer coating
covering urea granules with pore openings designed to slowly release N (~80%) over a 120
day period. The application rate for all treatments was equivalent to 224 kg N ha-1. Because
the CUF treatment contained P in the monoammonium phosphate coating, P was added to the
other fertilizer treatment at the equivalent rate of 28 kg P ha-1 using triple superphosphate
(TSP). The urea for all treatments was enriched with the stable isotope 15N (~370‰, 0.5 AP)
(Nadelhoffer and Frye 1994). All individual fertilizer treatments for both studies were hand
broadcast applied to individual 100m2 circular plots described below.
4.2.3. Experimental Method- Field Sampling – Pre-treatment
Five 100 m2 circular plots were installed at each site for each application season for
both studies in areas with similar stand, soils and landscape characteristics and a minimum
distance of 30.5 m from individual plots (Figure 4.2). The plot center was located equidistant
between two co-dominant loblolly pine trees with similar height (HT) and diameter (DBH).
After plot installation and prior to treatment application, the HT and DBH was measured for
all trees greater than 2.54 cm DBH including coniferous and deciduous species. Percent cover
J.E. Raymond
139
(PC) was ocular estimated for each of the following understory strata: 1) sapling; 2) shrub; 3)
vine; and 4) herbaceous. Sapling and shrub strata were identified by species. Foliage, fine (<
2 cm) and coarse (> 2 cm) branches were sampled from the two central crop trees from the
upper 1/3rd of the canopy. Foliage (if present) and branches were sampled from individual
species in the sapling and shrub strata. Vines and herbaceous plants were sampled by
composite for respective strata. The forest floor, or O horizon (Oi + Oe + Oa), was sampled
using a 0.07 m2 circular frame at four randomly selected areas and composited. The mineral
soil was sampled with a push-tube auger at 8 random locations for two depths (0-15 cm, 15-
30 cm) and composited by depth. Root samples of the mineral soil was composited from four
random locations with a bulk density sample corer (AMS Inc.) up to a 30 cm depth. Two
circular litterfall traps were randomly placed in each plot to sample litterfall after N
fertlization. Bulk density samples of the 0-15 cm and 15-30 cm depths of mineral soil was
determined for each individual plot using a bulk density sample corer (AMS Inc.).
4.2.4. Experimental Method- Field Sampling – Post-treatment
For both studies, the individual fertilizer N treatments were randomly applied to the
individual 100m2 circular plots on a single day for each application season at each individual
site. The spring application date for both studies was between March 26 to April 8, and
summer application in Study 1 was from June 18 to June 30. All plots were resampled
between November 1st and March 31st at the end of the growing season in both studies using
the same procedures as the pre-treatment sampling. In addition, litterfall was collected from
traps and composited in each plot. One central crop tree per plot was harvested and separated
into the following components: 1) foliage; 2) fine branches; 3) coarse branches; 4) dead
branches; and 5) stem. Each biomass component was weighed in the field to obtain green
weights. Subsamples of each biomass component were returned to the lab and dried to
J.E. Raymond
140
determine moisture content which was used to convert biomass to a dry weight basis. Stem
samples (cookies) were cut at DBH, the base of the live crown (HLC), and at mid-crown
(HMC). The sapling stratum, if present, was divided in 2.54 cm individual species diameter
classes, and one tree from each diameter class was harvested and weighed in the field for
green weights. Each plot was divided in 32 equal wedge sections, and one section was
randomly selected to sample the entire shrub, vine and herbaceous strata. Shrubs were
divided by species whereas vine and herbaceous strata were composited in their respective
strata. Samples from each component were put in separate labeled paper lawn and grocery
bags and returned to the laboratory for processing.
4.2.5. Experimental Method - Laboratory Processing
All biomass samples were dried in a forced air oven at 60°C until samples achieved a
constant weight. Litterfall was separated into the subcategories of pine needles, deciduous
leaves, fine branches, coarse branches, bark and unidentifiable litterfall. The stem cookies
collected at DBH were subsampled for bark, wood in the current year of growth when
treatment was applied (CGR), and all wood composited from all the previous growth prior to
fertilizer treatment (PGR). Roots were washed from mineral soil with an elutriation system
and separated into fine (<2 mm) and coarse (>2 mm) and oven dried. The O horizon samples
were sieved through a 6 mm sieve and mineral soil was sieved through a 2 mm sieve. Soil
chemical data presented in Table 4.3 was determined through the Mehlich I procedure at the
Virginia Tech Soil Testing Laboratory.
All individual plant material, litterfall and O horizon samples were initially coarse
ground with a Wiley Mill to pass a 2 mm sieve. Individual samples were then ground to a fine
powder in a ball mill (Retsch® Mixer Mill MM 200, Haan, Germany) with all individual
organic substrate samples ball milled for 1 minute at 25 revolutions per second (rps). Mineral
J.E. Raymond
141
soil samples were ball milled for 2 minutes at 25 rps. After ball milling, individual
homogenized samples were put in separate tin capsules and weighed on a Mettler-Toledo©
MX5 microbalance (Mettler-Toledo, Inc., Columbus, OH, USA). Individual samples were
analyzed to determine the 15N/14N isotope ratio, total N and total C on a coupled elemental
analysis-isotope ratio mass spectrometer (IsoPrime 100 EA-IRMS, Isoprime© Ltd.,
Manchester, UK) at the Forest Soils and Plant Nutrition Laboratory at Virginia Polytechnic
Institute and State University (Virginia Tech) between January 2012 and May 2015. All
instrumentation used during the entire process, from initial coarse grinding to weighing on
the microbalance, was cleaned with an ethanol solution and allowed to dry after each
individual sample was processed to reduce cross sample contamination.
4.2.6. Calculation of Fertilizer N Recovery
The amount of total N in each component derived from the added fertilizer labeled
with 15N was calculated using a mass balance tracer technique that compared individual
ecosystem component 15N prior to and 1 year after N fertilization (Powlson and Barraclough
1993, Nadelhoffer and Fry 1994, Nadelhoffer et al. 1995).
Equation [4.1] calculated the individual system component N percent that originated
from the fertilizer N:
[4.1] %N from fertilizer in individual ecosystem component =
((δ15Nfinal - δ15Ninitial) / (δ15Nlabeled - δ15Ninitial)) * (100)
Equations [4.2] to [4.5] determined the percent recovery of fertilizer N for individual
ecosystem components:
[4.2] % 15N from labeled treatment in individual ecosystem component =
((δ15Nsample - δ15Npretreatment) / (δ15Nfertlizer - δ15Npretreatment)) * (100)
[4.3] Total N (g) = (Component dry weight * %N) / (100)
J.E. Raymond
142
[4.4] Fertilizer N in individual ecosystem components (mg)
( (Equation 4.3) * (Equation 4.4.) / (100) *1000)
[4.5] % N originated from fertilizer in individual ecosystem component =
[ (Equation 4.4) / (amount fertilizer applied)] *100
After individual ecosystem component fertilizer N recovery was determined, individual
component fertilizer N recovery was summed per plot to calculate total fertilizer N recovery
for the plot. The fertilizer N recovery value for the individual loblolly pine sampled in each
plot was multiplied by the number of loblolly pine trees in each individual plot to obtain the
total fertilizer N recovery for loblolly pine trees on an individual plot basis. The difference
between the amount of fertilizer N applied to the plot and the amount of fertilizer N
recovered after 1 growing season was considered lost from the system.
4.2.7. Statistical Analysis
Total fertilizer N recovery, expressed as a percentage of fertilizer N applied, was
analyzed using a general linear model (GLM) analysis of variance (ANOVA) with Minitab®
17 (Minitab Inc., State College, Pennsylvania, USA). Percent data not normally distributed
was arcsin transformed prior to analysis. For Study 1, percent fertilizer N recovery (%) was
the response variable for the model, fertilizer treatment (CUF, NBPT, PCU, urea, control)
and season were fixed effects, and site was a random effect in the split plot analysis.
Individual ecosystem components were analyzed using a GLM ANOVA except the analysis
of individual mineral soil depth increments (0-15 cm, 15-30cm) which were analyzed as a
repeated measures ANOVA. For Study 2, percent fertilizer recovery (%) was the response
variable for the model, fertilizer treatment (CUF, NBPT, PCU, urea, control) was the fixed
effect, and site was a random effect in the analysis. Individual ecosystem components were
analyzed using a GLM ANOVA except the analysis of individual mineral soil depth
J.E. Raymond
143
increments (0-15 cm, 15-30cm) which were analyzed as a repeated measures ANOVA. To
determine if site factors (physiographic region, soil drainage, soil texture, etc.) were
correlated with total fertilizer recovery, a GLM ANOVA was also used for analysis. The
percent fertilizer recovery (%) was the response variable for the model, site factors
(physiographic region, soil drainage, soil texture, etc.) were fixed effects, and site was a
random effect in the analysis. All levels of significance were set at α = 0.05 and the P > |t|
values for the treatment means were tested. All post-hoc analysis was conducted with
Tukey’s HSD.
4.3. Results
4.3.1. Study 1 – 2011 Application – Spring vs. Summer
Nitrogen concentrations (g kg-1) in the foliage did not differ between application
season but were greater overall in the fertilized treatments (Table 4.4; In Appendix Figure
A.4.1., Figure A.4.2., Table A.4.1. to Table A.4.7., Table A.4.8) except for the CUF treatment.
Nitrogen concentrations in the foliage increased from 12.3 g kg-1 in the control to 14.1 g kg-1
in CUF (NS – not significant) and 14.4 g kg-1 to 15.0 g kg-1 in the other fertilizer treatments.
There was no difference between application season for N concentrations in the fine
branches, although N concentrations were greater in the fertilized treatments (6.6 g kg-1 to 7.4
g kg-1) compared to the control (4.9 g kg-1) with no differences among the EEFs. There were
no differences in N concentration between the control and the fertilizer treatments for any
other tree or soil component (Table 4.4) except in litterfall for the urea treatment (5.1 g kg-1),
and coarse roots in the urea (6.8 g kg-1) and PCU (7.0 g kg-1) treatments compared to the
unfertilized control (litterfall = 7.9 g kg-1, coarse roots = 8.8 kg g-1) plots.
J.E. Raymond
144
The 15N (‰) signature in all tree and soil components sampled was greater for the
fertilizer treatments compared to the control (Table 4.4). There were no differences in the 15N
values among the fertilizer treatments or between sampling dates for any components of the
loblolly pine trees. The 15N values were greatest in the foliage (83.9‰ to 97.1‰), fine
branches (74.3‰ to 86.9‰) and wood formed in the current growing season following
fertilization (59.3‰ to 73.8‰). The 15N in the current year litterfall was lower than foliage
(29.7‰ to 33.8‰). Wood formed in years prior to the fertilization treatments had lower 15N
(30.7‰ to 36.6‰), whereas the 15N was lowest in bark (15.0‰ to 18.9‰), fine roots (14.0‰
to 24.1‰) and coarse roots (8.5‰ to 15.8‰). In the soil, the 15N was greatest in the O
horizon (65.0‰ to 89.6‰), comparable to the 15N values in the foliage. Conversely, the 15N
signature in the surface 0-15 cm mineral soil in fertilized treatments ranged from 10.2‰ to
18.0‰ compared to the control (3.70‰). In the 15-30 cm mineral soil the 15N values ranged
from 8.5‰ to 11.9‰, with only the CUF treatment being significantly greater than the
control (5.44‰).
There were no differences in fertilizer N recovery in the individual components of
loblolly pine among the different fertilizer treatments (Table 4.4). Fertilizer N recovery in the
trees was greatest in the foliage, ranging from 9.1% to 14.8% of the N applied. Nitrogen
recovery in the other components of the trees was less, averaging 1.5% for fine branches,
4.3% for coarse branches, 1.0% in bark, 1.8% in wood formed in the current year after
fertilization and 3.9% in older wood. Fertilizer N recovery was higher in the fine roots,
averaging 11.1%, but less in the coarse roots which averaged 1.7%. Fertilizer N recovered in
the fresh litterfall was low, averaging 0.4%. In the soil, fertilizer N recovery in the O horizon
averaged 2.8% among the fertilizer treatments. In contrast, fertilizer N recovery in the surface
0-15 cm of the mineral soil was high, ranging from 13.4% in the urea treatment to 31.2% in
J.E. Raymond
145
the PCU treatment. Fertilizer N recover in the mineral soil from 15-30 cm was lower, ranging
from 5.1% to 8.3% among the fertilizer treatments.
There were no differences between the total ecosystem fertilizer N recovery between
the two seasons of application (Table 4.5). Total fertilizer N recovery differed among the N
fertilizer treatments for the combined spring and summer data with greater recovery for all
EEFs (CUF = 76.4%, NBPT = 80.6%, PCU = 76.2%) compared to urea (54.6%) (Figure 4.3)
but no differences among the EEFs. There were slight difference (NS) in the total fertilizer N
recovered in the tree, determined as the sum of N recovery in all aboveground and
belowground portions of the tree, between the treatments (CUF = 37.1%, NBPT = 44.7%,
PCU = 33.2%, urea = 33.8%) (Table 4.5, Table 4.8). Total fertilizer N recovery in the soil
was lower in the urea treatment (20.5%) compared to PCU (42.5%) and CUF (38.9%) but
there were no differences with NBPT (35.5%).
4.3.2. Study 2 – 2012 Application – Spring
Nitrogen concentrations (g kg-1) in the foliage increased (NS) from 12.5 g kg-1 in the
control to between 13.2 g kg-1 and 14.2 g kg-1 for fertilizer treatments (Table 4.6; In Appendix
Table A.4.7.). There was a difference in the N concentrations of fine branches between the
control (5.1 g kg-1) and CUF (7.3 g kg-1) the N concentration of bark between the control (2.1
g kg-1) and CUF (2.9 g kg-1), and for the N concentration in the wood produced for the year of
fertilization between the control (1.8 g kg-1) and CUF (2.9 g kg-1). There were no other
differences in N concentrations between the control and the fertilizer treatments, or among
fertilizer treatments, for any other tree, soil or other ecosystem component (Table 4.6).
The 15N (‰) signature in all of the tree and soil components sampled was greater in
the fertilizer treatments compared to the control, although there were no differences in the 15N
signatures among the individual fertilizer treatments (Table 4.6). For the loblolly pine trees,
J.E. Raymond
146
the 15N was greatest in the foliage (101.6‰ to 126.1‰), fine branches (98.7‰ to 111.8‰),
and wood produced in the current year after fertilization (71.9‰ to 88.1‰). The 15N in the
current year litterfall was lower than foliage (48.6‰ to 55.8‰). Wood formed in years prior
to fertilization had low 15N (34.8‰ to 40.3‰), whereas the 15N values were lowest in bark
(20.5‰ to 22.5‰), fine roots (31.2‰ to 36.1‰) and coarse roots (13.9‰ to 19.0‰). In the
understory, 15N values were high in both the sapling (59.6‰ to 83.3‰) and shrub (55.4‰ to
112.0‰) strata compared to the control (-0.24‰, -3.00‰ respectively). For the soil, there
were no differences among fertilizer treatments. The 15N was greatest in the O horizon for all
fertilizer treatments (55.2‰ to 91.1‰). The 15N signature for fertilizer treatments in the
surface 0-15 cm mineral soil ranged between 15.9‰ to 22.3‰ compared to the control
(3.27‰), whereas in the 15-30 cm mineral soil the 15N values ranged between 11.7‰ to
16.3‰ compared to 5.38‰ for the control (Table 4.6).
Differences did exist in fertilizer N recovery in the individual components of loblolly
pine among the different fertilizer treatments (Table 4.6). Fertilizer N recovery for loblolly
pine trees for all treatments was greatest in the foliage, ranging from 8.1% to 14.8% of the N
applied. More fertilizer N was recovered for foliage for NBPT (14.8%) compared to PCU
(8.1%) and fine branches (NBPT = 4.1%, PCU = 2.6%), with no other differences among
treatments for any other tree component. Fertilizer N recovery in the other components of the
tree was less, averaging 2.9% for coarse branches, 0.6% for bark, 2.2% for wood produced
the year of fertilization, and 4.0% for wood produced prior to fertilization (Table 4.6). There
were differences between fertilizer N recovery in fine roots between CUF (19.2%) and urea
(10.8%) but not for coarse roots (1.7% to 3.8%). The fertilizer N recovered in the litterfall
ranged from 1.4% to 1.8% with no differences among treatments. Fertilizer N recovery in the
soil ranged from 1.2% to 3.8% for the O horizon among treatments. The fertilizer N recovery
in the surface 0-15 cm of the mineral soil was high, ranging from 15.9% in the urea treatment
J.E. Raymond
147
to 24.2% in the PCU treatment. There were no differences in fertilizer N recovery for the 15-
30 cm mineral soil which ranged from 5.4% to 11.3% among the fertilizer treatments.
Total fertilizer N recovery differed among the fertilizer N treatments (Figure 4.4).
There was greater fertilizer N recovery in the EEFs (CUF 82.2%, NBPT 83.4%, PCU 80.7%)
compared to urea (66.2%) but no differences among the EEFs. There was a difference in the
total fertilizer N recovered in the tree, determined as the sum of N recovery in all
aboveground and belowground portions of the tree. For the tree, fertilizer N recovery was
greater in both CUF (47.0%) and NBPT (49.8%) compared to both PCU (38.5%) and urea
(34.8%), with no differences between CUF and NBPT or PCU and urea. For soil, PCU
(38.7%) was greater than urea (28.4%) (Table 4.7 and Table 4.8). For soil, determined as the
sum of N recovery in all both organic and mineral soil components, slight differences (NS)
occurred among treatments (CUF = 32.8%, NBPT = 30.6%, PCU = 38.7%, urea = 28.4%).
4.4. Discussion
Our study focused on assessing the differences in N uptake and ecosystem retention
following N fertilization in loblolly pine plantations of the southern United States. These
differences were assessed by determination of fertilizer N recovery among four different N
containing fertilizers and between different application seasons. By installing a study across
the natural range of loblolly pine we hoped to improve the understanding of fertilizer N
uptake efficiency in these systems through a regional synthesis, compared to a more detailed
analysis at a single site. This study tested the primary hypotheses: 1) whether differences
existed in the total fertilizer N recovery among conventional and enhanced efficiency
fertilizers; 2) if application season caused a difference in fertilizer N recovery among
individual fertilizer treatments; and 3) whether differences existed in the ecosystem
J.E. Raymond
148
partitioning of fertilizer N among conventional and enhanced efficiency fertilizers. Our
overall objective was to improve the fertilizer N use efficiency of southern loblolly pine
plantations.
Our first hypothesis that differences did not exist in total fertilizer N recovery among
individual fertilizer treatments (CUF, NBPT, PCU, urea) was rejected. Total fertilizer N
recovery was significantly greater for the enhanced efficiency fertilizers (CUF, NBPT, PCU)
compared to urea in both studies. Although significantly more fertilizer N was recovered for
enhanced efficiency fertilizers, differences generally did not exist among individual enhanced
efficiency fertilizers. The lower fertilizer N recovery for urea may be due to larger NH3
volatilization losses in the urea treatment compared to the EEFs.
In a companion study, Raymond et al. (2016) used sites from Study 1 and found NH3
volatilization losses following fertilization for urea ranged from 26% to 49% compared to
NH3 volatilization losses following fertilization with the same EEFs used in this research
ranged from 4% to 26%. Other studies have also reported large NH3 volatilization losses
following fertilization with urea (Kissel et al. 2004, Zerpa and Fox 2011). Elliot and Fox
(2014) found NH3 volatilization losses were approximately 50% less following fertilization in
loblolly pine plantations for EEFs compared to urea. When the mean percent NH3
volatilization loss reported by Raymond et al. (2016) are incorporated into the mass balance
for each respective treatment for both Study 1 and Study 2, the percent recovery of the
fertilizer N ranged from 90% to 100%. This evidence indicates that higher fertilizer N loss
through NH3 volatilization for urea compared to EEFs leads to a higher percent recovery of
fertilizer N for the entire ecosystem for the EEFs compared to urea.
Weather variables are often highly correlated with large NH3 volatilization losses
from urea, and include relative humidity exceeding a calculated critical relative humidity
(Elliot and Fox 2014, Raymond et al. 2016), high temperatures (Koelliker and Kissel 1988),
J.E. Raymond
149
high surficial wind speed (Kissel et al. 2004), and low precipitation (Kissel et al. 2004). In the
Raymond et al. (2016) companion study, days when the calculated critical relative humidity
exceeded the relative humidity was correlated with high NH3 volatilization losses for urea but
not for the EEFs. Site edaphic factors, such as the presence of an organic horizon (forest
floor) are also correlated with NH3 volatilization losses for urea application in forested
ecosystems (Cabrera et al. 2005, Kissel et al. 2009, Zerpa and Fox 2011). All sites for both
Study 1 and Study 2 had an O horizon of variable thickness and had a potential influence on
NH3 volatilization.
Although NH3 volatilization loss appears to be the primary loss mechanism in these
studies, leaching (Van Miegroet et al. 1994, Binkley et al. 1995, Lee and Jose 2005) and
denitrification (Shrestha et al. 2014) are also potential pathways for fertilizer N loss. We
indirectly tested the potential leaching loss of fertilizer N by sampling soil in the 15-30 cm
mineral soil and analyzing the sample for 15N. If this loss pathway was important large 15N
signatures would be present and the percent fertilizer N recovery would be significantly
different among treatments and the control, which did not occur. In the 15-30 cm mineral
soil, fertilizer N recovery ranged from 5.1% to 8.3% for Study 1 and 5.4% to 11.3% in Study
2. These results indicate that although some fertilizer N was moving deeper in soil profiles,
the percent loss for leaching was a minor loss pathway one year after fertilization. Another
potential loss pathway, denitrification, was not measured. Recent work examining
denitrification on similar sites found applied N losses through this pathway were low during
spring and summer months (Shrestha et al. 2014), and is typically considered a minor loss
pathway in aerobic forest soils (Bowden et al. 1991). Comparing N losses on well versus
poorly drained soils in our study found no differences in percent recovery of fertilizer N due
to soil drainage class (aerobic versus anaerobic systems), and this result indicates
denitrification is likely a minor loss mechanism. Although losses of fertilizer N through
J.E. Raymond
150
leaching and denitrification may have occurred, we concluded that these loss pathways were
minor in this study and NH3 volatilization was the primary loss pathway for fertilizer N from
these systems.
The second hypothesis that no differences occurred in fertilizer N recovery among
treatments between a spring and summer application was rejected. There was a higher
percentage of fertilizer N recovery in the ecosystem for urea in spring compared to summer,
whereas there were no differences between seasons for the EEFs. As previously stated, a
primary loss mechanism for applied urea N in loblolly pine plantations is NH3 volatilization
(Raymond et al. 2016), with fertilizer N loss generally correlated with weather variables
(Koelliker and Kissel 1988, Kissel et al. 2004, Elliot and Fox 2014, Raymond et al. 2016) and
their interaction with edaphic factors (Cabrera et al. 2005, Kissel et al. 2009, Zerpa and Fox
2011). High losses of fertilizer N from urea can occur regardless of application season
(Raymond et al. 2016). Although losses are generally higher in the summer under humid,
hotter conditions they can also be high in the winter or spring and highly dependent on
weather conditions at the time of fertilizer N application (Koelliker and Kissel 1988, Kissel et
al. 2004, Elliot and Fox 2014). Losses of fertilizer N were lower for EEFs compared to urea
(Raymond et al. 2016) for both seasons in Study 1 which translated to similar N recovery
rates for each EEF treatment between seasons. A likely explanation for the differences in
results between these two studies was Raymond et al. (2016) excluded roots to specifically
focus on loss mechanisms of fertilizer N. This study focused on ecosystem cycling of
fertilizer N and did not exclude roots for plant uptake. It is likely that plant uptake of fertilizer
N was rapid due to the presence of roots in the O horizon and upper mineral soil horizons
(Parker and Van Lear 1995, Adegbidi et al. 2004) and is a partial explanation of the small
increase in fertilizer N recovery for both seasons in Study 1 for urea.
J.E. Raymond
151
We rejected our third hypothesis that there was no difference in the ecosystem
partitioning of fertilizer N among treatments. When individual ecosystem components
(foliage, fine branches, O horizon, etc.) were analyzed separately, differences did occur
among fertilizer treatments for individual ecosystem.
Regardless of the season or treatment, the majority of the fertilizer N was recovered in
either the loblolly pine trees or soil. These results are similar to those of other tracer studies in
a variety of ecosystems (Nadelhoffer et al. 1995, 2004, Tietema et al. 1998, Burke et al. 2002,
Blanes et al. 2002). Yet the results for many of these studies indicate higher amounts of
applied N remaining in the soil and less N uptake for trees. Studies specific to southern
loblolly pine plantations indicate generally low fertilizer N uptake (<25%) by loblolly pine
trees (Baker et al. 1974, Mead and Pritchett 1975, Melin et al. 1983, Ballard 1984, Johnson
and Todd 1988, Johnson 1992, Li et al. 1999, Albaugh et al. 2004, Blazier et al. 2006). Yet
most studies in southern loblolly pine used urea as the fertilizer N source. In this study,
loblolly pine tree fertilizer N uptake of urea was 35% compared to 33% to 50% for all EEFs.
A clear trend exists for increased recovery of fertilizer N in loblolly pine trees for EEFs
compared to urea. Additionally, an increasing amount of fertilizer N was recovered with
EEFs in the soil for both studies (Study 1 = 30.5% to 38.7%, Study 2 = 35.5% to 42.5%)
compared to urea (Study 1 = 28.4%, Study 2 = 20.5%). These differences in the partitioning
of fertilizer N among ecosystem components between EEFs and urea is likely important in
the long term cycling of fertilizer N of loblolly pine plantations. Additional research will be
required to determine if this increase in fertilizer N retention for EEFs compared to urea
translates to an increase in FNUE for southern loblolly pine plantations.
Nitrogen containing fertilizers enriched with 15N can be used to integrate processes,
mechanisms and pathways of applied N in terrestrial ecosystems (Knowles and Blackburn
1993, Robinson 2001, Sulzman 2007) by improving the resolution of the amount of fertilizer
J.E. Raymond
152
N partitioned in ecosystem components. Fertilization studies in southern loblolly pine
plantations (Mead and Pritchett 1975, Albaugh et al. 1998, 2004, Jokela and Martin 2000,
Vogel and Jokela 2011, Carlson et al. 2014) have improved our understanding of loblolly
pine fertilizer response and provided a foundation in understanding the mechanisms and
pathways of applied N cycling in these systems. Yet these studies have generally been unable
to distinguish N originating from fertilizers compared to naturally existing N (Johnson 1992,
Fisher and Binkley 2000, Flint 2007, Kiser and Fox 2012). Differences in soil N between
control and fertilized plots in long term annual N fertilization experiments in loblolly pine
plantations is generally not detectable (Kiser and Fox 2012, Villanueva 2015), but using
fertilizers enriched with stable isotopes can improve the detection and resolution of
ecosystem partitioning and dynamics of N origination from fertilizers.
A primary benefit of this research has been the refinement of understanding
ecosystem fate of fertilizer N by using stable isotopes in mid-rotation southern loblolly pine
stands across an extensive geographic area. The results from this study encompass the entire
region where loblolly pine plantations are operationally fertilized and intensively managed,
and incorporates a large range of edaphic, climatic and stand variables. The results from this
study integrate factors across this entire region, and combined with other fertilizer N studies
in forest ecosystems focused on a smaller region or single site, improve the fundamental
understanding of the ecosystem partitioning of fertilizer N in southern loblolly pine
plantations.
4.5. Conclusions
The primary results for this research were: 1) significantly more fertilizer N was
recovered from the ecosystem for all enhanced efficiency fertilizers compared to urea; 2)
J.E. Raymond
153
differences occurred in the ecosystem partitioning of fertilizer N among treatments; 3) no
differences occurred in the ecosystem partitioning of fertilizer N among treatments between
seasonal fertilizer application; and 4) ecosystem fertilizer N recovery was independent of
edaphic, climatic or stand variables. The reduction of fertilizer N loss using enhanced
efficiency fertilizers compared to urea, regardless of the season of application, translates to an
increase in fertilizer N that remains in the system that is available for plant uptake. This
finding resulted in an increase in fertilizer nitrogen use efficiency for the enhanced efficiency
fertilizers compared to urea. Additional retention of fertilizer N in the soil for enhanced
efficiency fertilizers may also increase fertilizer nitrogen use efficiency into the stand rotation
if this fertilizer N becomes available to the plants, but additional research will be required for
determination.
These findings will help improve and refine management of southern loblolly pine
plantations. If economically viable, the use of enhanced efficiency fertilizers will enable
forest managers to apply fertilizer N during the spring or summer, providing a potentially
more synchronous timing for fertilizer application to seasonal plant demand. Overall, this
research provides a biological foundation for the effectiveness of using enhanced efficiency
fertilizers over the entire range where loblolly pine plantations are operationally viable in the
southern United States to improve fertilizer nitrogen use efficiency.
154
Acknowledgments
This research was primarily supported by the Forest Productivity Cooperative (FPC), the
National Science Foundation Center for Advanced Forest Systems (CAFS) and the United
States Department of Agriculture National Institute of Food and Agriculture McIntire-Stennis
Capacity Grant. We thank David Mitchem for assistance in the laboratory, Andy Laviner and
Eric Carbaugh for field assistance and the numerous work study and seasonal student
employees for both field and laboratory assistance.
155
Literature Cited AAPFCO. 2011. Association of American Plant Food Control Officials. Accessed 1/10/2015.
http://www.aapfco.org/index.html. Adegbidi, H.G., N.B. Comerford, E.J. Jokela, and N.F. Barros. 2004. Root development of
young loblolly pine in Spodosols in south-east Georgia. Soil Sci. Soc. Am. J. 68:596-604.
Albaugh, T.J., H. L. Allen, P. M. Dougherty, and K. H. Johnsen. 2004. Long term growth
responses of loblolly pine to optimal nutrient and water resource availability. For. Ecol. Manage. 192:3-19.
Albaugh, T.A., H.L. Allen, and T.R. Fox. 2007. Historical patterns of forest fertilization in
the southern United States from 1969 to 2004. South. J. Appl. For. 31(3):129-137. Allen, S.E. 1984. Slow-release nitrogen fertilizers. In: Nitrogen in crop production, R.D.
Hauck, editor. American Society of Agronomy. Madison, WI. p. 195-206. Allen, H.L. 1987. Forest fertilizers: nutrient amendment, and productivity, and environmental
impact. J. For. 85: 37-46. Allen, H.L., P.M. Dougherty, and R.G. Campbell. 1990. Manipulation of water and
nutrients- practice and opportunity in southern U.S. pine forests. For. Ecol. Manage. 30:437-453.
Amateis, R. L., J. Liu, M. J. Ducey and H. L. Allen. 2000. Modeling response to midrotation
nitrogen and phosphorus fertilization in loblolly pine plantations. South. J. Appl. For. 24:207-212.
Amponsah, I.G. V.J. Lieffers, P.G. Comeau, S.M. Landha, and S.M. Landhäusser. 2004.
Nitrogen-15 Uptake by Pinus contorta seedlings in relation to phonological stage and season. Scand. J. For. Res. 19:329-338.
Antisari, L.V., C. Marzadori, P. Gioacchini, S. Ricci, and C. Gessa. 1996. Effects of the
urease inhibitor N-(n-butyl) phosphorothioic triamide in low concentrations on ammonia volatilization and evolution of mineral nitrogen. Biol. Fert. Soils. 22:196-201.
Aust, W. M., and C. R. Blinn. 2004. Forestry best management practices for timber
harvesting and site preparation in the eastern United States: an overview of water quality and productivity research during past 20 years. Water Air and Soil Poll. Focus. 4:5-36.
Azeem, B., K. KuShaari, Z.B. Man, A. Basit, and T.H. Thanh. 2014. Review on materials &
methods to produce controlled release coated urea fertilizer. Journal of Controlled Release. 181: 11–21.
Baker, J.B., G.L. Switzer, and L.E. Nelson. 1974. Biomass production and nitrogen recovery
after fertilization of young loblolly pines. Soil Sci. Soc. Am. Proc. 38(6):959 –961.
J.E. Raymond
156
Ballard, R. 1984. Fertilization of plantations. In: Nutrition of plantation forests, G.D. Bowen and E.K.S. Nambiar, editors. Academic Press, London. p. 327-360.
Billings, S.A. and D. D. Richter. 2006. Changes in stable isotopic signatures of soil nitrogen
and carbon during 40 Years of forest development. Oecologia. 148(2): 325-333. Binkley, D., R. Carter, and H.L. Allen. 1995. Nitrogen fertilization practices in forestry. In:
Nitrogen fertilization and the environment, P. Bacon, editor. Marcel Dekker, New York, NY. p. 421-441.
Birk, E.M., and P.M. Vitousek. 1986. Nitrogen availability and nitrogen use efficiency in
loblolly pine stands. Ecology. 67(1):69-79. Blanes, M.C., B.A. Emmett, B. Viñegla, J.A. Carreira. 2012. Alleviation of P limitation
makes tree roots competitive for N against microbes in a N-saturated conifer forest: A test through P fertilization and 15N labelling. Soil Biol. Biochem. 48:51-59.
Blazier, M.A., T.C. Hennessey, P. Dougherty, and R. Campbell. 2006. Nitrogen accumulation
and use by a young loblolly pine plantation in southeast Oklahoma: Effects of fertilizer formulation and date of application. South. J. Appl. For. 30:66-78.
Boomsma, D., and W. Pritchett. 1979. Nitrogen losses from urea, ammonium sulfate, and
ammonium nitrate applications to a slash pine plantation. Proc. Soil Crop Sci. Soc. Fla. 39:679-687.
Bowden, R. D., J. M. Melillo, P. A. Steudler, and J. D. Aber. 1991. Effects of nitrogen
additions on annual nitrous oxide fluxes from temperate forest soils in the northeastern United States. J. Geophys. Res. 96:9321–9328.
Bremner, J.M. and L.A. Douglas. 1971. Inhibition of urease activity in soils. Soil Biol. and
Biochem. 3(4):297-307. Bremner, J. M. and H.S. Chai. 1986. Evaluation of N-butyl phosphorothioic triamide for
retardation of urea hydrolysis in soil. Commun. Soil Sci. Plant Anal. 17(3):337–351. Bubb, K.A., Z. H. Xu, J.A. Simpson, and P.G. Saffigna. 1999. Growth response to fertilization
and recovery of l5N-labelled fertilizer by young hoop pine plantations of subtropical Australia. Nutrient Cycling in Agroecosystems. 54:81-92.
Burke, I. C., and W. K. Lauenroth. 2002. Ecosystem ecology at regional scales. Ecology. 83:
305-306. Cabrera, M.L., D.E. Kissel, N. Vaio, J. R. Craig, J.A. Rema, and L.A. Morris. 2005. Loblolly
pine needles retain urea fertilizer that can be lost as ammonia. Soil Sci. Soc. Am. J. 69(5):1525-1531
Carlson, C. A., T.R. Fox, H.L. Allen, T. J. Albaugh, R.A. Rubilar, and J.L. Stape. 2014. Growth responses of loblolly pine in the southeast united states to midrotation applications of nitrogen, phosphorus, potassium, and micronutrients. For. Sci. 60(1):157-169.
J.E. Raymond
157
Carmona, G.C.B.C., and B.H. Byrnes. 1990. Temperature and low concentration effects of the urease inhibitor N-(n-butyl thiophosphoric triamide (NBPT) on ammonia volatilization from urea. Soil Biol. Biochem. 22(7):933–937. doi:10.1016/0038-0717(90)90132-
Chang, S. X., C.M. Preston, K. McCullough, G. Weetman, and J. Barker. 1996. Effect of
understory competition on distribution and recovery of 15N applied to a western red cedar - western hemlock clear-cut site. Can. J. For. Res. 26:313-321.
Chapin, F.S., P.M. Vitousek, and K. Van Cleve. 1986. The nature of nutrient limitation in
plant-communities. Am Nat 127: 48–58. doi: 10.1086/284466. Chien, S.H., L. I. Prochnow, and H. Cantarella. 2009. Recent developments of fertilizer
production and use to improve nutrient efficiency and minimize environmental impacts. In Advances in Agronomy. 102. Elsevier Inc. pp. 267-322. DOI: 10.1016/S0065-2113(09)0.
Choi, W.J., S.X. Chang, H.L. Allen, D.L. Kelting, H.M Ro. 2005. Irrigation and fertilization
effects on foliar and soil carbon and nitrogen isotope ratios in a loblolly pine stand. For Ecol Man. 213:90–101.
Christianson, C. B. 1988. Factors affecting N release of urea from reactive layer coated urea.
Fertil. Res. 16: 273–284. Conard, J.P. 1942. The occurrence and origin of urease like activities in soils. Soil Sci.
54(5):367-380. Craig, J., and A. Wollum. 1982. Ammonia volatilization and soil nitrogen changes after urea
and ammonium nitrate fertilization of Pinus taeda L. Soil Sci. Soc. Am. J. 46:409–414. doi:10.2136/sssaj1982.03615995004600020040x.
Currie, W.S., and K.J. Nadelhoffer. 1999. Dynamic redistribution of isotopically labeled
cohorts of nitrogen inputs in two temperate forests. Ecosystems. 2:4-18. Dahlgren, R.A. 2006. Soil phases: the liquid phase In: Soils- basic concepts and future
challenges, G. Certini and R. Scalenghe, editors. Cambridge University Press, Cambridge, England. p. 57-74.
Dawson, T.E., S. Mambelli, A.H. Plamboeck, P.H. Templer, and K.P. TuSource. 2002. Stable
isotopes in plant ecology. Annual Review of Ecology and Systematics. 33:507-559. Dinkelmeyer, H., J. Lehmann, A. Renck, L. Trujillo, J. Pereira da Silva Jr., G. Gebauer, and
K. Kaiser. 2003. Nitrogen uptake from 15N-enriched fertilizer by four tree crops in an Amazonian agroforest. Agrofor. Syst. 57:213-224.
Elliot, J.R., and T.R. Fox. 2014. Ammonia volatilization following fertilization with urea or
ureaform in a thinned loblolly pine plantation. Soil Sci. Soc. Am. J. 78:1469–1473. doi:10.2136/sssaj2013.12.0512n.
J.E. Raymond
158
Engel, R., C. Jones, and R. Wallander. 2011. Ammonia volatilization from urea and mitigation by by NBPT following surface application to cold soils. Soil Sci. Soc. Am. J. 75:2348–2357. doi:10.2136/sssaj2011.0229.
Fenn, L.B. and D.E. Kissel. 1976. The influence of cation exchange capacity and depth of
incorporation on ammonia volatilization from ammonium compounds applied to calcareous soils. Soil Sci. Soc. Am. J. 40(3):394-398.
Ferguson, R.B., and D. Kissel. 1986. Effects of drying on ammonia volatilization from
surface-applied urea. Soil Sci. Soc. Am. J. 50(2):485–490. Ferguson, R.B., K.J. McInnes, D.E. Kissel, and E.T. Kanemasu. 1988. A comparison of
methods of estimating ammonia volatilization in the field. Fertilizer Research. Fertilizer Research. 15:55-69.
Fertilizer Institute. Accessed 11/10/2015. https://www.tfi.org/introduction-fertilizer/nutrient-
science/enhanced-efficiency-fertilizers. Fisher, R.F., and D. Binkley. 2000. Ecology and Management of Forest Soils. John Wiley &
Sons. New York, NY. Flint, C.M. 2007. Leaching of nitrogen from the rooting zone of Douglas-fir forests
following urea fertilization and potential impacts on the water quality of Hood Canal. M.S. Thesis, University of Washington, Seattle, WA.
Fox, T.R., J.A. Burger, and R.E. Kreh. 1986. Effects of site preparation on nitrogen dynamics in the southern Piedmont. For. Ecol. Manage. 15(1986):241-256. Fox, T.R. 2000. Sustained productivity in intensively managed forest plantations. For. Ecol.
Manage. 138:187-202. Fox, T.R., E.J. Jokela, and H.L. Allen. 2007a. The development of pine plantation silviculture
in the southern United States. J. For. 105(5):337-347. Fox, T.R., H. L. Allen, T. J. Albaugh, R. Rubilar, and C.A. Carlson. 2007b. Tree nutrition
and forest fertilization of pine plantations in the southern United States. South. J. Appl. For. 31(1):5-11.
Galloway, J.N., J.D. Aber, J.W. Erisman, S.P. Seitzinger, R.W. Howarth, E.B. Cowling, B.J.
Cosby. 2003. The Nitrogen Cascade. Bioscience. 53(4):341-356. Goertz, H.M. 1993. Controlled Release Technology. Kirk-Othmer Encyclopedia of Chemical
Technology, Vol.7. Controlled Release Technology (Agricultural). p. 251-274. Gould, W.D., F.D. Cook, and R.G. Webster. 1973. Factors affecting urea hydrolysis in
several Alberta soils. Plant Soil 38(2):393–401. Gowariker, V., V.N. Krishnamurthy, S. Gowariker, M. Dhanorkar, K. Paranjape. 2009. The
fertilizer encyclopedia. John Wiley & Sons, Inc., Hoboken, NJ.
J.E. Raymond
159
Haase, D.L., R.Rose, J. Trobaugh. 2006. Field performance of three stock sizes of Douglas- fir container seedlings grown with slow-release fertilizer in the nursery growing medium. New Forests. 31:1–24. DOI 10.1007/s11056-004-5396-6.
Hauck, R.D., and H.F. Stephenson. 1965. Nitrification of nitrogen fertilizers. Effect of
nitrogen source, size, and pH of the granule, and concentration. J. Agr. Food Chem. 13(6): 486-492.
Hauck, R.D. 1968. Nitrogen source requirements in different soil-plant systems. p. 47-57. In
Forest fertilization: theory and practice. Muscle Shoals, Alabama: TVA National Fertilizer Development Center.
Hauck, R.D., and M. Bystrom. 1971. 15N- A selected bibliography for agricultural scientists.
The Iowa State University Press, Ames, Iowa. p. 206. Hauck, R.D. 1985. Slow release and bio-inhibitor-amended nitrogen fertilizers. In: Fertilizer
technology and use 3rd Ed., O.P. Engelstad, editor. p. 293-322. Havlin, J.L., S.L. Tisdale, W.L. Nelson, J.D. Beaton. 2014. Soil fertility and fertilizers- an
introduction to nutrient management. 8th Ed. Pearson. Boston, MA. p. 516. Johnson, D.W., D.E. Todd. 1988. Nitrogen fertilization of young yellow poplar and loblolly
pine plantations at differing frequencies. Soil Sci. Soc. Am. J. 52(5):1468 –1477. Johnson, D.W. 1992. Nitrogen retention in forest soils. Journal of Environmental Quality. 21:1-
12. Jokela, E.J. and T.A Martin. 2000. Effects of ontogeny and soil nutrient supply on production,
allocation, and leaf area efficiency in loblolly and slash pine stands. Can. J. For. Res. 30:1511-1524.
Kissel, D., M. Cabrera, N. Vaio, J. Craig, J. Rema, and L. Morris. 2004. Rainfall timing and
ammonia loss from urea in a loblolly pine plantation. Soil Sci. Soc. Am. J. 68:1744–1750. doi:10.2136/sssaj2004.1744
Kissel, D., M.L. Cabrera, N. Vaio, J.R. Craig, J.A. Rema, and L.A. Morris. 2009. Forest floor composition and ammonia loss from urea in a loblolly pine plantation. Soil Sci. Soc. Am. J. 73(2):630–637. doi:10.2136/sssaj2007.0377
Kiser, L.C., and T.R. Fox. 2012. Soil accumulation of nitrogen and phosphorus following
annual fertilization of loblolly pine and sweetgum on sandy sites. Soil Sci. Soc. Am. J. 76:2278-2288.
Knowles, R., and T.H. Blackburn (eds.). 1993. Nitrogen Isotope Techniques. Academic
Press, Inc. New York, NY. Koelliker, J.K., and D.E. Kissel. 1988. Chemical equilibria affecting ammonia volatilization.
In: Ammonia volatilization from urea fertilizers, B.R. Bock and D.E. Kissel, editors. Bull. Y206 National Fertilizer Development Center. Tennessee Valley Authority, Muscle Shoals, AL. p. 37–52.
J.E. Raymond
160
Koopmans, C.J., A. Tietema, and A.W. Boxman. 1996. The fate of 15N enriched throughfall in two coniferous forest stands at different nitrogen deposition levels. Biogeochem. 34:19-44.
Knowles, R., and T.H. Blackburn. 1993. Nitrogen isotope techniques. Academic Press, Inc,
New York, NY. LeBauer, D. S., and K. K. Treseder. 2008. Nitrogen limitation of net primary productivity in
terrestrial ecosystems is globally distributed. Ecology. 89:371–379. Lee, K., and S. Jose. 2005. Nitrate leaching in cottonwood and loblolly pine biomass
plantations along a nitrogen fertilization gradient. Agr. Ecol. Environ. 105:15-623. Li, B., S.E. Mckeand, and H.L. Allen. 1991. Genetic variation in nitrogen use efficiency of
loblolly pine seedlings. For. Sci. 37(2):613– 626. Linder, S. 1987. Responses to water and nutrients in coniferous ecosystems. In: Potentials
and limitations of ecosystems analysis. Ecol. Studies 61, Schulze, E.D., and H.Z. Wolfer (eds.). Springer-Verlag, New York, NY. p. 180–202
Marsh, K.L., G.K. Sims, and R.L. Mulvaney. 2005. Availability of urea to autotrophic
ammonia-oxidizing bacteria as related to the fate of 14C and 15N labeled urea added to soil. Biol Fertil Soils. 42: 137-145. DOI 10.1007/s00374-005-0004-2.
Martin, S.W., R.L. Bailey, and E.J. Jokela. 1999. Growth and yield predictions for lower
Coastal Plain slash pine plantations fertilized at mid-rotation. South. J. Appl. For. 23:39-45.
Mead, D.J., and W. L. Pritchett. 1975. Fertilizer movement in a slash pine ecosystem. 1.
Uptake of N and P and N movement in the soil. Plant Soil. 43:451-465. Melin, J., H. Nommik, U. Lohm, J. Flower-Ellis. 1983. Fertilizer nitrogen budget in a Scots
pine ecosystem attained by using root-isolated plots and 15N technique. Plant and Soil. 74:249-263.
Miller, H.G. 1981. Forest fertilization: Some guiding concepts. Forestry. 54(2):157-157. Nadelhoffer, K.J. and B. Fry. 1994. Nitrogen isotope studies in forest ecosystems. In: Stable
isotopes in ecology and environmental science, K. Lajtha and R.H. Michener, editors. Blackwell Scientific Publications, New York, NY. p. 22-44.
Nadelhoffer, K.J., M.R. Downs, B. Fry, J.D. Aber, A.H. Magill, and J.M. Melillo. 1995. The
Fate of 15 N-Labelled Nitrate Additions to a Northern Hardwood Forest in Eastern Maine, USA. Oecologia. 103(3): 292-301.
Nadelhoffer, K.J., B.P. Colman, W.S. Currie, A. Magill, and J.D. Aber. 2004. Decadal-scale
fates of 15N tracers added to oak and pine stands under ambient and elevated N inputs at the Harvard Forest (USA). For. Ecol. Manage. 196:89-107.
J.E. Raymond
161
Pang, P.C.K. 1985. Distribution and recovery of 15N after fertilization of Douglas-fir saplings with different nitrogen sources. Plant Soil. 84:167-174.
Parker, M.M., D.H. Van Lear. 1995. Soil heterogeneity and root distribution of mature
loblolly pine stands in Piedmont soils. Soil Sci Soc Am J. 60(6):1920-1925. doi:10.2136/sssaj1996.03615995006000060043x
Perakis, S.S., J.E. Compton, and L.O. Hedin. 2005. Nitrogen retention across a gradient of 15N additions to an unpolluted temperate forest soil in Chile. Ecology. 86:96-105.
Pettit, N.M., A.R.J. Smith, R.B. Freedman, and R.G. Burns. 1976. Soil urease: Activity,
stability and kinetic properties. Soil Biol. Biochem. 8(6):479–484. Powlson, D.S., and D. Barraclough. 1993. Mineralization and assimilation in soil-plant
systems. In: R. Knolwes et al., editors, Nitrogen isotope techniques. Academic Press, Inc., New York., NY. p. 209-242.
Pritchett, W.L., W.H. Smith. 1972. Fertilizer response in young slash pine stands. Soil Sci.
Soc. Amer. J. 36(4): 660–663. Raison, R.J., P.K. Khanna, M.J. Connell, and R.A. Falkiner. 1990. Effects of water
availability and fertilization on nitrogen cycling in a stand of Pinus radiate. For. Ecol. Man. 30:31-43.
Raymond, J.E., T.R. Fox, B. Strahm, J. Zerpa. 2016. Ammonia Volatilization following
Nitrogen Fertilization with Enhanced Efficiency Fertilizers and Urea in Loblolly Pine Plantations of the Southern United States. In Review.
Robinson, D. 2001. δ15N as an integrator of the nitrogen cycle. Trends Ecol. Evol. 16:153–
162. Rojas, J.C. 2005. Factors influencing responses of loblolly pine stands to fertilization. PhD
dissertation, North Carolina State Univ., Raleigh, NC. 147 p. Sanz-Cobena, A., T.H. Misselbrook, A. Arce, J.I. Mingot, J.A. Diez, A. Vallejo. 2008. An
inhibitor of urease activity effectively reduces ammonia emissions from soil treated with urea under Mediterranean conditions. Agriculture, Ecosystems and Environment. 126:243–249.
Seely, B., and K. Lajtha. 1997. Application of a 15N tracer to simulate and track the fate of
atmospherically deposited N in the coastal forests of the Waquoit Bay Watershed, Cape Cod, Massachusetts. Oecologia 112:393-402.
Schultz, R.P. 1997. The ecology and culture of loblolly pine (Pinus taeda L.). Agriculture
Handbook #713, USDA Forest Service, Washington, DC. p. 493. Shaviv, A. 1996. Plant response and environmental aspects as affected by rate and pattern of
nitrogen release from controlled release N fertilizers. In: Progress in nitrogen cycling studies, V. Clempt, editor. Kluwer, Netherlands. p. 285-291.
J.E. Raymond
162
Shaviv, A. 2005. Controlled Release Fertilizers. IFA International Workshop on Enhanced-Efficiency Fertilizers, Frankfurt. International Fertilizer Industry Association Paris, France.
Shrestha, R., B.D. Strahm, and E.B. Sucre. 2014. Nitrous oxide fluxes in fertilized Pinus
taeda plantations across a gradient of soil drainage classes. J. Envir. Qual. 43:1823–1832.
Shoji, S., J. Delgado, A. Mosier, and Y. Miura. 2001. Use of controlled release fertilizers and
nitrification inhibitors to increase nitrogen use efficiency and to conserve air and water quality. Commun. Soil Sci. Plant Anal. 32:1051–1070.
Sulzman, E.W. 2005. Stable isotope chemistry and measurement: a primer. p. 1-18. In: Stable
Isotopes in ecology and environmental Science, R. Michener and K. Lajtha, editors. Blackwell Publishing, Malden, MA.
Switzer, C.L., and L.E. Nelson. 1972. Nutrient accumulation and cycling in loblolly pine
(Pinus taeda L.) plantation ecosystems: the first 20 years. Soil Sci. Soc. Am. Proc. 36:143-147.
Templer, P.H., M.C. Mack, F.S. Chapin III, L.M. Christenson, J.E. Compton, H.D. Crook,
W.S. Currie, C.J. Curtis, D.B. Dail, C.M. D’Antonio, B.A. Emmett, H.E. Epstein, C.L. Goodale, P.Gundersen, S.E. Hobbie, K.Holland, D.U. Hooper, B.A. Hungate, S.Lamontagne, K.J. Nadelhoffer, C.W. Osenberg, S.S. Perakis, P.Schleppi, J.Schimel, I.K. Schmidt, M. Sommerkorn, J.S. Poelstra, A.Tietema, W.W. Wessel, and D.R. Zak. 2012. Sinks for nitrogen inputs in terrestrial ecosystems: a meta-analysis of 15N tracer field studies. Ecology. 93(8):1816–1829.
Tietema, A., B.A. Emmett, P. Gundersen, O.J. Kjonaas, and C.J. Koopmans. 1998. The fate
of 15N-labelled nitrogen deposition in coniferous forest ecosystems. For. Ecol. Manage. 101:19-27.
Trenkel, M.E. 2010. Slow-and controlled-release and stabilized fertilizers: an option for
enhancing nutrient use efficiency in agriculture. IFA. International fertilizer industry association.
U.S. Department of Agriculture (USDA), Forest Service. 2012. Future of America’s Forest
and Rangelands: Forest Service 2010 Resources Planning Act Assessment. Gen. Tech. Rep. WO-87. Washington, DC. pp. 198. Accessed at: http://www.fs.fed.us/research/publications/gtr/gtr_wo87.pdf.
Miegroet, H.v., R.J. Norby, T.J. Tschaplinksi. 1994. Nitrogen fertilization strategies in a
short-rotation sycamore plantation. For. Ecol. Manage. 64(1):13-24. Villanueva, A.T. 2015. Impacts of fertilization on soil properties in loblolly pine plantations
in the southeastern United States. M.S. thesis. Virginia Polytechnic Institute and State Univ., VA. p. 79.
Vitousek, P.M., and P. A. Matson. 1985. Intensive harvesting and site preparation decrease
soil nitrogen availability in young plantations. South. J. Appl. For. 9:120-125.
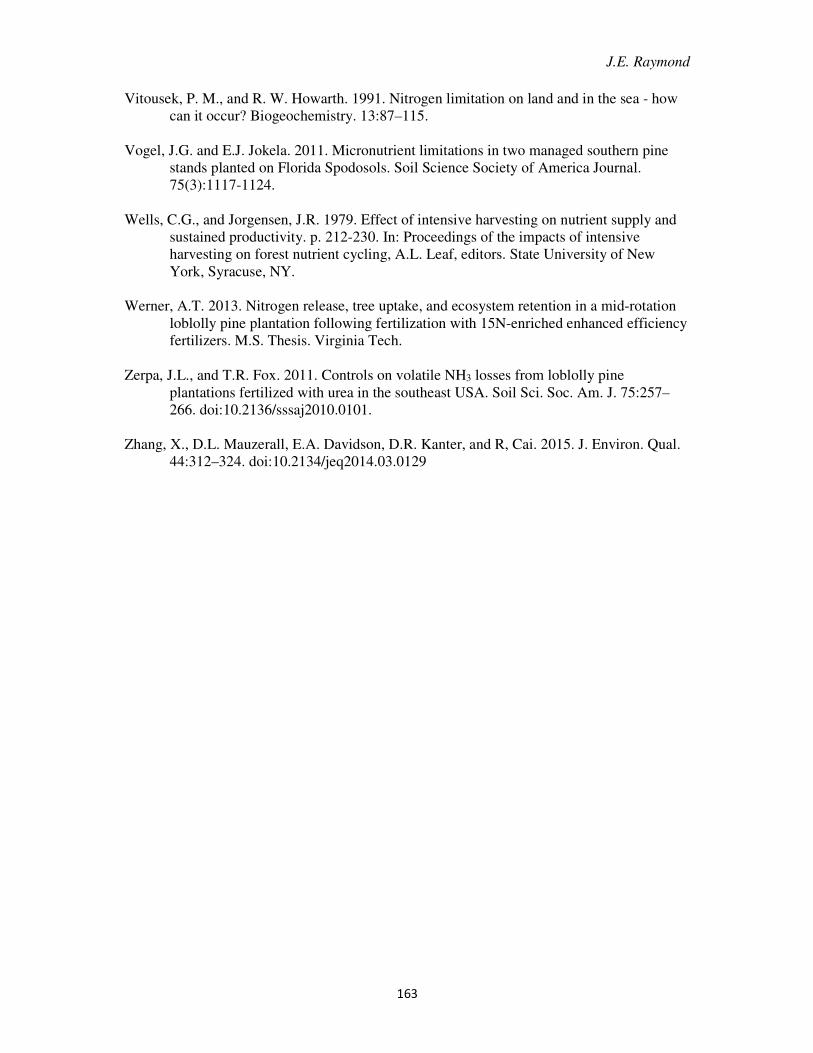
J.E. Raymond
163
Vitousek, P. M., and R. W. Howarth. 1991. Nitrogen limitation on land and in the sea - how can it occur? Biogeochemistry. 13:87–115.
Vogel, J.G. and E.J. Jokela. 2011. Micronutrient limitations in two managed southern pine
stands planted on Florida Spodosols. Soil Science Society of America Journal. 75(3):1117-1124.
Wells, C.G., and Jorgensen, J.R. 1979. Effect of intensive harvesting on nutrient supply and
sustained productivity. p. 212-230. In: Proceedings of the impacts of intensive harvesting on forest nutrient cycling, A.L. Leaf, editors. State University of New York, Syracuse, NY.
Werner, A.T. 2013. Nitrogen release, tree uptake, and ecosystem retention in a mid-rotation
loblolly pine plantation following fertilization with 15N-enriched enhanced efficiency fertilizers. M.S. Thesis. Virginia Tech.
Zerpa, J.L., and T.R. Fox. 2011. Controls on volatile NH3 losses from loblolly pine
plantations fertilized with urea in the southeast USA. Soil Sci. Soc. Am. J. 75:257–266. doi:10.2136/sssaj2010.0101.
Zhang, X., D.L. Mauzerall, E.A. Davidson, D.R. Kanter, and R, Cai. 2015. J. Environ. Qual. 44:312–324. doi:10.2134/jeq2014.03.0129
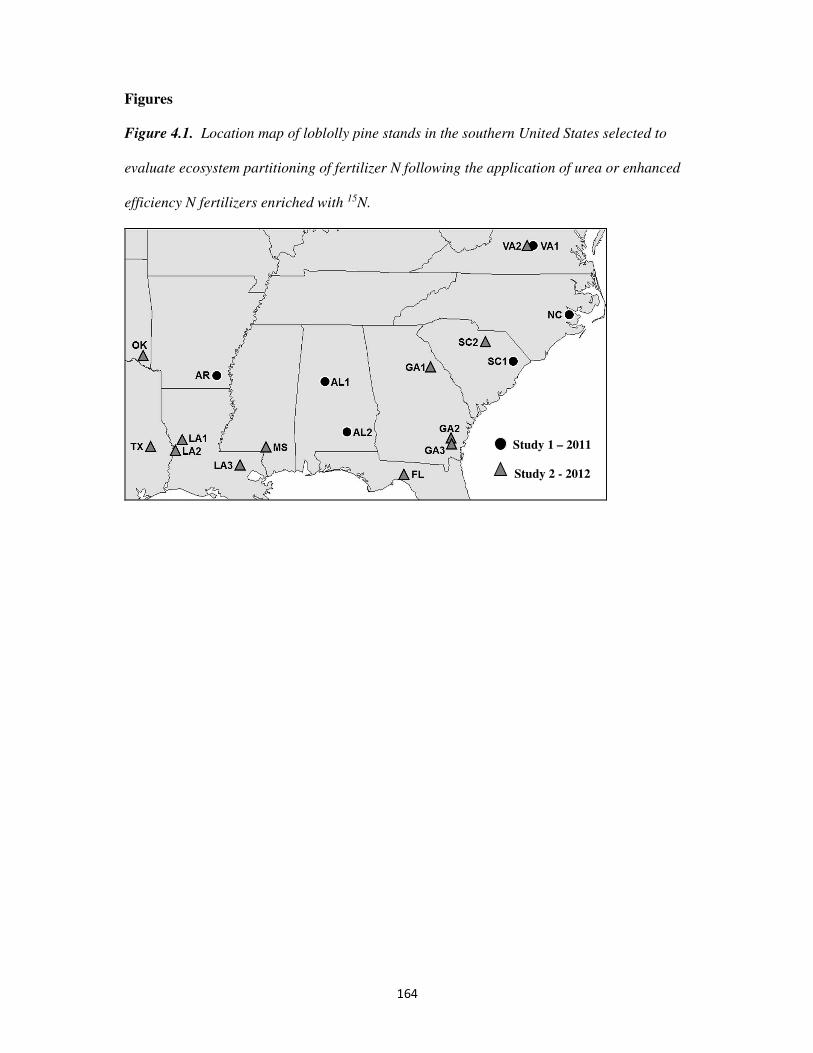
164
Figures
Figure 4.1. Location map of loblolly pine stands in the southern United States selected to
evaluate ecosystem partitioning of fertilizer N following the application of urea or enhanced
efficiency N fertilizers enriched with 15N.
Study 1 – 2011
Study 2 - 2012
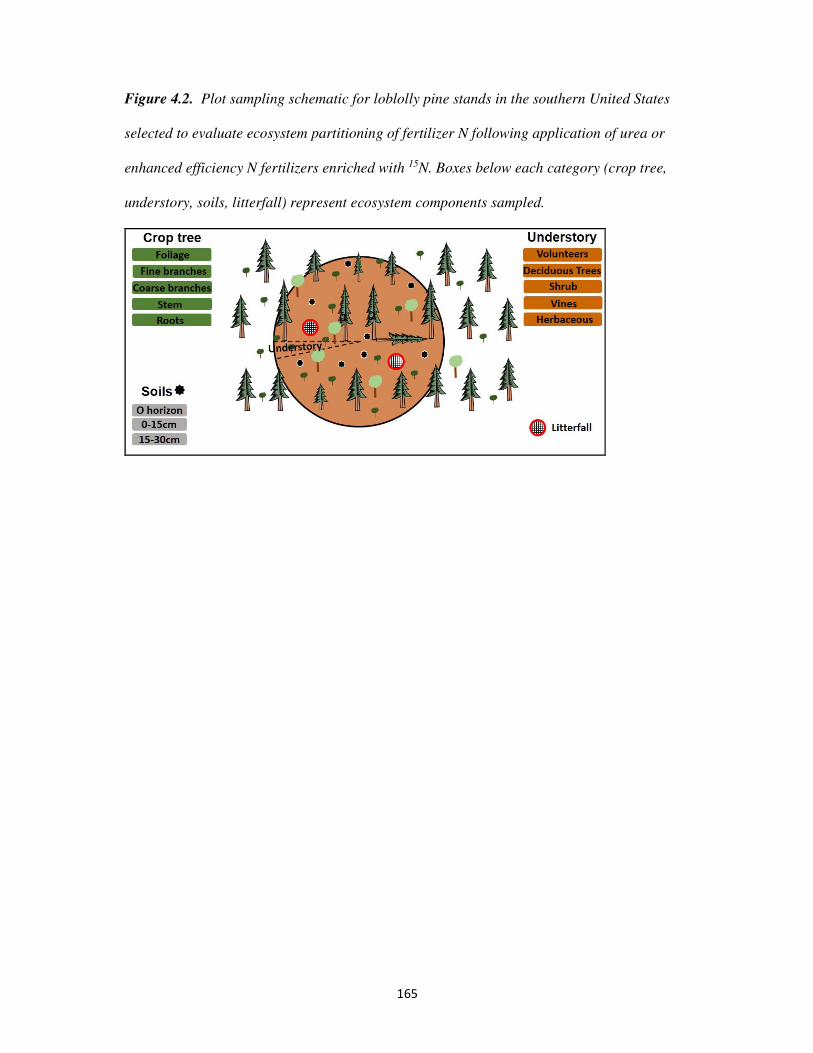
165
Figure 4.2. Plot sampling schematic for loblolly pine stands in the southern United States
selected to evaluate ecosystem partitioning of fertilizer N following application of urea or
enhanced efficiency N fertilizers enriched with 15N. Boxes below each category (crop tree,
understory, soils, litterfall) represent ecosystem components sampled.
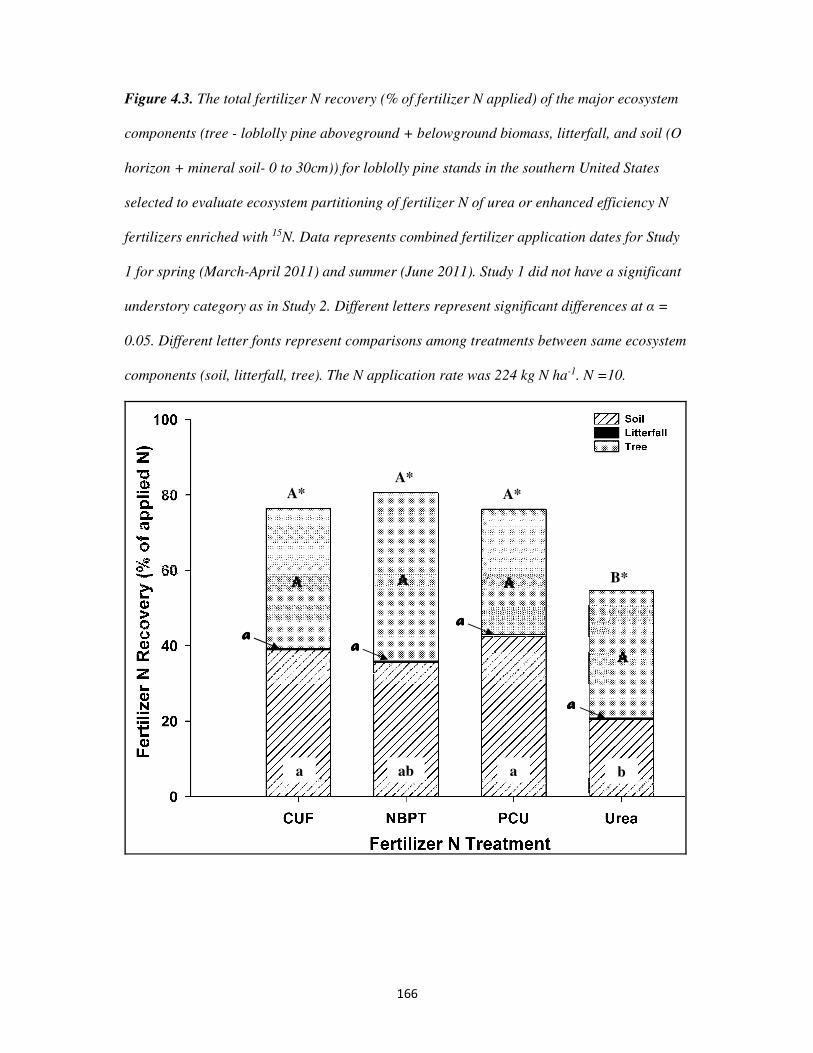
166
Figure 4.3. The total fertilizer N recovery (% of fertilizer N applied) of the major ecosystem
components (tree - loblolly pine aboveground + belowground biomass, litterfall, and soil (O
horizon + mineral soil- 0 to 30cm)) for loblolly pine stands in the southern United States
selected to evaluate ecosystem partitioning of fertilizer N of urea or enhanced efficiency N
fertilizers enriched with 15N. Data represents combined fertilizer application dates for Study
1 for spring (March-April 2011) and summer (June 2011). Study 1 did not have a significant
understory category as in Study 2. Different letters represent significant differences at α =
0.05. Different letter fonts represent comparisons among treatments between same ecosystem
components (soil, litterfall, tree). The N application rate was 224 kg N ha-1. N =10.
a
A*
AAAA
aaaa aaaa
aaaa
aaaa
ab a b
AAAA AAAA
AAAA
A* A*
B*
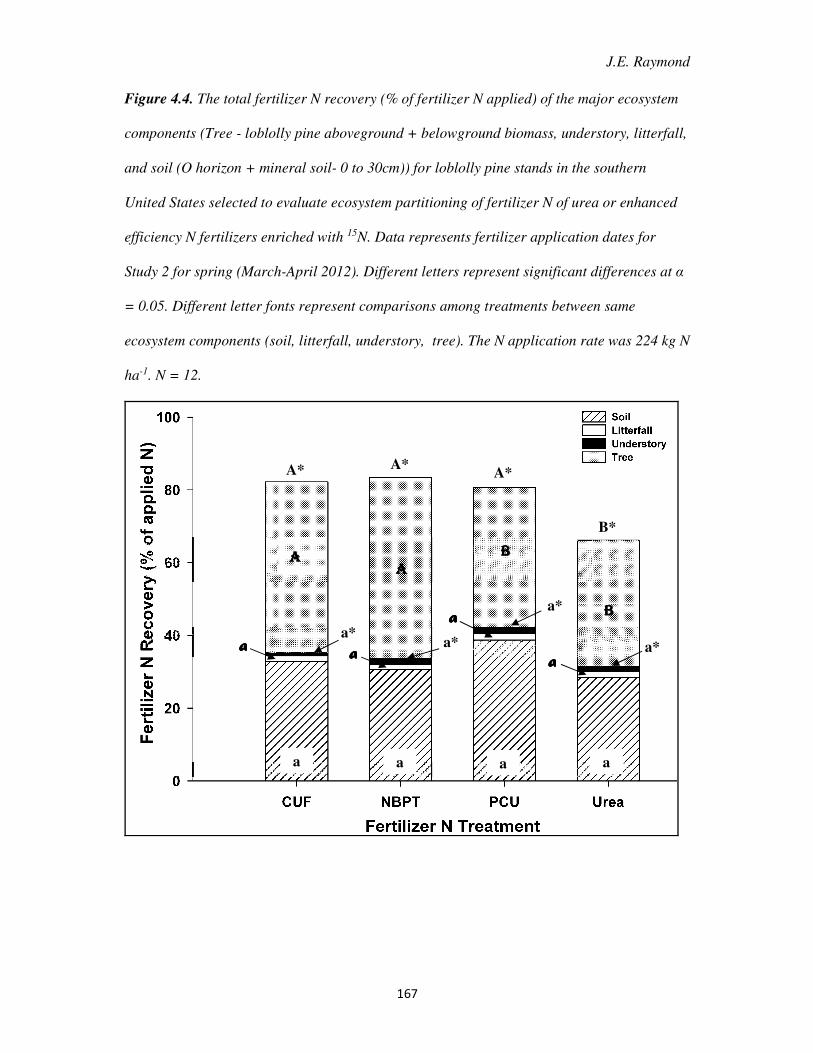
J.E. Raymond
167
Figure 4.4. The total fertilizer N recovery (% of fertilizer N applied) of the major ecosystem
components (Tree - loblolly pine aboveground + belowground biomass, understory, litterfall,
and soil (O horizon + mineral soil- 0 to 30cm)) for loblolly pine stands in the southern
United States selected to evaluate ecosystem partitioning of fertilizer N of urea or enhanced
efficiency N fertilizers enriched with 15N. Data represents fertilizer application dates for
Study 2 for spring (March-April 2012). Different letters represent significant differences at α
= 0.05. Different letter fonts represent comparisons among treatments between same
ecosystem components (soil, litterfall, understory, tree). The N application rate was 224 kg N
ha-1. N = 12.
a a a a
aaaa aaaa
aaaa
aaaa
a* a*
a*
a*
AAAA AAAA
BBBB
BBBB
A* A* A*
B*
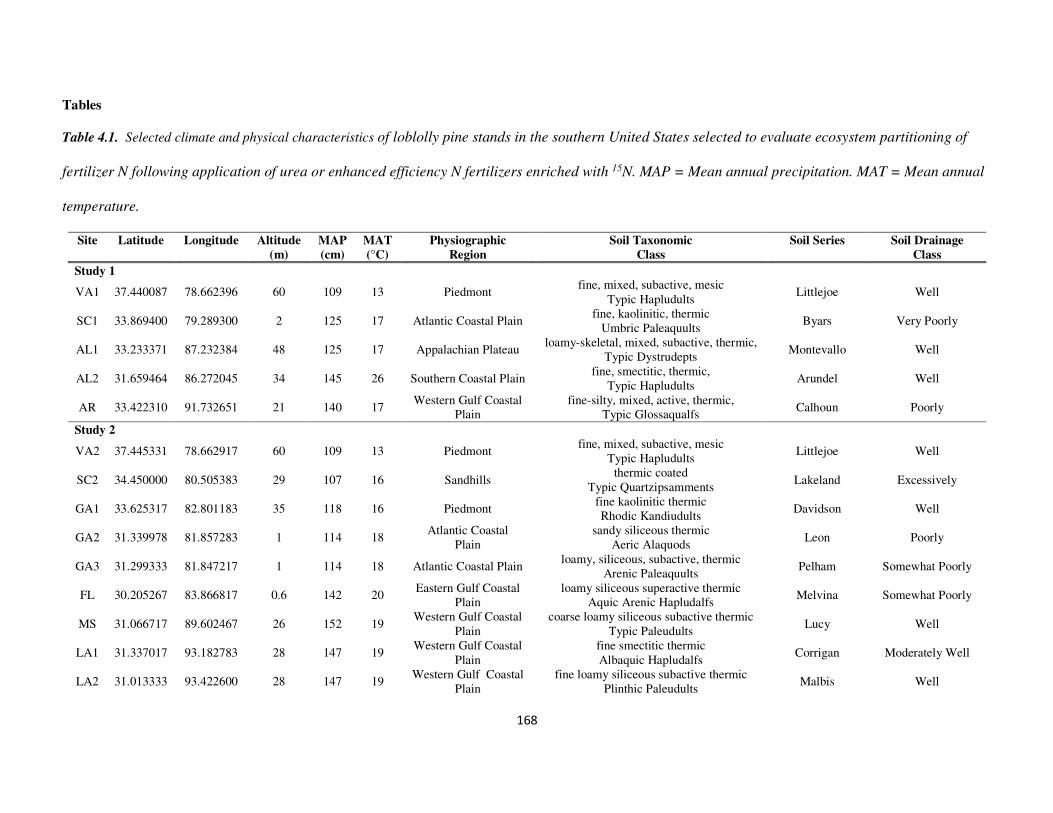
168
Tables
Table 4.1. Selected climate and physical characteristics of loblolly pine stands in the southern United States selected to evaluate ecosystem partitioning of
fertilizer N following application of urea or enhanced efficiency N fertilizers enriched with 15N. MAP = Mean annual precipitation. MAT = Mean annual
temperature.
Site
Latitude
Longitude
Altitude
(m)
MAP
(cm)
MAT
(°C)
Physiographic
Region
Soil Taxonomic
Class
Soil Series
Soil Drainage
Class
Study 1
VA1 37.440087 78.662396 60 109 13 Piedmont fine, mixed, subactive, mesic
Typic Hapludults Littlejoe Well
SC1 33.869400 79.289300 2 125 17 Atlantic Coastal Plain fine, kaolinitic, thermic
Umbric Paleaquults Byars Very Poorly
AL1 33.233371 87.232384 48 125 17 Appalachian Plateau loamy-skeletal, mixed, subactive, thermic,
Typic Dystrudepts Montevallo Well
AL2 31.659464 86.272045 34 145 26 Southern Coastal Plain fine, smectitic, thermic,
Typic Hapludults Arundel Well
AR 33.422310 91.732651 21 140 17 Western Gulf Coastal
Plain fine-silty, mixed, active, thermic,
Typic Glossaqualfs Calhoun Poorly
Study 2
VA2 37.445331 78.662917 60 109 13 Piedmont fine, mixed, subactive, mesic
Typic Hapludults Littlejoe Well
SC2 34.450000 80.505383 29 107 16 Sandhills thermic coated
Typic Quartzipsamments Lakeland Excessively
GA1 33.625317 82.801183 35 118 16 Piedmont fine kaolinitic thermic Rhodic Kandiudults
Davidson Well
GA2 31.339978 81.857283 1 114 18 Atlantic Coastal
Plain sandy siliceous thermic
Aeric Alaquods Leon Poorly
GA3 31.299333 81.847217 1 114 18 Atlantic Coastal Plain loamy, siliceous, subactive, thermic
Arenic Paleaquults Pelham Somewhat Poorly
FL 30.205267 83.866817 0.6 142 20 Eastern Gulf Coastal
Plain loamy siliceous superactive thermic
Aquic Arenic Hapludalfs Melvina Somewhat Poorly
MS 31.066717 89.602467 26 152 19 Western Gulf Coastal
Plain coarse loamy siliceous subactive thermic
Typic Paleudults Lucy Well
LA1 31.337017 93.182783 28 147 19 Western Gulf Coastal
Plain fine smectitic thermic Albaquic Hapludalfs
Corrigan Moderately Well
LA2 31.013333 93.422600 28 147 19 Western Gulf Coastal
Plain fine loamy siliceous subactive thermic
Plinthic Paleudults Malbis Well
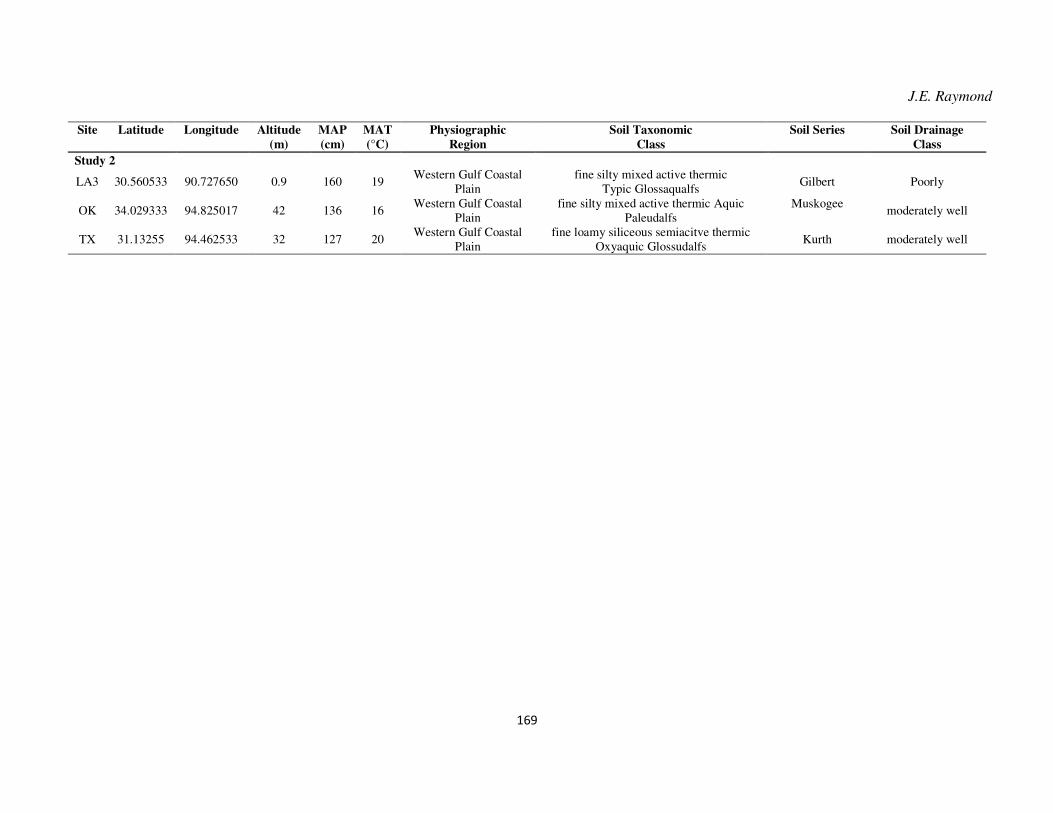
J.E. Raymond
169
Site
Latitude
Longitude
Altitude
(m)
MAP
(cm)
MAT
(°C)
Physiographic
Region
Soil Taxonomic
Class
Soil Series
Soil Drainage
Class
Study 2
LA3 30.560533 90.727650 0.9 160 19 Western Gulf Coastal
Plain fine silty mixed active thermic
Typic Glossaqualfs Gilbert Poorly
OK 34.029333 94.825017 42 136 16 Western Gulf Coastal
Plain fine silty mixed active thermic Aquic
Paleudalfs Muskogee
moderately well
TX 31.13255 94.462533 32 127 20 Western Gulf Coastal
Plain fine loamy siliceous semiacitve thermic
Oxyaquic Glossudalfs Kurth moderately well
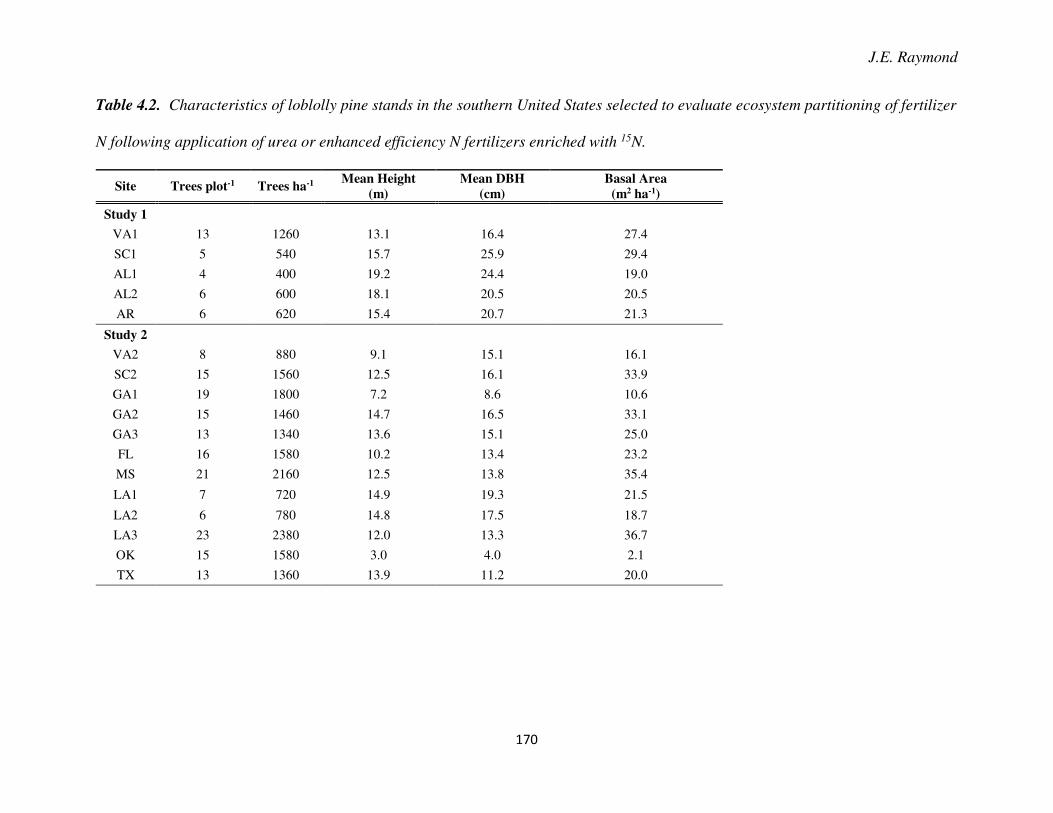
J.E. Raymond
170
Table 4.2. Characteristics of loblolly pine stands in the southern United States selected to evaluate ecosystem partitioning of fertilizer
N following application of urea or enhanced efficiency N fertilizers enriched with 15N.
Site Trees plot-1 Trees ha-1 Mean Height
(m)
Mean DBH
(cm)
Basal Area
(m2 ha-1)
Study 1
VA1 13 1260 13.1 16.4 27.4
SC1 5 540 15.7 25.9 29.4
AL1 4 400 19.2 24.4 19.0
AL2 6 600 18.1 20.5 20.5
AR 6 620 15.4 20.7 21.3
Study 2
VA2 8 880 9.1 15.1 16.1
SC2 15 1560 12.5 16.1 33.9
GA1 19 1800 7.2 8.6 10.6
GA2 15 1460 14.7 16.5 33.1
GA3 13 1340 13.6 15.1 25.0
FL 16 1580 10.2 13.4 23.2
MS 21 2160 12.5 13.8 35.4
LA1 7 720 14.9 19.3 21.5
LA2 6 780 14.8 17.5 18.7
LA3 23 2380 12.0 13.3 36.7
OK 15 1580 3.0 4.0 2.1
TX 13 1360 13.9 11.2 20.0
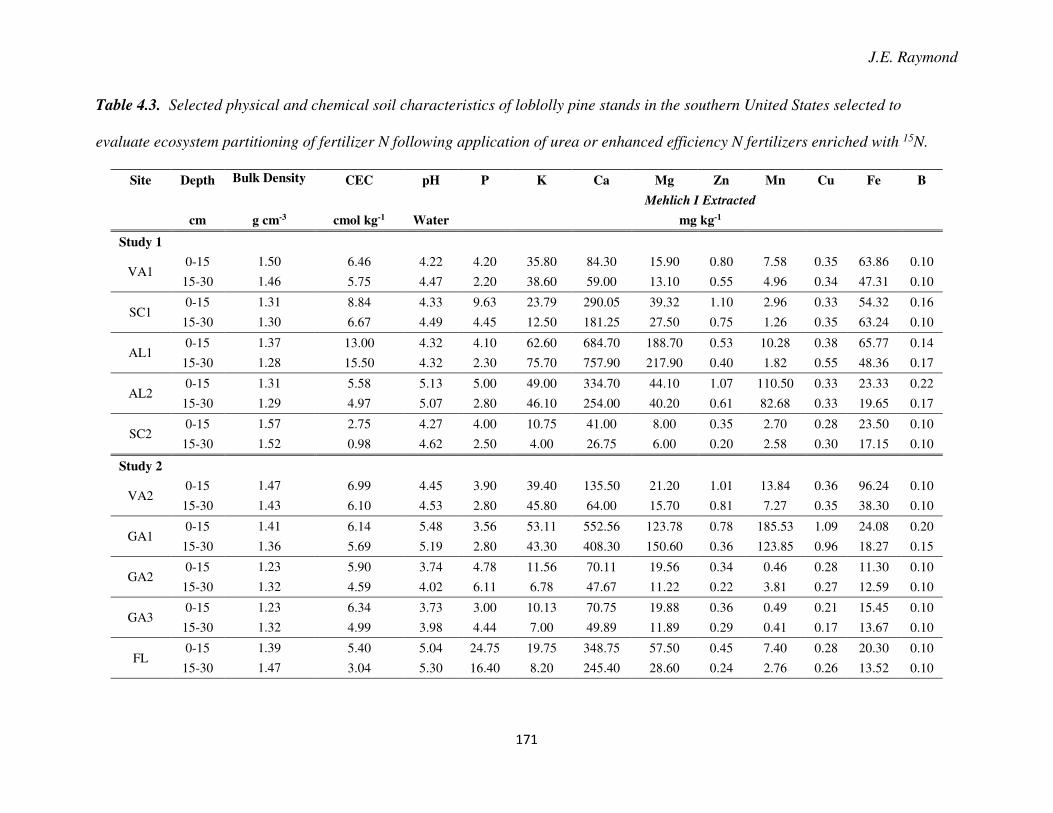
J.E. Raymond
171
Table 4.3. Selected physical and chemical soil characteristics of loblolly pine stands in the southern United States selected to
evaluate ecosystem partitioning of fertilizer N following application of urea or enhanced efficiency N fertilizers enriched with 15N.
Site Depth Bulk Density CEC pH P K Ca Mg Zn Mn Cu Fe B
Mehlich I Extracted
cm g cm-3 cmol kg-1 Water mg kg-1
Study 1
VA1 0-15 1.50 6.46 4.22 4.20 35.80 84.30 15.90 0.80 7.58 0.35 63.86 0.10
15-30 1.46 5.75 4.47 2.20 38.60 59.00 13.10 0.55 4.96 0.34 47.31 0.10
SC1 0-15 1.31 8.84 4.33 9.63 23.79 290.05 39.32 1.10 2.96 0.33 54.32 0.16
15-30 1.30 6.67 4.49 4.45 12.50 181.25 27.50 0.75 1.26 0.35 63.24 0.10
AL1 0-15 1.37 13.00 4.32 4.10 62.60 684.70 188.70 0.53 10.28 0.38 65.77 0.14
15-30 1.28 15.50 4.32 2.30 75.70 757.90 217.90 0.40 1.82 0.55 48.36 0.17
AL2 0-15 1.31 5.58 5.13 5.00 49.00 334.70 44.10 1.07 110.50 0.33 23.33 0.22
15-30 1.29 4.97 5.07 2.80 46.10 254.00 40.20 0.61 82.68 0.33 19.65 0.17
SC2 0-15 1.57 2.75 4.27 4.00 10.75 41.00 8.00 0.35 2.70 0.28 23.50 0.10
15-30 1.52 0.98 4.62 2.50 4.00 26.75 6.00 0.20 2.58 0.30 17.15 0.10
Study 2
VA2 0-15 1.47 6.99 4.45 3.90 39.40 135.50 21.20 1.01 13.84 0.36 96.24 0.10
15-30 1.43 6.10 4.53 2.80 45.80 64.00 15.70 0.81 7.27 0.35 38.30 0.10
GA1 0-15 1.41 6.14 5.48 3.56 53.11 552.56 123.78 0.78 185.53 1.09 24.08 0.20
15-30 1.36 5.69 5.19 2.80 43.30 408.30 150.60 0.36 123.85 0.96 18.27 0.15
GA2 0-15 1.23 5.90 3.74 4.78 11.56 70.11 19.56 0.34 0.46 0.28 11.30 0.10
15-30 1.32 4.59 4.02 6.11 6.78 47.67 11.22 0.22 3.81 0.27 12.59 0.10
GA3 0-15 1.23 6.34 3.73 3.00 10.13 70.75 19.88 0.36 0.49 0.21 15.45 0.10
15-30 1.32 4.99 3.98 4.44 7.00 49.89 11.89 0.29 0.41 0.17 13.67 0.10
FL 0-15 1.39 5.40 5.04 24.75 19.75 348.75 57.50 0.45 7.40 0.28 20.30 0.10
15-30 1.47 3.04 5.30 16.40 8.20 245.40 28.60 0.24 2.76 0.26 13.52 0.10
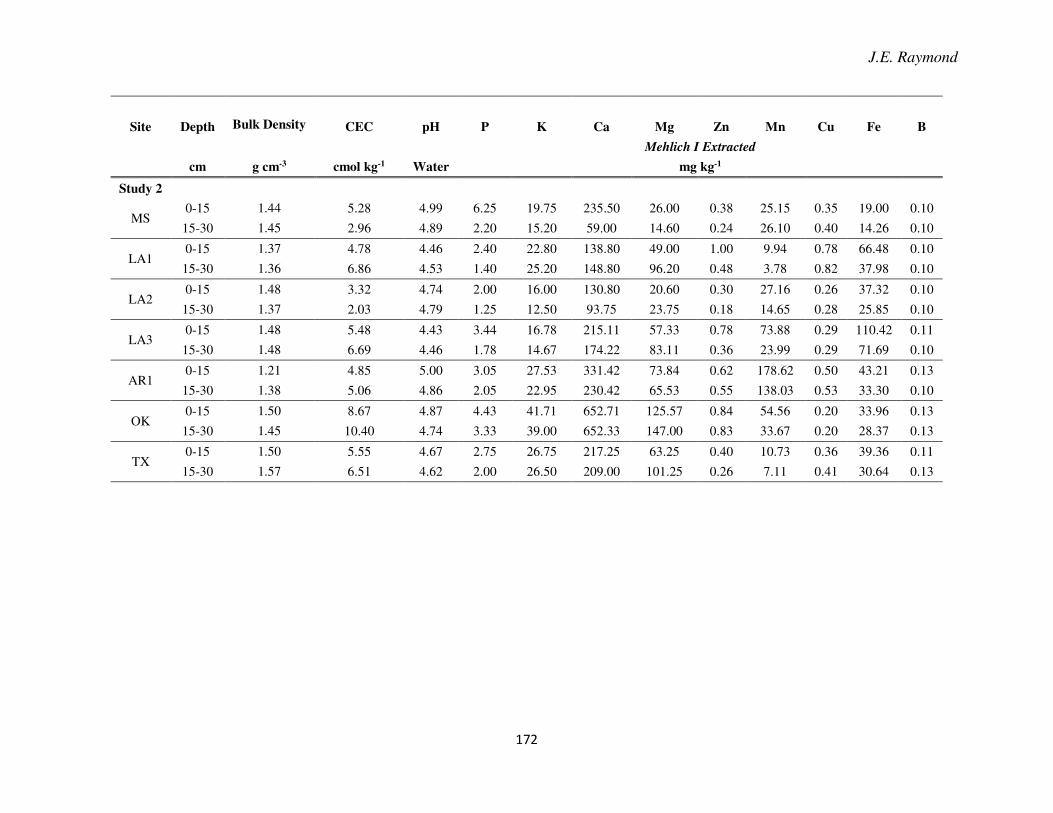
J.E. Raymond
172
Site Depth Bulk Density CEC pH P K Ca Mg Zn Mn Cu Fe B
Mehlich I Extracted
cm g cm-3 cmol kg-1 Water mg kg-1
Study 2
MS 0-15 1.44 5.28 4.99 6.25 19.75 235.50 26.00 0.38 25.15 0.35 19.00 0.10
15-30 1.45 2.96 4.89 2.20 15.20 59.00 14.60 0.24 26.10 0.40 14.26 0.10
LA1 0-15 1.37 4.78 4.46 2.40 22.80 138.80 49.00 1.00 9.94 0.78 66.48 0.10
15-30 1.36 6.86 4.53 1.40 25.20 148.80 96.20 0.48 3.78 0.82 37.98 0.10
LA2 0-15 1.48 3.32 4.74 2.00 16.00 130.80 20.60 0.30 27.16 0.26 37.32 0.10
15-30 1.37 2.03 4.79 1.25 12.50 93.75 23.75 0.18 14.65 0.28 25.85 0.10
LA3 0-15 1.48 5.48 4.43 3.44 16.78 215.11 57.33 0.78 73.88 0.29 110.42 0.11
15-30 1.48 6.69 4.46 1.78 14.67 174.22 83.11 0.36 23.99 0.29 71.69 0.10
AR1 0-15 1.21 4.85 5.00 3.05 27.53 331.42 73.84 0.62 178.62 0.50 43.21 0.13
15-30 1.38 5.06 4.86 2.05 22.95 230.42 65.53 0.55 138.03 0.53 33.30 0.10
OK 0-15 1.50 8.67 4.87 4.43 41.71 652.71 125.57 0.84 54.56 0.20 33.96 0.13
15-30 1.45 10.40 4.74 3.33 39.00 652.33 147.00 0.83 33.67 0.20 28.37 0.13
TX 0-15 1.50 5.55 4.67 2.75 26.75 217.25 63.25 0.40 10.73 0.36 39.36 0.11
15-30 1.57 6.51 4.62 2.00 26.50 209.00 101.25 0.26 7.11 0.41 30.64 0.13
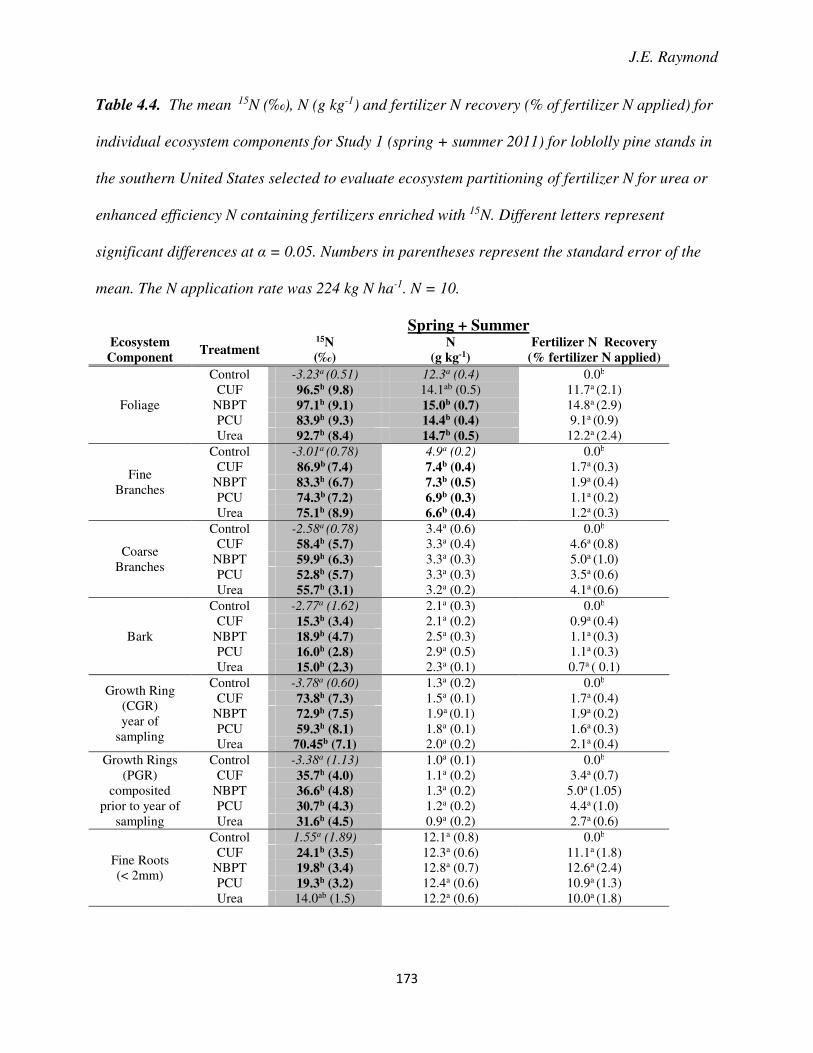
J.E. Raymond
173
Table 4.4. The mean 15N (‰), N (g kg-1) and fertilizer N recovery (% of fertilizer N applied) for
individual ecosystem components for Study 1 (spring + summer 2011) for loblolly pine stands in
the southern United States selected to evaluate ecosystem partitioning of fertilizer N for urea or
enhanced efficiency N containing fertilizers enriched with 15N. Different letters represent
significant differences at α = 0.05. Numbers in parentheses represent the standard error of the
mean. The N application rate was 224 kg N ha-1. N = 10.
Spring + Summer Ecosystem
Component Treatment
15N
(‰)
N
(g kg-1)
Fertilizer N Recovery
(% fertilizer N applied)
Foliage
Control -3.23a (0.51) 12.3a (0.4) 0.0b CUF 96.5b (9.8) 14.1ab (0.5) 11.7a (2.1)
NBPT 97.1b (9.1) 15.0b (0.7) 14.8a (2.9) PCU 83.9b (9.3) 14.4b (0.4) 9.1a (0.9) Urea 92.7b (8.4) 14.7b (0.5) 12.2a (2.4)
Fine Branches
Control -3.01a (0.78) 4.9a (0.2) 0.0b CUF 86.9b (7.4) 7.4b (0.4) 1.7a (0.3)
NBPT 83.3b (6.7) 7.3b (0.5) 1.9a (0.4) PCU 74.3b (7.2) 6.9b (0.3) 1.1a (0.2) Urea 75.1b (8.9) 6.6b (0.4) 1.2a (0.3)
Coarse Branches
Control -2.58a (0.78) 3.4a (0.6) 0.0b CUF 58.4b (5.7) 3.3a (0.4) 4.6a (0.8)
NBPT 59.9b (6.3) 3.3a (0.3) 5.0a (1.0) PCU 52.8b (5.7) 3.3a (0.3) 3.5a (0.6) Urea 55.7b (3.1) 3.2a (0.2) 4.1a (0.6)
Bark
Control -2.77a (1.62) 2.1a (0.3) 0.0b CUF 15.3b (3.4) 2.1a (0.2) 0.9a (0.4)
NBPT 18.9b (4.7) 2.5a (0.3) 1.1a (0.3) PCU 16.0b (2.8) 2.9a (0.5) 1.1a (0.3) Urea 15.0b (2.3) 2.3a (0.1) 0.7a ( 0.1)
Growth Ring (CGR) year of
sampling
Control -3.78a (0.60) 1.3a (0.2) 0.0b CUF 73.8b (7.3) 1.5a (0.1) 1.7a (0.4)
NBPT 72.9b (7.5) 1.9a (0.1) 1.9a (0.2) PCU 59.3b (8.1) 1.8a (0.1) 1.6a (0.3) Urea 70.45b (7.1) 2.0a (0.2) 2.1a (0.4)
Growth Rings (PGR)
composited prior to year of
sampling
Control -3.38a (1.13) 1.0a (0.1) 0.0b CUF 35.7b (4.0) 1.1a (0.2) 3.4a (0.7)
NBPT 36.6b (4.8) 1.3a (0.2) 5.0a (1.05) PCU 30.7b (4.3) 1.2a (0.2) 4.4a (1.0) Urea 31.6b (4.5) 0.9a (0.2) 2.7a (0.6)
Fine Roots (< 2mm)
Control 1.55a (1.89) 12.1a (0.8) 0.0b CUF 24.1b (3.5) 12.3a (0.6) 11.1a (1.8)
NBPT 19.8b (3.4) 12.8a (0.7) 12.6a (2.4) PCU 19.3b (3.2) 12.4a (0.6) 10.9a (1.3) Urea 14.0ab (1.5) 12.2a (0.6) 10.0a (1.8)
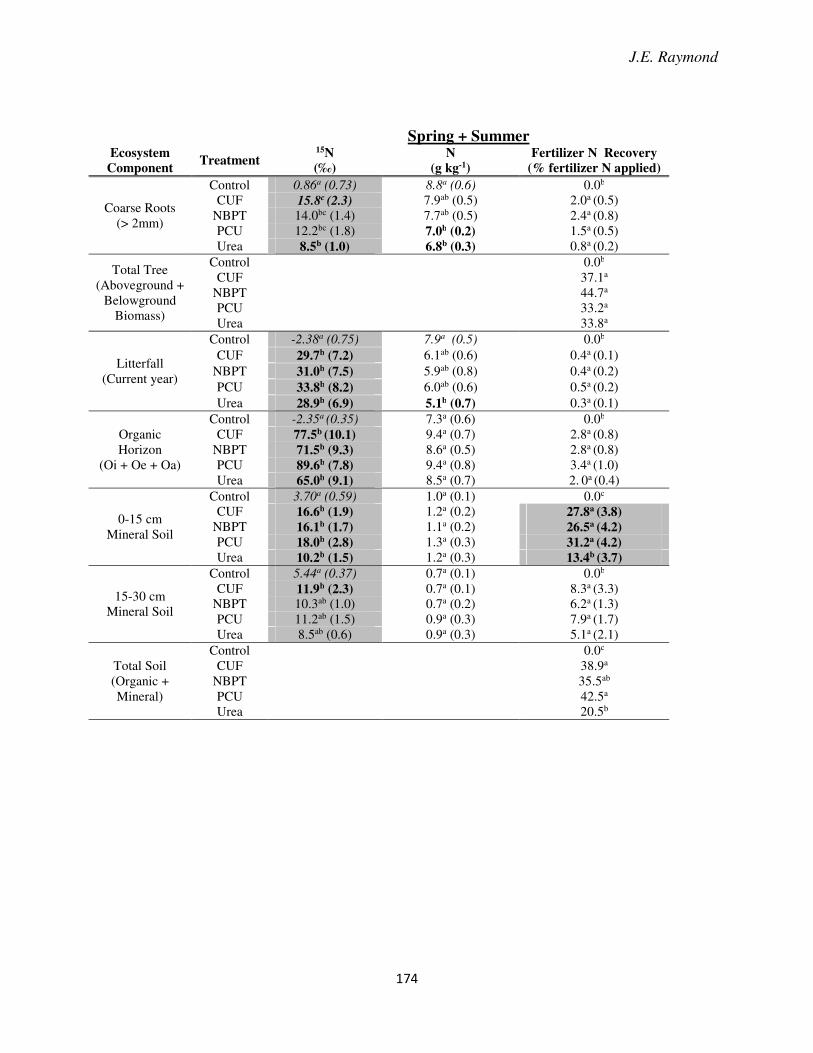
J.E. Raymond
174
Spring + Summer Ecosystem
Component Treatment
15N
(‰)
N
(g kg-1)
Fertilizer N Recovery
(% fertilizer N applied)
Coarse Roots (> 2mm)
Control 0.86a (0.73) 8.8a (0.6) 0.0b CUF 15.8c (2.3) 7.9ab (0.5) 2.0a (0.5)
NBPT 14.0bc (1.4) 7.7ab (0.5) 2.4a (0.8) PCU 12.2bc (1.8) 7.0b (0.2) 1.5a (0.5) Urea 8.5b (1.0) 6.8b (0.3) 0.8a (0.2)
Total Tree (Aboveground +
Belowground Biomass)
Control 0.0b CUF 37.1a
NBPT 44.7a PCU 33.2a Urea 33.8a
Litterfall (Current year)
Control -2.38a (0.75) 7.9a (0.5) 0.0b CUF 29.7b (7.2) 6.1ab (0.6) 0.4a (0.1)
NBPT 31.0b (7.5) 5.9ab (0.8) 0.4a (0.2) PCU 33.8b (8.2) 6.0ab (0.6) 0.5a (0.2) Urea 28.9b (6.9) 5.1b (0.7) 0.3a (0.1)
Organic Horizon
(Oi + Oe + Oa)
Control -2.35a (0.35) 7.3a (0.6) 0.0b CUF 77.5b (10.1) 9.4a (0.7) 2.8a (0.8)
NBPT 71.5b (9.3) 8.6a (0.5) 2.8a (0.8) PCU 89.6b (7.8) 9.4a (0.8) 3.4a (1.0) Urea 65.0b (9.1) 8.5a (0.7) 2. 0a (0.4)
0-15 cm Mineral Soil
Control 3.70a (0.59) 1.0a (0.1) 0.0c CUF 16.6b (1.9) 1.2a (0.2) 27.8a (3.8)
NBPT 16.1b (1.7) 1.1a (0.2) 26.5a (4.2) PCU 18.0b (2.8) 1.3a (0.3) 31.2a (4.2) Urea 10.2b (1.5) 1.2a (0.3) 13.4b (3.7)
15-30 cm Mineral Soil
Control 5.44a (0.37) 0.7a (0.1) 0.0b CUF 11.9b (2.3) 0.7a (0.1) 8.3a (3.3)
NBPT 10.3ab (1.0) 0.7a (0.2) 6.2a (1.3) PCU 11.2ab (1.5) 0.9a (0.3) 7.9a (1.7) Urea 8.5ab (0.6) 0.9a (0.3) 5.1a (2.1)
Total Soil (Organic + Mineral)
Control 0.0c CUF 38.9a
NBPT 35.5ab PCU 42.5a Urea 20.5b
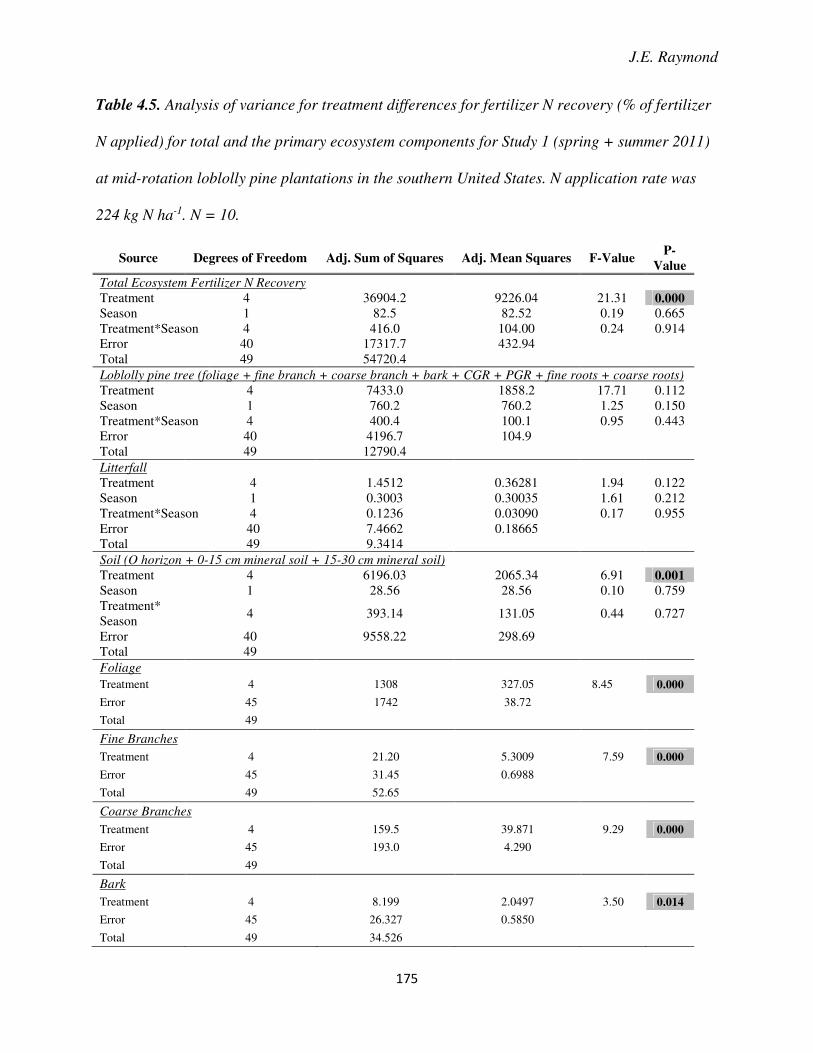
J.E. Raymond
175
Table 4.5. Analysis of variance for treatment differences for fertilizer N recovery (% of fertilizer
N applied) for total and the primary ecosystem components for Study 1 (spring + summer 2011)
at mid-rotation loblolly pine plantations in the southern United States. N application rate was
224 kg N ha-1. N = 10.
Source Degrees of Freedom Adj. Sum of Squares Adj. Mean Squares F-Value P-
Value
Total Ecosystem Fertilizer N Recovery
Treatment 4 36904.2 9226.04 21.31 0.000 Season 1 82.5 82.52 0.19 0.665 Treatment*Season 4 416.0 104.00 0.24 0.914 Error 40 17317.7 432.94 Total 49 54720.4 Loblolly pine tree (foliage + fine branch + coarse branch + bark + CGR + PGR + fine roots + coarse roots)
Treatment 4 7433.0 1858.2 17.71 0.112 Season 1 760.2 760.2 1.25 0.150 Treatment*Season 4 400.4 100.1 0.95 0.443 Error 40 4196.7 104.9 Total 49 12790.4 Litterfall
Treatment 4 1.4512 0.36281 1.94 0.122 Season 1 0.3003 0.30035 1.61 0.212 Treatment*Season 4 0.1236 0.03090 0.17 0.955 Error 40 7.4662 0.18665 Total 49 9.3414 Soil (O horizon + 0-15 cm mineral soil + 15-30 cm mineral soil)
Treatment 4 6196.03 2065.34 6.91 0.001 Season 1 28.56 28.56 0.10 0.759 Treatment* Season
4 393.14 131.05 0.44 0.727
Error 40 9558.22 298.69 Total 49 Foliage
Treatment 4 1308 327.05 8.45 0.000
Error 45 1742 38.72
Total 49
Fine Branches
Treatment 4 21.20 5.3009 7.59 0.000
Error 45 31.45 0.6988
Total 49 52.65
Coarse Branches
Treatment 4 159.5 39.871 9.29 0.000
Error 45 193.0 4.290
Total 49
Bark
Treatment 4 8.199 2.0497 3.50 0.014
Error 45 26.327 0.5850
Total 49 34.526
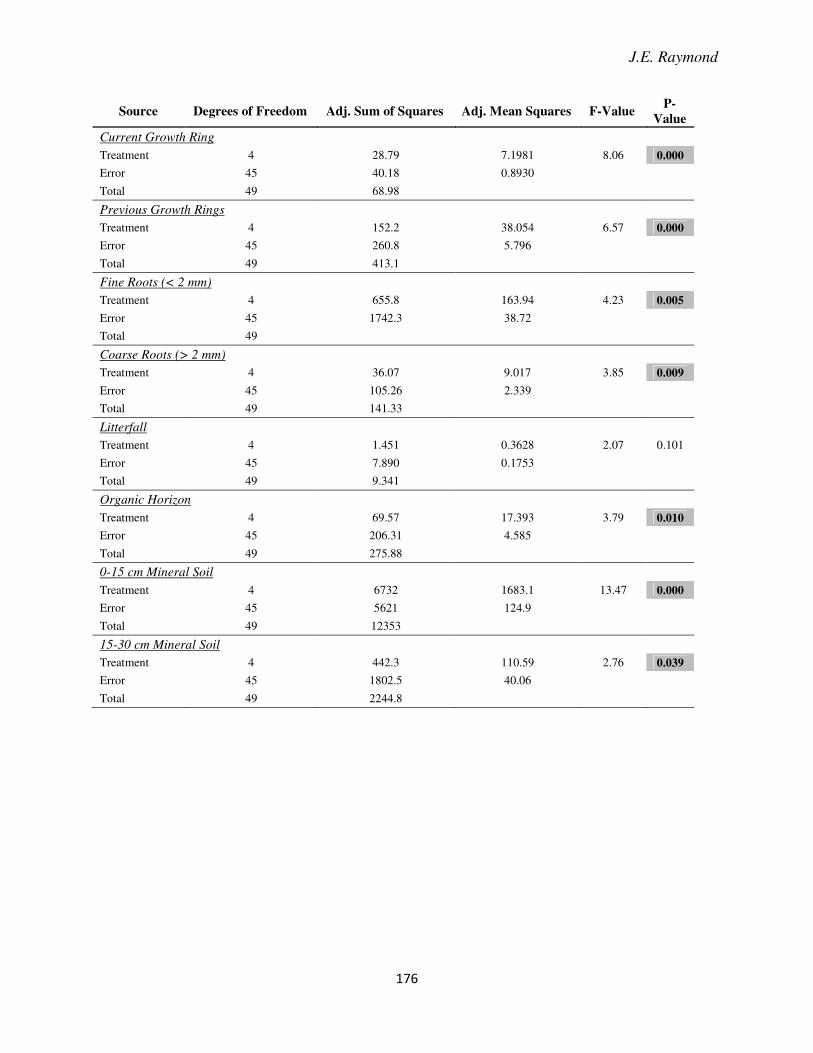
J.E. Raymond
176
Source Degrees of Freedom Adj. Sum of Squares Adj. Mean Squares F-Value P-
Value
Current Growth Ring
Treatment 4 28.79 7.1981 8.06 0.000
Error 45 40.18 0.8930
Total 49 68.98
Previous Growth Rings
Treatment 4 152.2 38.054 6.57 0.000
Error 45 260.8 5.796
Total 49 413.1
Fine Roots (< 2 mm)
Treatment 4 655.8 163.94 4.23 0.005
Error 45 1742.3 38.72
Total 49
Coarse Roots (> 2 mm)
Treatment 4 36.07 9.017 3.85 0.009
Error 45 105.26 2.339
Total 49 141.33
Litterfall
Treatment 4 1.451 0.3628 2.07 0.101
Error 45 7.890 0.1753
Total 49 9.341
Organic Horizon
Treatment 4 69.57 17.393 3.79 0.010
Error 45 206.31 4.585
Total 49 275.88
0-15 cm Mineral Soil
Treatment 4 6732 1683.1 13.47 0.000
Error 45 5621 124.9
Total 49 12353
15-30 cm Mineral Soil
Treatment 4 442.3 110.59 2.76 0.039
Error 45 1802.5 40.06
Total 49 2244.8
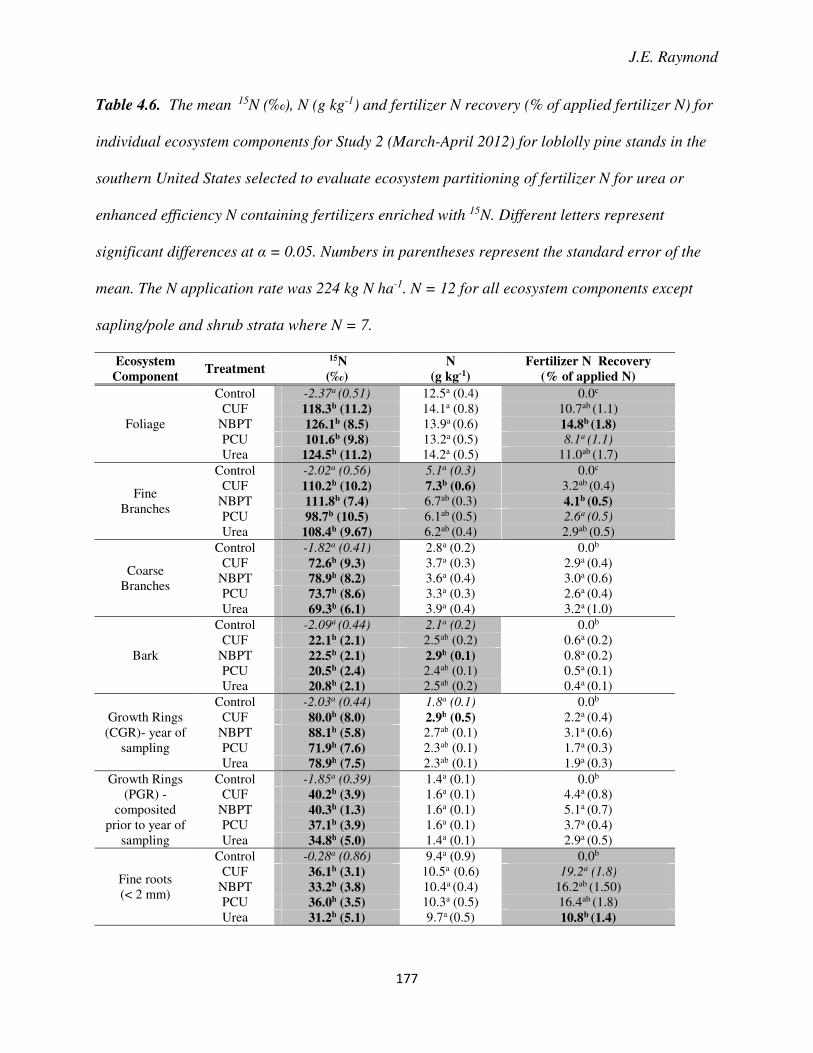
J.E. Raymond
177
Table 4.6. The mean 15N (‰), N (g kg-1) and fertilizer N recovery (% of applied fertilizer N) for
individual ecosystem components for Study 2 (March-April 2012) for loblolly pine stands in the
southern United States selected to evaluate ecosystem partitioning of fertilizer N for urea or
enhanced efficiency N containing fertilizers enriched with 15N. Different letters represent
significant differences at α = 0.05. Numbers in parentheses represent the standard error of the
mean. The N application rate was 224 kg N ha-1. N = 12 for all ecosystem components except
sapling/pole and shrub strata where N = 7.
Ecosystem
Component Treatment
15N
(‰)
N
(g kg-1)
Fertilizer N Recovery
(% of applied N)
Foliage
Control -2.37a (0.51) 12.5a (0.4) 0.0c CUF 118.3b (11.2) 14.1a (0.8) 10.7ab (1.1)
NBPT 126.1b (8.5) 13.9a (0.6) 14.8b (1.8) PCU 101.6b (9.8) 13.2a (0.5) 8.1a (1.1) Urea 124.5b (11.2) 14.2a (0.5) 11.0ab (1.7)
Fine Branches
Control -2.02a (0.56) 5.1a (0.3) 0.0c
CUF 110.2b (10.2) 7.3b (0.6) 3.2ab (0.4) NBPT 111.8b (7.4) 6.7ab (0.3) 4.1b (0.5) PCU 98.7b (10.5) 6.1ab (0.5) 2.6a (0.5) Urea 108.4b (9.67) 6.2ab (0.4) 2.9ab (0.5)
Coarse Branches
Control -1.82a (0.41) 2.8a (0.2) 0.0b CUF 72.6b (9.3) 3.7a (0.3) 2.9a (0.4)
NBPT 78.9b (8.2) 3.6a (0.4) 3.0a (0.6) PCU 73.7b (8.6) 3.3a (0.3) 2.6a (0.4) Urea 69.3b (6.1) 3.9a (0.4) 3.2a (1.0)
Bark
Control -2.09a (0.44) 2.1a (0.2) 0.0b CUF 22.1b (2.1) 2.5ab (0.2) 0.6a (0.2)
NBPT 22.5b (2.1) 2.9b (0.1) 0.8a (0.2) PCU 20.5b (2.4) 2.4ab (0.1) 0.5a (0.1) Urea 20.8b (2.1) 2.5ab (0.2) 0.4a (0.1)
Growth Rings (CGR)- year of
sampling
Control -2.03a (0.44) 1.8a (0.1) 0.0b
CUF 80.0b (8.0) 2.9b (0.5) 2.2a (0.4) NBPT 88.1b (5.8) 2.7ab (0.1) 3.1a (0.6) PCU 71.9b (7.6) 2.3ab (0.1) 1.7a (0.3) Urea 78.9b (7.5) 2.3ab (0.1) 1.9a (0.3)
Growth Rings (PGR) -
composited prior to year of
sampling
Control -1.85a (0.39) 1.4a (0.1) 0.0b CUF 40.2b (3.9) 1.6a (0.1) 4.4a (0.8)
NBPT 40.3b (1.3) 1.6a (0.1) 5.1a (0.7) PCU 37.1b (3.9) 1.6a (0.1) 3.7a (0.4) Urea 34.8b (5.0) 1.4a (0.1) 2.9a (0.5)
Fine roots (< 2 mm)
Control -0.28a (0.86) 9.4a (0.9) 0.0b CUF 36.1b (3.1) 10.5a (0.6) 19.2a (1.8)
NBPT 33.2b (3.8) 10.4a (0.4) 16.2ab (1.50) PCU 36.0b (3.5) 10.3a (0.5) 16.4ab (1.8) Urea 31.2b (5.1) 9.7a (0.5) 10.8b (1.4)
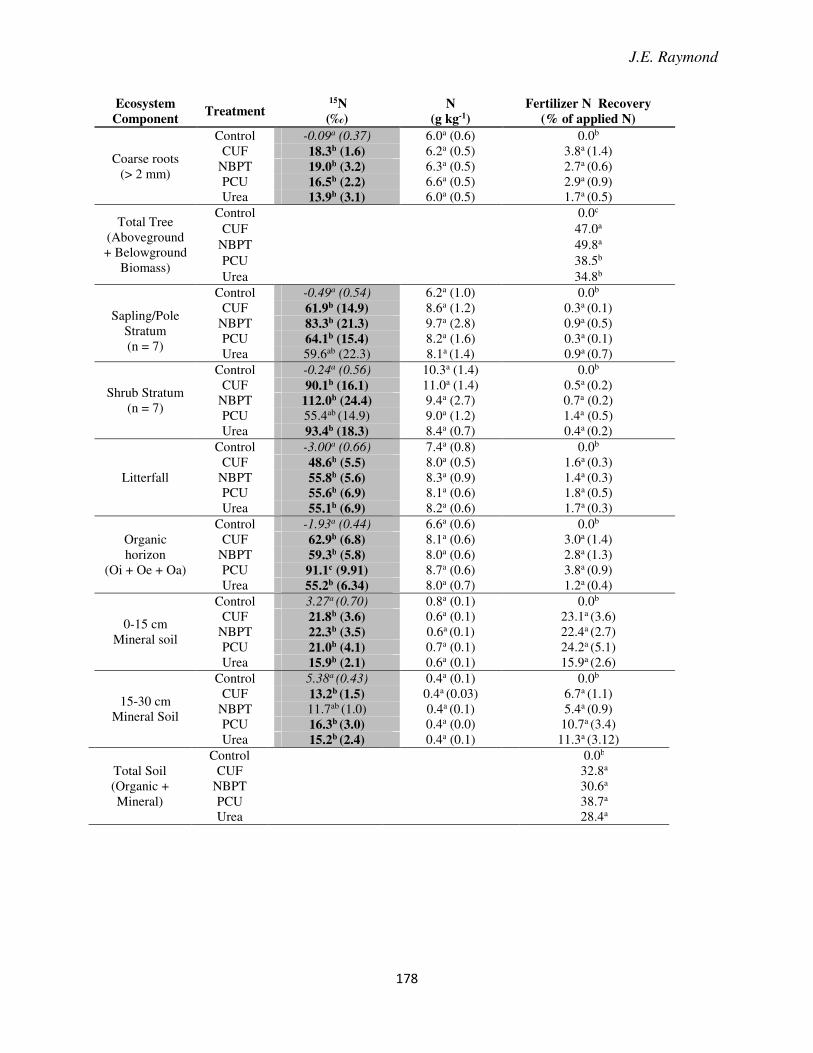
J.E. Raymond
178
Ecosystem
Component Treatment
15N
(‰)
N
(g kg-1)
Fertilizer N Recovery
(% of applied N)
Coarse roots (> 2 mm)
Control -0.09a (0.37) 6.0a (0.6) 0.0b CUF 18.3b (1.6) 6.2a (0.5) 3.8a (1.4)
NBPT 19.0b (3.2) 6.3a (0.5) 2.7a (0.6) PCU 16.5b (2.2) 6.6a (0.5) 2.9a (0.9) Urea 13.9b (3.1) 6.0a (0.5) 1.7a (0.5)
Total Tree (Aboveground + Belowground
Biomass)
Control 0.0c CUF 47.0a
NBPT 49.8a PCU 38.5b Urea 34.8b
Sapling/Pole
Stratum (n = 7)
Control -0.49a (0.54) 6.2a (1.0) 0.0b CUF 61.9b (14.9) 8.6a (1.2) 0.3a (0.1)
NBPT 83.3b (21.3) 9.7a (2.8) 0.9a (0.5) PCU 64.1b (15.4) 8.2a (1.6) 0.3a (0.1) Urea 59.6ab (22.3) 8.1a (1.4) 0.9a (0.7)
Shrub Stratum (n = 7)
Control -0.24a (0.56) 10.3a (1.4) 0.0b CUF 90.1b (16.1) 11.0a (1.4) 0.5a (0.2)
NBPT 112.0b (24.4) 9.4a (2.7) 0.7a (0.2) PCU 55.4ab (14.9) 9.0a (1.2) 1.4a (0.5) Urea 93.4b (18.3) 8.4a (0.7) 0.4a (0.2)
Litterfall
Control -3.00a (0.66) 7.4a (0.8) 0.0b CUF 48.6b (5.5) 8.0a (0.5) 1.6a (0.3)
NBPT 55.8b (5.6) 8.3a (0.9) 1.4a (0.3) PCU 55.6b (6.9) 8.1a (0.6) 1.8a (0.5) Urea 55.1b (6.9) 8.2a (0.6) 1.7a (0.3)
Organic horizon
(Oi + Oe + Oa)
Control -1.93a (0.44) 6.6a (0.6) 0.0b CUF 62.9b (6.8) 8.1a (0.6) 3.0a (1.4)
NBPT 59.3b (5.8) 8.0a (0.6) 2.8a (1.3) PCU 91.1c (9.91) 8.7a (0.6) 3.8a (0.9) Urea 55.2b (6.34) 8.0a (0.7) 1.2a (0.4)
0-15 cm Mineral soil
Control 3.27a (0.70) 0.8a (0.1) 0.0b CUF 21.8b (3.6) 0.6a (0.1) 23.1a (3.6)
NBPT 22.3b (3.5) 0.6a (0.1) 22.4a (2.7) PCU 21.0b (4.1) 0.7a (0.1) 24.2a (5.1) Urea 15.9b (2.1) 0.6a (0.1) 15.9a (2.6)
15-30 cm Mineral Soil
Control 5.38a (0.43) 0.4a (0.1) 0.0b CUF 13.2b (1.5) 0.4a (0.03) 6.7a (1.1)
NBPT 11.7ab (1.0) 0.4a (0.1) 5.4a (0.9) PCU 16.3b (3.0) 0.4a (0.0) 10.7a (3.4) Urea 15.2b (2.4) 0.4a (0.1) 11.3a (3.12)
Total Soil (Organic + Mineral)
Control 0.0b CUF 32.8a
NBPT 30.6a PCU 38.7a Urea 28.4a
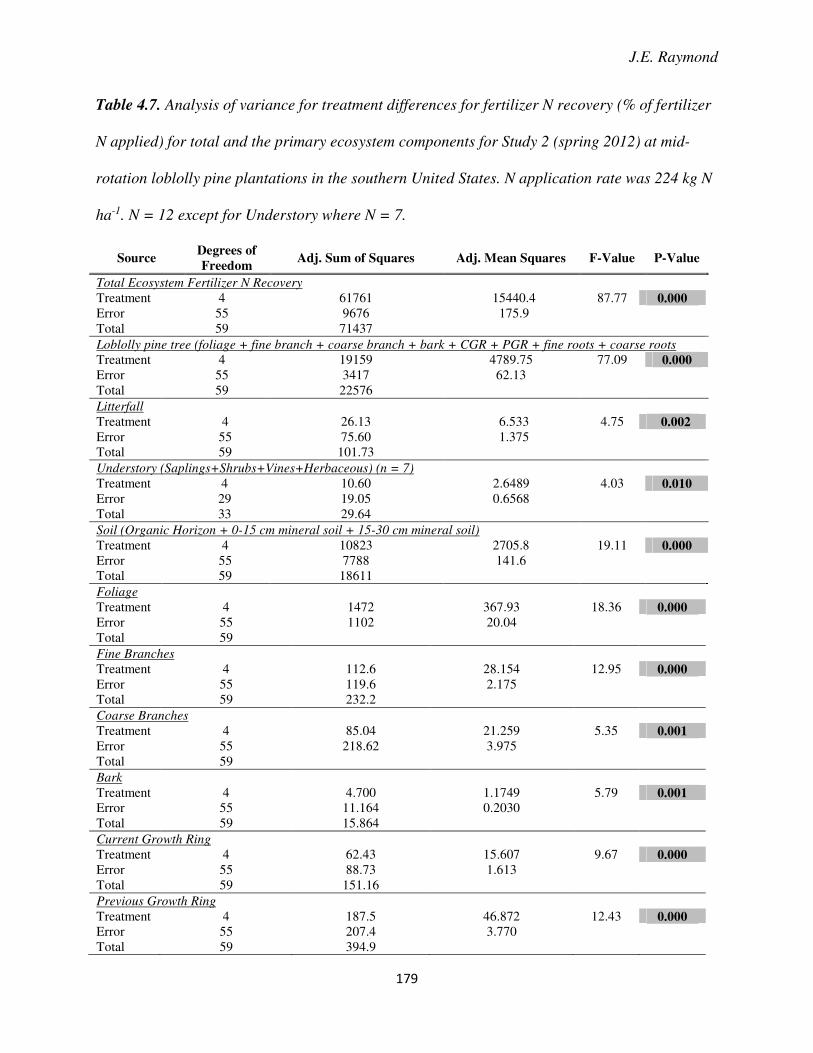
J.E. Raymond
179
Table 4.7. Analysis of variance for treatment differences for fertilizer N recovery (% of fertilizer
N applied) for total and the primary ecosystem components for Study 2 (spring 2012) at mid-
rotation loblolly pine plantations in the southern United States. N application rate was 224 kg N
ha-1. N = 12 except for Understory where N = 7.
Source Degrees of
Freedom Adj. Sum of Squares Adj. Mean Squares F-Value P-Value
Total Ecosystem Fertilizer N Recovery
Treatment 4 61761 15440.4 87.77 0.000 Error 55 9676 175.9 Total 59 71437
Loblolly pine tree (foliage + fine branch + coarse branch + bark + CGR + PGR + fine roots + coarse roots
Treatment 4 19159 4789.75 77.09 0.000 Error 55 3417 62.13 Total 59 22576 Litterfall
Treatment 4 26.13 6.533 4.75 0.002 Error 55 75.60 1.375 Total 59 101.73
Understory (Saplings+Shrubs+Vines+Herbaceous) (n = 7)
Treatment 4 10.60 2.6489 4.03 0.010 Error 29 19.05 0.6568 Total 33 29.64 Soil (Organic Horizon + 0-15 cm mineral soil + 15-30 cm mineral soil)
Treatment 4 10823 2705.8 19.11 0.000 Error 55 7788 141.6 Total 59 18611 Foliage
Treatment 4 1472 367.93 18.36 0.000 Error 55 1102 20.04 Total 59
Fine Branches
Treatment 4 112.6 28.154 12.95 0.000 Error 55 119.6 2.175 Total 59 232.2
Coarse Branches
Treatment 4 85.04 21.259 5.35 0.001 Error 55 218.62 3.975 Total 59
Bark
Treatment 4 4.700 1.1749 5.79 0.001 Error 55 11.164 0.2030 Total 59 15.864
Current Growth Ring
Treatment 4 62.43 15.607 9.67 0.000 Error 55 88.73 1.613 Total 59 151.16
Previous Growth Ring
Treatment 4 187.5 46.872 12.43 0.000 Error 55 207.4 3.770 Total 59 394.9
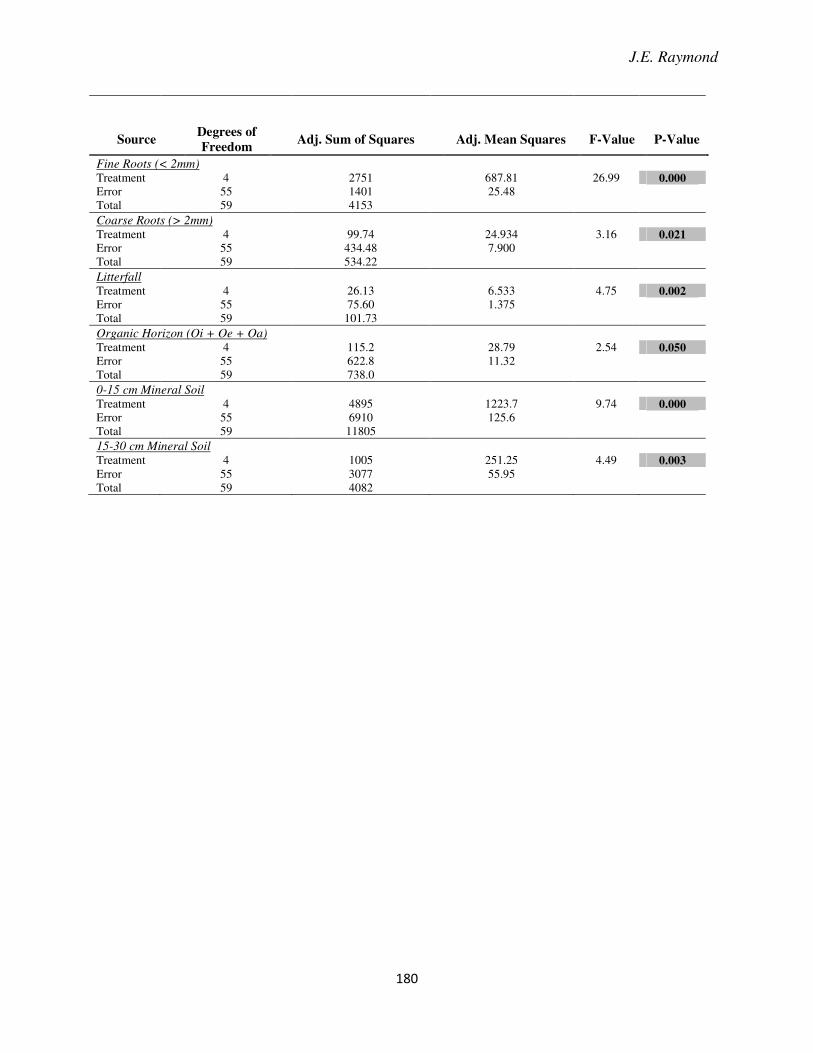
J.E. Raymond
180
Source Degrees of
Freedom Adj. Sum of Squares Adj. Mean Squares F-Value P-Value
Fine Roots (< 2mm) Treatment 4 2751 687.81 26.99 0.000 Error 55 1401 25.48 Total 59 4153
Coarse Roots (> 2mm) Treatment 4 99.74 24.934 3.16 0.021 Error 55 434.48 7.900 Total 59 534.22
Litterfall Treatment 4 26.13 6.533 4.75 0.002 Error 55 75.60 1.375 Total 59 101.73
Organic Horizon (Oi + Oe + Oa) Treatment 4 115.2 28.79 2.54 0.050 Error 55 622.8 11.32 Total 59 738.0
0-15 cm Mineral Soil Treatment 4 4895 1223.7 9.74 0.000 Error 55 6910 125.6 Total 59 11805
15-30 cm Mineral Soil Treatment 4 1005 251.25 4.49 0.003 Error 55 3077 55.95 Total 59 4082
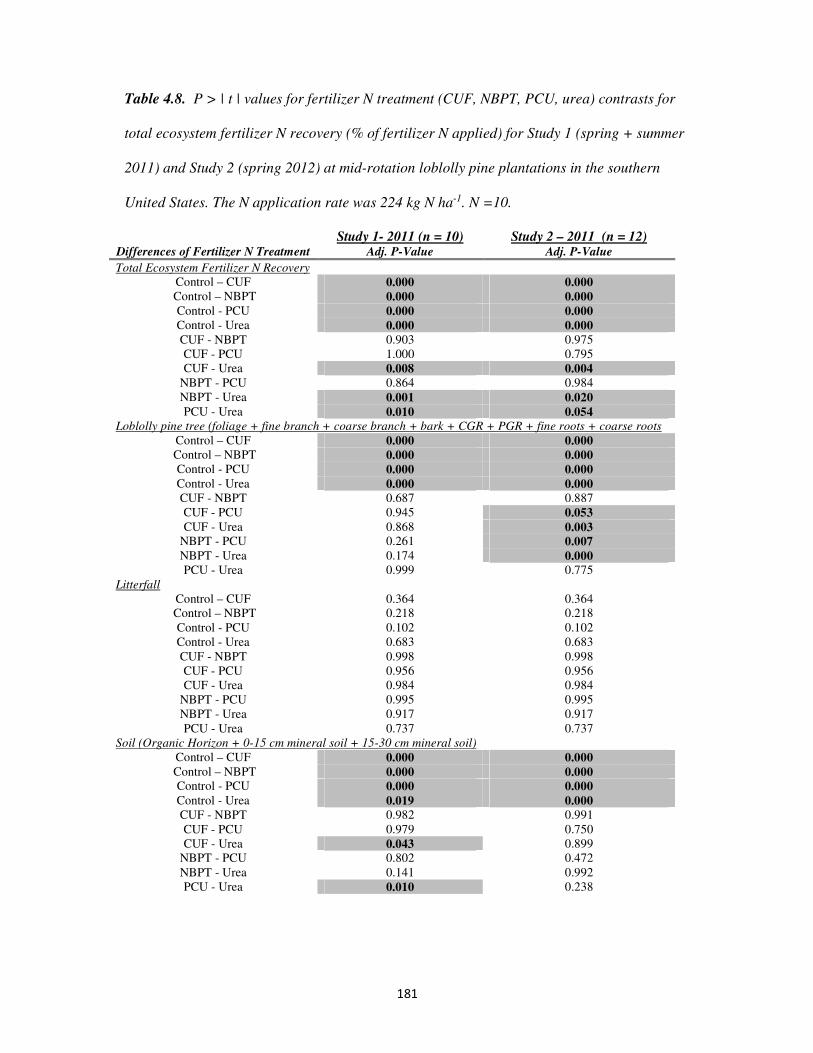
181
Table 4.8. P > | t | values for fertilizer N treatment (CUF, NBPT, PCU, urea) contrasts for
total ecosystem fertilizer N recovery (% of fertilizer N applied) for Study 1 (spring + summer
2011) and Study 2 (spring 2012) at mid-rotation loblolly pine plantations in the southern
United States. The N application rate was 224 kg N ha-1. N =10.
Study 1- 2011 (n = 10) Study 2 – 2011 (n = 12) Differences of Fertilizer N Treatment Adj. P-Value Adj. P-Value
Total Ecosystem Fertilizer N Recovery Control – CUF 0.000 0.000
Control – NBPT 0.000 0.000 Control - PCU 0.000 0.000 Control - Urea 0.000 0.000 CUF - NBPT 0.903 0.975 CUF - PCU 1.000 0.795 CUF - Urea 0.008 0.004
NBPT - PCU 0.864 0.984 NBPT - Urea 0.001 0.020 PCU - Urea 0.010 0.054
Loblolly pine tree (foliage + fine branch + coarse branch + bark + CGR + PGR + fine roots + coarse roots
Control – CUF 0.000 0.000 Control – NBPT 0.000 0.000
Control - PCU 0.000 0.000
Control - Urea 0.000 0.000 CUF - NBPT 0.687 0.887 CUF - PCU 0.945 0.053 CUF - Urea 0.868 0.003
NBPT - PCU 0.261 0.007 NBPT - Urea 0.174 0.000 PCU - Urea 0.999 0.775
Litterfall
Control – CUF 0.364 0.364 Control – NBPT 0.218 0.218
Control - PCU 0.102 0.102
Control - Urea 0.683 0.683
CUF - NBPT 0.998 0.998
CUF - PCU 0.956 0.956
CUF - Urea 0.984 0.984
NBPT - PCU 0.995 0.995
NBPT - Urea 0.917 0.917
PCU - Urea 0.737 0.737 Soil (Organic Horizon + 0-15 cm mineral soil + 15-30 cm mineral soil)
Control – CUF 0.000 0.000 Control – NBPT 0.000 0.000
Control - PCU 0.000 0.000
Control - Urea 0.019 0.000 CUF - NBPT 0.982 0.991 CUF - PCU 0.979 0.750 CUF - Urea 0.043 0.899
NBPT - PCU 0.802 0.472 NBPT - Urea 0.141 0.992
PCU - Urea 0.010 0.238
J.E. Raymond
182
Chapter 5. Summary and Conclusions
5.1. Introduction
Optimizing forest plantations is critical to meet current and future societal demand for
wood products. Improving forest plantation productivity is essential to alleviate pressures to
harvest natural forests that function in providing clean water and air, wildlife habitat, and
biodiversity. The optimization of forest plantation productivity can be achieved through the
development and implementation of site specific management and includes the proper
identification and amelioration of nutrient deficiencies and imbalances to desired tree species.
In the southern United States, nitrogen (N) is generally the most limiting nutrient to growth
due to its disproportional requirement compared to other nutrients in photosynthesis.
Although fertilization with N (and phosphorous - P) has improved production in southern
plantation forests for decades, uncertainties exist to the pathways and mechanisms of applied
fertilizer N cycling in these systems. An improved understanding of the ultimate fate of
fertilizer N in loblolly pine (Pinus taeda L.) plantations is critical to improve site-specific
management for enhancing economic and environmental fertilizer N stewardship in southern
forest systems.
Improving the productivity of forest plantations is critical to meet the current and
projected global demand for traditional and emerging wood-based markets (FAO 2015). The
global optimization of forest plantations is critical to minimize the pressure on intensive
wood harvesting in natural forests which provide clean water and air, wildlife habitat, food,
carbon sequestration, and areas of biodiversity (Sedjo 1995, Fox 2000, Smethhurst 2014,
WWF 2015). Improved forest plantation productivity can be achieved through the
development and implementation of site specific forest management. The identification and
J.E. Raymond
183
amelioration of nutrient deficiencies and imbalances that limit tree growth is an integral
component of site specific forest management. A fundamental understanding of the processes
to improve nutrient availability and the cycling through plants and soils is critical to
developing globally sustainable forest management practices for both plantation and natural
forests.
In the southern United States, there are approximately 15.8 million ha of pine (Pinus
spp.) plantations (Wear and Greis 2012). Nitrogen and P are generally the most limiting
nutrients in the soils that support pine plantations in the southern United States. Both N and P
are required more than other nutrients due to the disproportional demand in photosynthesis
and foliar production (Chapin et al. 1986, Linder 1987, Vitousek and Howarth 1991). The
addition of N and P containing fertilizers since the 1950s has generally increased pine
plantation productivity in the southern United States by ameliorating these N and P nutrient
deficiencies (Allen 1987, Fischer and Binkley 2000, Richter et al. 2000, Allen et al. 2005,
Fox et al. 2007a, b). This finding has led to the annual N + P fertilization of approximately
one third of pine plantations in the South (Albaugh et al. 2004), with additional nutrients
applied when required on a site specific basis (Albaugh et al. 1998, Sampson and Allen 1999,
Jokela and Martin 2000, Vogel and Jokela 2011, Carlson et al. 2014).
Despite significant forest productivity gains from fertilization, uncertainty remains to
the ultimate fate of fertilizer N in these southern pine plantations (Fox et al. 2007a). For
example, some stands are nonresponsive to N fertilization because the fertilizer N may be: 1)
lost from the system via ammonia (NH3) volatilization, nitrification-denitrification, or
leaching; 2) immobilized in the soil by microbial communities or on soil exchange sites; 3)
partitioned into other ecosystem components such as understory competition; or 4) the site
may not be N deficient due to high rates of mineralization from decomposing organic matter
(Pritchett and Smith 1975, Birk and Vitousek 1986, Martin et al. 1999, Amateis et al. 2000,
J.E. Raymond
184
Albaugh et al. 2004, Carlson et al. 2014). Additionally, stands may not respond because
deficiencies of elements other than N create nutrient imbalances that limit growth (Vogel and
Jokela 2011, Carlson et al. 2014), and these sites may respond to N fertilization if the
required nutrients could be properly identified and effectively applied. The cumulative effect
of reduced fertilizer N uptake by trees translates to a lower fertilizer nitrogen use efficiency
(FNUE). An improved understanding of the pathways and mechanisms resulting in the
partitioning of fertilizer N in these pine plantations is needed to improve FNUE to: 1) reduce
negative environmental impacts; 2) improve productivity; and 3)reduce fertilizer inputs, all
critical issues concerning fertilizer with N in production agroecosystems today (Zhang et al.
2015). The inability to accurately determine site responsiveness of loblolly pine (Pinus taeda
L.) plantations to N fertilization hampers basic forest management decisions. Until the
understanding of the mechanisms and interactions governing fertilizer N cycling on a site-
specific basis improves, the ability to accurately predict sites responsive to N fertilization will
be limited.
The primary objective of this research was to improve the understanding N cycling
after fertilization in mid-rotation intensively managed loblolly pine plantations across the
entire range where loblolly pine is operationally viable in the southern United States.
Enhanced efficiency fertilizers were assessed to determine if there could be improvements to
FNUE compared to urea, the conventional form of fertilizer N used in southern forestry. In
Chapters 2, 3 and 4, the following questions were addressed: 1) Does fertilizer N loss,
specifically ammonia (NH3) volatilization, differ between conventional (urea) and enhanced
efficiency N containing fertilizers (see Chapter 2); 2) Does the use of enhanced efficiency N
containing fertilizers impact seasonal N uptake compared to urea of loblolly pines (see
Chapter 3); and 3) Is there a difference in the ecosystem partitioning of fertilizer N among
enhanced efficiency fertilizers and urea (see Chapter 4)? This research used N containing
J.E. Raymond
185
fertilizers enriched with the stable isotope 15N to improve the quantification and
understanding of fertilizer N cycling in loblolly pine plantations. The results from this
research provides forest managers the biological foundation to improve their decisions
concerning the economic feasibility of N fertilization, and whether using enhanced efficiency
N containing fertilizers may improve FNUE in mid-rotation loblolly pine plantations across
the entire southern United States.
This study encompassed diverse stand and site conditions across the primary
ecophysiographic regions of the southern United States where loblolly pine plantations are
operationally viable. Eighteen sites were selected from an existing network of forest thinning
and fertilization studies in mid-rotation loblolly pine plantations across the South for a spring
application of fertilizer N treatments. From these eighteen sites, a subset of six sites were
chosen for a summer application of fertilizer N treatments. Six sites were installed during
2011 and twelve sites in 2012. The six sites with a summer fertilization were installed in
2011. The same six sites installed in 2011 were chosen for both a spring and summer
fertilizer N application to assess fertilizer N loss and temporal N uptake of loblolly pine
5.2. Chapter Results and Discussion
The findings from this research highlight the ability to use enhanced efficiency
fertilizers to improve fertilizer nitrogen use efficiency compared to urea. There are three
primary conclusions from this research:
1) The enhanced efficiency fertilizers used in this research were equal in their ability
to reduce fertilizer N loss through ammonia (NH3) volatilization when compared
to urea, regardless of the timing of application. Although NH3 volatilization was
J.E. Raymond
186
positively correlated with certain weather variables for urea, correlations were
generally weak or negatively correlated with all enhanced efficiency fertilizers,
indicating fertilizer N loss from enhanced efficiency fertilizers was independent
from the weather conditions at the time of application (see Chapter 2).
2) The pattern of fertilizer N uptake by loblolly pines was similar for all fertilizer N
treatments after a spring and summer fertilization. One exception was the PCU
treatment, which had a lower N uptake pattern immediately following application, but
was similar to the other fertilizer treatments towards the middle and end of the
growing season. These results indicate that although release mechanisms and timing
may differ between enhanced efficiency fertilizers and urea, this does not adversely
affect the fertilizer N uptake of loblolly pine trees from EEFs compared to urea. Foliar
development occurred earlier and increased in total amounts (flushes) at the end of the
growing season for fertilized compared to unfertilized treatments. In addition, the
amount of N originating from both the fertilizer and natural system increased in
fertilized compared to unfertilized treatments (see Chapter 3).
3) More total fertilizer N was recovered from the entire ecosystem for all EEFs
compared to urea. There were differences between enhanced efficiency N containing
fertilizers and urea for certain ecosystem components, but few differences between
individual EEFs. Most fertilizer N recovered was either in the loblolly pine tree or
mineral soil, while other ecosystem components were minor sinks for the fertilizer N.
There were also differences between individual EEFs and urea for certain loblolly
pine tree components, indicating an increased FNUE for most EEFs compared to
urea. (see Chapter 4).
J.E. Raymond
187
An improved understanding of how conventional (urea) and enhanced efficiency
fertilizer N cycles through mid-rotation southern loblolly pine forests was provided by this
dissertation research. This research indicates enhanced efficiency N containing fertilizers can
improve fertilizer nitrogen use efficiency when compared to urea, in intensively managed
mid-rotation southern loblolly pine forests. Although there were clear differences between all
the enhanced efficiency N containing fertilizers and urea, there were not clear differences
between individual enhanced efficiency fertilizers.
When the results from individual Chapters are viewed collectively, it would appear
that the release mechanisms have a short term influence on the ecosystem partitioning of
fertilizer N. Urea rapidly releases N that is plant available, but the amount of urea-N lost
through NH3 volatilization can range from 5% to 90% and is generally dependent on weather
conditions at the time of application (Kissel et al. 2004, 2009, Elliot and Fox 2014, see
Chapter 2). Higher urea N losses after fertilization decrease stand FNUE for the stand. The
effects of elevated losses of fertilizer N in forest plantations are similar to agriculture, which
if inappropriately applied can create adverse environmental impacts, especially when viewed
in the context of the entire life cycle of urea production (Galloway et al. 2003, Zhang et al.
2015). Yet because N fertilization in forestry occurs only once or twice during an entire stand
rotation, adverse impacts associated with fertilizer N losses in forestry are primarily
economic due to reduced fertilizer response and the time required to carry the costs of
fertilization before obtaining a revenue stream (10 to 30 years, product dependent). This
contrasts to agriculture where crops, N fertilization, and revenue occurs annually, and the
environmental impacts associated with N fertilization have the potential to be more
problematic.
Although high fertilizer N losses after urea application may translate to a lower
fertilizer response for the stand, this response may not be immediately apparent. Although
J.E. Raymond
188
considerable urea N loss (26% to 49%) occurred after fertilization (see Chapter 2), fertilizer
N uptake of urea N by loblolly pine continued over the entire growing season regardless of
application season (see Chapter 3) which translated to a 30% to 35% fertilizer N uptake by
loblolly pine at the end of a single growing season (see Chapter 4). This percentage of
fertilizer N uptake by loblolly pine after urea fertilization was similar to findings in the
literature (Mead and Pritchett 1975, Albaugh et al. 1998, 2004, Blazier et al. 2006).
Conversely, fertilizer N loss after application of enhanced efficiency N containing fertilizers
(4% to 26%) was considerably lower than urea (see Chapter 2). Although fertilizer N uptake
patterns of most EEFs were similar to urea by loblolly pine over the entire growing season
regardless of application season (see Chapter 3), fertilizer N uptake ranged from 30% to 50%
for EEFs (see Chapter 4). Clearly and increase in FNUE occurred for EEFs compared to urea
in these mid-rotation southern loblolly pine forests. Additionally, fertilizer N remaining in the
soil was generally greater for EEFs (31% to 43%) compared to urea (21% to 28%). Future
research will need to determine whether additional gains in stand FNUE occur from N uptake
of fertilizer N that remained in the soil, or if the fertilizer N that remained in the soil is
immobilized and unavailable for plant uptake.
Although the findings of this research have addressed specific fundamental questions
concerning N cycling after fertilization in intensively managed mid-rotation loblolly pine
forests across the southern United States, key questions remain. Directions of future research
should include (Figure 5.1):
1) Loss mechanisms of fertilizer N during winter months. Although this research
focused on N fertilization in spring and summer, most forest fertilization in the
South occurs during winter months. Three questions specific to winter fertilization
with N are: 1) does a larger percentage of fertilizer N loss from urea occur through
J.E. Raymond
189
denitrification and/or leaching during the winter; 2) can enhanced efficiency
fertilizers reduce losses during a winter application period, and 3) does N uptake
by loblolly pines after a winter fertilization differ from spring and summer? This
question is especially important for bedded sites where 50% of the site may be
interbedded and inundated during the winter. Denitrification, as shown by
Shreshta et al. (2014) could be an increasingly important loss pathway for
fertilizer N after a winter fertilization with N.
2) Fertilizer application rates using enhanced efficiency fertilizers. This research has
shown that EEFs can reduce fertilizer N losses, translating to increased fertilizer N
remaining in the system. If fertilizer N application using EEFs could be reduced
between 20% to 50%, the amount of fertilizer N lost following urea fertilization,
could similar productivity gains occur with the current N fertilization rates of
urea?
3) Long term cycling of fertilizer N originating from enhanced efficiency fertilizers.
Because more fertilizer N remained in the loblolly pine system with EEFs
compared to urea, what does this mean? Do the incremental gains in fertilizer N
retention for the entire loblolly pine plantation ecosystem for EEFs compared to
urea translate to a sustained release of fertilizer N into the stand rotation? If yes,
does this continue to increase FNUE?
4) Productivity gains. Although there was a general trend in fertilizer N uptake for
the entire tree for the EEFs compared to urea, does this translate to an increase in
stand productivity, or is this luxury consumption for the trees with little gain in
productivity? This study was co-located with numerous fertilizer and thinning
trials, and the results from this research will need to be integrated with the results
from these existing fertilizer and thinning trials.
J.E. Raymond
190
The findings of this research provide forest managers the biological foundation of the
positive attributes in using enhanced efficiency fertilizers to improve fertilizer nitrogen use
efficiency in mid-rotation loblolly pine plantations across the southern United States when
compared to urea, the current primary sources of fertilizer N in forestry. Forest managers will
need to determine whether the positive attributes of enhanced efficiency fertilizers shown in
this study are economic viable within the constructs of their land management. Future
research will continue to refine the understanding of N cycling after fertilization with N
through the aforementioned recommended research directions to achieve sustained
incremental gains in productivity in loblolly pine plantations in the southern United States.
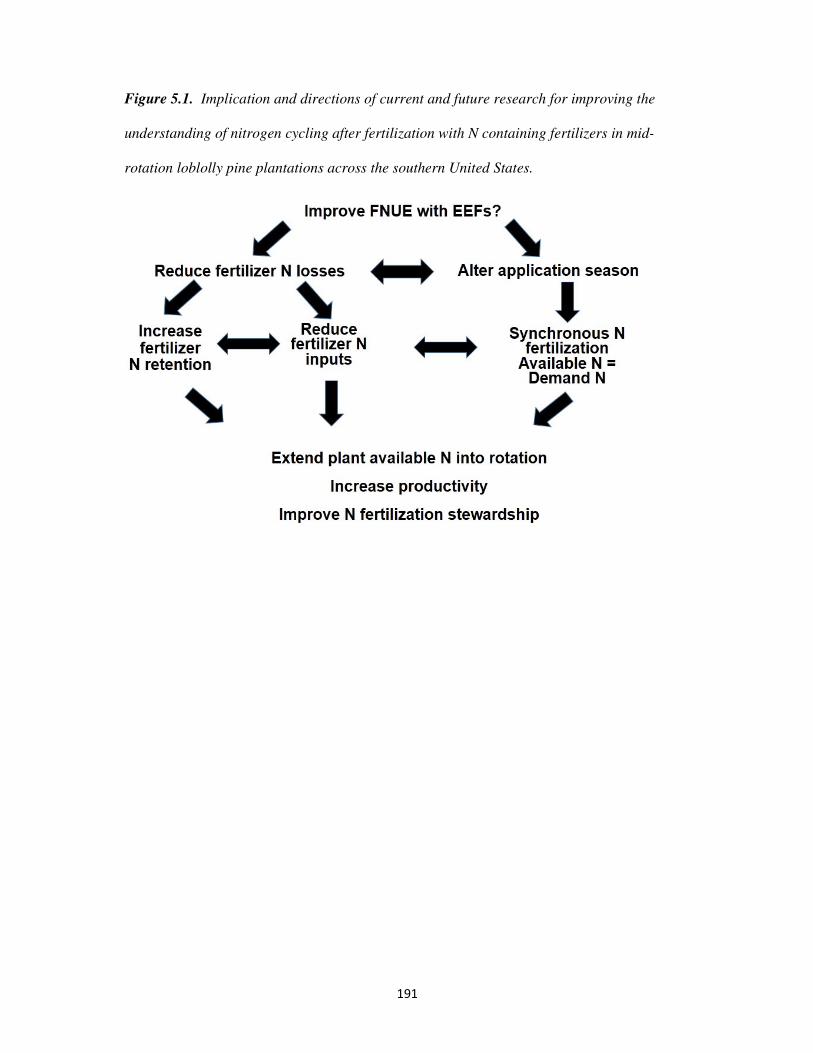
191
Figure 5.1. Implication and directions of current and future research for improving the
understanding of nitrogen cycling after fertilization with N containing fertilizers in mid-
rotation loblolly pine plantations across the southern United States.
192
Literature Cited Albaugh, T.J., H. L. Allen, P. M. Dougherty, and K. H. Johnsen. 2004. Long term growth
responses of loblolly pine to optimal nutrient and water resource availability. For. Ecol. Manage. 192:3-19.
Albaugh, T.A., H.L. Allen, and T.R. Fox. 2007. Historical patterns of forest fertilization in
the southern United States from 1969 to 2004. South. J. Appl. For. 31(3):129-137. Allen, H.L. 1987. Forest fertilizers: nutrient amendment, and productivity, and environmental
impact. J. For. 85: 37-46. Amateis, R. L., J. Liu, M. J. Ducey and H. L. Allen. 2000. Modeling response to midrotation
nitrogen and phosphorus fertilization in loblolly pine plantations. South. J. Appl. For. 24:207-212.
Birk, E.M., and P.M. Vitousek. 1986. Nitrogen availability and nitrogen use efficiency in
loblolly pine stands. Ecology. 67(1):69-79. Cabrera, M.L., D.E. Kissel, N. Vaio, J. R. Craig, J.A. Rema, and L.A. Morris. 2005. Loblolly
pine needles retain urea fertilizer that can be lost as ammonia. Soil Sci. Soc. Am. J. 69(5):1525-1531
Carlson, C. A., T.R. Fox, H.L. Allen, T. J. Albaugh, R.A. Rubilar, J.L. Stape. 2014. Growth responses of loblolly pine in the southeast united states to midrotation applications of nitrogen, phosphorus, potassium, and micronutrients. For. Sci. 60(1):157-169.
Chapin, F.S., P.M. Vitousek, and K. Van Cleve. 1986. The nature of nutrient limitation in
plant-communities. Am Nat 127: 48–58. doi: 10.1086/284466. Elliot, J.R., and T.R. Fox. 2014. Ammonia volatilization following fertilization with urea or
ureaform in a thinned loblolly pine plantation. Soil Sci. Soc. Am. J. 78:1469–1473. doi:10.2136/sssaj2013.12.0512n.
Fisher, R.F., and D. Binkley. 2000. Ecology and Management of Forest Soils. John Wiley &
Sons. New York, NY. Fox, T.R. 2000. Sustained productivity in intensively managed forest plantations. For. Ecol.
Manage. 138:187-202. Fox, T.R., E.J. Jokela, and H.L. Allen. 2007a. The development of pine plantation silviculture
in the southern United States. J. For. 105(5):337-347. Fox, T.R., H. L. Allen, T. J. Albaugh, R. Rubilar, and C.A. Carlson. 2007b. Tree nutrition
and forest fertilization of pine plantations in the southern United States. South. J. Appl. For. 31(1):5-11.
Jokela, E.J. and T.A Martin. 2000. Effects of ontogeny and soil nutrient supply on production,
allocation, and leaf area efficiency in loblolly and slash pine stands. Can. J. For. Res. 30:1511-1524.
J.E. Raymond
193
Kissel, D., M. Cabrera, N. Vaio, J. Craig, J. Rema, and L. Morris. 2004. Rainfall timing and ammonia loss from urea in a loblolly pine plantation. Soil Sci. Soc. Am. J. 68:1744–1750. doi:10.2136/sssaj2004.1744
Kissel, D., M.L. Cabrera, N. Vaio, J.R. Craig, J.A. Rema, and L.A. Morris. 2009. Forest floor
composition and ammonia loss from urea in a loblolly pine plantation. Soil Sci. Soc. Am. J. 73(2):630–637. doi:10.2136/sssaj2007.0377
Linder, S. 1987. Responses to water and nutrients in coniferous ecosystems. In: Potentials
and limitations of ecosystems analysis. Ecol. Studies 61, Schulze, E.D., and H.Z. Wolfer (eds.). Springer-Verlag, New York, NY. p. 180–202
Martin, S.W., R.L. Bailey, and E.J. Jokela. 1999. Growth and yield predictions for lower
Coastal Plain slash pine plantations fertilized at mid-rotation. South. J. Appl. For. 23:39-45.
Pritchett, W.L., W.H. Smith. 1972. Fertilizer response in young slash pine stands. Soil Sci.
Soc. Amer. J. 36(4): 660–663. Shrestha, R., B.D. Strahm, and E.B. Sucre. 2014. Nitrous oxide fluxes in fertilized Pinus
taeda plantations across a gradient of soil drainage classes. J. Envir. Qual. 43:1823–1832.
Vitousek, P.M., and P. A. Matson. 1985. Intensive harvesting and site preparation decrease
soil nitrogen availability in young plantations. South. J. Appl. For. 9:120-125. Vitousek, P. M., and R. W. Howarth. 1991. Nitrogen limitation on land and in the sea - how
can it occur? Biogeochemistry. 13:87–115. Vogel, J.G. and E.J. Jokela. 2011. Micronutrient limitations in two managed southern pine
stands planted on Florida Spodosols. Soil Science Society of America Journal. 75(3):1117-1124.
Wear, D.N., and J.G. Greis. 2012. The Southern Forests Futures Project: Summary Report.
Gen. Tech. Rep. SRS-168. Asheville, NC: U.S. Department of Agriculture Forest Service, Southern Research Station. 13p.
Zerpa, J.L., and T.R. Fox. 2011. Controls on volatile NH3 losses from loblolly pine
plantations fertilized with urea in the southeast USA. Soil Sci. Soc. Am. J. 75:257–266. doi:10.2136/sssaj2010.0101.

194
Appendix
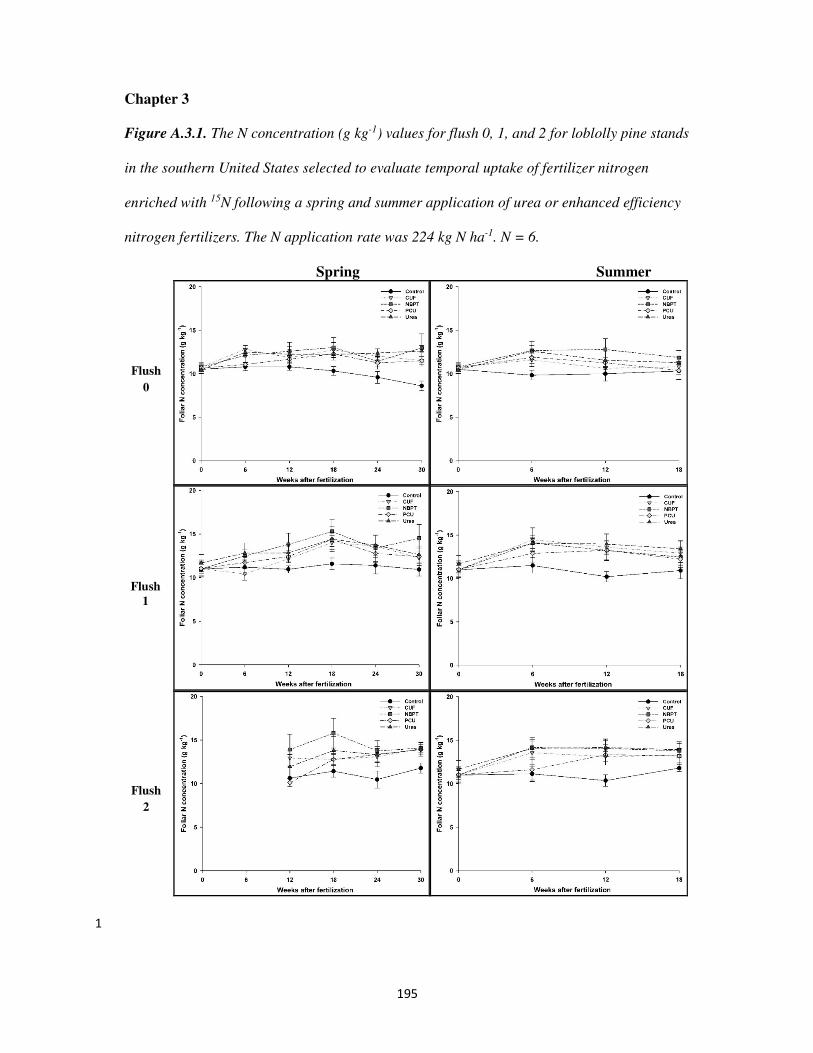
195
Chapter 3
Figure A.3.1. The N concentration (g kg-1) values for flush 0, 1, and 2 for loblolly pine stands
in the southern United States selected to evaluate temporal uptake of fertilizer nitrogen
enriched with 15N following a spring and summer application of urea or enhanced efficiency
nitrogen fertilizers. The N application rate was 224 kg N ha-1. N = 6.
Spring Summer
1
Flush
0
Flush
1
Flush
2
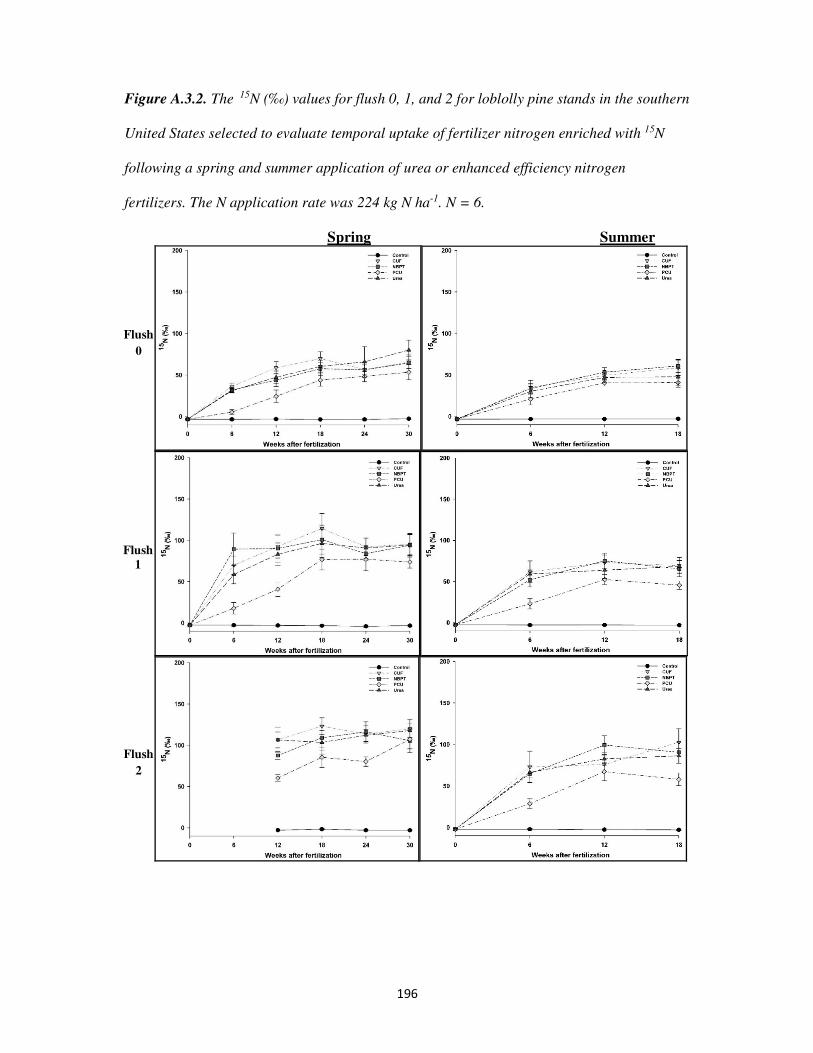
196
Figure A.3.2. The 15N (‰) values for flush 0, 1, and 2 for loblolly pine stands in the southern
United States selected to evaluate temporal uptake of fertilizer nitrogen enriched with 15N
following a spring and summer application of urea or enhanced efficiency nitrogen
fertilizers. The N application rate was 224 kg N ha-1. N = 6.
Spring Summer
Flush
0
Flush
1
Flush
2
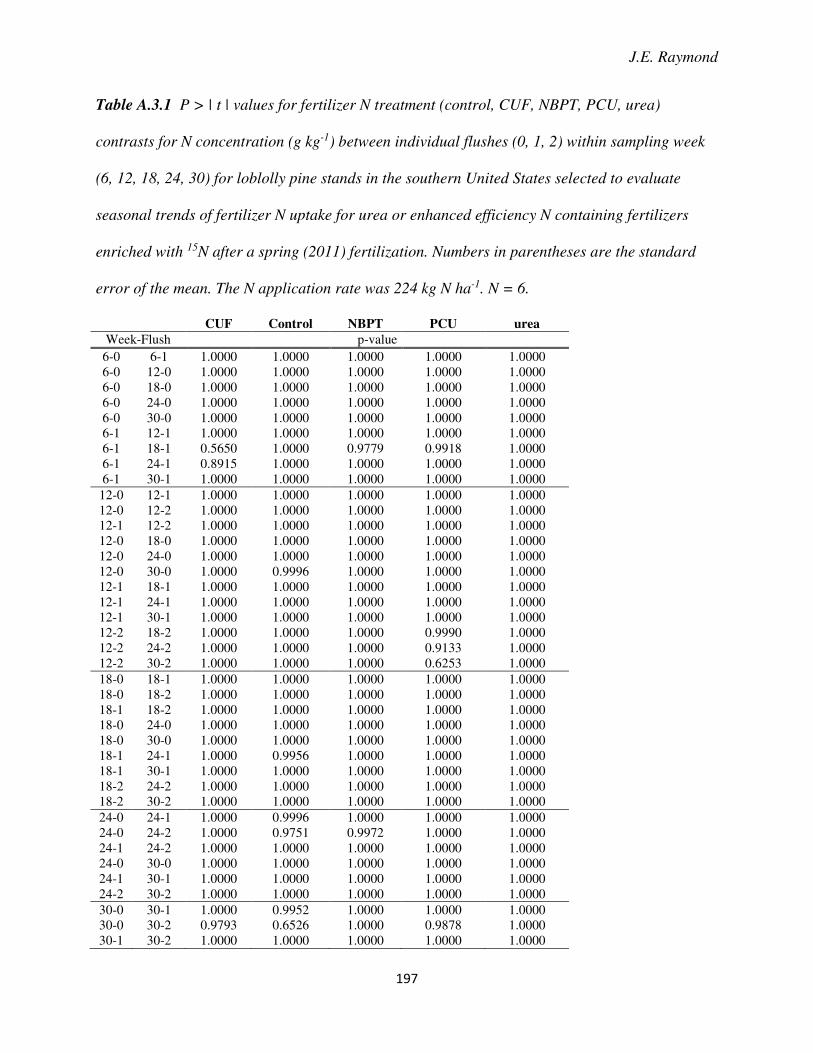
J.E. Raymond
197
Table A.3.1 P > | t | values for fertilizer N treatment (control, CUF, NBPT, PCU, urea)
contrasts for N concentration (g kg-1) between individual flushes (0, 1, 2) within sampling week
(6, 12, 18, 24, 30) for loblolly pine stands in the southern United States selected to evaluate
seasonal trends of fertilizer N uptake for urea or enhanced efficiency N containing fertilizers
enriched with 15N after a spring (2011) fertilization. Numbers in parentheses are the standard
error of the mean. The N application rate was 224 kg N ha-1. N = 6.
CUF Control NBPT PCU urea
Week-Flush p-value 6-0 6-1 1.0000 1.0000 1.0000 1.0000 1.0000 6-0 12-0 1.0000 1.0000 1.0000 1.0000 1.0000 6-0 18-0 1.0000 1.0000 1.0000 1.0000 1.0000 6-0 24-0 1.0000 1.0000 1.0000 1.0000 1.0000 6-0 30-0 1.0000 1.0000 1.0000 1.0000 1.0000
6-1 12-1 1.0000 1.0000 1.0000 1.0000 1.0000 6-1 18-1 0.5650 1.0000 0.9779 0.9918 1.0000 6-1 24-1 0.8915 1.0000 1.0000 1.0000 1.0000 6-1 30-1 1.0000 1.0000 1.0000 1.0000 1.0000
12-0 12-1 1.0000 1.0000 1.0000 1.0000 1.0000 12-0 12-2 1.0000 1.0000 1.0000 1.0000 1.0000 12-1 12-2 1.0000 1.0000 1.0000 1.0000 1.0000 12-0 18-0 1.0000 1.0000 1.0000 1.0000 1.0000 12-0 24-0 1.0000 1.0000 1.0000 1.0000 1.0000 12-0 30-0 1.0000 0.9996 1.0000 1.0000 1.0000 12-1 18-1 1.0000 1.0000 1.0000 1.0000 1.0000 12-1 24-1 1.0000 1.0000 1.0000 1.0000 1.0000 12-1 30-1 1.0000 1.0000 1.0000 1.0000 1.0000 12-2 18-2 1.0000 1.0000 1.0000 0.9990 1.0000 12-2 24-2 1.0000 1.0000 1.0000 0.9133 1.0000 12-2 30-2 1.0000 1.0000 1.0000 0.6253 1.0000 18-0 18-1 1.0000 1.0000 1.0000 1.0000 1.0000 18-0 18-2 1.0000 1.0000 1.0000 1.0000 1.0000 18-1 18-2 1.0000 1.0000 1.0000 1.0000 1.0000 18-0 24-0 1.0000 1.0000 1.0000 1.0000 1.0000 18-0 30-0 1.0000 1.0000 1.0000 1.0000 1.0000 18-1 24-1 1.0000 0.9956 1.0000 1.0000 1.0000 18-1 30-1 1.0000 1.0000 1.0000 1.0000 1.0000 18-2 24-2 1.0000 1.0000 1.0000 1.0000 1.0000 18-2 30-2 1.0000 1.0000 1.0000 1.0000 1.0000 24-0 24-1 1.0000 0.9996 1.0000 1.0000 1.0000 24-0 24-2 1.0000 0.9751 0.9972 1.0000 1.0000 24-1 24-2 1.0000 1.0000 1.0000 1.0000 1.0000 24-0 30-0 1.0000 1.0000 1.0000 1.0000 1.0000 24-1 30-1 1.0000 1.0000 1.0000 1.0000 1.0000 24-2 30-2 1.0000 1.0000 1.0000 1.0000 1.0000 30-0 30-1 1.0000 0.9952 1.0000 1.0000 1.0000 30-0 30-2 0.9793 0.6526 1.0000 0.9878 1.0000 30-1 30-2 1.0000 1.0000 1.0000 1.0000 1.0000
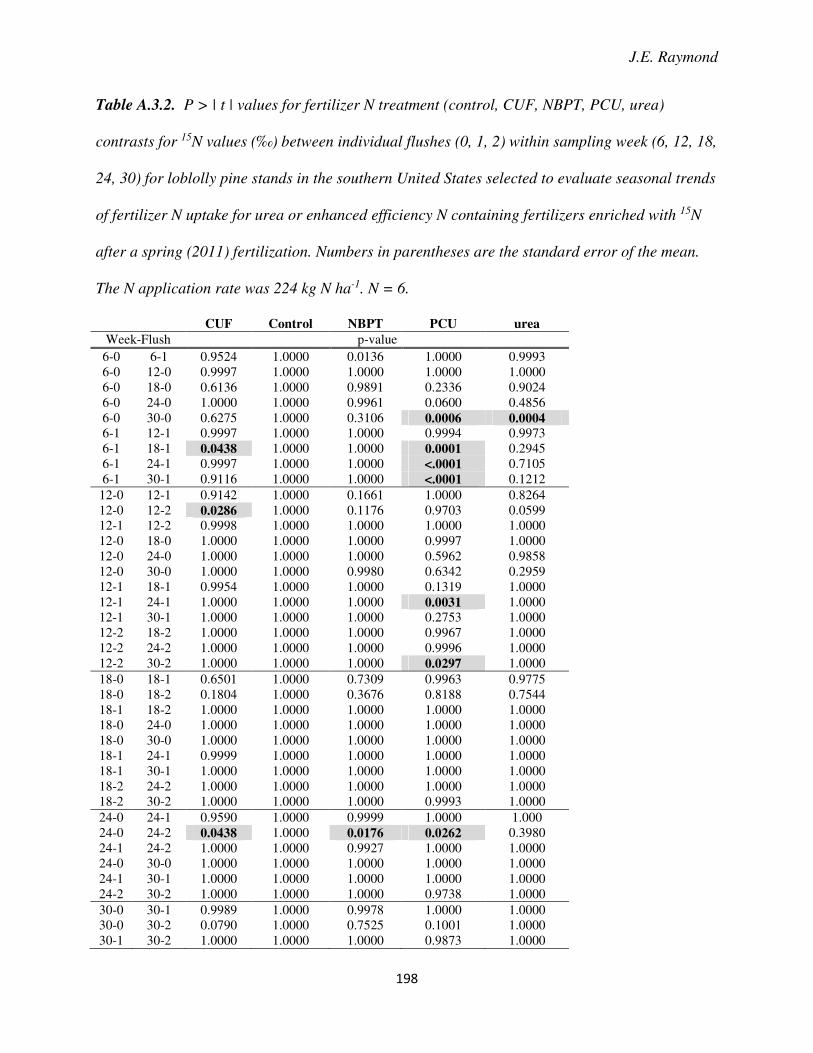
J.E. Raymond
198
Table A.3.2. P > | t | values for fertilizer N treatment (control, CUF, NBPT, PCU, urea)
contrasts for 15N values (‰) between individual flushes (0, 1, 2) within sampling week (6, 12, 18,
24, 30) for loblolly pine stands in the southern United States selected to evaluate seasonal trends
of fertilizer N uptake for urea or enhanced efficiency N containing fertilizers enriched with 15N
after a spring (2011) fertilization. Numbers in parentheses are the standard error of the mean.
The N application rate was 224 kg N ha-1. N = 6.
CUF Control NBPT PCU urea
Week-Flush p-value 6-0 6-1 0.9524 1.0000 0.0136 1.0000 0.9993 6-0 12-0 0.9997 1.0000 1.0000 1.0000 1.0000 6-0 18-0 0.6136 1.0000 0.9891 0.2336 0.9024 6-0 24-0 1.0000 1.0000 0.9961 0.0600 0.4856 6-0 30-0 0.6275 1.0000 0.3106 0.0006 0.0004 6-1 12-1 0.9997 1.0000 1.0000 0.9994 0.9973 6-1 18-1 0.0438 1.0000 1.0000 0.0001 0.2945 6-1 24-1 0.9997 1.0000 1.0000 <.0001 0.7105 6-1 30-1 0.9116 1.0000 1.0000 <.0001 0.1212
12-0 12-1 0.9142 1.0000 0.1661 1.0000 0.8264 12-0 12-2 0.0286 1.0000 0.1176 0.9703 0.0599 12-1 12-2 0.9998 1.0000 1.0000 1.0000 1.0000 12-0 18-0 1.0000 1.0000 1.0000 0.9997 1.0000 12-0 24-0 1.0000 1.0000 1.0000 0.5962 0.9858 12-0 30-0 1.0000 1.0000 0.9980 0.6342 0.2959 12-1 18-1 0.9954 1.0000 1.0000 0.1319 1.0000 12-1 24-1 1.0000 1.0000 1.0000 0.0031 1.0000 12-1 30-1 1.0000 1.0000 1.0000 0.2753 1.0000 12-2 18-2 1.0000 1.0000 1.0000 0.9967 1.0000 12-2 24-2 1.0000 1.0000 1.0000 0.9996 1.0000 12-2 30-2 1.0000 1.0000 1.0000 0.0297 1.0000 18-0 18-1 0.6501 1.0000 0.7309 0.9963 0.9775 18-0 18-2 0.1804 1.0000 0.3676 0.8188 0.7544 18-1 18-2 1.0000 1.0000 1.0000 1.0000 1.0000 18-0 24-0 1.0000 1.0000 1.0000 1.0000 1.0000 18-0 30-0 1.0000 1.0000 1.0000 1.0000 1.0000 18-1 24-1 0.9999 1.0000 1.0000 1.0000 1.0000 18-1 30-1 1.0000 1.0000 1.0000 1.0000 1.0000 18-2 24-2 1.0000 1.0000 1.0000 1.0000 1.0000 18-2 30-2 1.0000 1.0000 1.0000 0.9993 1.0000 24-0 24-1 0.9590 1.0000 0.9999 1.0000 1.000 24-0 24-2 0.0438 1.0000 0.0176 0.0262 0.3980 24-1 24-2 1.0000 1.0000 0.9927 1.0000 1.0000 24-0 30-0 1.0000 1.0000 1.0000 1.0000 1.0000 24-1 30-1 1.0000 1.0000 1.0000 1.0000 1.0000 24-2 30-2 1.0000 1.0000 1.0000 0.9738 1.0000 30-0 30-1 0.9989 1.0000 0.9978 1.0000 1.0000 30-0 30-2 0.0790 1.0000 0.7525 0.1001 1.0000 30-1 30-2 1.0000 1.0000 1.0000 0.9873 1.0000
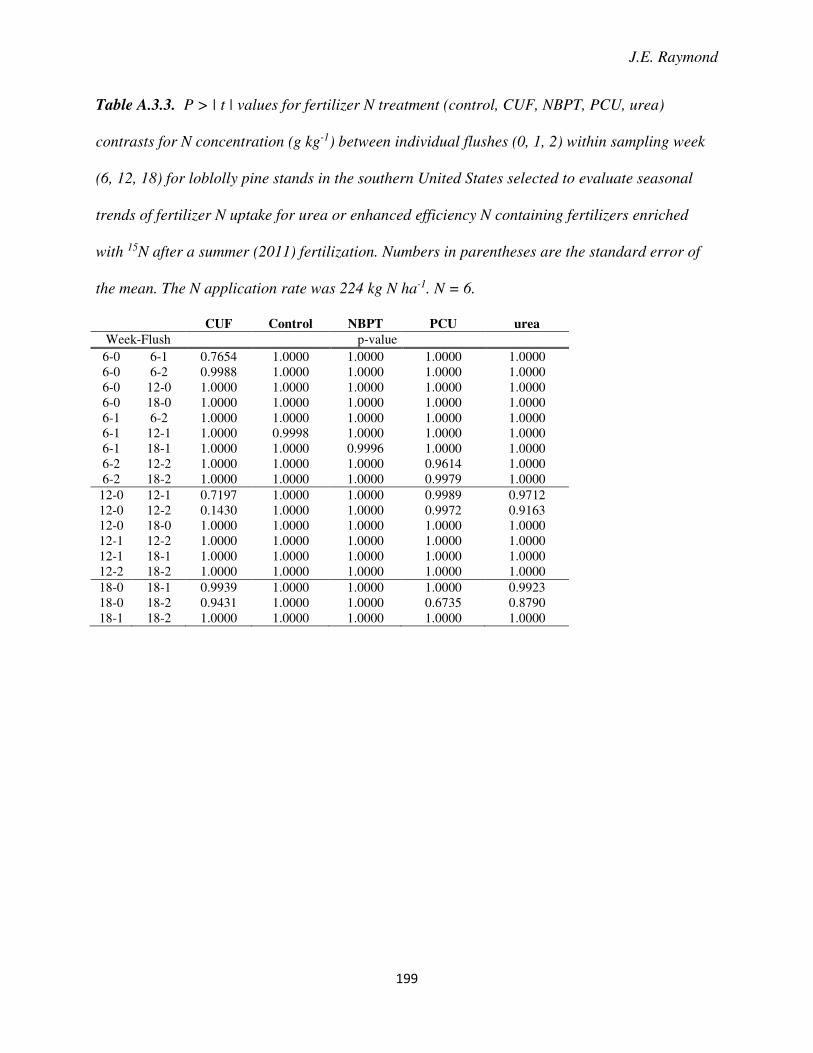
J.E. Raymond
199
Table A.3.3. P > | t | values for fertilizer N treatment (control, CUF, NBPT, PCU, urea)
contrasts for N concentration (g kg-1) between individual flushes (0, 1, 2) within sampling week
(6, 12, 18) for loblolly pine stands in the southern United States selected to evaluate seasonal
trends of fertilizer N uptake for urea or enhanced efficiency N containing fertilizers enriched
with 15N after a summer (2011) fertilization. Numbers in parentheses are the standard error of
the mean. The N application rate was 224 kg N ha-1. N = 6.
CUF Control NBPT PCU urea
Week-Flush p-value 6-0 6-1 0.7654 1.0000 1.0000 1.0000 1.0000 6-0 6-2 0.9988 1.0000 1.0000 1.0000 1.0000 6-0 12-0 1.0000 1.0000 1.0000 1.0000 1.0000 6-0 18-0 1.0000 1.0000 1.0000 1.0000 1.0000 6-1 6-2 1.0000 1.0000 1.0000 1.0000 1.0000 6-1 12-1 1.0000 0.9998 1.0000 1.0000 1.0000 6-1 18-1 1.0000 1.0000 0.9996 1.0000 1.0000 6-2 12-2 1.0000 1.0000 1.0000 0.9614 1.0000 6-2 18-2 1.0000 1.0000 1.0000 0.9979 1.0000
12-0 12-1 0.7197 1.0000 1.0000 0.9989 0.9712 12-0 12-2 0.1430 1.0000 1.0000 0.9972 0.9163 12-0 18-0 1.0000 1.0000 1.0000 1.0000 1.0000 12-1 12-2 1.0000 1.0000 1.0000 1.0000 1.0000 12-1 18-1 1.0000 1.0000 1.0000 1.0000 1.0000 12-2 18-2 1.0000 1.0000 1.0000 1.0000 1.0000 18-0 18-1 0.9939 1.0000 1.0000 1.0000 0.9923 18-0 18-2 0.9431 1.0000 1.0000 0.6735 0.8790 18-1 18-2 1.0000 1.0000 1.0000 1.0000 1.0000
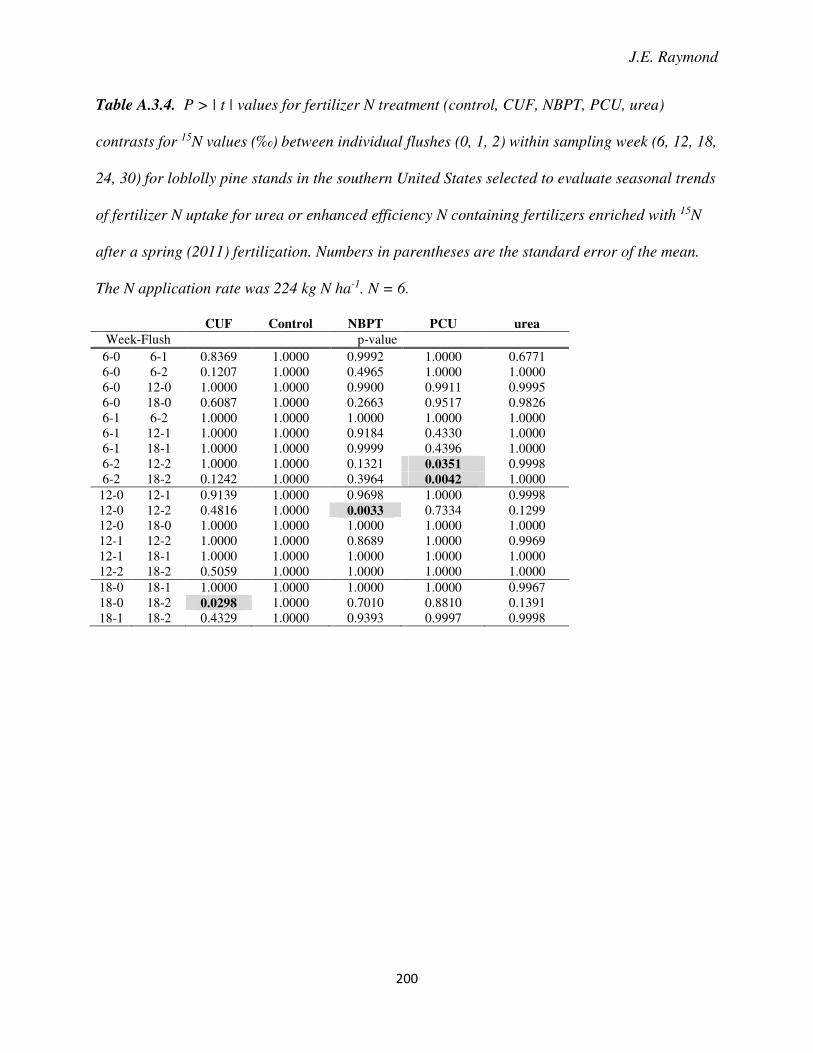
J.E. Raymond
200
Table A.3.4. P > | t | values for fertilizer N treatment (control, CUF, NBPT, PCU, urea)
contrasts for 15N values (‰) between individual flushes (0, 1, 2) within sampling week (6, 12, 18,
24, 30) for loblolly pine stands in the southern United States selected to evaluate seasonal trends
of fertilizer N uptake for urea or enhanced efficiency N containing fertilizers enriched with 15N
after a spring (2011) fertilization. Numbers in parentheses are the standard error of the mean.
The N application rate was 224 kg N ha-1. N = 6.
CUF Control NBPT PCU urea
Week-Flush p-value 6-0 6-1 0.8369 1.0000 0.9992 1.0000 0.6771 6-0 6-2 0.1207 1.0000 0.4965 1.0000 1.0000 6-0 12-0 1.0000 1.0000 0.9900 0.9911 0.9995 6-0 18-0 0.6087 1.0000 0.2663 0.9517 0.9826 6-1 6-2 1.0000 1.0000 1.0000 1.0000 1.0000 6-1 12-1 1.0000 1.0000 0.9184 0.4330 1.0000 6-1 18-1 1.0000 1.0000 0.9999 0.4396 1.0000 6-2 12-2 1.0000 1.0000 0.1321 0.0351 0.9998 6-2 18-2 0.1242 1.0000 0.3964 0.0042 1.0000
12-0 12-1 0.9139 1.0000 0.9698 1.0000 0.9998 12-0 12-2 0.4816 1.0000 0.0033 0.7334 0.1299 12-0 18-0 1.0000 1.0000 1.0000 1.0000 1.0000 12-1 12-2 1.0000 1.0000 0.8689 1.0000 0.9969 12-1 18-1 1.0000 1.0000 1.0000 1.0000 1.0000 12-2 18-2 0.5059 1.0000 1.0000 1.0000 1.0000 18-0 18-1 1.0000 1.0000 1.0000 1.0000 0.9967 18-0 18-2 0.0298 1.0000 0.7010 0.8810 0.1391 18-1 18-2 0.4329 1.0000 0.9393 0.9997 0.9998
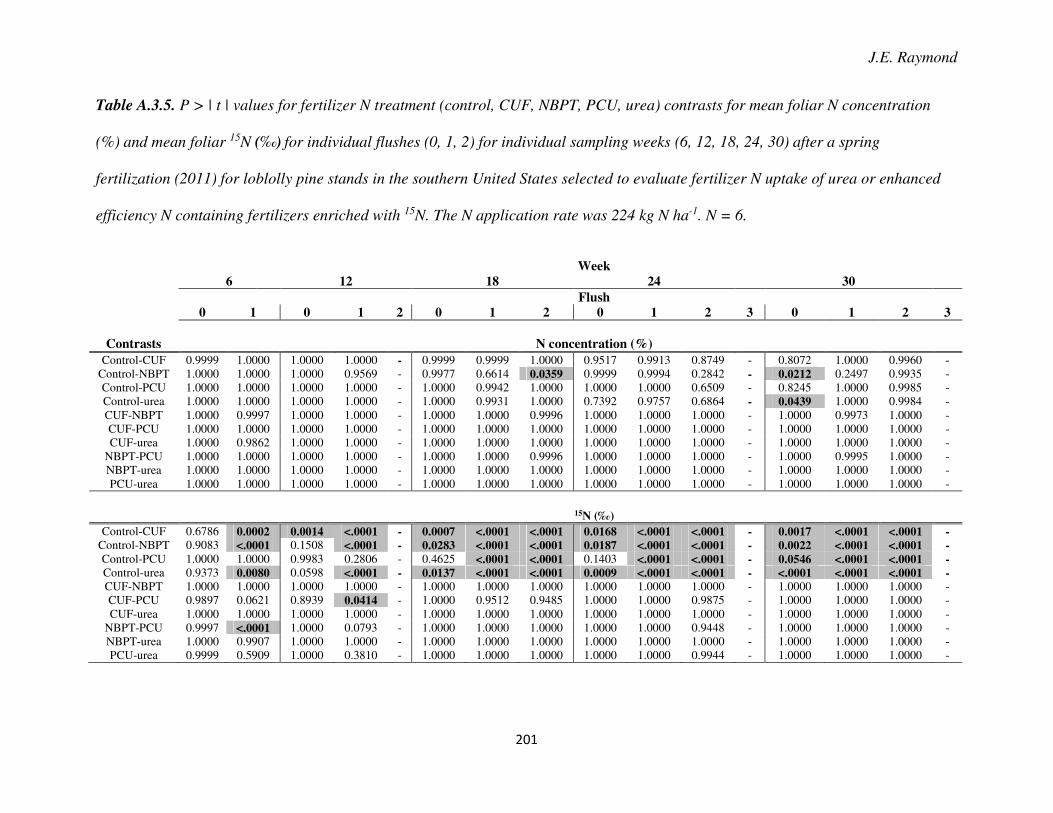
J.E. Raymond
201
Table A.3.5. P > | t | values for fertilizer N treatment (control, CUF, NBPT, PCU, urea) contrasts for mean foliar N concentration
(%) and mean foliar 15N (‰) for individual flushes (0, 1, 2) for individual sampling weeks (6, 12, 18, 24, 30) after a spring
fertilization (2011) for loblolly pine stands in the southern United States selected to evaluate fertilizer N uptake of urea or enhanced
efficiency N containing fertilizers enriched with 15N. The N application rate was 224 kg N ha-1. N = 6.
Week
6 12 18 24 30
Flush
0 1 0 1 2 0 1 2 0 1 2 3 0 1 2 3
Contrasts N concentration (%)
Control-CUF 0.9999 1.0000 1.0000 1.0000 - 0.9999 0.9999 1.0000 0.9517 0.9913 0.8749 - 0.8072 1.0000 0.9960 - Control-NBPT 1.0000 1.0000 1.0000 0.9569 - 0.9977 0.6614 0.0359 0.9999 0.9994 0.2842 - 0.0212 0.2497 0.9935 - Control-PCU 1.0000 1.0000 1.0000 1.0000 - 1.0000 0.9942 1.0000 1.0000 1.0000 0.6509 - 0.8245 1.0000 0.9985 - Control-urea 1.0000 1.0000 1.0000 1.0000 - 1.0000 0.9931 1.0000 0.7392 0.9757 0.6864 - 0.0439 1.0000 0.9984 - CUF-NBPT 1.0000 0.9997 1.0000 1.0000 - 1.0000 1.0000 0.9996 1.0000 1.0000 1.0000 - 1.0000 0.9973 1.0000 - CUF-PCU 1.0000 1.0000 1.0000 1.0000 - 1.0000 1.0000 1.0000 1.0000 1.0000 1.0000 - 1.0000 1.0000 1.0000 - CUF-urea 1.0000 0.9862 1.0000 1.0000 - 1.0000 1.0000 1.0000 1.0000 1.0000 1.0000 - 1.0000 1.0000 1.0000 -
NBPT-PCU 1.0000 1.0000 1.0000 1.0000 - 1.0000 1.0000 0.9996 1.0000 1.0000 1.0000 - 1.0000 0.9995 1.0000 - NBPT-urea 1.0000 1.0000 1.0000 1.0000 - 1.0000 1.0000 1.0000 1.0000 1.0000 1.0000 - 1.0000 1.0000 1.0000 - PCU-urea 1.0000 1.0000 1.0000 1.0000 - 1.0000 1.0000 1.0000 1.0000 1.0000 1.0000 - 1.0000 1.0000 1.0000 -
15N (‰)
Control-CUF 0.6786 0.0002 0.0014 <.0001 - 0.0007 <.0001 <.0001 0.0168 <.0001 <.0001 - 0.0017 <.0001 <.0001 - Control-NBPT 0.9083 <.0001 0.1508 <.0001 - 0.0283 <.0001 <.0001 0.0187 <.0001 <.0001 - 0.0022 <.0001 <.0001 - Control-PCU 1.0000 1.0000 0.9983 0.2806 - 0.4625 <.0001 <.0001 0.1403 <.0001 <.0001 - 0.0546 <.0001 <.0001 - Control-urea 0.9373 0.0080 0.0598 <.0001 - 0.0137 <.0001 <.0001 0.0009 <.0001 <.0001 - <.0001 <.0001 <.0001 - CUF-NBPT 1.0000 1.0000 1.0000 1.0000 - 1.0000 1.0000 1.0000 1.0000 1.0000 1.0000 - 1.0000 1.0000 1.0000 - CUF-PCU 0.9897 0.0621 0.8939 0.0414 - 1.0000 0.9512 0.9485 1.0000 1.0000 0.9875 - 1.0000 1.0000 1.0000 - CUF-urea 1.0000 1.0000 1.0000 1.0000 - 1.0000 1.0000 1.0000 1.0000 1.0000 1.0000 - 1.0000 1.0000 1.0000 -
NBPT-PCU 0.9997 <.0001 1.0000 0.0793 - 1.0000 1.0000 1.0000 1.0000 1.0000 0.9448 - 1.0000 1.0000 1.0000 - NBPT-urea 1.0000 0.9907 1.0000 1.0000 - 1.0000 1.0000 1.0000 1.0000 1.0000 1.0000 - 1.0000 1.0000 1.0000 - PCU-urea 0.9999 0.5909 1.0000 0.3810 - 1.0000 1.0000 1.0000 1.0000 1.0000 0.9944 - 1.0000 1.0000 1.0000 -
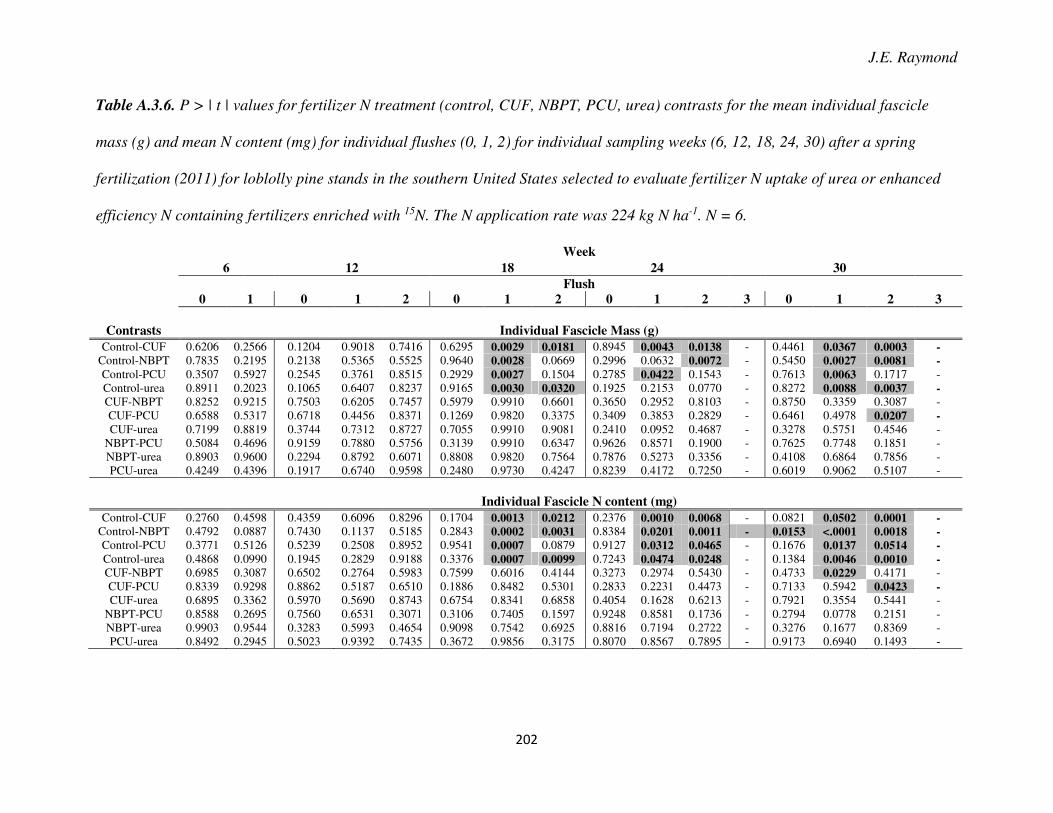
J.E. Raymond
202
Table A.3.6. P > | t | values for fertilizer N treatment (control, CUF, NBPT, PCU, urea) contrasts for the mean individual fascicle
mass (g) and mean N content (mg) for individual flushes (0, 1, 2) for individual sampling weeks (6, 12, 18, 24, 30) after a spring
fertilization (2011) for loblolly pine stands in the southern United States selected to evaluate fertilizer N uptake of urea or enhanced
efficiency N containing fertilizers enriched with 15N. The N application rate was 224 kg N ha-1. N = 6.
Week
6 12 18 24 30
Flush
0 1 0 1 2 0 1 2 0 1 2 3 0 1 2 3
Contrasts Individual Fascicle Mass (g)
Control-CUF 0.6206 0.2566 0.1204 0.9018 0.7416 0.6295 0.0029 0.0181 0.8945 0.0043 0.0138 - 0.4461 0.0367 0.0003 - Control-NBPT 0.7835 0.2195 0.2138 0.5365 0.5525 0.9640 0.0028 0.0669 0.2996 0.0632 0.0072 - 0.5450 0.0027 0.0081 - Control-PCU 0.3507 0.5927 0.2545 0.3761 0.8515 0.2929 0.0027 0.1504 0.2785 0.0422 0.1543 - 0.7613 0.0063 0.1717 - Control-urea 0.8911 0.2023 0.1065 0.6407 0.8237 0.9165 0.0030 0.0320 0.1925 0.2153 0.0770 - 0.8272 0.0088 0.0037 - CUF-NBPT 0.8252 0.9215 0.7503 0.6205 0.7457 0.5979 0.9910 0.6601 0.3650 0.2952 0.8103 - 0.8750 0.3359 0.3087 - CUF-PCU 0.6588 0.5317 0.6718 0.4456 0.8371 0.1269 0.9820 0.3375 0.3409 0.3853 0.2829 - 0.6461 0.4978 0.0207 - CUF-urea 0.7199 0.8819 0.3744 0.7312 0.8727 0.7055 0.9910 0.9081 0.2410 0.0952 0.4687 - 0.3278 0.5751 0.4546 -
NBPT-PCU 0.5084 0.4696 0.9159 0.7880 0.5756 0.3139 0.9910 0.6347 0.9626 0.8571 0.1900 - 0.7625 0.7748 0.1851 - NBPT-urea 0.8903 0.9600 0.2294 0.8792 0.6071 0.8808 0.9820 0.7564 0.7876 0.5273 0.3356 - 0.4108 0.6864 0.7856 - PCU-urea 0.4249 0.4396 0.1917 0.6740 0.9598 0.2480 0.9730 0.4247 0.8239 0.4172 0.7250 - 0.6019 0.9062 0.5107 -
Individual Fascicle N content (mg)
Control-CUF 0.2760 0.4598 0.4359 0.6096 0.8296 0.1704 0.0013 0.0212 0.2376 0.0010 0.0068 - 0.0821 0.0502 0.0001 - Control-NBPT 0.4792 0.0887 0.7430 0.1137 0.5185 0.2843 0.0002 0.0031 0.8384 0.0201 0.0011 - 0.0153 <.0001 0.0018 - Control-PCU 0.3771 0.5126 0.5239 0.2508 0.8952 0.9541 0.0007 0.0879 0.9127 0.0312 0.0465 - 0.1676 0.0137 0.0514 - Control-urea 0.4868 0.0990 0.1945 0.2829 0.9188 0.3376 0.0007 0.0099 0.7243 0.0474 0.0248 - 0.1384 0.0046 0.0010 - CUF-NBPT 0.6985 0.3087 0.6502 0.2764 0.5983 0.7599 0.6016 0.4144 0.3273 0.2974 0.5430 - 0.4733 0.0229 0.4171 - CUF-PCU 0.8339 0.9298 0.8862 0.5187 0.6510 0.1886 0.8482 0.5301 0.2833 0.2231 0.4473 - 0.7133 0.5942 0.0423 - CUF-urea 0.6895 0.3362 0.5970 0.5690 0.8743 0.6754 0.8341 0.6858 0.4054 0.1628 0.6213 - 0.7921 0.3554 0.5441 -
NBPT-PCU 0.8588 0.2695 0.7560 0.6531 0.3071 0.3106 0.7405 0.1597 0.9248 0.8581 0.1736 - 0.2794 0.0778 0.2151 - NBPT-urea 0.9903 0.9544 0.3283 0.5993 0.4654 0.9098 0.7542 0.6925 0.8816 0.7194 0.2722 - 0.3276 0.1677 0.8369 - PCU-urea 0.8492 0.2945 0.5023 0.9392 0.7435 0.3672 0.9856 0.3175 0.8070 0.8567 0.7895 - 0.9173 0.6940 0.1493 -
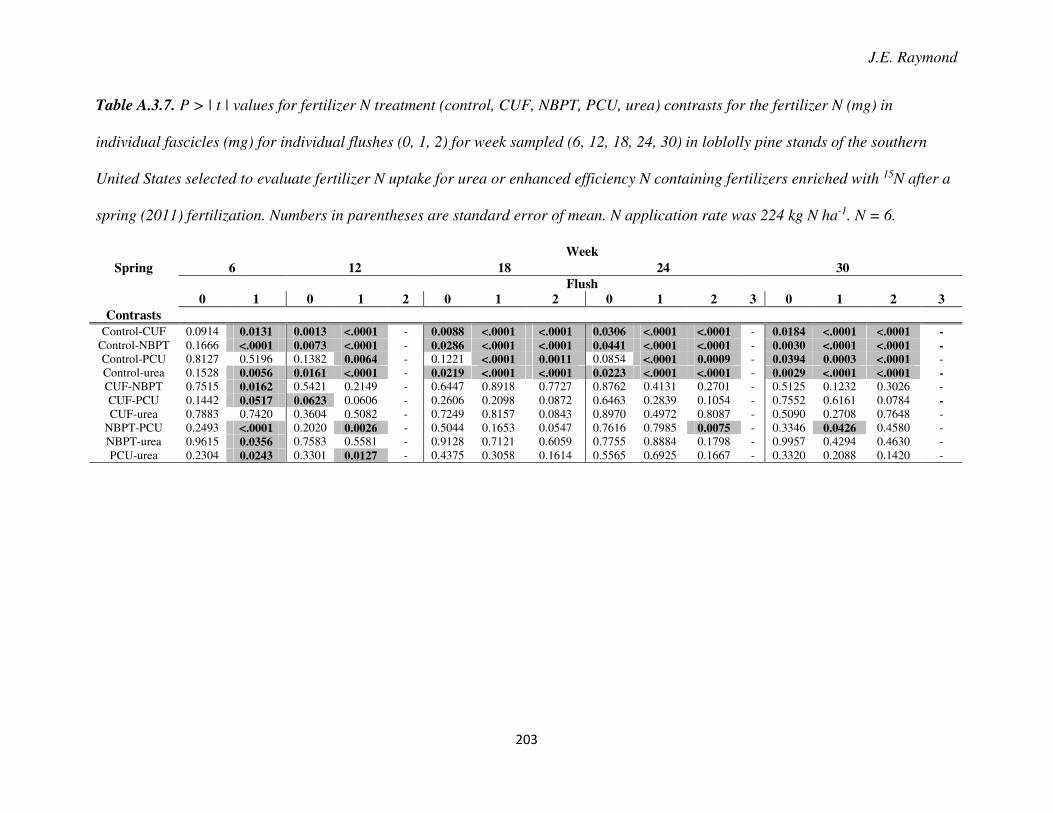
J.E. Raymond
203
Table A.3.7. P > | t | values for fertilizer N treatment (control, CUF, NBPT, PCU, urea) contrasts for the fertilizer N (mg) in
individual fascicles (mg) for individual flushes (0, 1, 2) for week sampled (6, 12, 18, 24, 30) in loblolly pine stands of the southern
United States selected to evaluate fertilizer N uptake for urea or enhanced efficiency N containing fertilizers enriched with 15N after a
spring (2011) fertilization. Numbers in parentheses are standard error of mean. N application rate was 224 kg N ha-1. N = 6.
Week
Spring 6 12 18 24 30
Flush
0 1 0 1 2 0 1 2 0 1 2 3 0 1 2 3
Contrasts
Control-CUF 0.0914 0.0131 0.0013 <.0001 - 0.0088 <.0001 <.0001 0.0306 <.0001 <.0001 - 0.0184 <.0001 <.0001 - Control-NBPT 0.1666 <.0001 0.0073 <.0001 - 0.0286 <.0001 <.0001 0.0441 <.0001 <.0001 - 0.0030 <.0001 <.0001 - Control-PCU 0.8127 0.5196 0.1382 0.0064 - 0.1221 <.0001 0.0011 0.0854 <.0001 0.0009 - 0.0394 0.0003 <.0001 - Control-urea 0.1528 0.0056 0.0161 <.0001 - 0.0219 <.0001 <.0001 0.0223 <.0001 <.0001 - 0.0029 <.0001 <.0001 - CUF-NBPT 0.7515 0.0162 0.5421 0.2149 - 0.6447 0.8918 0.7727 0.8762 0.4131 0.2701 - 0.5125 0.1232 0.3026 - CUF-PCU 0.1442 0.0517 0.0623 0.0606 - 0.2606 0.2098 0.0872 0.6463 0.2839 0.1054 - 0.7552 0.6161 0.0784 - CUF-urea 0.7883 0.7420 0.3604 0.5082 - 0.7249 0.8157 0.0843 0.8970 0.4972 0.8087 - 0.5090 0.2708 0.7648 -
NBPT-PCU 0.2493 <.0001 0.2020 0.0026 - 0.5044 0.1653 0.0547 0.7616 0.7985 0.0075 - 0.3346 0.0426 0.4580 - NBPT-urea 0.9615 0.0356 0.7583 0.5581 - 0.9128 0.7121 0.6059 0.7755 0.8884 0.1798 - 0.9957 0.4294 0.4630 - PCU-urea 0.2304 0.0243 0.3301 0.0127 - 0.4375 0.3058 0.1614 0.5565 0.6925 0.1667 - 0.3320 0.2088 0.1420 -
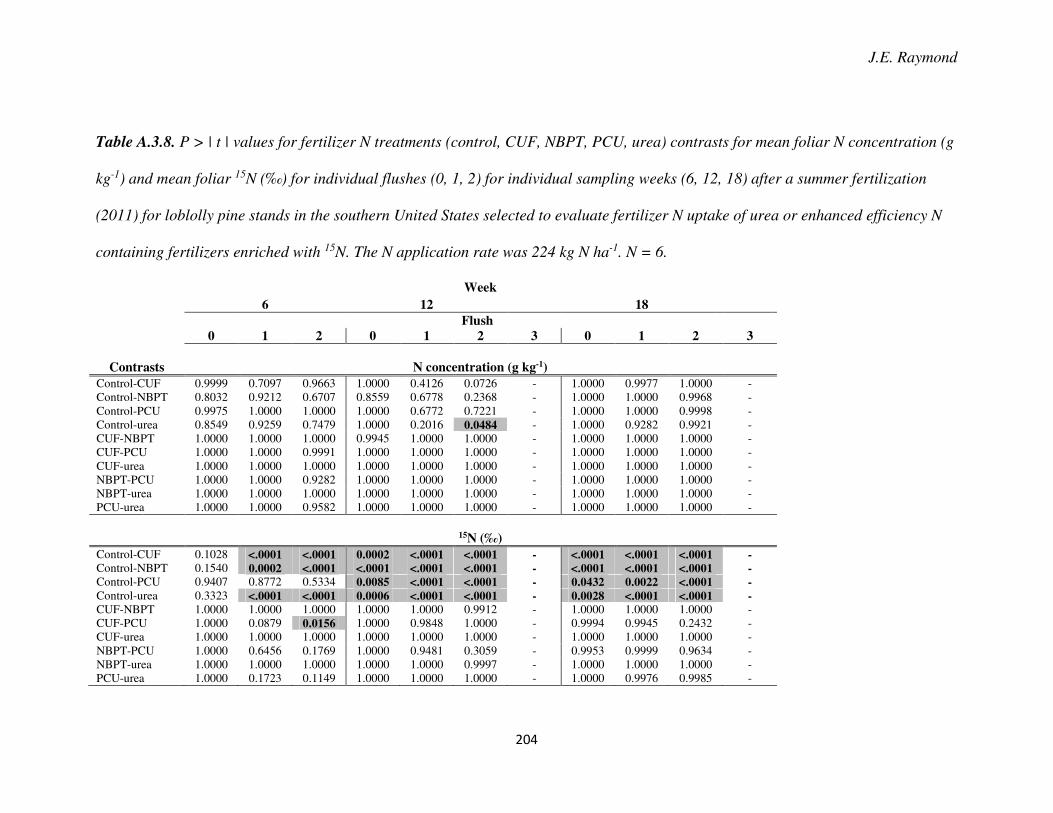
J.E. Raymond
204
Table A.3.8. P > | t | values for fertilizer N treatments (control, CUF, NBPT, PCU, urea) contrasts for mean foliar N concentration (g
kg-1) and mean foliar 15N (‰) for individual flushes (0, 1, 2) for individual sampling weeks (6, 12, 18) after a summer fertilization
(2011) for loblolly pine stands in the southern United States selected to evaluate fertilizer N uptake of urea or enhanced efficiency N
containing fertilizers enriched with 15N. The N application rate was 224 kg N ha-1. N = 6.
Week
6 12 18
Flush
0 1 2 0 1 2 3 0 1 2 3
Contrasts N concentration (g kg-1)
Control-CUF 0.9999 0.7097 0.9663 1.0000 0.4126 0.0726 - 1.0000 0.9977 1.0000 - Control-NBPT 0.8032 0.9212 0.6707 0.8559 0.6778 0.2368 - 1.0000 1.0000 0.9968 - Control-PCU 0.9975 1.0000 1.0000 1.0000 0.6772 0.7221 - 1.0000 1.0000 0.9998 - Control-urea 0.8549 0.9259 0.7479 1.0000 0.2016 0.0484 - 1.0000 0.9282 0.9921 - CUF-NBPT 1.0000 1.0000 1.0000 0.9945 1.0000 1.0000 - 1.0000 1.0000 1.0000 - CUF-PCU 1.0000 1.0000 0.9991 1.0000 1.0000 1.0000 - 1.0000 1.0000 1.0000 - CUF-urea 1.0000 1.0000 1.0000 1.0000 1.0000 1.0000 - 1.0000 1.0000 1.0000 - NBPT-PCU 1.0000 1.0000 0.9282 1.0000 1.0000 1.0000 - 1.0000 1.0000 1.0000 - NBPT-urea 1.0000 1.0000 1.0000 1.0000 1.0000 1.0000 - 1.0000 1.0000 1.0000 - PCU-urea 1.0000 1.0000 0.9582 1.0000 1.0000 1.0000 - 1.0000 1.0000 1.0000 -
15N (‰)
Control-CUF 0.1028 <.0001 <.0001 0.0002 <.0001 <.0001 - <.0001 <.0001 <.0001 - Control-NBPT 0.1540 0.0002 <.0001 <.0001 <.0001 <.0001 - <.0001 <.0001 <.0001 - Control-PCU 0.9407 0.8772 0.5334 0.0085 <.0001 <.0001 - 0.0432 0.0022 <.0001 - Control-urea 0.3323 <.0001 <.0001 0.0006 <.0001 <.0001 - 0.0028 <.0001 <.0001 - CUF-NBPT 1.0000 1.0000 1.0000 1.0000 1.0000 0.9912 - 1.0000 1.0000 1.0000 - CUF-PCU 1.0000 0.0879 0.0156 1.0000 0.9848 1.0000 - 0.9994 0.9945 0.2432 - CUF-urea 1.0000 1.0000 1.0000 1.0000 1.0000 1.0000 - 1.0000 1.0000 1.0000 - NBPT-PCU 1.0000 0.6456 0.1769 1.0000 0.9481 0.3059 - 0.9953 0.9999 0.9634 - NBPT-urea 1.0000 1.0000 1.0000 1.0000 1.0000 0.9997 - 1.0000 1.0000 1.0000 - PCU-urea 1.0000 0.1723 0.1149 1.0000 1.0000 1.0000 - 1.0000 0.9976 0.9985 -
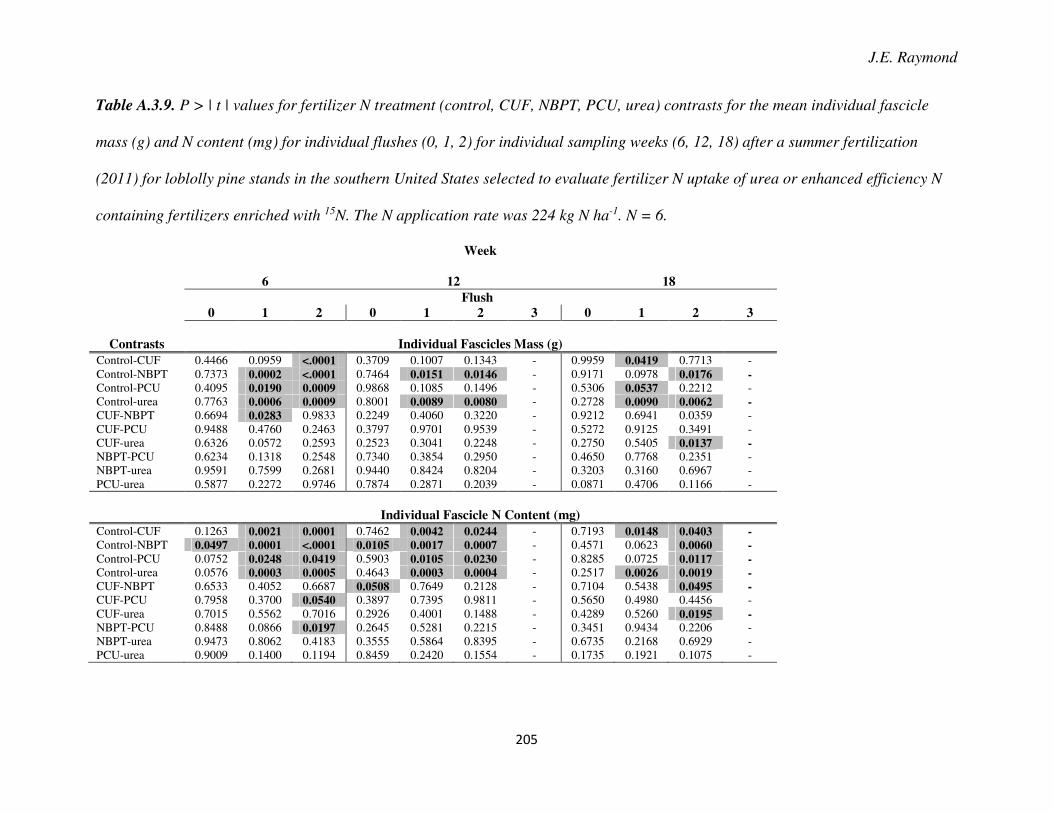
J.E. Raymond
205
Table A.3.9. P > | t | values for fertilizer N treatment (control, CUF, NBPT, PCU, urea) contrasts for the mean individual fascicle
mass (g) and N content (mg) for individual flushes (0, 1, 2) for individual sampling weeks (6, 12, 18) after a summer fertilization
(2011) for loblolly pine stands in the southern United States selected to evaluate fertilizer N uptake of urea or enhanced efficiency N
containing fertilizers enriched with 15N. The N application rate was 224 kg N ha-1. N = 6.
Week
6 12 18
Flush
0 1 2 0 1 2 3 0 1 2 3
Contrasts Individual Fascicles Mass (g)
Control-CUF 0.4466 0.0959 <.0001 0.3709 0.1007 0.1343 - 0.9959 0.0419 0.7713 - Control-NBPT 0.7373 0.0002 <.0001 0.7464 0.0151 0.0146 - 0.9171 0.0978 0.0176 - Control-PCU 0.4095 0.0190 0.0009 0.9868 0.1085 0.1496 - 0.5306 0.0537 0.2212 - Control-urea 0.7763 0.0006 0.0009 0.8001 0.0089 0.0080 - 0.2728 0.0090 0.0062 - CUF-NBPT 0.6694 0.0283 0.9833 0.2249 0.4060 0.3220 - 0.9212 0.6941 0.0359 - CUF-PCU 0.9488 0.4760 0.2463 0.3797 0.9701 0.9539 - 0.5272 0.9125 0.3491 - CUF-urea 0.6326 0.0572 0.2593 0.2523 0.3041 0.2248 - 0.2750 0.5405 0.0137 - NBPT-PCU 0.6234 0.1318 0.2548 0.7340 0.3854 0.2950 - 0.4650 0.7768 0.2351 - NBPT-urea 0.9591 0.7599 0.2681 0.9440 0.8424 0.8204 - 0.3203 0.3160 0.6967 - PCU-urea 0.5877 0.2272 0.9746 0.7874 0.2871 0.2039 - 0.0871 0.4706 0.1166 -
Individual Fascicle N Content (mg)
Control-CUF 0.1263 0.0021 0.0001 0.7462 0.0042 0.0244 - 0.7193 0.0148 0.0403 - Control-NBPT 0.0497 0.0001 <.0001 0.0105 0.0017 0.0007 - 0.4571 0.0623 0.0060 - Control-PCU 0.0752 0.0248 0.0419 0.5903 0.0105 0.0230 - 0.8285 0.0725 0.0117 - Control-urea 0.0576 0.0003 0.0005 0.4643 0.0003 0.0004 - 0.2517 0.0026 0.0019 - CUF-NBPT 0.6533 0.4052 0.6687 0.0508 0.7649 0.2128 - 0.7104 0.5438 0.0495 - CUF-PCU 0.7958 0.3700 0.0540 0.3897 0.7395 0.9811 - 0.5650 0.4980 0.4456 - CUF-urea 0.7015 0.5562 0.7016 0.2926 0.4001 0.1488 - 0.4289 0.5260 0.0195 - NBPT-PCU 0.8488 0.0866 0.0197 0.2645 0.5281 0.2215 - 0.3451 0.9434 0.2206 - NBPT-urea 0.9473 0.8062 0.4183 0.3555 0.5864 0.8395 - 0.6735 0.2168 0.6929 - PCU-urea 0.9009 0.1400 0.1194 0.8459 0.2420 0.1554 - 0.1735 0.1921 0.1075 -
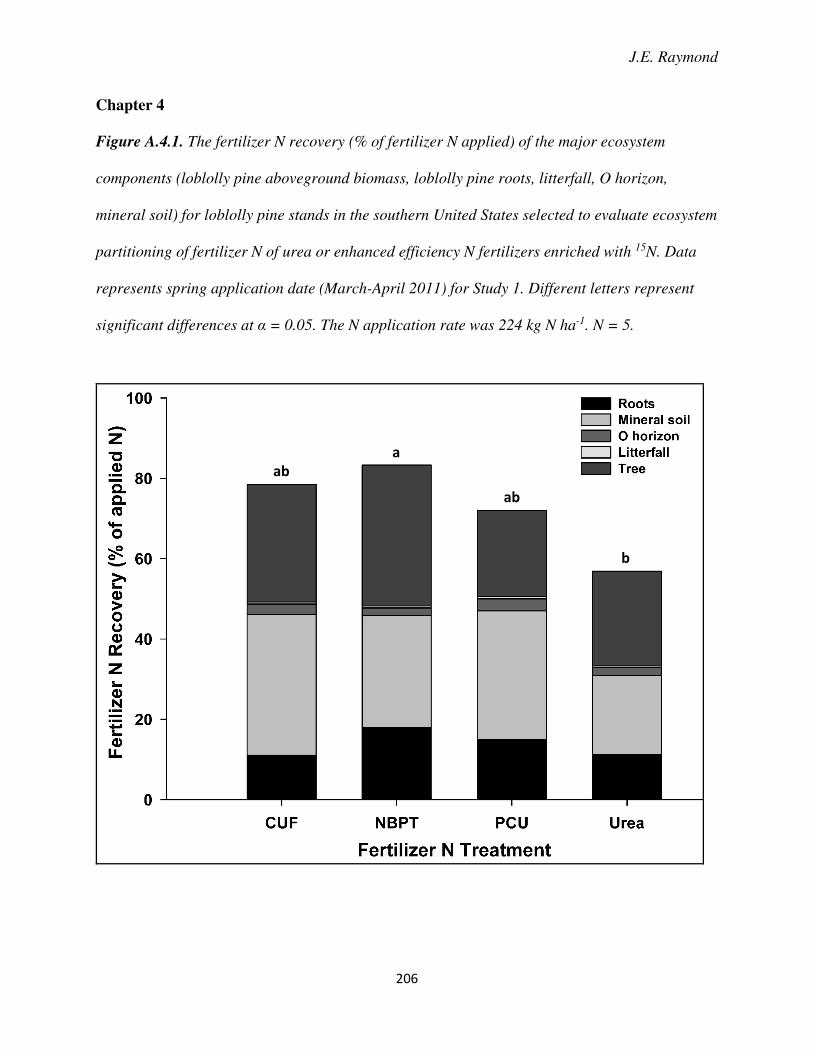
J.E. Raymond
206
Chapter 4
Figure A.4.1. The fertilizer N recovery (% of fertilizer N applied) of the major ecosystem
components (loblolly pine aboveground biomass, loblolly pine roots, litterfall, O horizon,
mineral soil) for loblolly pine stands in the southern United States selected to evaluate ecosystem
partitioning of fertilizer N of urea or enhanced efficiency N fertilizers enriched with 15N. Data
represents spring application date (March-April 2011) for Study 1. Different letters represent
significant differences at α = 0.05. The N application rate was 224 kg N ha-1. N = 5.
ab
a
ab
b
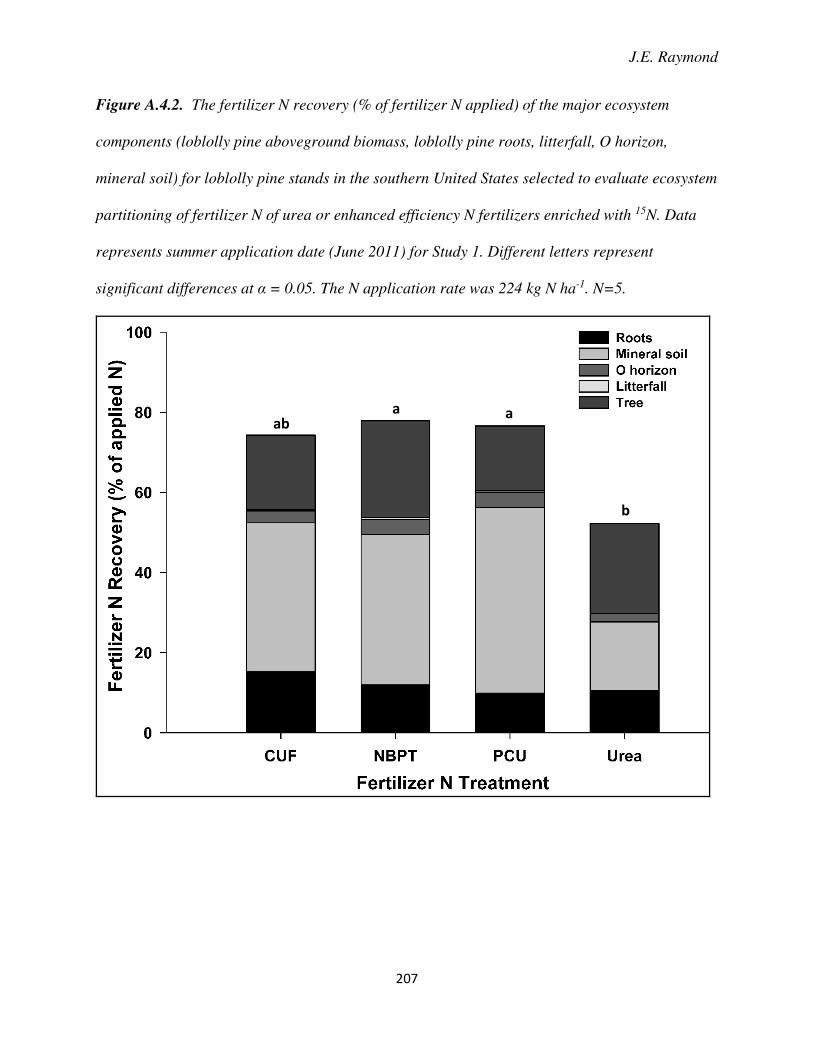
J.E. Raymond
207
Figure A.4.2. The fertilizer N recovery (% of fertilizer N applied) of the major ecosystem
components (loblolly pine aboveground biomass, loblolly pine roots, litterfall, O horizon,
mineral soil) for loblolly pine stands in the southern United States selected to evaluate ecosystem
partitioning of fertilizer N of urea or enhanced efficiency N fertilizers enriched with 15N. Data
represents summer application date (June 2011) for Study 1. Different letters represent
significant differences at α = 0.05. The N application rate was 224 kg N ha-1. N=5.
ab
a a
b
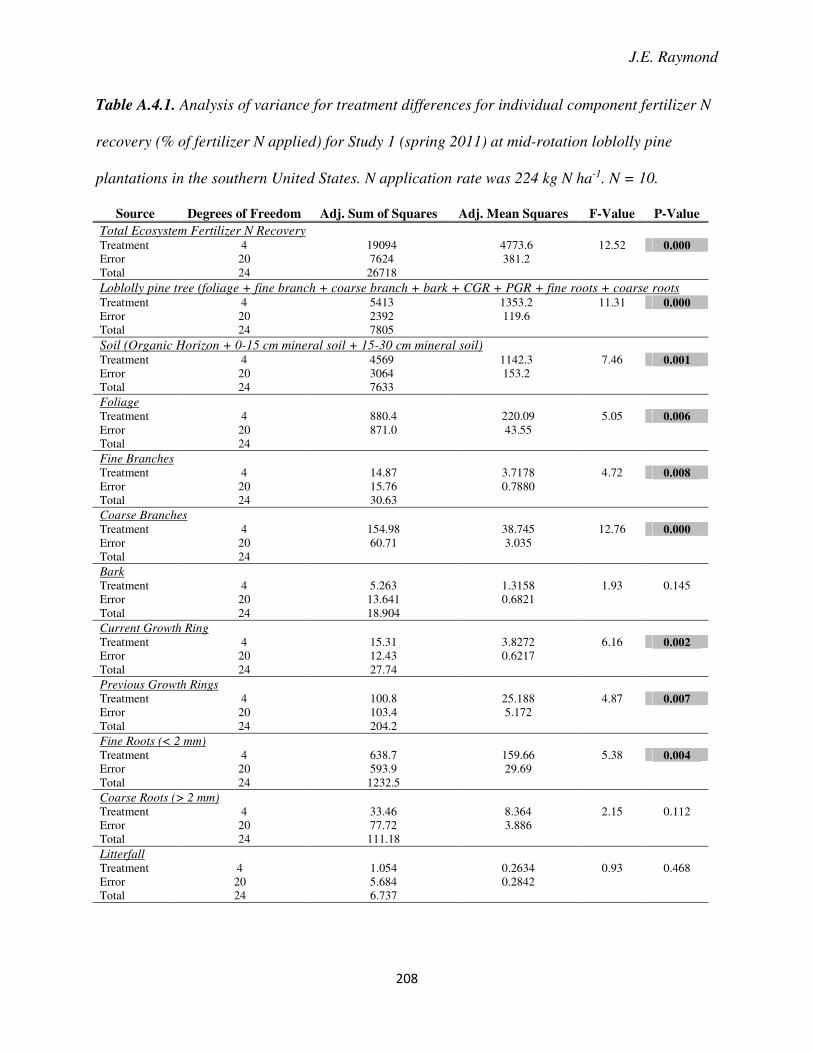
J.E. Raymond
208
Table A.4.1. Analysis of variance for treatment differences for individual component fertilizer N
recovery (% of fertilizer N applied) for Study 1 (spring 2011) at mid-rotation loblolly pine
plantations in the southern United States. N application rate was 224 kg N ha-1. N = 10.
Source Degrees of Freedom Adj. Sum of Squares Adj. Mean Squares F-Value P-Value
Total Ecosystem Fertilizer N Recovery Treatment 4 19094 4773.6 12.52 0.000 Error 20 7624 381.2 Total 24 26718
Loblolly pine tree (foliage + fine branch + coarse branch + bark + CGR + PGR + fine roots + coarse roots Treatment 4 5413 1353.2 11.31 0.000 Error 20 2392 119.6 Total 24 7805 Soil (Organic Horizon + 0-15 cm mineral soil + 15-30 cm mineral soil) Treatment 4 4569 1142.3 7.46 0.001 Error 20 3064 153.2 Total 24 7633 Foliage Treatment 4 880.4 220.09 5.05 0.006 Error 20 871.0 43.55 Total 24
Fine Branches Treatment 4 14.87 3.7178 4.72 0.008 Error 20 15.76 0.7880 Total 24 30.63
Coarse Branches Treatment 4 154.98 38.745 12.76 0.000 Error 20 60.71 3.035 Total 24
Bark Treatment 4 5.263 1.3158 1.93 0.145
Error 20 13.641 0.6821 Total 24 18.904
Current Growth Ring Treatment 4 15.31 3.8272 6.16 0.002 Error 20 12.43 0.6217 Total 24 27.74
Previous Growth Rings Treatment 4 100.8 25.188 4.87 0.007 Error 20 103.4 5.172 Total 24 204.2
Fine Roots (< 2 mm) Treatment 4 638.7 159.66 5.38 0.004 Error 20 593.9 29.69 Total 24 1232.5
Coarse Roots (> 2 mm) Treatment 4 33.46 8.364 2.15 0.112
Error 20 77.72 3.886 Total 24 111.18
Litterfall Treatment 4 1.054 0.2634 0.93 0.468
Error 20 5.684 0.2842 Total 24 6.737
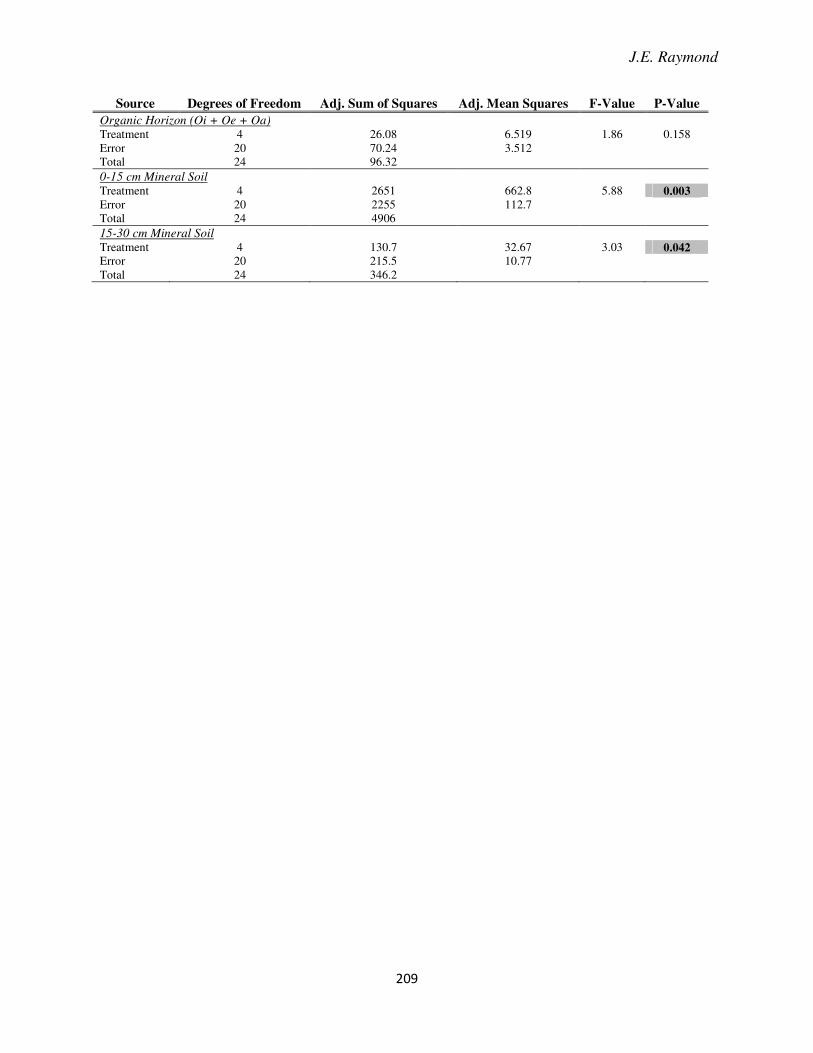
J.E. Raymond
209
Source Degrees of Freedom Adj. Sum of Squares Adj. Mean Squares F-Value P-Value
Organic Horizon (Oi + Oe + Oa) Treatment 4 26.08 6.519 1.86 0.158
Error 20 70.24 3.512 Total 24 96.32
0-15 cm Mineral Soil Treatment 4 2651 662.8 5.88 0.003 Error 20 2255 112.7 Total 24 4906
15-30 cm Mineral Soil Treatment 4 130.7 32.67 3.03 0.042 Error 20 215.5 10.77 Total 24 346.2
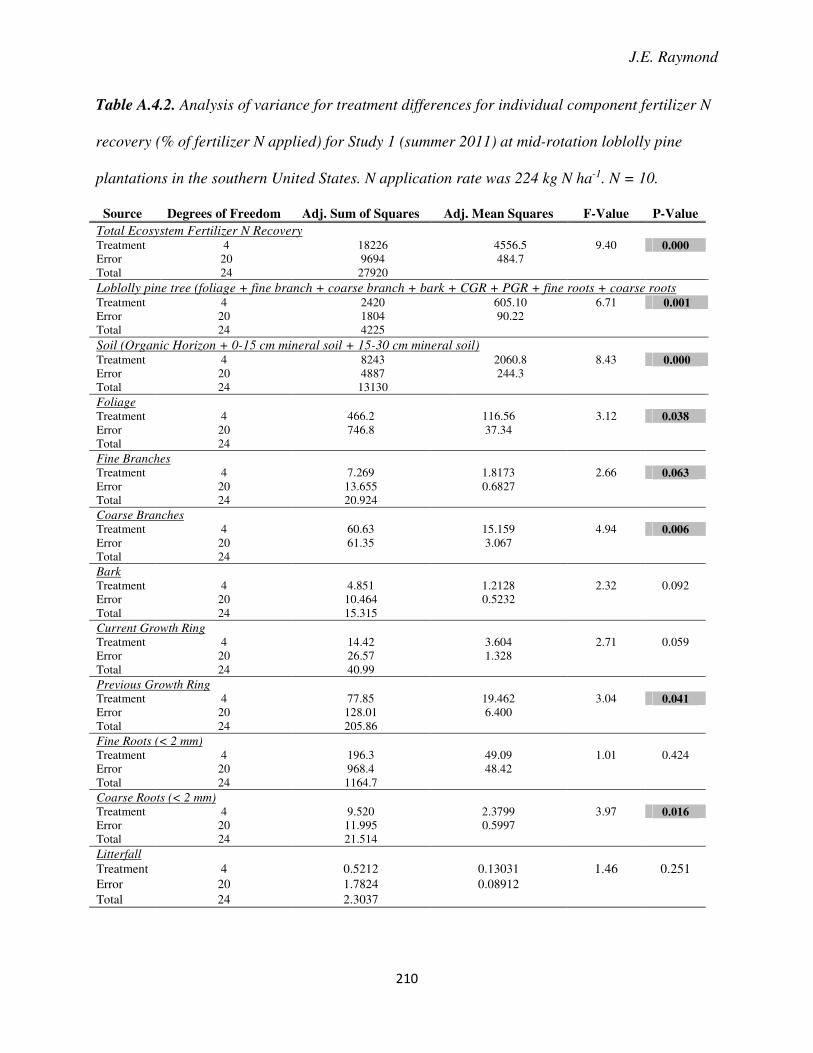
J.E. Raymond
210
Table A.4.2. Analysis of variance for treatment differences for individual component fertilizer N
recovery (% of fertilizer N applied) for Study 1 (summer 2011) at mid-rotation loblolly pine
plantations in the southern United States. N application rate was 224 kg N ha-1. N = 10.
Source Degrees of Freedom Adj. Sum of Squares Adj. Mean Squares F-Value P-Value
Total Ecosystem Fertilizer N Recovery Treatment 4 18226 4556.5 9.40 0.000 Error 20 9694 484.7 Total 24 27920
Loblolly pine tree (foliage + fine branch + coarse branch + bark + CGR + PGR + fine roots + coarse roots Treatment 4 2420 605.10 6.71 0.001 Error 20 1804 90.22 Total 24 4225 Soil (Organic Horizon + 0-15 cm mineral soil + 15-30 cm mineral soil) Treatment 4 8243 2060.8 8.43 0.000 Error 20 4887 244.3 Total 24 13130 Foliage Treatment 4 466.2 116.56 3.12 0.038 Error 20 746.8 37.34 Total 24
Fine Branches Treatment 4 7.269 1.8173 2.66 0.063 Error 20 13.655 0.6827 Total 24 20.924
Coarse Branches Treatment 4 60.63 15.159 4.94 0.006 Error 20 61.35 3.067 Total 24
Bark Treatment 4 4.851 1.2128 2.32 0.092
Error 20 10.464 0.5232 Total 24 15.315
Current Growth Ring Treatment 4 14.42 3.604 2.71 0.059
Error 20 26.57 1.328 Total 24 40.99
Previous Growth Ring Treatment 4 77.85 19.462 3.04 0.041 Error 20 128.01 6.400 Total 24 205.86
Fine Roots (< 2 mm) Treatment 4 196.3 49.09 1.01 0.424
Error 20 968.4 48.42 Total 24 1164.7
Coarse Roots (< 2 mm) Treatment 4 9.520 2.3799 3.97 0.016 Error 20 11.995 0.5997 Total 24 21.514
Litterfall
Treatment 4 0.5212 0.13031 1.46 0.251
Error 20 1.7824 0.08912 Total 24 2.3037
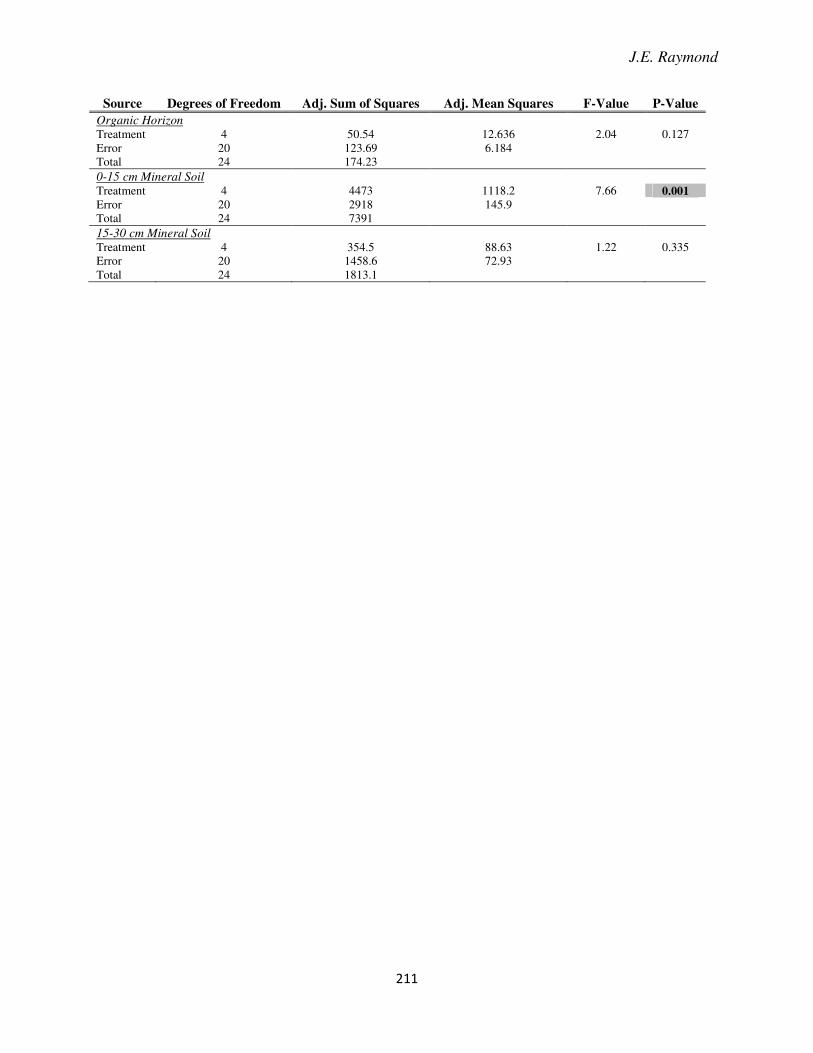
J.E. Raymond
211
Source Degrees of Freedom Adj. Sum of Squares Adj. Mean Squares F-Value P-Value
Organic Horizon Treatment 4 50.54 12.636 2.04 0.127
Error 20 123.69 6.184 Total 24 174.23
0-15 cm Mineral Soil Treatment 4 4473 1118.2 7.66 0.001 Error 20 2918 145.9 Total 24 7391
15-30 cm Mineral Soil Treatment 4 354.5 88.63 1.22 0.335
Error 20 1458.6 72.93 Total 24 1813.1
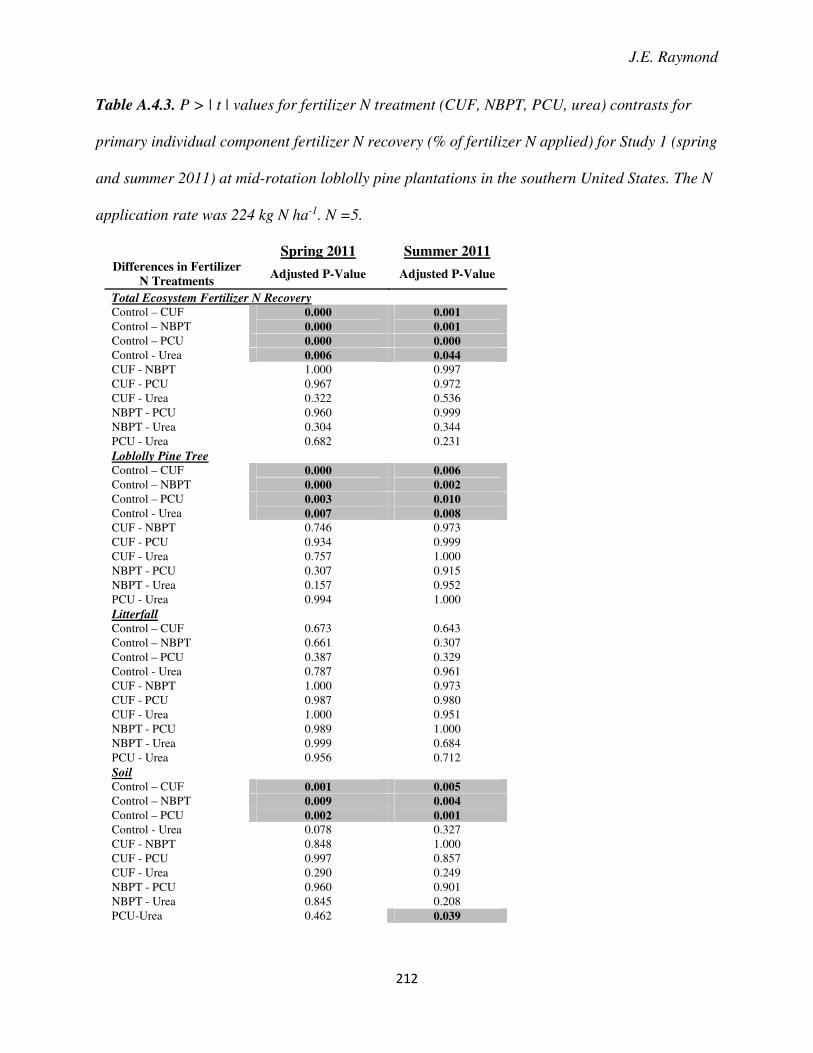
J.E. Raymond
212
Table A.4.3. P > | t | values for fertilizer N treatment (CUF, NBPT, PCU, urea) contrasts for
primary individual component fertilizer N recovery (% of fertilizer N applied) for Study 1 (spring
and summer 2011) at mid-rotation loblolly pine plantations in the southern United States. The N
application rate was 224 kg N ha-1. N =5.
Spring 2011 Summer 2011 Differences in Fertilizer
N Treatments Adjusted P-Value Adjusted P-Value
Total Ecosystem Fertilizer N Recovery Control – CUF 0.000 0.001
Control – NBPT 0.000 0.001
Control – PCU 0.000 0.000
Control - Urea 0.006 0.044
CUF - NBPT 1.000 0.997 CUF - PCU 0.967 0.972 CUF - Urea 0.322 0.536
NBPT - PCU 0.960 0.999 NBPT - Urea 0.304 0.344
PCU - Urea 0.682 0.231
Loblolly Pine Tree Control – CUF 0.000 0.006
Control – NBPT 0.000 0.002
Control – PCU 0.003 0.010
Control - Urea 0.007 0.008
CUF - NBPT 0.746 0.973 CUF - PCU 0.934 0.999 CUF - Urea 0.757 1.000 NBPT - PCU 0.307 0.915 NBPT - Urea 0.157 0.952 PCU - Urea 0.994 1.000 Litterfall Control – CUF 0.673 0.643 Control – NBPT 0.661 0.307 Control – PCU 0.387 0.329 Control - Urea 0.787 0.961 CUF - NBPT 1.000 0.973 CUF - PCU 0.987 0.980 CUF - Urea 1.000 0.951
NBPT - PCU 0.989 1.000 NBPT - Urea 0.999 0.684
PCU - Urea 0.956 0.712
Soil Control – CUF 0.001 0.005
Control – NBPT 0.009 0.004
Control – PCU 0.002 0.001
Control - Urea 0.078 0.327 CUF - NBPT 0.848 1.000 CUF - PCU 0.997 0.857 CUF - Urea 0.290 0.249
NBPT - PCU 0.960 0.901 NBPT - Urea 0.845 0.208
PCU-Urea 0.462 0.039
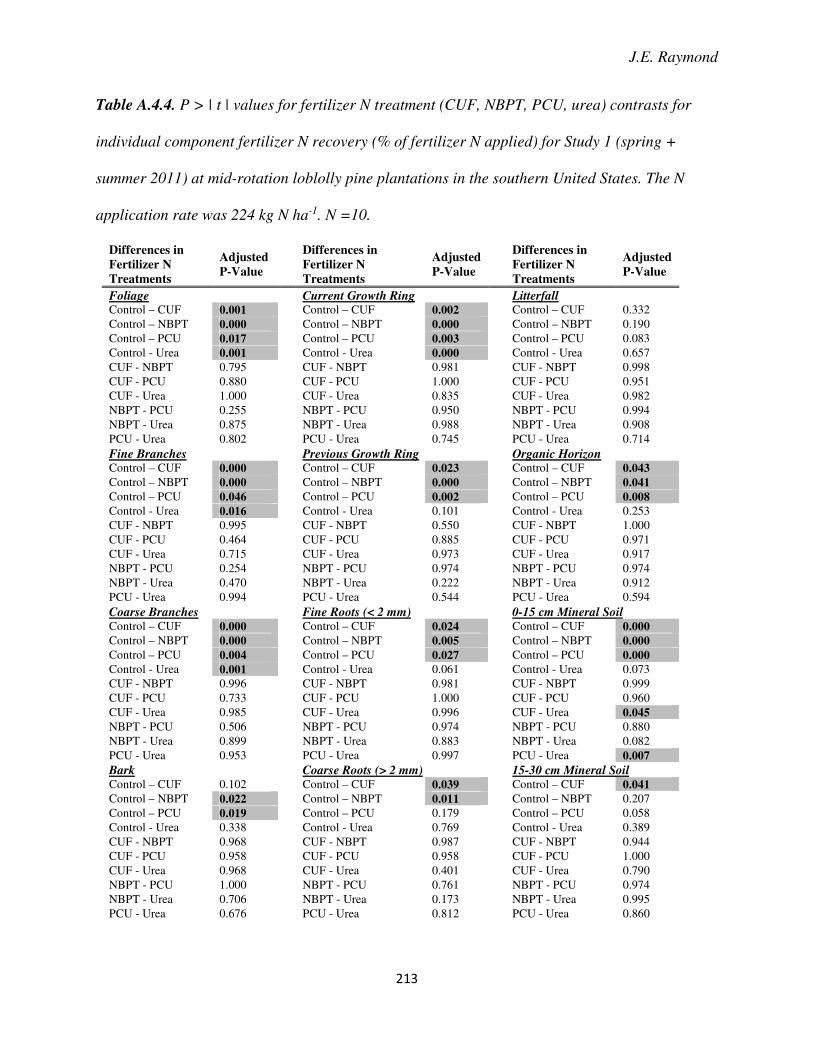
J.E. Raymond
213
Table A.4.4. P > | t | values for fertilizer N treatment (CUF, NBPT, PCU, urea) contrasts for
individual component fertilizer N recovery (% of fertilizer N applied) for Study 1 (spring +
summer 2011) at mid-rotation loblolly pine plantations in the southern United States. The N
application rate was 224 kg N ha-1. N =10.
Differences in
Fertilizer N
Treatments
Adjusted
P-Value
Differences in
Fertilizer N
Treatments
Adjusted
P-Value
Differences in
Fertilizer N
Treatments
Adjusted
P-Value
Foliage Current Growth Ring Litterfall Control – CUF 0.001 Control – CUF 0.002 Control – CUF 0.332
Control – NBPT 0.000 Control – NBPT 0.000 Control – NBPT 0.190
Control – PCU 0.017 Control – PCU 0.003 Control – PCU 0.083
Control - Urea 0.001 Control - Urea 0.000 Control - Urea 0.657
CUF - NBPT 0.795 CUF - NBPT 0.981 CUF - NBPT 0.998 CUF - PCU 0.880 CUF - PCU 1.000 CUF - PCU 0.951 CUF - Urea 1.000 CUF - Urea 0.835 CUF - Urea 0.982
NBPT - PCU 0.255 NBPT - PCU 0.950 NBPT - PCU 0.994 NBPT - Urea 0.875 NBPT - Urea 0.988 NBPT - Urea 0.908
PCU - Urea 0.802 PCU - Urea 0.745 PCU - Urea 0.714
Fine Branches Previous Growth Ring Organic Horizon Control – CUF 0.000 Control – CUF 0.023 Control – CUF 0.043
Control – NBPT 0.000 Control – NBPT 0.000 Control – NBPT 0.041
Control – PCU 0.046 Control – PCU 0.002 Control – PCU 0.008
Control - Urea 0.016 Control - Urea 0.101 Control - Urea 0.253
CUF - NBPT 0.995 CUF - NBPT 0.550 CUF - NBPT 1.000 CUF - PCU 0.464 CUF - PCU 0.885 CUF - PCU 0.971 CUF - Urea 0.715 CUF - Urea 0.973 CUF - Urea 0.917
NBPT - PCU 0.254 NBPT - PCU 0.974 NBPT - PCU 0.974 NBPT - Urea 0.470 NBPT - Urea 0.222 NBPT - Urea 0.912
PCU - Urea 0.994 PCU - Urea 0.544 PCU - Urea 0.594
Coarse Branches Fine Roots (< 2 mm) 0-15 cm Mineral Soil Control – CUF 0.000 Control – CUF 0.024 Control – CUF 0.000
Control – NBPT 0.000 Control – NBPT 0.005 Control – NBPT 0.000
Control – PCU 0.004 Control – PCU 0.027 Control – PCU 0.000
Control - Urea 0.001 Control - Urea 0.061 Control - Urea 0.073
CUF - NBPT 0.996 CUF - NBPT 0.981 CUF - NBPT 0.999 CUF - PCU 0.733 CUF - PCU 1.000 CUF - PCU 0.960 CUF - Urea 0.985 CUF - Urea 0.996 CUF - Urea 0.045
NBPT - PCU 0.506 NBPT - PCU 0.974 NBPT - PCU 0.880 NBPT - Urea 0.899 NBPT - Urea 0.883 NBPT - Urea 0.082
PCU - Urea 0.953 PCU - Urea 0.997 PCU - Urea 0.007
Bark Coarse Roots (> 2 mm) 15-30 cm Mineral Soil Control – CUF 0.102 Control – CUF 0.039 Control – CUF 0.041
Control – NBPT 0.022 Control – NBPT 0.011 Control – NBPT 0.207
Control – PCU 0.019 Control – PCU 0.179 Control – PCU 0.058
Control - Urea 0.338 Control - Urea 0.769 Control - Urea 0.389
CUF - NBPT 0.968 CUF - NBPT 0.987 CUF - NBPT 0.944 CUF - PCU 0.958 CUF - PCU 0.958 CUF - PCU 1.000 CUF - Urea 0.968 CUF - Urea 0.401 CUF - Urea 0.790
NBPT - PCU 1.000 NBPT - PCU 0.761 NBPT - PCU 0.974 NBPT - Urea 0.706 NBPT - Urea 0.173 NBPT - Urea 0.995
PCU - Urea 0.676 PCU - Urea 0.812 PCU - Urea 0.860
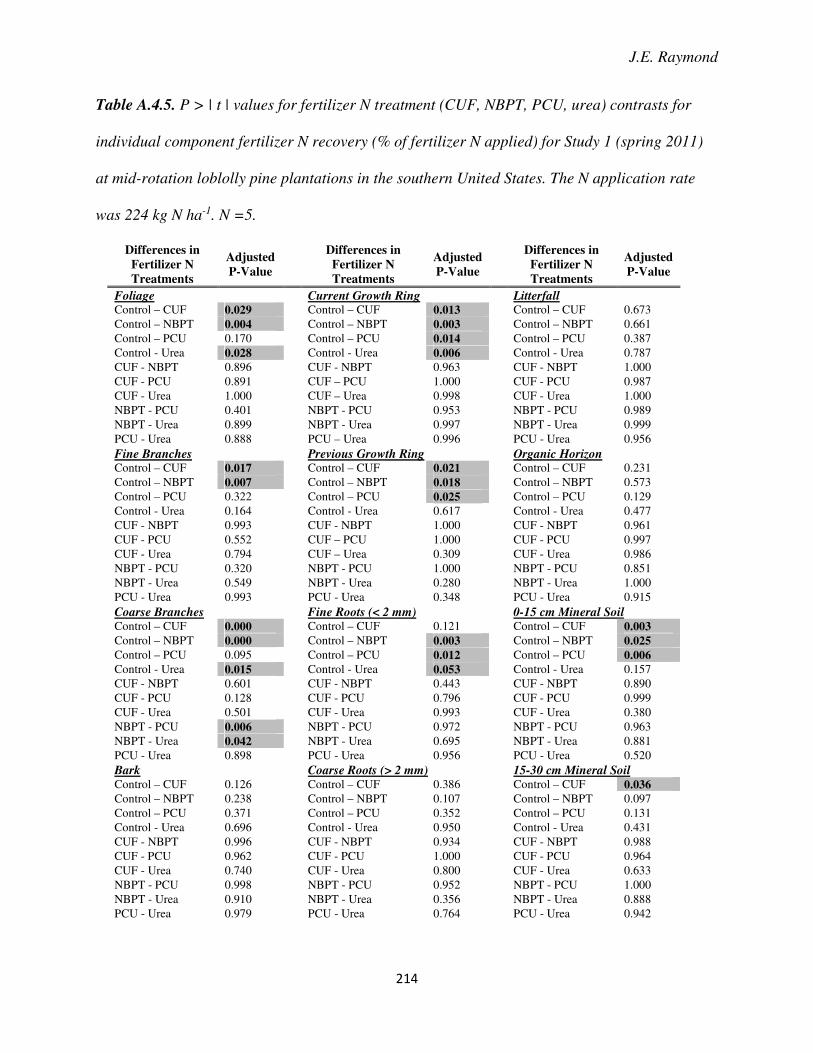
J.E. Raymond
214
Table A.4.5. P > | t | values for fertilizer N treatment (CUF, NBPT, PCU, urea) contrasts for
individual component fertilizer N recovery (% of fertilizer N applied) for Study 1 (spring 2011)
at mid-rotation loblolly pine plantations in the southern United States. The N application rate
was 224 kg N ha-1. N =5.
Differences in
Fertilizer N
Treatments
Adjusted
P-Value
Differences in
Fertilizer N
Treatments
Adjusted
P-Value
Differences in
Fertilizer N
Treatments
Adjusted
P-Value
Foliage Current Growth Ring Litterfall Control – CUF 0.029 Control – CUF 0.013 Control – CUF 0.673 Control – NBPT 0.004 Control – NBPT 0.003 Control – NBPT 0.661 Control – PCU 0.170 Control – PCU 0.014 Control – PCU 0.387 Control - Urea 0.028 Control - Urea 0.006 Control - Urea 0.787 CUF - NBPT 0.896 CUF - NBPT 0.963 CUF - NBPT 1.000 CUF - PCU 0.891 CUF – PCU 1.000 CUF - PCU 0.987 CUF - Urea 1.000 CUF – Urea 0.998 CUF - Urea 1.000
NBPT - PCU 0.401 NBPT - PCU 0.953 NBPT - PCU 0.989 NBPT - Urea 0.899 NBPT - Urea 0.997 NBPT - Urea 0.999
PCU - Urea 0.888 PCU – Urea 0.996 PCU - Urea 0.956
Fine Branches Previous Growth Ring Organic Horizon Control – CUF 0.017 Control – CUF 0.021 Control – CUF 0.231 Control – NBPT 0.007 Control – NBPT 0.018 Control – NBPT 0.573 Control – PCU 0.322 Control – PCU 0.025 Control – PCU 0.129 Control - Urea 0.164 Control - Urea 0.617 Control - Urea 0.477 CUF - NBPT 0.993 CUF - NBPT 1.000 CUF - NBPT 0.961 CUF - PCU 0.552 CUF – PCU 1.000 CUF - PCU 0.997 CUF - Urea 0.794 CUF – Urea 0.309 CUF - Urea 0.986
NBPT - PCU 0.320 NBPT - PCU 1.000 NBPT - PCU 0.851 NBPT - Urea 0.549 NBPT - Urea 0.280 NBPT - Urea 1.000
PCU - Urea 0.993 PCU - Urea 0.348 PCU - Urea 0.915
Coarse Branches Fine Roots (< 2 mm) 0-15 cm Mineral Soil Control – CUF 0.000 Control – CUF 0.121 Control – CUF 0.003
Control – NBPT 0.000 Control – NBPT 0.003 Control – NBPT 0.025
Control – PCU 0.095 Control – PCU 0.012 Control – PCU 0.006
Control - Urea 0.015 Control - Urea 0.053 Control - Urea 0.157 CUF - NBPT 0.601 CUF - NBPT 0.443 CUF - NBPT 0.890 CUF - PCU 0.128 CUF - PCU 0.796 CUF - PCU 0.999 CUF - Urea 0.501 CUF - Urea 0.993 CUF - Urea 0.380
NBPT - PCU 0.006 NBPT - PCU 0.972 NBPT - PCU 0.963 NBPT - Urea 0.042 NBPT - Urea 0.695 NBPT - Urea 0.881
PCU - Urea 0.898 PCU - Urea 0.956 PCU - Urea 0.520
Bark Coarse Roots (> 2 mm) 15-30 cm Mineral Soil Control – CUF 0.126 Control – CUF 0.386 Control – CUF 0.036
Control – NBPT 0.238 Control – NBPT 0.107 Control – NBPT 0.097 Control – PCU 0.371 Control – PCU 0.352 Control – PCU 0.131 Control - Urea 0.696 Control - Urea 0.950 Control - Urea 0.431 CUF - NBPT 0.996 CUF - NBPT 0.934 CUF - NBPT 0.988 CUF - PCU 0.962 CUF - PCU 1.000 CUF - PCU 0.964 CUF - Urea 0.740 CUF - Urea 0.800 CUF - Urea 0.633
NBPT - PCU 0.998 NBPT - PCU 0.952 NBPT - PCU 1.000 NBPT - Urea 0.910 NBPT - Urea 0.356 NBPT - Urea 0.888
PCU - Urea 0.979 PCU - Urea 0.764 PCU - Urea 0.942
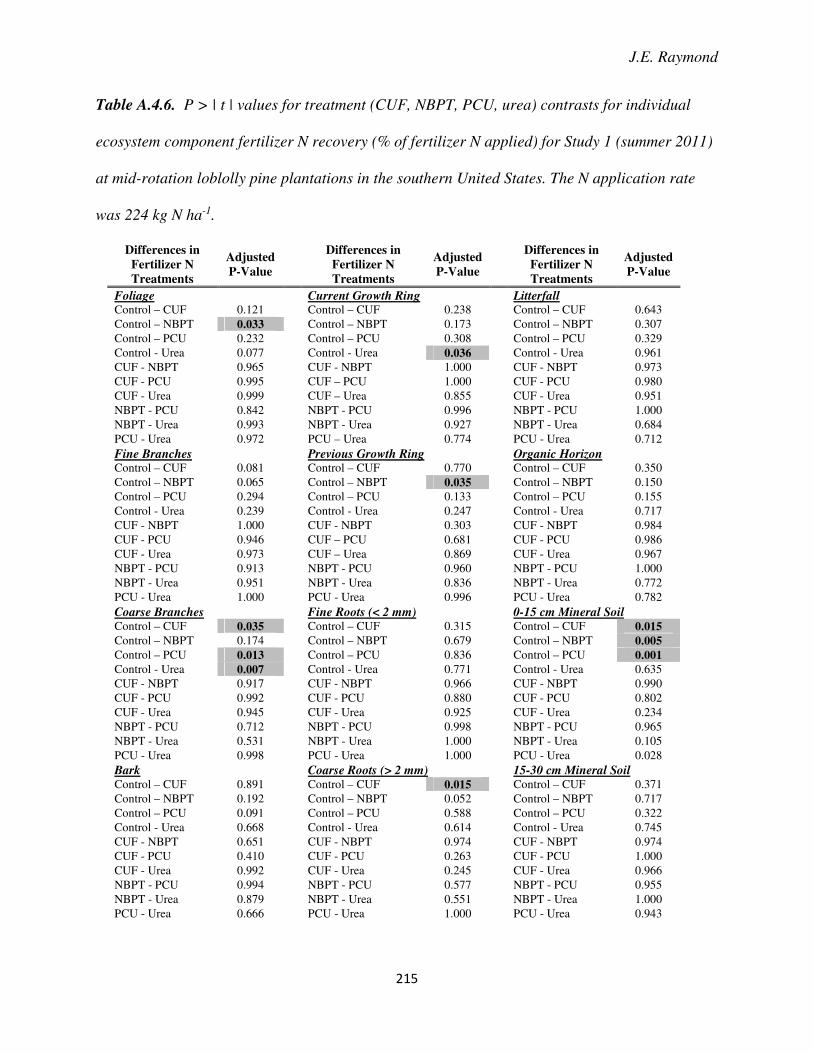
J.E. Raymond
215
Table A.4.6. P > | t | values for treatment (CUF, NBPT, PCU, urea) contrasts for individual
ecosystem component fertilizer N recovery (% of fertilizer N applied) for Study 1 (summer 2011)
at mid-rotation loblolly pine plantations in the southern United States. The N application rate
was 224 kg N ha-1.
Differences in
Fertilizer N
Treatments
Adjusted
P-Value
Differences in
Fertilizer N
Treatments
Adjusted
P-Value
Differences in
Fertilizer N
Treatments
Adjusted
P-Value
Foliage Current Growth Ring Litterfall Control – CUF 0.121 Control – CUF 0.238 Control – CUF 0.643 Control – NBPT 0.033 Control – NBPT 0.173 Control – NBPT 0.307 Control – PCU 0.232 Control – PCU 0.308 Control – PCU 0.329 Control - Urea 0.077 Control - Urea 0.036 Control - Urea 0.961 CUF - NBPT 0.965 CUF - NBPT 1.000 CUF - NBPT 0.973 CUF - PCU 0.995 CUF – PCU 1.000 CUF - PCU 0.980 CUF - Urea 0.999 CUF – Urea 0.855 CUF - Urea 0.951
NBPT - PCU 0.842 NBPT - PCU 0.996 NBPT - PCU 1.000 NBPT - Urea 0.993 NBPT - Urea 0.927 NBPT - Urea 0.684
PCU - Urea 0.972 PCU – Urea 0.774 PCU - Urea 0.712
Fine Branches Previous Growth Ring Organic Horizon Control – CUF 0.081 Control – CUF 0.770 Control – CUF 0.350 Control – NBPT 0.065 Control – NBPT 0.035 Control – NBPT 0.150 Control – PCU 0.294 Control – PCU 0.133 Control – PCU 0.155 Control - Urea 0.239 Control - Urea 0.247 Control - Urea 0.717 CUF - NBPT 1.000 CUF - NBPT 0.303 CUF - NBPT 0.984 CUF - PCU 0.946 CUF – PCU 0.681 CUF - PCU 0.986 CUF - Urea 0.973 CUF – Urea 0.869 CUF - Urea 0.967
NBPT - PCU 0.913 NBPT - PCU 0.960 NBPT - PCU 1.000 NBPT - Urea 0.951 NBPT - Urea 0.836 NBPT - Urea 0.772
PCU - Urea 1.000 PCU - Urea 0.996 PCU - Urea 0.782
Coarse Branches Fine Roots (< 2 mm) 0-15 cm Mineral Soil Control – CUF 0.035 Control – CUF 0.315 Control – CUF 0.015
Control – NBPT 0.174 Control – NBPT 0.679 Control – NBPT 0.005
Control – PCU 0.013 Control – PCU 0.836 Control – PCU 0.001
Control - Urea 0.007 Control - Urea 0.771 Control - Urea 0.635 CUF - NBPT 0.917 CUF - NBPT 0.966 CUF - NBPT 0.990 CUF - PCU 0.992 CUF - PCU 0.880 CUF - PCU 0.802 CUF - Urea 0.945 CUF - Urea 0.925 CUF - Urea 0.234
NBPT - PCU 0.712 NBPT - PCU 0.998 NBPT - PCU 0.965 NBPT - Urea 0.531 NBPT - Urea 1.000 NBPT - Urea 0.105
PCU - Urea 0.998 PCU - Urea 1.000 PCU - Urea 0.028
Bark Coarse Roots (> 2 mm) 15-30 cm Mineral Soil Control – CUF 0.891 Control – CUF 0.015 Control – CUF 0.371 Control – NBPT 0.192 Control – NBPT 0.052 Control – NBPT 0.717 Control – PCU 0.091 Control – PCU 0.588 Control – PCU 0.322 Control - Urea 0.668 Control - Urea 0.614 Control - Urea 0.745 CUF - NBPT 0.651 CUF - NBPT 0.974 CUF - NBPT 0.974 CUF - PCU 0.410 CUF - PCU 0.263 CUF - PCU 1.000 CUF - Urea 0.992 CUF - Urea 0.245 CUF - Urea 0.966
NBPT - PCU 0.994 NBPT - PCU 0.577 NBPT - PCU 0.955 NBPT - Urea 0.879 NBPT - Urea 0.551 NBPT - Urea 1.000
PCU - Urea 0.666 PCU - Urea 1.000 PCU - Urea 0.943
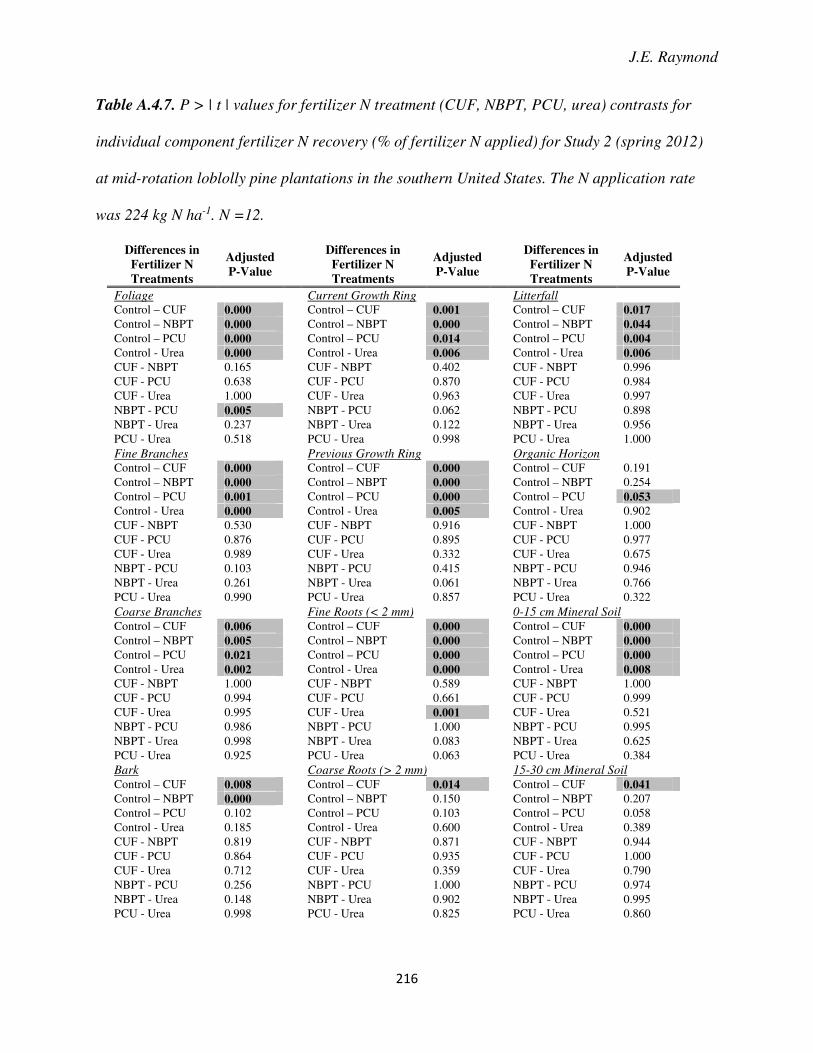
J.E. Raymond
216
Table A.4.7. P > | t | values for fertilizer N treatment (CUF, NBPT, PCU, urea) contrasts for
individual component fertilizer N recovery (% of fertilizer N applied) for Study 2 (spring 2012)
at mid-rotation loblolly pine plantations in the southern United States. The N application rate
was 224 kg N ha-1. N =12.
Differences in
Fertilizer N
Treatments
Adjusted
P-Value
Differences in
Fertilizer N
Treatments
Adjusted
P-Value
Differences in
Fertilizer N
Treatments
Adjusted
P-Value
Foliage Current Growth Ring Litterfall Control – CUF 0.000 Control – CUF 0.001 Control – CUF 0.017
Control – NBPT 0.000 Control – NBPT 0.000 Control – NBPT 0.044
Control – PCU 0.000 Control – PCU 0.014 Control – PCU 0.004
Control - Urea 0.000 Control - Urea 0.006 Control - Urea 0.006
CUF - NBPT 0.165 CUF - NBPT 0.402 CUF - NBPT 0.996 CUF - PCU 0.638 CUF - PCU 0.870 CUF - PCU 0.984
CUF - Urea 1.000 CUF - Urea 0.963 CUF - Urea 0.997 NBPT - PCU 0.005 NBPT - PCU 0.062 NBPT - PCU 0.898 NBPT - Urea 0.237 NBPT - Urea 0.122 NBPT - Urea 0.956 PCU - Urea 0.518 PCU - Urea 0.998 PCU - Urea 1.000
Fine Branches Previous Growth Ring Organic Horizon Control – CUF 0.000 Control – CUF 0.000 Control – CUF 0.191
Control – NBPT 0.000 Control – NBPT 0.000 Control – NBPT 0.254
Control – PCU 0.001 Control – PCU 0.000 Control – PCU 0.053
Control - Urea 0.000 Control - Urea 0.005 Control - Urea 0.902
CUF - NBPT 0.530 CUF - NBPT 0.916 CUF - NBPT 1.000 CUF - PCU 0.876 CUF - PCU 0.895 CUF - PCU 0.977 CUF - Urea 0.989 CUF - Urea 0.332 CUF - Urea 0.675
NBPT - PCU 0.103 NBPT - PCU 0.415 NBPT - PCU 0.946 NBPT - Urea 0.261 NBPT - Urea 0.061 NBPT - Urea 0.766
PCU - Urea 0.990 PCU - Urea 0.857 PCU - Urea 0.322
Coarse Branches Fine Roots (< 2 mm) 0-15 cm Mineral Soil Control – CUF 0.006 Control – CUF 0.000 Control – CUF 0.000
Control – NBPT 0.005 Control – NBPT 0.000 Control – NBPT 0.000
Control – PCU 0.021 Control – PCU 0.000 Control – PCU 0.000
Control - Urea 0.002 Control - Urea 0.000 Control - Urea 0.008
CUF - NBPT 1.000 CUF - NBPT 0.589 CUF - NBPT 1.000 CUF - PCU 0.994 CUF - PCU 0.661 CUF - PCU 0.999
CUF - Urea 0.995 CUF - Urea 0.001 CUF - Urea 0.521 NBPT - PCU 0.986 NBPT - PCU 1.000 NBPT - PCU 0.995 NBPT - Urea 0.998 NBPT - Urea 0.083 NBPT - Urea 0.625 PCU - Urea 0.925 PCU - Urea 0.063 PCU - Urea 0.384
Bark Coarse Roots (> 2 mm) 15-30 cm Mineral Soil Control – CUF 0.008 Control – CUF 0.014 Control – CUF 0.041
Control – NBPT 0.000 Control – NBPT 0.150 Control – NBPT 0.207
Control – PCU 0.102 Control – PCU 0.103 Control – PCU 0.058
Control - Urea 0.185 Control - Urea 0.600 Control - Urea 0.389
CUF - NBPT 0.819 CUF - NBPT 0.871 CUF - NBPT 0.944 CUF - PCU 0.864 CUF - PCU 0.935 CUF - PCU 1.000 CUF - Urea 0.712 CUF - Urea 0.359 CUF - Urea 0.790
NBPT - PCU 0.256 NBPT - PCU 1.000 NBPT - PCU 0.974 NBPT - Urea 0.148 NBPT - Urea 0.902 NBPT - Urea 0.995
PCU - Urea 0.998 PCU - Urea 0.825 PCU - Urea 0.860
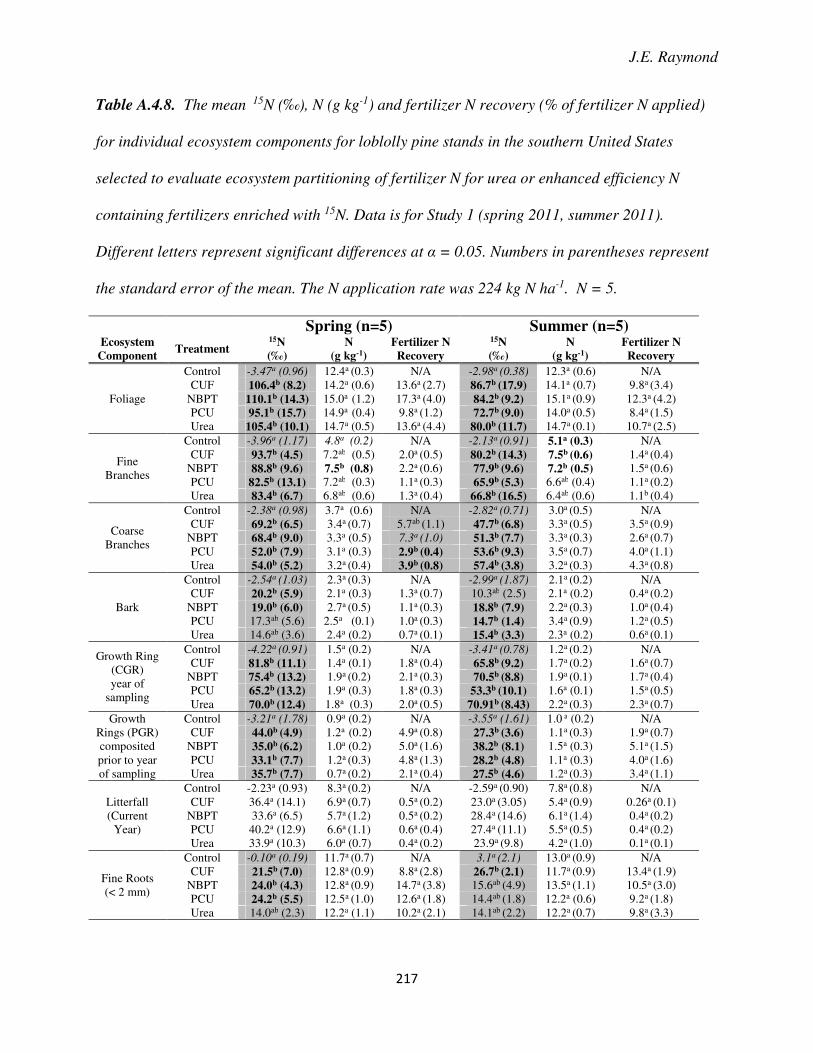
J.E. Raymond
217
Table A.4.8. The mean 15N (‰), N (g kg-1) and fertilizer N recovery (% of fertilizer N applied)
for individual ecosystem components for loblolly pine stands in the southern United States
selected to evaluate ecosystem partitioning of fertilizer N for urea or enhanced efficiency N
containing fertilizers enriched with 15N. Data is for Study 1 (spring 2011, summer 2011).
Different letters represent significant differences at α = 0.05. Numbers in parentheses represent
the standard error of the mean. The N application rate was 224 kg N ha-1. N = 5.
Spring (n=5) Summer (n=5) Ecosystem
Component Treatment
15N
(‰)
N
(g kg-1)
Fertilizer N
Recovery
15N
(‰)
N
(g kg-1)
Fertilizer N
Recovery
Foliage
Control -3.47a (0.96) 12.4a (0.3) N/A -2.98a (0.38) 12.3a (0.6) N/A CUF 106.4b (8.2) 14.2a (0.6) 13.6a (2.7) 86.7b (17.9) 14.1a (0.7) 9.8a (3.4)
NBPT 110.1b (14.3) 15.0a (1.2) 17.3a (4.0) 84.2b (9.2) 15.1a (0.9) 12.3a (4.2) PCU 95.1b (15.7) 14.9a (0.4) 9.8a (1.2) 72.7b (9.0) 14.0a (0.5) 8.4a (1.5) Urea 105.4b (10.1) 14.7a (0.5) 13.6a (4.4) 80.0b (11.7) 14.7a (0.1) 10.7a (2.5)
Fine Branches
Control -3.96a (1.17) 4.8a (0.2) N/A -2.13a (0.91) 5.1a (0.3) N/A CUF 93.7b (4.5) 7.2ab (0.5) 2.0a (0.5) 80.2b (14.3) 7.5b (0.6) 1.4a (0.4)
NBPT 88.8b (9.6) 7.5b (0.8) 2.2a (0.6) 77.9b (9.6) 7.2b (0.5) 1.5a (0.6) PCU 82.5b (13.1) 7.2ab (0.3) 1.1a (0.3) 65.9b (5.3) 6.6ab (0.4) 1.1a (0.2) Urea 83.4b (6.7) 6.8ab (0.6) 1.3a (0.4) 66.8b (16.5) 6.4ab (0.6) 1.1b (0.4)
Coarse Branches
Control -2.38a (0.98) 3.7a (0.6) N/A -2.82a (0.71) 3.0a (0.5) N/A CUF 69.2b (6.5) 3.4a (0.7) 5.7ab (1.1) 47.7b (6.8) 3.3a (0.5) 3.5a (0.9)
NBPT 68.4b (9.0) 3.3a (0.5) 7.3a (1.0) 51.3b (7.7) 3.3a (0.3) 2.6a (0.7) PCU 52.0b (7.9) 3.1a (0.3) 2.9b (0.4) 53.6b (9.3) 3.5a (0.7) 4.0a (1.1) Urea 54.0b (5.2) 3.2a (0.4) 3.9b (0.8) 57.4b (3.8) 3.2a (0.3) 4.3a (0.8)
Bark
Control -2.54a (1.03) 2.3a (0.3) N/A -2.99a (1.87) 2.1a (0.2) N/A CUF 20.2b (5.9) 2.1a (0.3) 1.3a (0.7) 10.3ab (2.5) 2.1a (0.2) 0.4a (0.2)
NBPT 19.0b (6.0) 2.7a (0.5) 1.1a (0.3) 18.8b (7.9) 2.2a (0.3) 1.0a (0.4) PCU 17.3ab (5.6) 2.5a (0.1) 1.0a (0.3) 14.7b (1.4) 3.4a (0.9) 1.2a (0.5) Urea 14.6ab (3.6) 2.4a (0.2) 0.7a (0.1) 15.4b (3.3) 2.3a (0.2) 0.6a (0.1)
Growth Ring (CGR) year of
sampling
Control -4.22a (0.91) 1.5a (0.2) N/A -3.41a (0.78) 1.2a (0.2) N/A CUF 81.8b (11.1) 1.4a (0.1) 1.8a (0.4) 65.8b (9.2) 1.7a (0.2) 1.6a (0.7)
NBPT 75.4b (13.2) 1.9a (0.2) 2.1a (0.3) 70.5b (8.8) 1.9a (0.1) 1.7a (0.4) PCU 65.2b (13.2) 1.9a (0.3) 1.8a (0.3) 53.3b (10.1) 1.6a (0.1) 1.5a (0.5) Urea 70.0b (12.4) 1.8a (0.3) 2.0a (0.5) 70.91b (8.43) 2.2a (0.3) 2.3a (0.7)
Growth Rings (PGR) composited prior to year of sampling
Control -3.21a (1.78) 0.9a (0.2) N/A -3.55a (1.61) 1.0 a (0.2) N/A CUF 44.0b (4.9) 1.2a (0.2) 4.9a (0.8) 27.3b (3.6) 1.1a (0.3) 1.9a (0.7)
NBPT 35.0b (6.2) 1.0a (0.2) 5.0a (1.6) 38.2b (8.1) 1.5a (0.3) 5.1a (1.5) PCU 33.1b (7.7) 1.2a (0.3) 4.8a (1.3) 28.2b (4.8) 1.1a (0.3) 4.0a (1.6) Urea 35.7b (7.7) 0.7a (0.2) 2.1a (0.4) 27.5b (4.6) 1.2a (0.3) 3.4a (1.1)
Litterfall (Current
Year)
Control -2.23a (0.93) 8.3a (0.2) N/A -2.59a (0.90) 7.8a (0.8) N/A CUF 36.4a (14.1) 6.9a (0.7) 0.5a (0.2) 23.0a (3.05) 5.4a (0.9) 0.26a (0.1)
NBPT 33.6a (6.5) 5.7a (1.2) 0.5a (0.2) 28.4a (14.6) 6.1a (1.4) 0.4a (0.2) PCU 40.2a (12.9) 6.6a (1.1) 0.6a (0.4) 27.4a (11.1) 5.5a (0.5) 0.4a (0.2) Urea 33.9a (10.3) 6.0a (0.7) 0.4a (0.2) 23.9a (9.8) 4.2a (1.0) 0.1a (0.1)
Fine Roots (< 2 mm)
Control -0.10a (0.19) 11.7a (0.7) N/A 3.1a (2.1) 13.0a (0.9) N/A CUF 21.5b (7.0) 12.8a (0.9) 8.8a (2.8) 26.7b (2.1) 11.7a (0.9) 13.4a (1.9)
NBPT 24.0b (4.3) 12.8a (0.9) 14.7a (3.8) 15.6ab (4.9) 13.5a (1.1) 10.5a (3.0) PCU 24.2b (5.5) 12.5a (1.0) 12.6a (1.8) 14.4ab (1.8) 12.2a (0.6) 9.2a (1.8) Urea 14.0ab (2.3) 12.2a (1.1) 10.2a (2.1) 14.1ab (2.2) 12.2a (0.7) 9.8a (3.3)
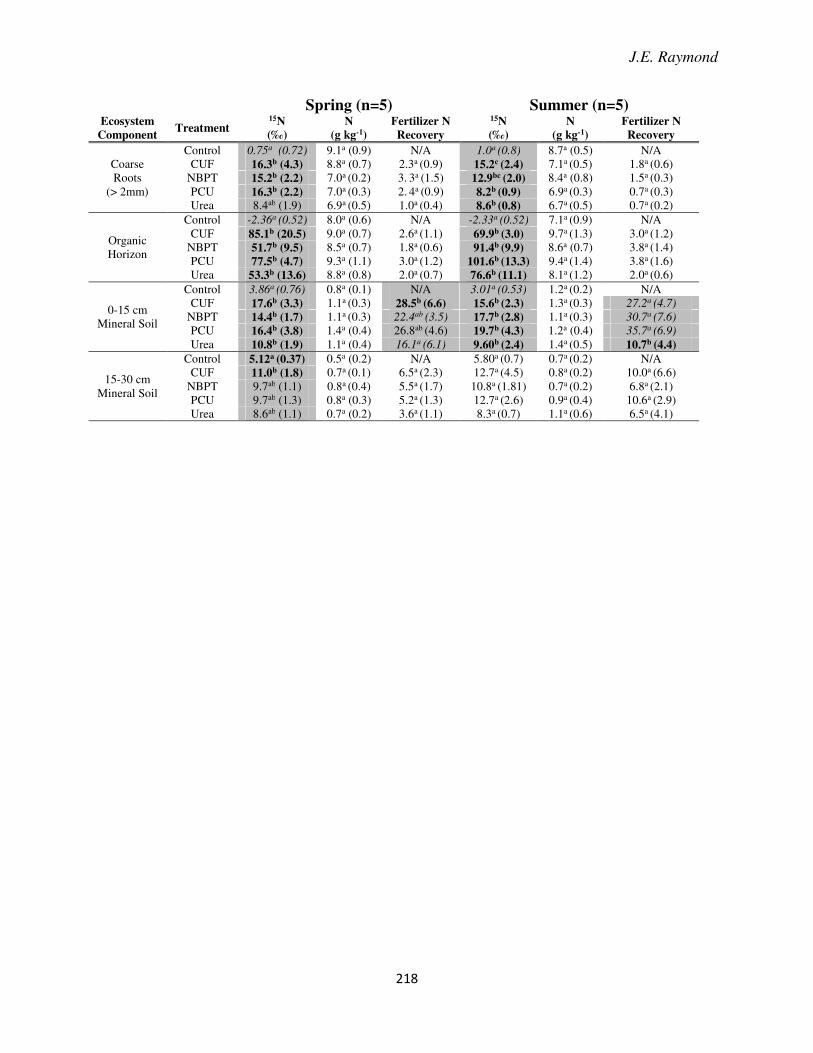
J.E. Raymond
218
Spring (n=5) Summer (n=5) Ecosystem
Component Treatment
15N
(‰)
N
(g kg-1)
Fertilizer N
Recovery
15N
(‰)
N
(g kg-1)
Fertilizer N
Recovery
Coarse Roots
(> 2mm)
Control 0.75a (0.72) 9.1a (0.9) N/A 1.0a (0.8) 8.7a (0.5) N/A CUF 16.3b (4.3) 8.8a (0.7) 2.3a (0.9) 15.2c (2.4) 7.1a (0.5) 1.8a (0.6)
NBPT 15.2b (2.2) 7.0a (0.2) 3. 3a (1.5) 12.9bc (2.0) 8.4a (0.8) 1.5a (0.3) PCU 16.3b (2.2) 7.0a (0.3) 2. 4a (0.9) 8.2b (0.9) 6.9a (0.3) 0.7a (0.3) Urea 8.4ab (1.9) 6.9a (0.5) 1.0a (0.4) 8.6b (0.8) 6.7a (0.5) 0.7a (0.2)
Organic Horizon
Control -2.36a (0.52) 8.0a (0.6) N/A -2.33a (0.52) 7.1a (0.9) N/A CUF 85.1b (20.5) 9.0a (0.7) 2.6a (1.1) 69.9b (3.0) 9.7a (1.3) 3.0a (1.2)
NBPT 51.7b (9.5) 8.5a (0.7) 1.8a (0.6) 91.4b (9.9) 8.6a (0.7) 3.8a (1.4) PCU 77.5b (4.7) 9.3a (1.1) 3.0a (1.2) 101.6b (13.3) 9.4a (1.4) 3.8a (1.6) Urea 53.3b (13.6) 8.8a (0.8) 2.0a (0.7) 76.6b (11.1) 8.1a (1.2) 2.0a (0.6)
0-15 cm Mineral Soil
Control 3.86a (0.76) 0.8a (0.1) N/A 3.01a (0.53) 1.2a (0.2) N/A CUF 17.6b (3.3) 1.1a (0.3) 28.5b (6.6) 15.6b (2.3) 1.3a (0.3) 27.2a (4.7)
NBPT 14.4b (1.7) 1.1a (0.3) 22.4ab (3.5) 17.7b (2.8) 1.1a (0.3) 30.7a (7.6)
PCU 16.4b (3.8) 1.4a (0.4) 26.8ab (4.6) 19.7b (4.3) 1.2a (0.4) 35.7a (6.9)
Urea 10.8b (1.9) 1.1a (0.4) 16.1a (6.1) 9.60b (2.4) 1.4a (0.5) 10.7b (4.4)
15-30 cm Mineral Soil
Control 5.12a (0.37) 0.5a (0.2) N/A 5.80a (0.7) 0.7a (0.2) N/A CUF 11.0b (1.8) 0.7a (0.1) 6.5a (2.3) 12.7a (4.5) 0.8a (0.2) 10.0a (6.6)
NBPT 9.7ab (1.1) 0.8a (0.4) 5.5a (1.7) 10.8a (1.81) 0.7a (0.2) 6.8a (2.1) PCU 9.7ab (1.3) 0.8a (0.3) 5.2a (1.3) 12.7a (2.6) 0.9a (0.4) 10.6a (2.9) Urea 8.6ab (1.1) 0.7a (0.2) 3.6a (1.1) 8.3a (0.7) 1.1a (0.6) 6.5a (4.1)