Embed Size (px)
Citation preview

HarvestPlus c/o IFPRI2033 K Street, NW • Washington, DC 20006-1002 USATel: 202-862-5600 • Fax: [email protected] • www.HarvestPlus.org
3RD MLA WORKSHOP
SPEKE RESORT MUNYONYO, KAMPALA
16TH – 23RD AUGUST 2016
Innocent Bikara
PROGRESS ON MLA
FORECASTING MODEL FOR
OSP IN UGANDA

PROCESS OF MLA MODEL BUILDING

Summary of Changes
• Extended from 2014 to 2020
• H+ Uganda reported a combination of Direct & PB; & the model still computed the later separately;
• From 2 to 6 varieties
• Proportional Distribution by Variety (for weighting) vis-à-vis arithmetic means of yield & β-carotene content
• 1st & 2nd cycle yields dropped, rather farmer yields

Summary of Changes
• Informal farmer-to-farmer diffusion takes place after 2nd cycle of planting not 1st
• Payback system started in 2012, not 2007
• Non-OSP production & consumption
– Additional Vit A intake (given mkt shares & nutrient contents for white & yellow)
• % of household area allocated to OSP capped at 50% of average household SP area
• Bioconversion: 12:1 to 13:1

Summary of Changes
Variable Before AfterQuantities diffused 500 1000
Area expansion factor; 1st to 2nd
& 2nd to 3rd planting1 1.375
• Disability Adjusted Life Years (DALYs) parameters
• Costs of biofortification

Comparison of model Estimates
0
50000
100000
150000
200000
250000
300000
350000
Receiving through Payback, cummulative
Old Current
0
10000
20000
30000
40000
50000
60000
70000
Total Production (tons)
Old Current
0%
20%
40%
60%
80%
100%
120%
140%
160%
% EAR delivered for Children<5
Old Current Target (50%)
05000
1000015000200002500030000350004000045000
Total Land Under Orange Fleshed Sweet Potato in Uganda (acres)
Old Current
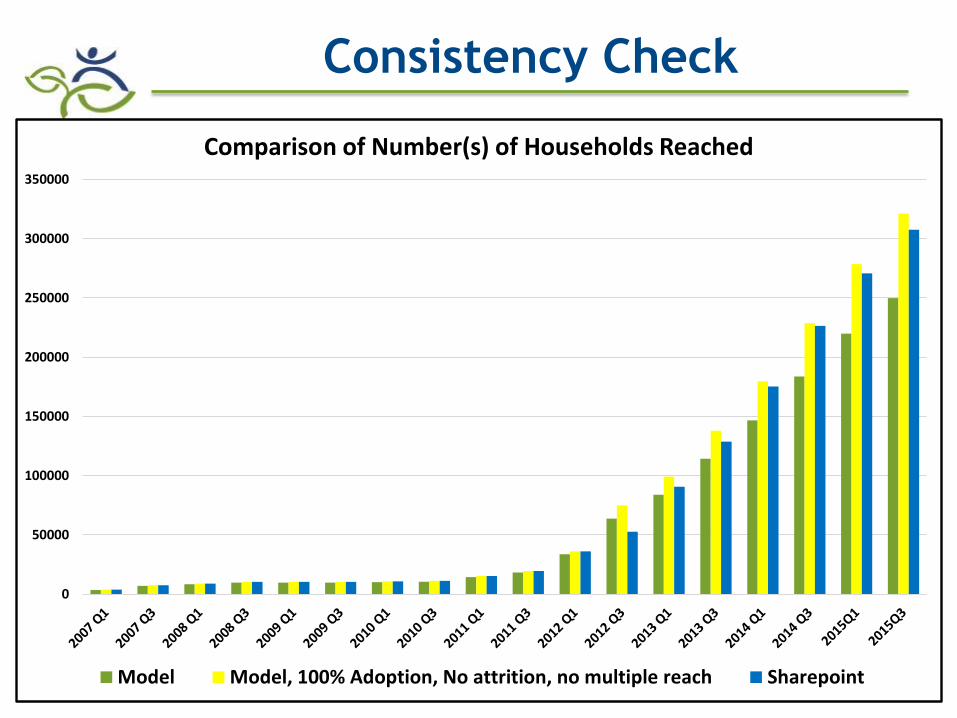
Consistency Check
0
50000
100000
150000
200000
250000
300000
350000
Comparison of Number(s) of Households Reached
Model Model, 100% Adoption, No attrition, no multiple reach Sharepoint

Model Results
0
50,000
100,000
150,000
200,000
250,000
300,000
350,000
400,000
Num
ber
of
Farm
ers
Cumulative Number of Farmers Growing OSP Potato in Uganda
Total Still Growing, cummulative DRA- still growing
Receiving Informally- still growing Receiving through Payback- still growing

Model Results
0.0%
2.0%
4.0%
6.0%
8.0%
10.0%
12.0%
2007Q1
2007Q3
2008Q1
2008Q3
2009Q1
2009Q3
2010Q1
2010Q3
2011Q1
2011Q3
2012Q1
2012Q3
2013Q1
2013Q3
2014Q1
2014Q3
2015Q1
2015Q3
Percentage of Sweet Potato farmers Growing OSP

Model Results
-
5,000
10,000
15,000
20,000
25,000
30,000
35,000
40,000
45,000
0.000
0.020
0.040
0.060
0.080
0.100
0.120
0.140
0.160
2007Q1
2007Q3
2008Q1
2008Q3
2009Q1
2009Q3
2010Q1
2010Q3
2011Q1
2011Q3
2012Q1
2012Q3
2013Q1
2013Q3
2014Q1
2014Q3
2015Q1
2015Q3
Average household land allocation & total land under OSP (acres)
Average Household Land allocation to Orange Fleshed Sweet Potatoes in Uganda (acres)
Total Land Under Orange Fleshed Sweet Potato in Uganda (acres)

Model Results
0.0%
5.0%
10.0%
15.0%
20.0%
25.0%
30.0%
35.0%
40.0%
45.0%
Percentage Sweet Potato Area under OSP
% SP area under OSP-Unconditional % SP area under OSP-Conditional

Model Results
0
20
40
60
80
100
120
2007 2008 2009 2010 2011 2012 2013 2014 2015
Trend of per capita intake of OSP among growing households (g/day)
0%
20%
40%
60%
80%
100%
2007 2008 2009 2010 2011 2012 2013 2014 2015
% of OSP in per capita sweet potato consumption-Conditional
OSP Other

Model Results
0%
20%
40%
60%
80%
100%
120%
140%
160%
180%
200%
2007Q1
2007Q3
2008Q1
2008Q3
2009Q1
2009Q3
2010Q1
2010Q3
2011Q1
2011Q3
2012Q1
2012Q3
2013Q1
2013Q3
2014Q1
2014Q3
2015Q1
2015Q3
% EAR delivered for children & women in OSP cultivating hhs
Percentage Average EAR Delivered for Children 12-59 Months in Cultivating Households
Percentage Average EAR Delivered for Pregnant Women 15-49 yrs in Cultivating Households
Percentage Average EAR Delivered for Lactating Women 15-49 yrs in Cultivating Households
Target (50%)

Model Results
0%
2%
4%
6%
8%
10%
12%
14%
16%
18%
20%
2007Q1
2007Q3
2008Q1
2008Q3
2009Q1
2009Q3
2010Q1
2010Q3
2011Q1
2011Q3
2012Q1
2012Q3
2013Q1
2013Q3
2014Q1
2014Q3
2015Q1
2015Q3
Percentage Average EAR Delivered for Children 12-59 Months in Secondary Households
Percentage Average EAR Delivered for Pregnant Women 15-49 yrs in Secondary Households
Percentage Average EAR Delivered for Lactating Women 15-49 yrs in Secondary Households
% EAR delivered for children & women in hhs which receive OSP from cultivating hhs

Model Results
0
20000
40000
60000
80000
100000
120000
140000
160000
2007 2008 2009 2010 2011 2012 2013 2014 2015
DALYs saved DALYs lost-biofortification
0%
10%
20%
30%
40%
50%
60%
70%
80%
90%
100%
2007 2008 2009 2010 2011 2012 2013 2014 2015
DALYs saved DALYs lost-biofortification0%
10%
20%
30%
40%
50%
60%
2007 2008 2009 2010 2011 2012 2013 2014 2015
% DALYs saved
0
20000
40000
60000
80000
100000
120000
140000
160000
2007 2008 2009 2010 2011 2012 2013 2014 2015
DALYs lost-biofortification DALYs lost status quo
Model Results
0
10000
20000
30000
40000
50000
60000
70000
80000
90000
2007 2008 2009 2010 2011 2012 2013 2014 2015 2016 2017 2018 2019 2020
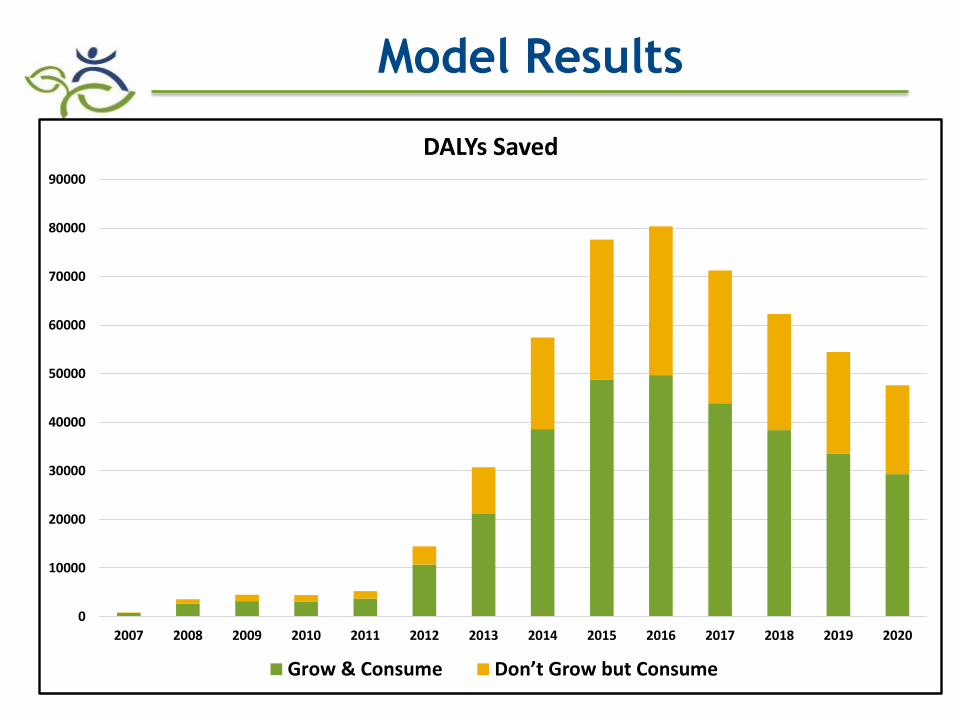
DALYs Saved
Grow & Consume Don’t Grow but Consume

Model Results
0%
10%
20%
30%
40%
50%
60%
70%
80%
90%
100%
2007 2008 2009 2010 2011 2012 2013 2014 2015 2016 2017 2018 2019 2020
DALYs Saved
Grow & Consume Don’t Grow but Consume

Model Results
$19 $20
$150
Low Cost High Cost World Bank Threshold
Cost per DALY saved-All consumers
$31 $32
$150
Low Cost High Cost World Bank Threshold
Cost per DALY saved-Only Growers
47
45
Benefit-Cost Ratio
Low cost High
$548.00
$547.00
GROW CONSUME, DON’T GROW BUT CONSUME, STANDARD
Net Present Value ('000,000)
Low cost High
341% 341%
GROW CONSUME, DON’T GROW BUT CONSUME, STANDARD
Internal Rate of Return (IRR)
Low cost High

THANK YOU