Embed Size (px)
Citation preview
Use of RT for TML (CML), in lieu of UT study
Randall BellardBellard Consulting Serviceswww.bellardcs.com(225) 993-2443
Purpose of trials
• How does RT Profile thickness data compare with UT for both accuracy and repeatability?
• How accurate and repeatable are RT measurements in locations that are not adjacent to the comparator due to uneven blow-up?
• Testing of different size test coupons to determine accuracy of computer radiography equipment for the determination of piping wall thickness
• Determine the variance between insulated and un-insulated piping• Testing of techniques utilized by the technicians for comparable results
2
Testing parameters-1st trial• Worked with NDT Vendor to produce the images on a GE Rhythm CR 100• 1st trial utilized 2” and 6” coupons-piping and elbows-same technician with
supervised instruction• UT readings were taken at the (10) selected TML locations• Placed 1” comparator balls on the coupons for each RT exposure• Performed the trial with (4) different exposure setups (Slides 5, 6, & 7)• Performed trial with insulation and without• Measured at all locations with calibrations performed next to ball and at the
typical O.D. of elbow• Determined the extent of the accuracy of the Measuring Tool, as compared
to UT data
Testing parameters-2nd trial• 2nd trial performed on in-service field circuit – (3/4”, 4”, and 6”)• Tested (3) operators-no formal instructions provided, other than circuit and
RT locations• Tested (2) additional technicians with technique specifics given (source
location, ball, and film placement, etc…)• Computed RT readings were taken with the Manual Measuring Tool and
with the Automated Wall Thickness Measurement Tool • Determined the variance from UT and RT readings acquired
4
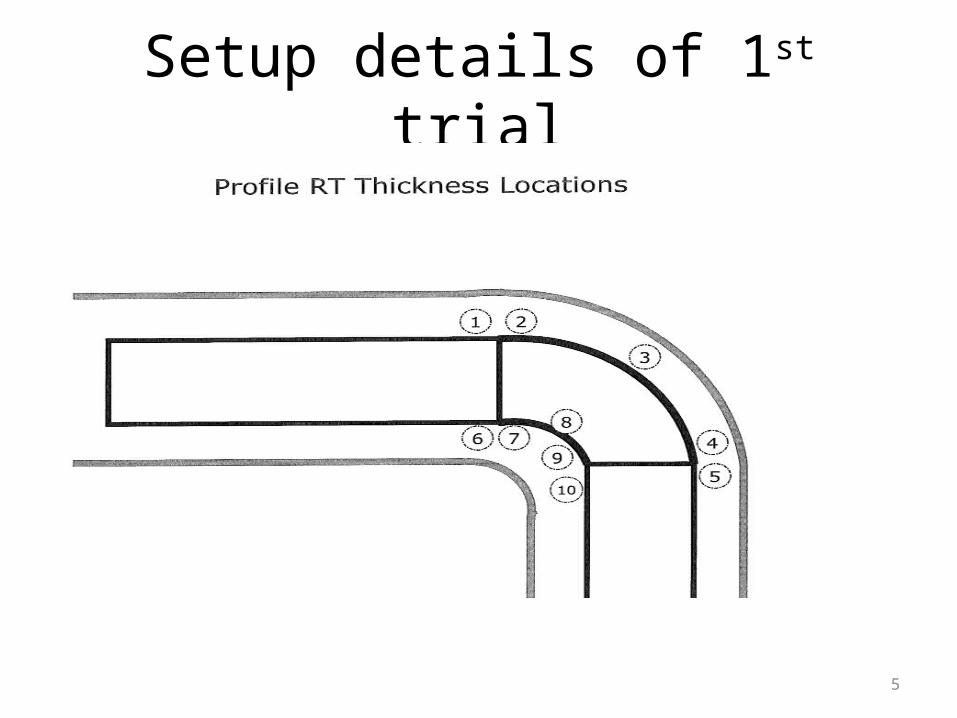
Setup details of 1st trial
5
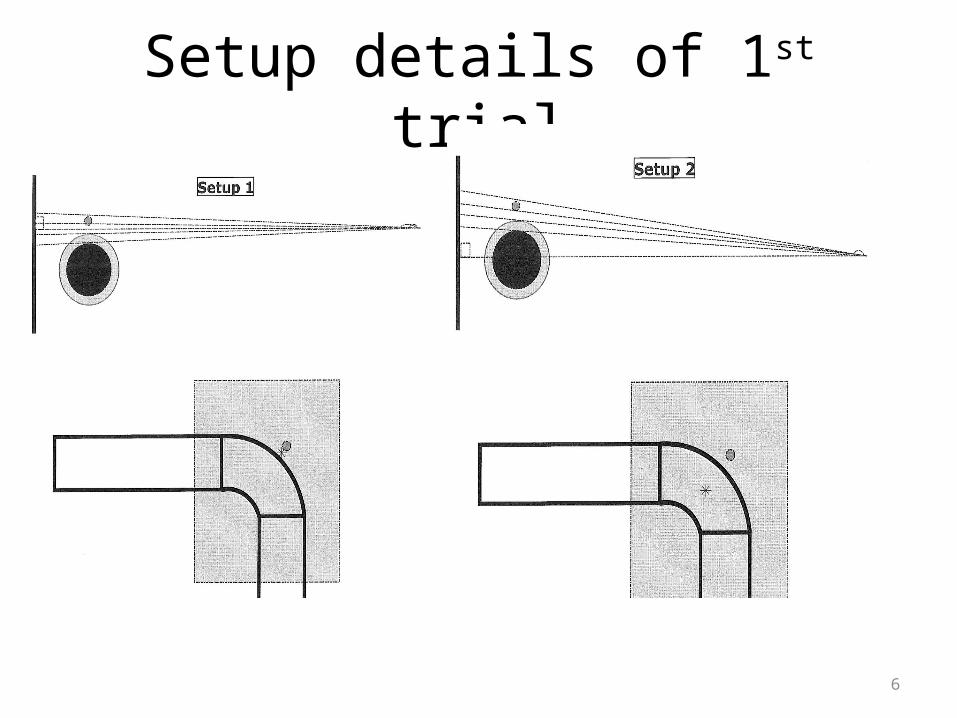
Setup details of 1st trial
6
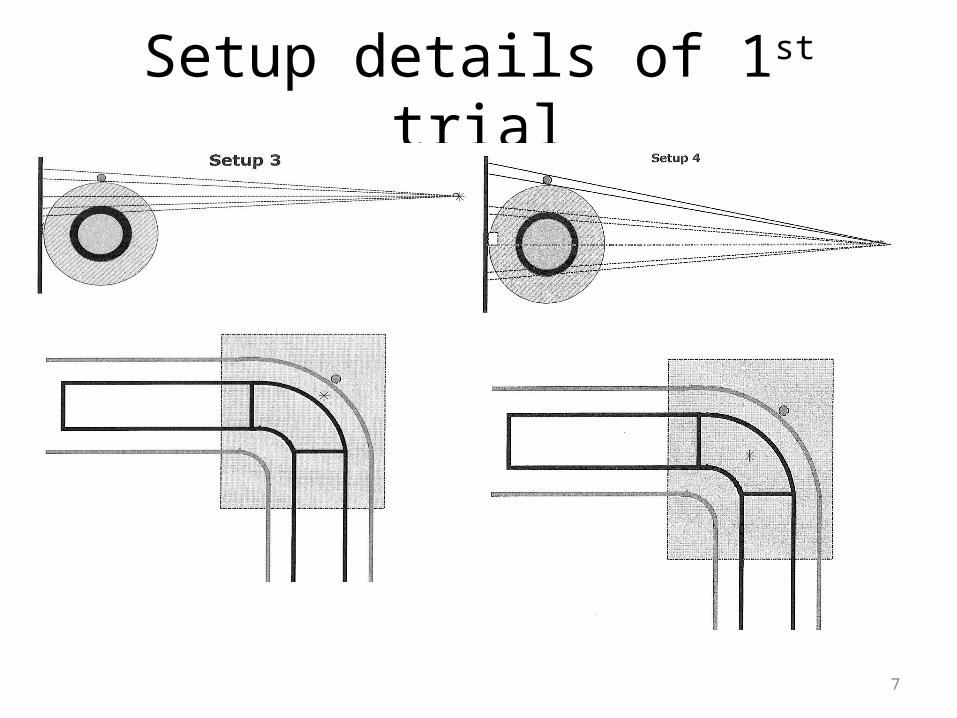
Setup details of 1st trial
7
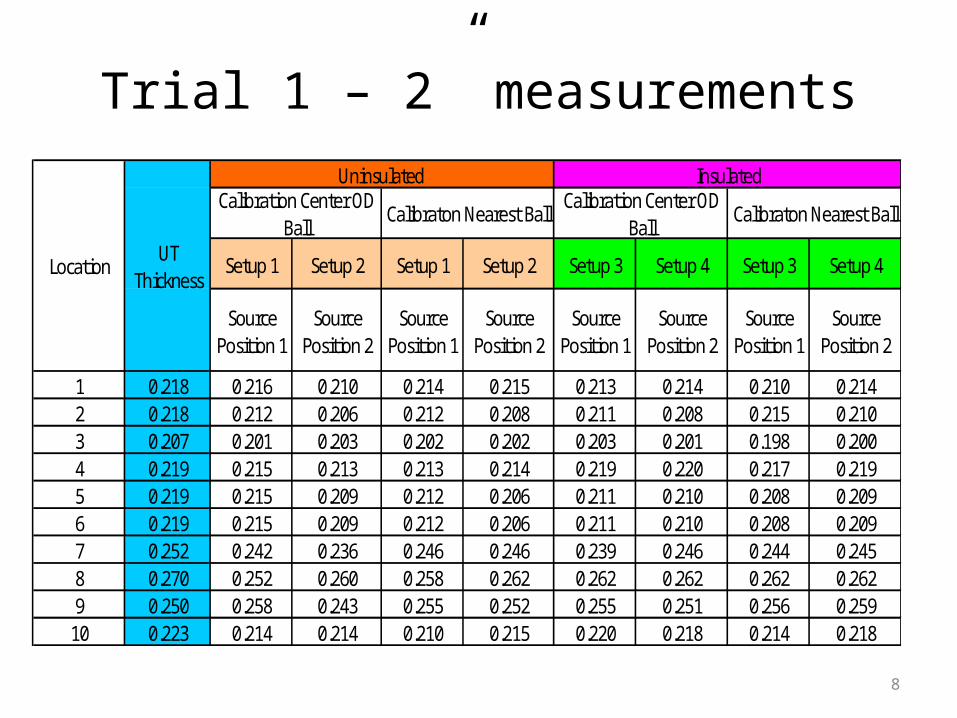
Trial 1 – 2” measurements
Setup 1 Setup 2 Setup 1 Setup 2 Setup 3 Setup 4 Setup 3 Setup 4
Source Position 1
Source Position 2
Source Position 1
Source Position 2
Source Position 1
Source Position 2
Source Position 1
Source Position 2
1 0.218 0.216 0.210 0.214 0.215 0.213 0.214 0.210 0.2142 0.218 0.212 0.206 0.212 0.208 0.211 0.208 0.215 0.2103 0.207 0.201 0.203 0.202 0.202 0.203 0.201 0.198 0.2004 0.219 0.215 0.213 0.213 0.214 0.219 0.220 0.217 0.2195 0.219 0.215 0.209 0.212 0.206 0.211 0.210 0.208 0.2096 0.219 0.215 0.209 0.212 0.206 0.211 0.210 0.208 0.2097 0.252 0.242 0.236 0.246 0.246 0.239 0.246 0.244 0.2458 0.270 0.252 0.260 0.258 0.262 0.262 0.262 0.262 0.2629 0.250 0.258 0.243 0.255 0.252 0.255 0.251 0.256 0.259
10 0.223 0.214 0.214 0.210 0.215 0.220 0.218 0.214 0.218
Calibraton Nearest Ball
Insulated
LocationUT
Thickness
Calibration Center OD Ball
Calibraton Nearest Ball
Uninsulated Calibration Center OD
Ball
8
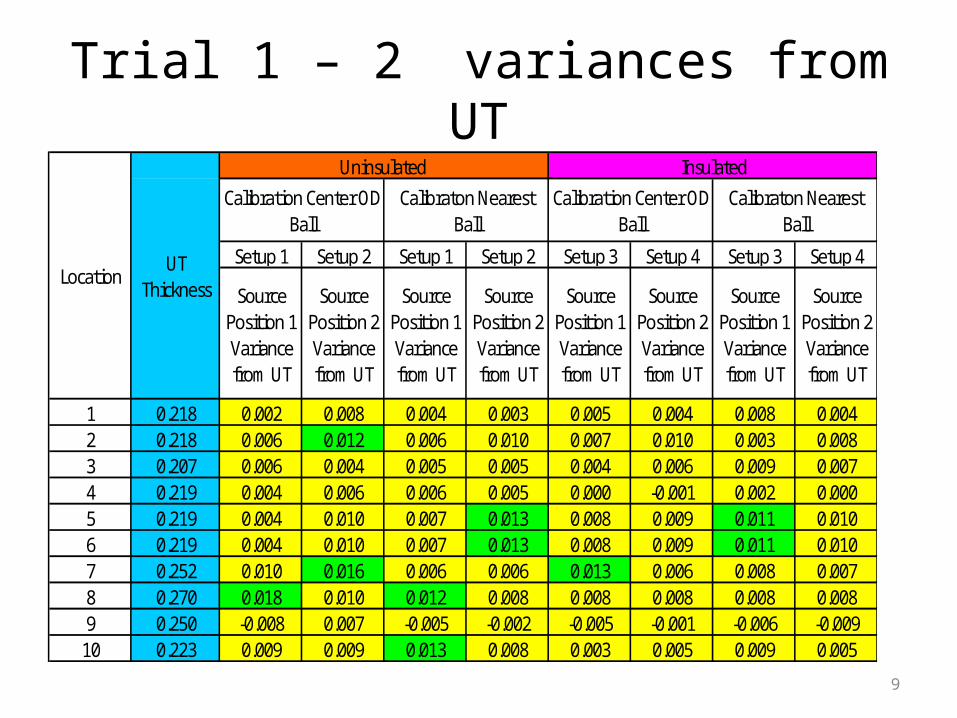
Trial 1 – 2” variances from UT
Setup 1 Setup 2 Setup 1 Setup 2 Setup 3 Setup 4 Setup 3 Setup 4
Source Position 1 Variance from UT
Source Position 2 Variance from UT
Source Position 1 Variance from UT
Source Position 2 Variance from UT
Source Position 1 Variance from UT
Source Position 2 Variance from UT
Source Position 1 Variance from UT
Source Position 2 Variance from UT
1 0.218 0.002 0.008 0.004 0.003 0.005 0.004 0.008 0.0042 0.218 0.006 0.012 0.006 0.010 0.007 0.010 0.003 0.0083 0.207 0.006 0.004 0.005 0.005 0.004 0.006 0.009 0.0074 0.219 0.004 0.006 0.006 0.005 0.000 -0.001 0.002 0.0005 0.219 0.004 0.010 0.007 0.013 0.008 0.009 0.011 0.0106 0.219 0.004 0.010 0.007 0.013 0.008 0.009 0.011 0.0107 0.252 0.010 0.016 0.006 0.006 0.013 0.006 0.008 0.0078 0.270 0.018 0.010 0.012 0.008 0.008 0.008 0.008 0.0089 0.250 -0.008 0.007 -0.005 -0.002 -0.005 -0.001 -0.006 -0.009
10 0.223 0.009 0.009 0.013 0.008 0.003 0.005 0.009 0.005
Calibration Center OD Ball
Uninsulated
LocationUT
Thickness
Insulated
Calibraton Nearest Ball
Calibration Center OD Ball
Calibraton Nearest Ball
9
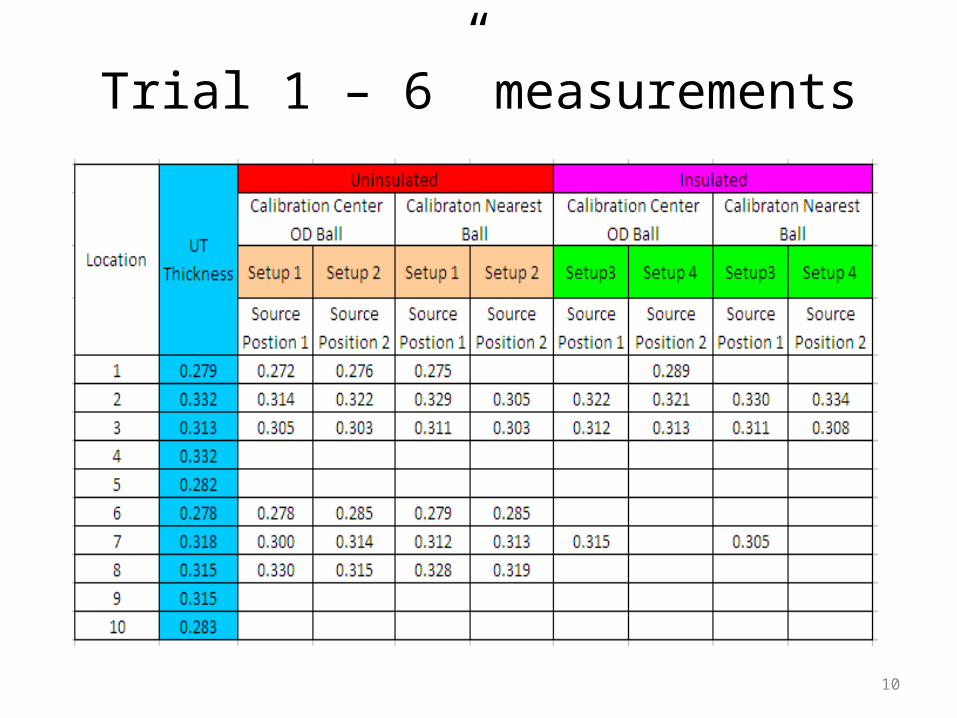
Trial 1 – 6” measurements
10
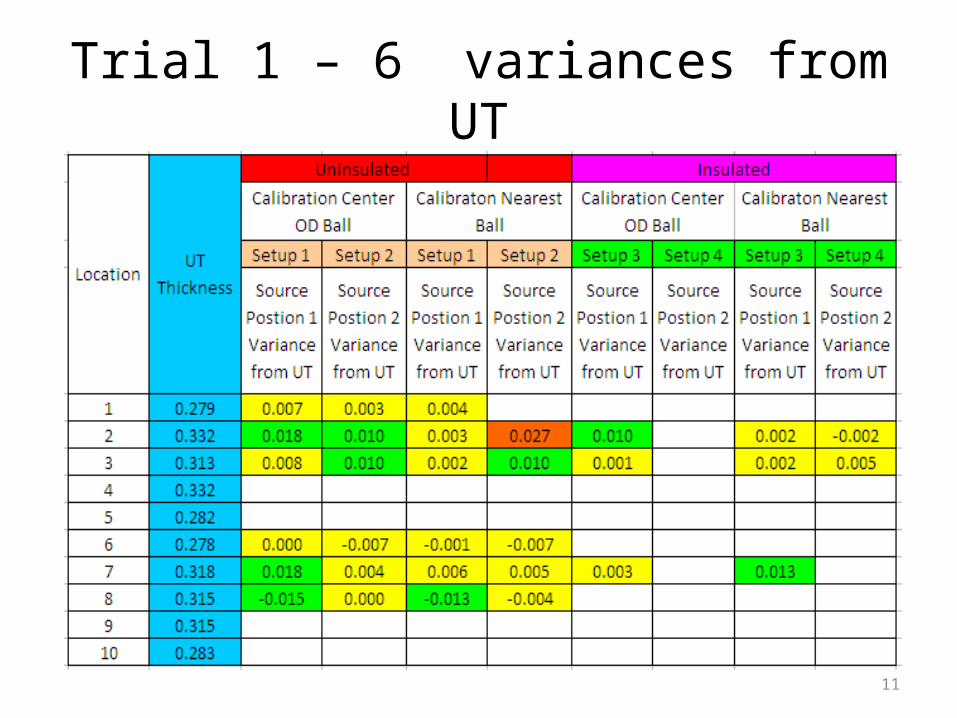
Trial 1 – 6” variances from UT
11
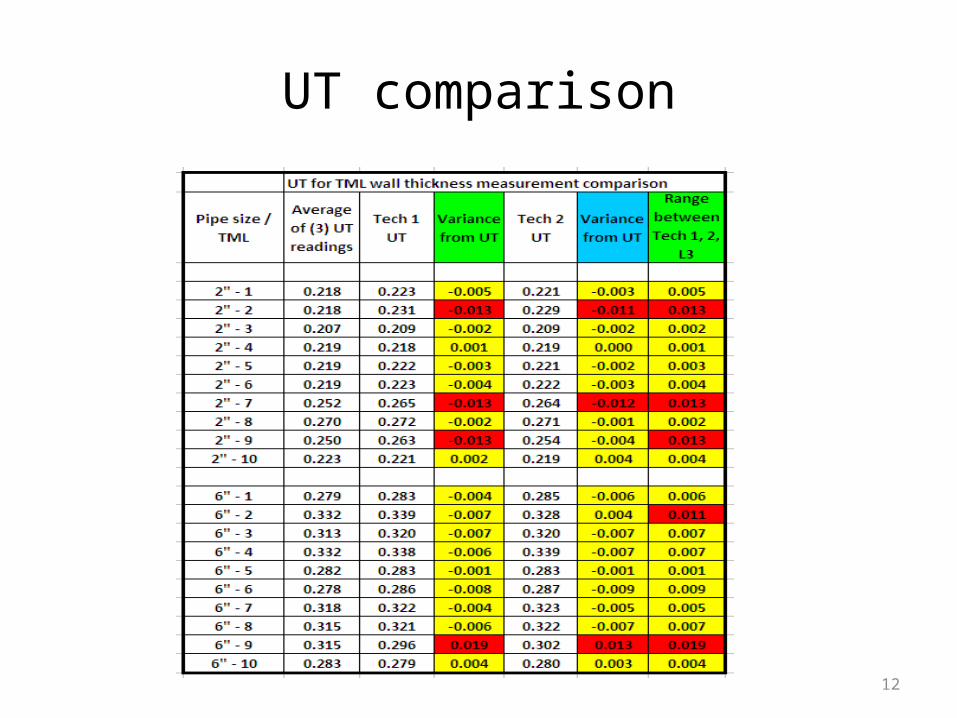
UT comparison
12
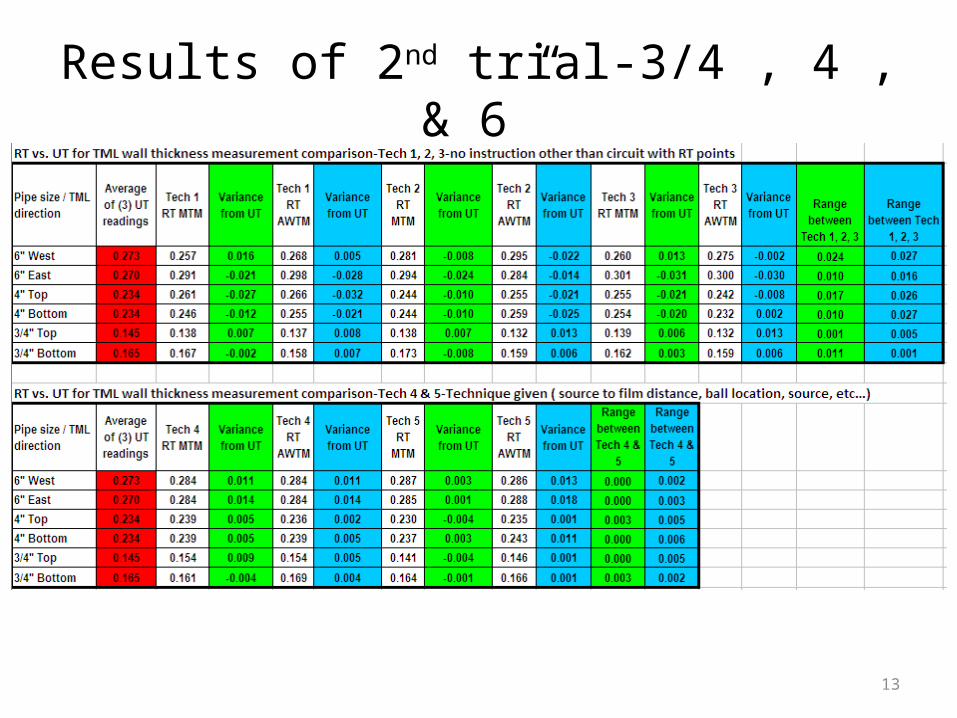
Results of 2nd trial-3/4”, 4”, & 6”
13
Summary of trials• The results from the 1st trial proved that the closer the Measuring Tool is to the
ball comparator, the more accurate the actual wall thickness reading with RT• In most instances in the 1st trial, the UT/RT readings were very similar with a
maximum isolated deviation of 0.027” which occurred on the 6” specimen at location 3
• In the 2nd trial, the results from the techs given a basic setup technique, the results had little variance from one tech to another, 0.006” in worst case
• If a consistent technique is used to collect data using profile radiography it can be used to determine corrosion rates with a high degree of confidence
14