Embed Size (px)
Citation preview

Use of Resources: assessment framework August 2017

Delivering better healthcare by inspiring
and supporting everyone we work with,
and challenging ourselves and others to
help improve outcomes for all.

1 | Contents
Contents
Introduction .................................................................................... 2
Use of Resources: the assessment ............................................... 4
Use of Resources: the evidence .................................................... 6
Ratings characteristics ................................................................. 12
Appendix A: Use of Resources metrics and rationale .................. 19

2 | Introduction
Introduction
1. As public-sector organisations, NHS trusts and NHS foundation trusts (here
together referred to as trusts) are expected to demonstrate to their patients,
communities and taxpayers that they are delivering value for money,
evidencing both efficiency and effectiveness. This is even more important in
times of fiscal constraint. NHS Improvement and the Care Quality Commission
(CQC) believe there is significant potential for more productive use of
resources across the NHS, which would improve quality of care for patients.
2. NHS Improvement’s Use of Resources assessments aim to help patients,
providers and regulators understand how effectively trusts are using their
resources to provide high quality, efficient and sustainable care in line with the
recommendations of Lord Carter’s review of Operational productivity and
performance in English NHS acute hospitals. They will do this by assessing
how financially sustainable trusts are, how well they are meeting financial
controls, and how efficiently they use their finances, workforce, estates and
facilities, data and procurement to deliver high quality care for patients.
Initially, our approach will focus on acute non-specialist services, due to the
availability and quality of data in this area. As we develop metrics for specialist
acute, ambulance, mental health and community services, we will include
them in this framework before introducing Use of Resources assessments to
providers of these services.
3. The principles that underpin the Use of Resources assessment are that it
should:
• lead to a focus on better quality, sustainable care and outcomes for patients
• be proportionate, minimising regulatory burden, and draw on existing data
collections where possible
• be clear to trusts what information we will look for and what ‘good’ looks like
– all data will be made available to all trusts through the Model Hospital1
• promote good practice to aid continuous innovation and improvement
1 https://model.nhs.uk/

3 | Introduction
• help us to identify trusts’ support needs through the Single Oversight
Framework, as well as being a useful improvement tool for organisations.
4. The framework mirrors the structure of the joint Well-Led framework and
CQC’s inspection approach, where key lines of enquiry (KLOEs), prompts and
metrics are used for a balanced assessment of a trust.
5. NHS Improvement will introduce Use of Resources assessments alongside
CQC’s new inspection approach from autumn 2017. In autumn 2017 CQC and
NHS Improvement will also consult on how Use of Resources ratings should
best be combined with other ratings to yield an overall trust-level rating, to be
introduced from 2018.

4 | Use of Resources: the assessment
Use of Resources: the assessment
6. Use of Resources assessments are based on a number of KLOEs, which are
the lens through which trust performance should be seen (see Figure 1). The
KLOEs correspond to the main areas of productivity – clinical services; people
(including doctors, nurses and allied health professionals – AHPs); clinical
support services (including pharmacy and pathology services); corporate
services, procurement, estates and facilities; and finance. Data relating to all
these areas can be found on the Model Hospital.
Figure 1: Overview of key lines of enquiry
Use of resources area Key lines of enquiry (KLOEs)
Clinical services How well is the trust using its resources to provide clinical services that operate as productively as possible and thereby maximise patient benefit?
People How effectively is the trust using its workforce to maximise patient benefit and provide high quality care?
Clinical support services How effectively is the trust using its clinical support services to deliver high quality, sustainable services for patients?
Corporate services, procurement, estates and facilities
How effectively is the trust managing its corporate services, procurement, estates and facilities to maximise productivity to the benefit of patients?
Finance
How effectively is the trust managing its financial resources to deliver high quality, sustainable services for patients?

5 | Use of Resources: the assessment
7. The starting point for Use of Resources assessments will be an analysis of
trust performance against a small number of initial metrics, local intelligence
gathered during NHS Improvement’s day-to-day interactions with the trust, as
well as any other relevant evidence, such as specific data and analysis drawn
from the work of the Operational Productivity directorate within NHS
Improvement and made available to trusts through the Model Hospital.
8. This analysis will be followed by a qualitative assessment carried out during a
one-day site visit to the trust and using the KLOEs and prompts to help probe
trust performance in a consistent and comparable manner. NHS
Improvement’s assessment team, made up of approximately five senior staff,
will obtain input from the leadership team with responsibility in the areas of
clinical and operational services, workforce and finances. We are likely to
meet the trust’s chair, chief executive officer, medical director, nursing
director, finance director, human resources director, chief operating officer,
head of procurement, head of estates and chief pharmacist.
9. All relevant evidence will be collated into a brief report and used to reach a
proposed rating of outstanding, good, requires improvement or inadequate in
accordance with CQC practice. NHS Improvement will use the Use of
Resources draft report and proposed rating to identify potential support needs
at trusts.
10. NHS Improvement will also submit the draft Use of Resources assessment
report and proposed rating to CQC, which will consider it as part of the
process of preparing and finalising its trust-level inspection reports. CQC will
consider NHS Improvement’s report and recommendations in determining the
trust’s final Use of Resource rating and will publish the final report and rating
alongside the trust-level inspection report and the current Quality rating.

6 | Use of Resources: the evidence
Use of Resources: the evidence 11. The Use of Resources assessment centres on delivery and performance at
trust level currently and looking back over the previous 12 months. We
recognise that trusts do not work in isolation and are working with, and
affected by, their local health and care economies. CQC will assess the way
trusts are working in their local systems through the updated Well-Led
framework.2 The Use of Resources assessment focuses on how effectively
trusts are using their resources in the context of the funds available to them.
12. NHS Improvement will draw on a wide range of evidence that will include a
basket of initial metrics, additional data or information collected by us and
shared by the trust, local intelligence from our day-to-day interactions with the
trust, and evidence gathered during a qualitative assessment (see Figure 2).
Figure 2: Evidence for Use of Resources assessments
Initial metrics • How is the trust performing on each initial metric?
• Is the trust an outlier on any of the initial metrics?
Additional evidence
• Is the trust an outlier on any of the wider set of metrics (eg Model
Hospital, Getting It Right First Time (GIRFT), data supplied by the
trust)?
• Is there any data or information, shared with us by the trust, which
is used internally to assess productivity?
Local intelligence
• Are there any areas of finance and productivity not covered by the
metrics where the trust’s performance is notable? Are there any
areas of unrealised efficiencies?
• What do we know about the trust’s performance more generally,
eg cost improvement programmes, private finance initiatives, local
health and care economy context?
Qualitative assessment
• Please see key lines of enquiry and prompts
2 https://improvement.nhs.uk/resources/well-led-framework/

7 | Use of Resources: the evidence
Initial metrics
13. The initial metrics are the starting point for the Use of Resources assessment
(see Figure 3). They include productivity metrics drawn from the work of the
Operational Productivity directorate in NHS Improvement and cover clinical
services; people (workforce); clinical support services; and corporate services,
procurement, estates and facilities. All such metrics are available to trusts
through the Model Hospital. The initial metrics under the finance KLOE
contain the Finance and Use of Resources theme metrics currently in NHS
Improvement’s Single Oversight Framework.
14. For all metrics we consider in assessing trusts’ use of resources, we will ask
the following general questions:
• How does performance compare with the national average and the trust’s
peer group?
• Has the measure improved or deteriorated in the last 12 months?
• Is there a reason or relevant context for the trust’s performance?
• Has the trust implemented any activities or interventions to improve
performance as appropriate in the given area? Have these been effective?
15. The metrics will be used as the basis for engagement with trusts to
understand the drivers for performance in these areas, and no single metric
(and indeed no single piece of evidence throughout the assessment) will
determine a trust’s Use of Resources rating. (See Appendix A for further
details about the rationale for inclusion of the initial metrics.)
16. All the initial metrics will be made available through the Model Hospital.
However, it is important to note that not all of the metrics available on the
Model Hospital are included in the initial metrics for this assessment. Other
metrics on the Model Hospital are intended to give a broader, more granular
view of productivity to support trusts to drive their own improvement, alongside
the assessment process. Where new robust, high quality metrics become
available, we will consider whether they provide broader insight into the
productivity of trusts and should become part of the initial metrics.
17. A number of metrics, including ‘cost per test’, have only been recently
developed and are currently being refined. This will be taken into

8 | Use of Resources: the evidence
consideration when performing the assessments. We are also working to
develop productivity metrics for specialist, mental health, community and
ambulance trusts. The Use of Resources assessment will be adapted and
introduced for non-acute trusts as and when these metrics are available.
Figure 3: KLOE themes and initial metrics
Use of resources area Initial metrics
Clinical services
Pre-procedure non-elective bed days Pre-procedure elective bed days Emergency readmissions (30 days) Did not attend (DNA) rate
People
Staff retention rate Sickness absence rate Pay cost per weighted activity unit (WAU) Doctors cost per WAU Nurses cost per WAU Allied health professionals cost per WAU (community adjusted)
Clinical support services
Top 10 medicines – percentage delivery of savings target Overall cost per test
Corporate services, procurement, estates and facilities
Non-pay cost per WAU Finance cost per £100 million turnover Human resources cost per £100 million turnover Procurement Process Efficiency and Price Performance Score Estates cost per square metre
Finance
Capital service capacity Liquidity (days) Income and expenditure margin Distance from financial plan Agency spend
Additional evidence and local intelligence
18. Additional evidence and local intelligence gathered during day-to-day
interactions with trusts will give NHS Improvement a broader and more
rounded view of trust performance, helping us understand the context in which
the trust operates. This may include any other relevant and useful data, such

9 | Use of Resources: the evidence
as information from the Getting It Right First Time (GIRFT) specialty
programmes or other data contained on the Model Hospital, such as
proportion of consultants with an active job plan, pharmacy staff cost per
WAU, medicines cost per WAU, percentage of transactions on e-catalogue,
and estates and facilities cost per WAU. It will help identify areas of good
performance, unrealised efficiencies and areas for improvement that may
have been missed by examining the initial metrics alone.
19. In a similar way to CQC’s inspection process and as part of CQC’s provider
information return, trusts will be asked to provide brief, high-level commentary
against each KLOE ahead of each assessment. Trusts will also be asked to
review NHS Improvement’s analysis of the initial metrics and share more
recent data that they think might be helpful to inform the assessment. NHS
Improvement will review all submissions to inform our understanding of the
trust’s performance and identify areas that would benefit from particular focus
at the on-site assessment. Some additional evidence may occasionally be
requested after the on-site assessment to support qualitative evidence
collected on the day.
Qualitative assessment
20. The aim of the prompts (see Figure 4) is to get a better understanding of trust
performance, contextual information and improvement action undertaken by
the trust. NHS Improvement will rely on these during the site visit, but will not
be bound by them. Assessment teams are likely to ask additional questions
and will not necessarily use all the prompts during the assessment.

10 | Use of Resources: the evidence
Figure 4: Prompts for key lines of enquiry
KLOE Prompts
Clinical services: How
well is the trust using
its resources to
provide clinical
services that operate
as productively as
possible and thereby
maximise patient
benefit?
How far are delayed transfers of care that are within the
trust’s control leading to a lack of bed capacity and/or
cancellations of elective operations?
Is the trust improving clinical productivity (elective and
non-elective) by doing what could reasonably be expected
of it in co-ordinating services across the local health and
care economy?
What percentage of elective and non-elective cases are
admitted on the day of surgery for each specialty?
Has the trust engaged with the GIRFT programme? What
improvements have been made as a result?
People: How
effectively is the trust
using its workforce to
maximise patient
benefit and provide
high quality care?
How is the trust tackling excessive pay bill growth, where
relevant?
Is the trust operating within the agency ceiling?
How well is the trust reducing its reliance on temporary
staff, in particular agency nurses and medical locums?
Are there significant gaps in current staff rotas? What has
the trust been doing to address these?
Is the trust making effective use of e-rostering or similar
job management software systems for doctors, nurses,
midwives, AHPs, healthcare assistants and other
clinicians? How many weeks in advance are the trust’s
rosters signed off?
Is there an appropriate skill mix for the work being carried
out (clinical and otherwise)?
Are new and innovative workforce models and/or new
roles being investigated? Is the trust making effective use
of AHPs to improve flow?
Is the trust an outlier in terms of sickness absence and/or
staff turnover?
What proportion of consultants has a current job plan?
How is job plan data captured?

11 | Use of Resources: the evidence
Clinical support
services: How
effectively is the trust
using its clinical
support services to
deliver high quality,
sustainable services
for patients?
Is the trust collaborating with other service providers to
deliver non-urgent pathology and imaging services?
Is the trust an outlier in terms of medicines spend?
Is the trust using technology in innovative ways to improve
operational productivity? For example, patients receive
telephone or virtual follow-up appointments after elective
treatment.
Corporate services,
procurement, estates
and facilities: How
effectively is the trust
managing its corporate
services, procurement,
estates and facilities to
maximise productivity
to the benefit of
patients?
What is the trust doing to consolidate its corporate service
functions? Which functions are being consolidated and
how?
Is the trust an outlier in terms of procurement costs?
Is the trust looking for and implementing appropriate
efficiencies in its procurement processes?
What is the value of the trust’s backlog maintenance (as
cost per square metre) and how effectively is it managed?
How efficiently is the trust using its estate and is it
maximising the opportunity to release value from NHS
estate that is no longer required to deliver health and care
services?
Finance: How
effectively is the trust
managing its financial
resources to deliver
high quality,
sustainable services
for patients?
Did the trust deliver, and is it on target to deliver, its
control total and annual financial plan for the previous and
current financial years respectively?
What is the trust’s underlying financial position?
How far does the trust rely on non-recurrent cost
improvement programmes (CIPs) to achieve financial
targets?
What is the trust’s track record of delivering CIP
schemes?
Is the trust able to adequately service its debt obligations?
Is the trust maintaining positive cash reserves?
Is the trust taking all appropriate opportunities to maximise
its income?
How does the trust use costing data across its service
lines?
To what extent does the trust rely on management
consultants or other external support services?

12 | Ratings characteristics
Ratings characteristics 21. The ratings characteristics (see below) describe what outstanding, good,
requires improvement and inadequate use of resources look like. This
framework, when applied using judgement and taking into account good
practice and recognised guidelines, will guide NHS Improvement and CQC
when assessing trusts’ use of resources and determining ratings.
22. The characteristics set out the kinds of factors that will be taken into account
in making the overall assessment. Ratings will reflect all the available
evidence and the specific circumstances of the trust. A trust will not have to
demonstrate all the attributes in a ratings characteristic to have it applied to
them nor will a characteristic be applied purely because the majority of the
attributes are considered to be present. Where a trust is in special measures
for financial reasons, the trust rating will be no better than ‘requires
improvement’.
Outstanding
The trust is achieving excellent use of resources, enabling it to provide high quality,
efficient and sustainable care for patients.
The trust takes a proactive, and often innovative, approach to managing its financial
and non-financial resources, which supports the delivery of high quality, sustainable
care and achieves excellent use of its resources.
There is a holistic approach to planning patient discharge, transfer or transition to
other services that are more appropriate for the delivery of care or rehabilitation, for
example a discharge to assess model, ensuring sufficient bed capacity and low
numbers of delayed transfers of care.
Clinical productivity improvements are achieved by, for instance, appropriately co-
ordinating services across the local health and care economy and in line with good
practice identified through the GIRFT programme.
The organisation actively involves patients in scheduling elective care, leading to
low DNA rates. Effective capacity and demand planning, and patient-centred care
pathways support low levels of emergency readmissions and pre-procedure non-
13 | Ratings characteristics
elective and elective bed days.
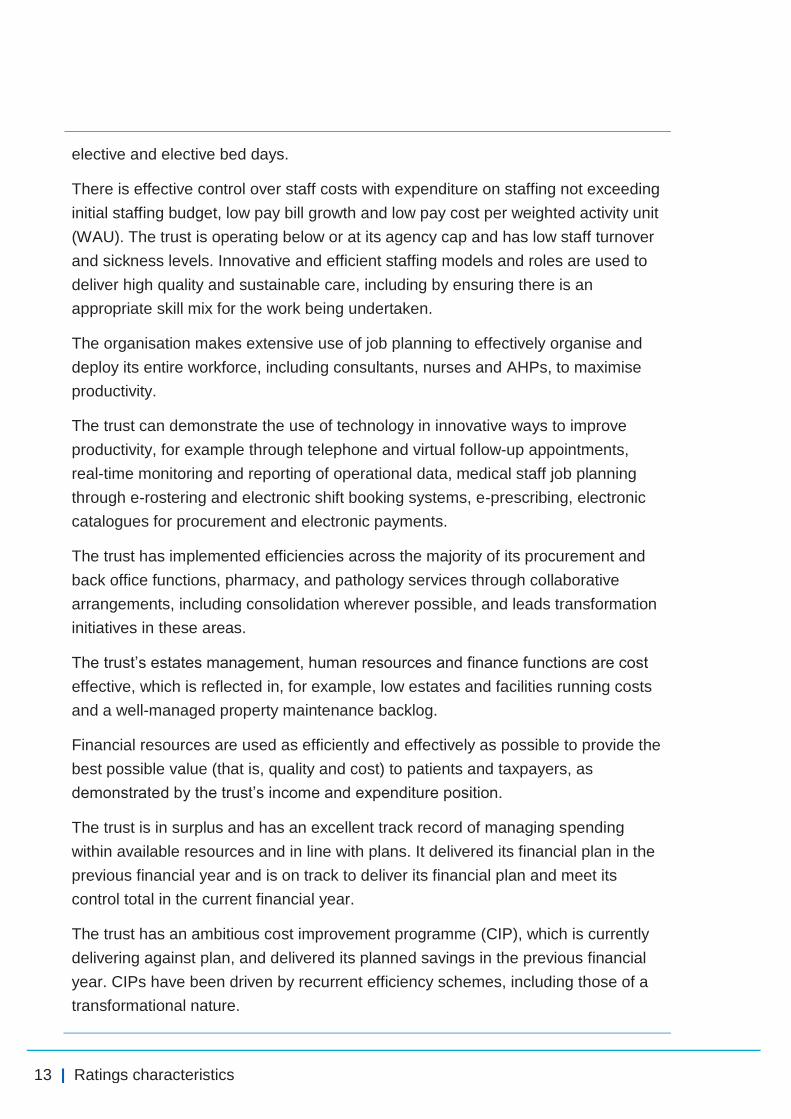
There is effective control over staff costs with expenditure on staffing not exceeding
initial staffing budget, low pay bill growth and low pay cost per weighted activity unit
(WAU). The trust is operating below or at its agency cap and has low staff turnover
and sickness levels. Innovative and efficient staffing models and roles are used to
deliver high quality and sustainable care, including by ensuring there is an
appropriate skill mix for the work being undertaken.
The organisation makes extensive use of job planning to effectively organise and
deploy its entire workforce, including consultants, nurses and AHPs, to maximise
productivity.
The trust can demonstrate the use of technology in innovative ways to improve
productivity, for example through telephone and virtual follow-up appointments,
real-time monitoring and reporting of operational data, medical staff job planning
through e-rostering and electronic shift booking systems, e-prescribing, electronic
catalogues for procurement and electronic payments.
The trust has implemented efficiencies across the majority of its procurement and
back office functions, pharmacy, and pathology services through collaborative
arrangements, including consolidation wherever possible, and leads transformation
initiatives in these areas.
The trust’s estates management, human resources and finance functions are cost
effective, which is reflected in, for example, low estates and facilities running costs
and a well-managed property maintenance backlog.
Financial resources are used as efficiently and effectively as possible to provide the
best possible value (that is, quality and cost) to patients and taxpayers, as
demonstrated by the trust’s income and expenditure position.
The trust is in surplus and has an excellent track record of managing spending
within available resources and in line with plans. It delivered its financial plan in the
previous financial year and is on track to deliver its financial plan and meet its
control total in the current financial year.
The trust has an ambitious cost improvement programme (CIP), which is currently
delivering against plan, and delivered its planned savings in the previous financial
year. CIPs have been driven by recurrent efficiency schemes, including those of a
transformational nature.

14 | Ratings characteristics
The trust is able to meet its financial obligations and pay its staff and suppliers in
the immediate term, as demonstrated by its capital service and liquidity metrics.
The trust is maintaining positive cash balances without the need for interim support3
in the last 12 months.
Good
The trust is achieving good use of resources, enabling it to provide high quality and
sustainable care for patients.
The trust is actively managing resources to meet its financial obligations on a
sustainable basis to deliver high quality care and good use of resources. There is
evidence of a systematic approach to identifying and realising efficiency opportunities.
There is a holistic approach to planning patient discharge, transfer or transition to
other services that are more appropriate for the delivery of their care or
rehabilitation, ensuring sufficient bed capacity and low numbers of delayed
transfers of care.
Some clinical productivity improvements have been achieved by, for instance,
engaging with good practice identified by the GIRFT programme.
There is some evidence of effective communication with patients in respect of
scheduling care, which is manifested in the trust’s DNA rates. There is evidence of
pathway development and/or capacity planning at service-line level leading to
reduced emergency readmission rates and pre-procedure non-elective and elective
bed days.
Staff costs are generally well controlled, demonstrated by expenditure on staffing
not exceeding initial staffing budget and by the trust’s pay bill growth, pay cost per
WAU and staff turnover and sickness levels. The trust is operating at or around its
agency cap. There are some examples of staffing innovation replacing traditional
models of care delivery (for example, use of nursing associates).
The organisation makes good use of job planning to organise and deploy much of
3 As defined in Secretary of State’s Guidance under section 42A of the National Health Service Act
2006.
15 | Ratings characteristics
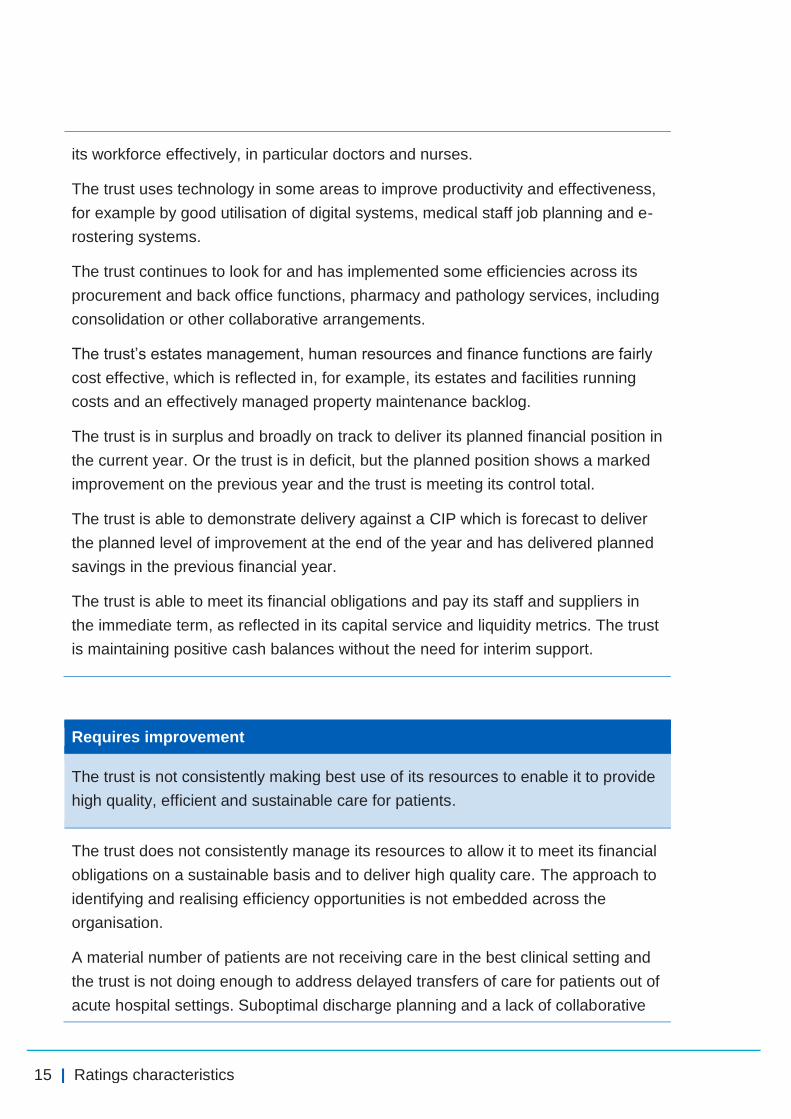
its workforce effectively, in particular doctors and nurses.
The trust uses technology in some areas to improve productivity and effectiveness,
for example by good utilisation of digital systems, medical staff job planning and e-
rostering systems.
The trust continues to look for and has implemented some efficiencies across its
procurement and back office functions, pharmacy and pathology services, including
consolidation or other collaborative arrangements.
The trust’s estates management, human resources and finance functions are fairly
cost effective, which is reflected in, for example, its estates and facilities running
costs and an effectively managed property maintenance backlog.
The trust is in surplus and broadly on track to deliver its planned financial position in
the current year. Or the trust is in deficit, but the planned position shows a marked
improvement on the previous year and the trust is meeting its control total.
The trust is able to demonstrate delivery against a CIP which is forecast to deliver
the planned level of improvement at the end of the year and has delivered planned
savings in the previous financial year.
The trust is able to meet its financial obligations and pay its staff and suppliers in
the immediate term, as reflected in its capital service and liquidity metrics. The trust
is maintaining positive cash balances without the need for interim support.
Requires improvement
The trust is not consistently making best use of its resources to enable it to provide
high quality, efficient and sustainable care for patients.
The trust does not consistently manage its resources to allow it to meet its financial
obligations on a sustainable basis and to deliver high quality care. The approach to
identifying and realising efficiency opportunities is not embedded across the
organisation.
A material number of patients are not receiving care in the best clinical setting and
the trust is not doing enough to address delayed transfers of care for patients out of
acute hospital settings. Suboptimal discharge planning and a lack of collaborative

16 | Ratings characteristics
working are resulting in relatively high rates of emergency readmissions.
Some clinical improvements have been made; however, these have been
inconsistently implemented and have not sufficiently taken into account the
sustainability of the trust’s service lines.
Staff costs are not effectively controlled within budget, as evidenced by the trust’s
pay bill growth, pay cost per WAU, distance from the trust’s agency cap, and staff
turnover and sickness levels. The trust consistently struggles to fill gaps in rotas,
and has not maximised the benefits of innovative workforce models and new roles
(for example, use of nursing associates).
The trust’s use of technology to improve productivity is elementary, for example
failing to maximise the benefits of job planning, e-rostering systems or basic
electronic catalogues for procurement.
The trust is still at early stages of considering the implementation of efficiencies
across its procurement and back office functions, pharmacy and pathology
services, including through consolidation or other collaborative arrangements.
The trust’s estates management, human resources and finance functions could be
more cost effective, which is reflected, for example, in its estates and facilities
running costs and inconsistent management of its property maintenance backlog.
The trust is in deficit and is delivering a financial plan that does not improve on the
previous year’s position or meet its control total.
The trust did not realise its cost improvement programme for the previous financial
year. Its current cost improvement programme is behind plan, and there is
significant risk it will not be achieved by the end of the year.
The trust is not able to consistently meet its financial obligations or pay its staff and
suppliers in the immediate term, as demonstrated by its capital service and liquidity
metrics. The trust is unable to maintain positive cash balances without the need for
interim support or is expecting to require this support in its current plans.

17 | Ratings characteristics
Inadequate
The trust is not making adequate use of its resources, putting at risk its ability to
provide high quality, efficient and sustainable care for patients.
The trust is not managing its resources in a way that supports the delivery of high
quality care or demonstrates adequate use of resources is being achieved. There
are significant and wide-ranging unmet efficiency opportunities.
The trust is unable to control its staff costs, including, for instance, unwarranted pay
bill growth that is significantly higher than comparable peers, high pay cost per
WAU, and agency costs that are more than 50% above the trust’s agency cap. The
trust’s workforce is not being used effectively, demonstrated by substantial or
frequent staff shortages, high turnover and staff sickness rates and ineffective job
planning.
The trust’s estates management, human resources and finance functions are
inefficient, demonstrated by, for example, high estates and facilities running costs.
There is no effective programme in place to repair and maintain the trust’s estate.
The trust is not utilising its existing digital systems effectively and is doing little to
use technology to improve efficiency; for example, there is no use of basic
electronic catalogues for procurement and no payments are made electronically.
The trust has undertaken little or no work to implement efficiencies across its
procurement and back office functions, pharmacy and pathology services, including
through consolidation or other collaborative arrangements.
Plans for patient discharge or transfers are incomplete or significantly delayed, and
as such patients are not moved into settings that are more appropriate for the
delivery of their care or rehabilitation, or are not being cared for in the best clinical
setting. Poor discharge planning and a lack of collaborative working are resulting in
unacceptably high rates of emergency readmissions.
Few clinical improvements have been made, often implemented inconsistently and
having little or no impact on the sustainability of the trust’s service lines.
The trust is in deficit and its financial plan does not improve on the previous year’s
position or meet its control total. Or the trust is in deficit and off track to deliver its
financial plan and is not expecting to recover within the financial year.

18 | Ratings characteristics
The trust’s CIP is materially behind plan and it is not able to recover the position.
The trust is not able to meet its financial obligations or pay its staff and suppliers in
the immediate term, as demonstrated by its capital service and liquidity metrics.
The trust is unable to maintain positive cash balances without the need for interim
support.

19 | Appendix A: Use of Resources metrics and rationale
Appendix A: Use of Resources metrics and rationale
Area Initial metrics Rationale
Clinical services
Pre-procedure non-elective bed days
This metric looks at the length of stay between admission and an emergency procedure being carried out – the aim being to minimise it – and the associated financial productivity opportunity of reducing this. Better performers will have a lower number of bed days.
Pre-procedure elective bed days
This metric looks at the length of stay between admission and an elective procedure being carried out – the aim being to minimise it – and the associated financial productivity opportunity of reducing this. Better performers will have a lower number of bed days.
Emergency readmissions
This metric looks at the number of emergency readmissions within 30 days of the original procedure/stay, and the associated financial opportunity of reducing this number. Better performers will have a lower rate of readmission.
Did not attend (DNA) rate
A high level of DNAs indicates a system that might be making unnecessary appointments or failing to communicate clearly with patients. It also might mean the hospital has made appointments at inappropriate times, eg school closing hour. Patients might not be clear how to rearrange an appointment. Lowering this rate would help the trust save costs on unconfirmed appointments and increase system efficiency.
People Staff retention rate This metric considers the stability of the workforce. Some turnover in an organisation is acceptable and healthy, but a high level can have a negative impact on organisational performance (eg through loss of capacity, skills and knowledge). In most circumstances organisations should seek to reduce the percentage of leavers over time.
Sickness absence High levels of sickness absence can have a negative impact on organisational performance and productivity. Organisations should aim to reduce the number of days lost through sickness absence over time.

20 | Appendix A: Use of Resources metrics and rationale
Pay cost per weighted activity unit (WAU, a unit of clinical output)
This metric shows the staff element of trust cost to produce one WAU across all areas of clinical activity. A lower than average figure is preferable as it suggests the trust spends less on staff per standardised unit of activity than other trusts. This allows trusts to investigate why their pay is higher or lower than national peers.
Doctors cost per WAU
This is a doctor-specific version of the above pay cost per WAU metric. This allows trusts to query why their doctor pay is higher or lower than national peers. Consideration should be given to clinical staff mix and clinical staff skill mix when using this metric.
Nurses cost per WAU
This is a nurse-specific version of the above pay cost per WAU metric. This allows trusts to query why their nurse pay is higher or lower than national peers. Consideration should be given to clinical staff mix and clinical staff skill mix when using this metric.
AHP cost per WAU This is an AHP-specific version of the above pay cost per WAU metric. This allows trusts to query why their AHP pay is higher or lower than national peers. Consideration should be given to clinical staff mix and clinical staff skill mix when using this metric.
Clinical support services
Overall cost per test The cost per test is the average cost of undertaking one pathology test across all disciplines, taking into account all pay and non-pay cost items. A low value is preferable to a high value but the mix of tests across disciplines and the specialist nature of work undertaken should be considered. This should be done by selecting the appropriate peer group (‘Pathology’) on the Model Hospital. Other metrics to consider are discipline level cost per test.
Top 10 medicines As part of the top 10 medicines project, trusts are set trust-specific monthly savings targets related to their choice of medicines. This includes the uptake of biosimilar medicines (complex medicines that are clinically comparable to the branded product), the use of new generic medicines and choice of product for clinical reasons. These metrics report trusts’ % achievement against these targets. Trusts can assess their success in pursuing these savings (relative to national peers).
Corporate services, procurement, estates and facilities
Non-pay cost per WAU
This metric shows the non-staff element of trust cost to produce one WAU across all areas of clinical activity. A lower than average figure is preferable as it suggests the trust spends less per standardised unit of activity than other trusts. This allows trusts to investigate why their non-pay spend is higher or lower than national peers.
21 | Appendix A: Use of Resources metrics and rationale
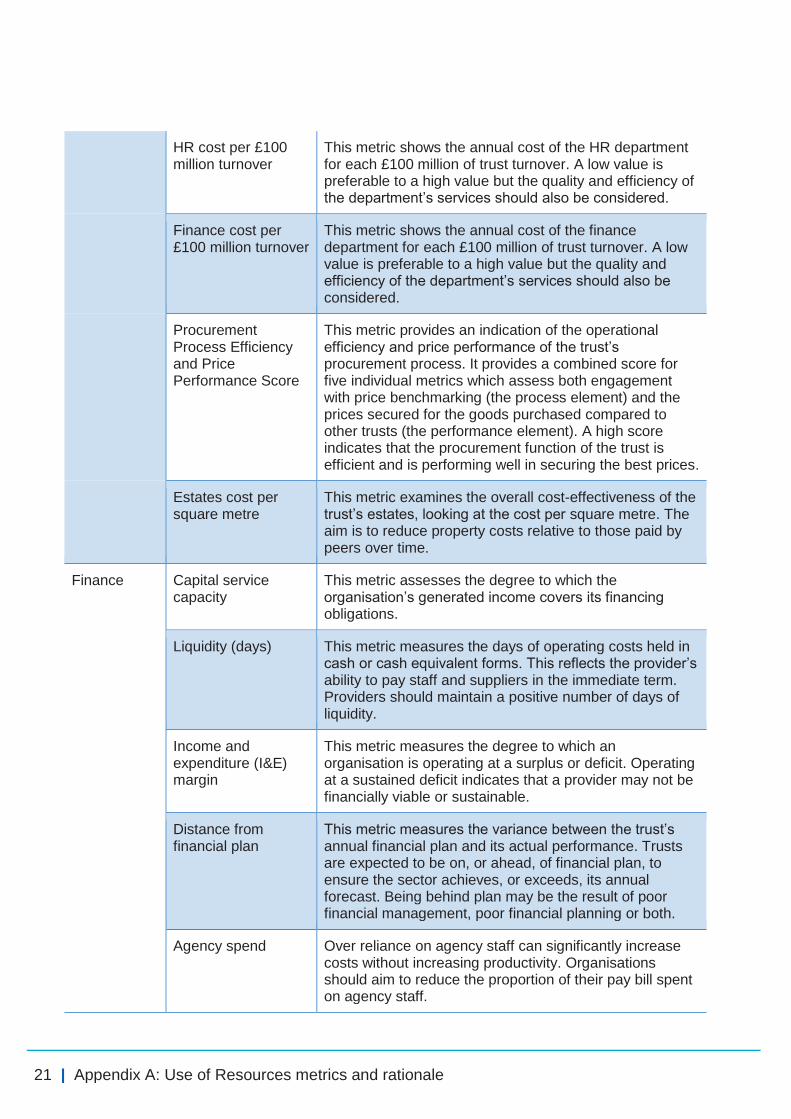
HR cost per £100 million turnover
This metric shows the annual cost of the HR department for each £100 million of trust turnover. A low value is preferable to a high value but the quality and efficiency of the department’s services should also be considered.
Finance cost per £100 million turnover
This metric shows the annual cost of the finance department for each £100 million of trust turnover. A low value is preferable to a high value but the quality and efficiency of the department’s services should also be considered.
Procurement Process Efficiency and Price Performance Score
This metric provides an indication of the operational efficiency and price performance of the trust’s procurement process. It provides a combined score for five individual metrics which assess both engagement with price benchmarking (the process element) and the prices secured for the goods purchased compared to other trusts (the performance element). A high score indicates that the procurement function of the trust is efficient and is performing well in securing the best prices.
Estates cost per square metre
This metric examines the overall cost-effectiveness of the trust’s estates, looking at the cost per square metre. The aim is to reduce property costs relative to those paid by peers over time.
Finance Capital service capacity
This metric assesses the degree to which the organisation’s generated income covers its financing obligations.
Liquidity (days) This metric measures the days of operating costs held in cash or cash equivalent forms. This reflects the provider’s ability to pay staff and suppliers in the immediate term. Providers should maintain a positive number of days of liquidity.
Income and expenditure (I&E) margin
This metric measures the degree to which an organisation is operating at a surplus or deficit. Operating at a sustained deficit indicates that a provider may not be financially viable or sustainable.
Distance from financial plan
This metric measures the variance between the trust’s annual financial plan and its actual performance. Trusts are expected to be on, or ahead, of financial plan, to ensure the sector achieves, or exceeds, its annual forecast. Being behind plan may be the result of poor financial management, poor financial planning or both.
Agency spend Over reliance on agency staff can significantly increase costs without increasing productivity. Organisations should aim to reduce the proportion of their pay bill spent on agency staff.

© NHS Improvement 2017 Publication code: P 04/17
Contact us:
NHS Improvement
Wellington House
133-155 Waterloo Road
London
SE1 8UG
0300 123 2257
improvement.nhs.uk
Follow us on Twitter @NHSImprovement
This publication can be made available in a number of other formats on request.